Abstract
The proliferation of Internet of Things (IoT) devices has become inevitable in contemporary life, significantly affecting myriad applications. Nevertheless, the pervasive use of heterogeneous IoT gadgets introduces vulnerabilities to malicious cyber-attacks, resulting in data breaches that jeopardize the network’s integrity and resilience. This study proposes an Intrusion Detection System (IDS) for IoT environments that leverages Transfer Learning (TL) and the Convolutional Block Attention Module (CBAM). We extensively evaluate four prominent pre-trained models, each integrated with an independent CBAM at the uppermost layer. Our methodology is validated using the BoT-IoT dataset, which undergoes preprocessing to rectify the imbalanced data distribution, eliminate redundancy, and reduce dimensionality. Subsequently, the tabular dataset is transformed into RGB images to enhance the interpretation of complex patterns. Our evaluation results demonstrate that integrating TL models with the CBAM significantly improves classification accuracy and reduces false-positive rates. Additionally, to further enhance the system performance, we employ an Ensemble Learning (EL) technique to aggregate predictions from the two best-performing models. The final findings prove that our TL-CBAM-EL model achieves superior performance, attaining an accuracy of 99.93% as well as high recall, precision, and F1-score. Henceforth, the proposed IDS is a robust and efficient solution for securing IoT networks.
1. Introduction
The Internet of Things (IoT) has recently become indispensable to our daily lives. IoT wireless devices are embedded in extensive domains, such as intelligent residences, healthcare, agriculture, transportation, and manufacturing. The IoT market was estimated globally at USD 544.38 billion in 2022 and is anticipated to rise from USD 662.21 billion in 2023 to USD 3352.97 billion by 2030 [1]. This expanding technology has profoundly affected numerous applications and businesses. However, low-power and heterogeneous IoT devices form a breeding environment for network intrusions, resulting in a plethora of security attacks that threaten the credibility and continuity of the entire network. Consequently, Intrusion Detection Systems (IDS) have attracted the focus of several scientists as countermeasures against security penetrations. This defense system audits network traffic and generates an alarm when suspicious behavior is detected. This security approach is important for boosting the continuity of IoT applications in an extensive range of domains. IoT networks differ from traditional networks because they include heterogeneous devices with diverse operating systems and infrastructure, which add complexity to the applied security schema [2,3]. Moreover, the network topology changes frequently, which requires a dynamic configuration [2] and increases the threat of unknown attacks for newly introduced devices. Furthermore, IoT networks are large-scale networks in which devices are embedded in open vicinities and transfer a sheer amount of data, making them vulnerable to different attacks [3]. Consequently, numerous studies have started deploying Machine Learning (ML) and Deep Learning (DL) techniques to conquer IoT barriers and strengthen the performance of IDSs in IoT networks [4,5]. The Intelligence of these techniques and their learning potential are used to analyze the system and distinguish any suspicious behavior. Nonetheless, both ML and DL approaches assume similar data distributions for labeled and unlabeled data [6]. In addition, the training process is time-consuming, which limits the use of real-time applications. Therefore, to improve ML and DL techniques, scientists have proposed Transfer Learning (TL). TL uses information developed from previous training to perform a specific task. It takes advantage of earlier knowledge to avoid the scarcity of substantial training data and to reduce the long training and computation time required by ML and DL techniques, making it practical for real-time or time-sensitive applications.
Nevertheless, most TL models are based on Convolutional Neural Networks (CNN) that are trained using massive amounts of data. CNNs have been effective in an assortment of applications, such as image classification, Natural Language Processing (NLP), detection of traffic signals, and self-driving vehicles [4]. Despite its remarkable results, the CNN architecture performs better when crucial data information is encoded within patterns, such as in voice applications and imaging [7]. Thus, to make the best out of CNNs, we convert our tabular data into images. Transforming tabular data into images allows the representation of features through spatially coherent pixels, making it possible to use the powerful feature extraction capabilities of CNNs. This approach allows the network to deduce useful patterns from pixel values. Furthermore, image-based representations provide better interpretability, allowing researchers to visually analyze the representations and comprehend the underlying relationships between data. Several studies have demonstrated the efficacy of this approach. For instance, the DeepInsight method has shown enhanced performance by converting diverse types of data, including gene expression and text, into images to leverage the CNNs’ feature extraction capabilities [8]. Similarly, the IGTD algorithm [7] and the REFINED approach [9] have successfully applied image-based representations for drug response prediction and feature visualization. Moreover, algorithms for converting tabular data into images are flexible and scalable, requiring minimal prior knowledge of features, thus making them applicable across various datasets and applications. This versatile approach shows the potential for enhancing the performance and generalization of CNN models across different tabular datasets, which are widely used in diverse fields. Additionally, converting the dataset into images benefits from the power of transfer learning by utilizing powerful pre-trained models.
This study presents a TL-based IDS for IoT environments. We explore four prevalent deep transfer learning models: Visual Geometry Group (VGG) [10], Residual Network (ResNet) [11], MobileNet [12], and EfficientNet [13]. Each of these models represents a state-of-the-art technique in deep learning, which provides a thorough comparison of pre-trained leading-edge technologies. Moreover, these models have proven their effectiveness in image classification tasks, providing a reliable foundation for our study. In our approach, we integrate a standalone Convolutional Block Attention Module (CBAM) with each model. CBAM is a neural network module that enhances feature representations by applying sequential channel attention and spatial attention [14]. It enables models to focus on the most relevant parts of the input data, improving the performance on various vision tasks. This integration leads to the creation of eight distinct models for evaluation. Finally, we aggregate the predictions of the two best models using an average ensemble strategy for more accurate final predictions. We train the models and validate them using the Bot-IoT network dataset [15]. This dataset combines four diverse attacks: Denial of Service (DoS), Distributed Denial of Service (DDoS), Reconnaissance, and Theft attacks. The foremost contributions of this study are as follows:
- Introducing a novel use of the CBAM as a standalone top layer block. This innovative approach emphasizes the extraction of discriminative features and informative regions within both the spatial and channel domains of the generated images. This approach strengthens the performance of the models without adding computational complexity or compromising the generalization of the system.
- Leveraging the knowledge of pre-trained models to overcome the long training time and provide a robust foundation for IoT attack classification with minimal labeled data.
- Transforming the dataset into RGB images to facilitate the visualization of tabular data, improve data interpretation, and empower the extraction of meaningful patterns from complex feature relationships.
- Aggregating the predictions of diverse individual models through Ensemble Learning (EL) to enhance the results and increase the robustness of the intrusion detection system.
- Proposing a new methodology that explores four widely used, state-of-the-art models. Our study can be effectively used in image classification tasks across various domains with diverse data types, offering a versatile approach for future applications and research.
Following the introduction, the structure of this paper is as follows: Section 2 overviews the background and related studies in the field of IoT IDSs. Section 3 introduces the proposed methodology, along with TL, CBAM, and EL practices. Section 4 presents the experimental results. We discuss the results in Section 5. Finally, Section 6 presents the conclusions of the study.
2. Background and Related Work
With the accelerated reliance on IoT networks worldwide, the massive amount of data they generate demands robust security systems to counter increasing network attacks. Intelligent-based IDSs utilize ML and DL algorithms to recognize unusual patterns within the network traffic and detect any illegal intrusions. Moreover, deep transfer learning enhances the performance of DL and ML learning models by reusing the existing information from previously trained models. This section outlines the main concepts of our system and reviews previously proposed work that adopted ML, DL, TL, and EL approaches for IoT intrusion detection.
2.1. ML-BASED and DL-BASED IDSs for IoT
ML and DL algorithms offer significant advantages in intrusion detection in IoT systems. These techniques excel at processing and analyzing large volumes of data and identifying patterns that are crucial for detecting potential security breaches or intrusion attempts [4]. This subsection overviews the previously proposed ML-based and DL-based IDSs for IoT environments.
Alkadi et al. [16] presented a Collaborative IDS (CIDS) that adopts Bidirectional Long Short-Term Memory (BiLSTM) with Recurrent Neural Network (RNN) techniques to detect attacks in IoT environments. The model relied on blockchain technology to record information and ensure secure data transmission between the detection system and the cloud or IoT infrastructure. The authors assessed their model using the UNSW-NB15 and BoT-IoT datasets. They used different numbers of hidden layers, resulting in an accuracy that ranged from 97.26% to 99.41% and 96.71% to 98.91% for the UNSW-NB15 and the BoT-IoT datasets, respectively.
Ullah et al. [17] used CNNs to design multi-dimensional models for IoT Intrusion classification. The authors used raw network data from four intrusion datasets: BoT-IoT, MQTT-IoT-IDS2020, IoT Network Intrusion, and IoT-23. They extracted the features from the Packet CAPture (PCAP) data using the open-source CICFlowmeter, selected the most significant features using the Recursive Feature Elimination (RFE) technique, and then converted the dataset into images. The model outperformed earlier models, achieving minimum detection rates of 99.74%, 99.42%, and 99.03% for the CNN1D, CNN2D, and CNN3D models, respectively. For multiclass classification in the BoT-IoT, the accuracy percentage was 99.97% for CNN1D, 99.95% for CNN2D, and 99.94% for CNN3D, with a maximum precision and F1-score of 99.96%.
Yang et al. [18] proposed an approach for distinguishing malicious traffic using a self-supervised Contrastive Learning (CL) approach. They preprocessed the raw data of the BoT-IoT dataset and transformed the unlabeled data into vector traffic data. Their model used a self-attention mechanism and a GELU-LSTM module to learn information and extract features of malicious data. The experimental work resulted in 99.48% accuracy and 99.46% F1-Score.
Awajan [19] presented a fully connected four-layer network architecture for malicious detection in IoT environments. The communication protocol-independent model achieved high precision in sinkhole attacks, with an average accuracy of 93.74%, precision of 93.172%, recall of 93.824%, and an F1-score of 93.472%. However, the authors trained and evaluated the models using an experimental dataset without using a benchmark dataset. Moreover, each new deployment of the IDS required retraining with a dataset exclusive to that specific system.
He et al. [20] introduced a lightweight IDS based on feature grouping for securing IoT. Their optimized model used ML and DL for attack detection. Their method involved designing semantic-based features, implementing a fast protocol parsing method, and proposing session merging and feature grouping. Their IDS achieved a classification accuracy of 99% on three public IoT datasets: MedBIoT, MQTT-IoT-IDS2020, and BoT-IoT. Their model was suitable for constrained-processing IoT devices; however, further training for each attack was required.
2.2. TL-BASED IDS for IoT
Bozinovski et al. [21] first outlined the notion of transfer learning in 1976. According to Pan and Yang [22], TL is declared as: “Given a source domain DS and learning task TS, a target domain DT and learning task TT, transfer learning aims to help improve the learning of the target predictive function ƒT(·) in DT using the knowledge in DS and TS, where DS ≠ DT, or TS ≠ TT”. In transfer learning, the system uses the knowledge gained to overcome the shortness of substantial data and reduce computation and training time. Moreover, we can use pre-trained models with optimized weights, reducing training costs compared to traditional learning, which randomizes and adjusts weights during training. This subsection briefly introduces earlier studies that adopted TL for IoT intrusion detection.
Vu et al. [23] proposed a deep TL model that comprised two encoders; one applied a supervised learning algorithm using the source data, whereas the other used unlabeled target data in its training. The results stated that their approach enhanced the Area Under the Curve (AUC) score for attack detection. However, training the model was expensive, which made it challenging for time-sensitive applications.
Hussain et al. [24] developed a ResNet18 model IDS. They preprocessed the CICDDoS2019 dataset, resulting in 60 features, which were then converted into images. In binary classification, their model scored an accuracy of 99.9% and 87% precision in detecting 11 forms of DoS and DDoS, respectively. Despite using data visualization and the TL approach, the model provided a low accuracy for multiclass classification.
Fan et al. [25] combined federated and transfer learning in 5G IoT networks. They allowed secure data aggregation through federated learning and detected intrusions via a CNN-based TL model. Their experimental work showed an average accuracy of 91.93%.
Guan et al. [26] presented another TL model for intrusion detection. The authors trained the model by transferring weights and fine-tuning the neural network. They used LeNeT, EfficientNet, and Big Transfer (BiT) on the USTC-TFC2016 dataset. The experiments showed traffic classification accuracies of 95.47%, 96.22%, and 96.40% for LeNet-5, BiT, and EfficientNetB0, respectively.
Ge et al. [27] adopted TL for multi-category classification in IoT networks. They employed the original raw data of the BoT-IoT dataset and then extracted information with the Tshark network analyzer. They employed Feed Forward Neural Network (FNN) for both binary classification (bFNN) and multiclass classification (mFNN). Their optimized and fine-tuned model delivered accuracies of 99.99% in binary classification and 99.79% in multi-classification.
Ullah et al. [17] also proposed an IDS based on TL, which reduced the model’s complexity. However, the accuracies of their experimental work degraded to 99.3%, 98.6%, and 98.13% for the 1D, 2D, and 3D CNNs, respectively. The limitation of this study was the high False Negative Rate (FNR) in the results.
2.3. EL-Based IDS for IoT
Ensemble learning aims to improve the classification and prediction accuracies and minimize the potential errors or biases of a single model by combining predictions from various models. The integration of multiple models’ predictions has made ensemble learning a powerful tool for forecasting in various fields and has provided more robust predictions [28]. Recent studies in the field of intrusion detection have proven that the EL-based model, which incorporates multiple algorithms, outperforms a single learning algorithm. Recent models of EL-based IDS are presented below.
Thakkar et al. [29] used EL to overcome the problem of imbalanced data. For ensemble learning, the authors used a DNN as the base learner for the bagging estimator. The experiments demonstrated an enhancement in the evaluation metrics, and they achieved an accuracy of 98.99% when using the BoT-IoT dataset.
Awotunde et al. [30] proposed different ensemble approaches for intrusion detection in Industrial IoT (IIoT). They used Extra Trees, Adaboost, Bagging, RF, and XGBoost (XGB) algorithms, with the latter providing superior performance in both binary and multiclass classification. The authors used the Chi-Square statistical method to extract features from the Telemetry data of the TON_IoT dataset. For the binary classification, the accuracy rate of XGBoost was 100%, with an average precision, recall, and F1-score of 98%. Adaboost scored the lowest, with an average score of less than 70% across all metrics. Despite the satisfactory results in binary classification, the results showed a high FPR in multiclass classifications, as well as skewed results owing to the imbalanced dataset.
Alotaibi et al. [31] employed voting and stacking ensemble learning approaches to enhance the IoT security system. They used RF, DT, Logistic Regression (LR), and K-Nearest Neighbor (KNN). They trained the models using the TON-IoT network traffic datasets. The experimental results proved that the ensemble classifiers surpassed the individual models, achieving an accuracy of 98.63%.
Previous studies are encapsulated in Table 1, and for studies with more than a single dataset, we only include the BoT-IoT in the table. Although the reviewed studies provide high accuracies, there is still significant potential for improved performance. The imbalanced datasets are also considered a barrier that needs to be addressed, requiring convenient data preprocessing. Moreover, in the context of zero-day attacks, false positives remain a problematic challenge because IDSs may generate a high number of false alarms, leading to unnecessary disruptions and wasting resources. Therefore, despite the significant progress in recent studies, it is vital to continue creating innovative and efficient IDSs.

Table 1.
Summary of related work.
3. Proposed Methodology
This section discusses the proposed IDS and provides an overview of the implemented techniques and approaches.
3.1. System Architecture
This paper presents an image-based transfer learning IDS. It aims to detect four types of attacks: DoS, DDoS, Reconnaissance, and Theft. The proposed experimental system exploits transfer learning models to obtain accurate results while decreasing the false positive rate. Figure 1 illustrates the proposed IDS model framework used in our experiments. In IoT, training involves developing machine learning models using collected data to recognize patterns and make predictions, often conducted on high-specification devices or data centers before deployment. This approach helps mitigate the challenges of computational cost and facilitates the deployment of the models. Inference is the real-time application of these trained models on IoT devices to analyze new data and generate actionable insights. The system initiates its operation by preprocessing the BoT-IoT dataset. Then, it transforms the compact tabular data into RGB images and splits them into 80% for training, while 20% is equally subdivided for testing and validation processes. The validation subset is used to ensure that no over-fitting occurs. The next stage is the training stage, in which we train our models using the generated training images. The primary goal of using pre-trained models is to reuse the acquired knowledge and weights from previous training; thus, the layers of these models are all frozen. We add trainable top layers to manage the classification of the new data. Moreover, we integrate an attention module into the models. This human-inspired mechanism works by exclusively emphasizing the key input elements, thus improving the prediction accuracy and computational efficiency of intelligent models. In the last stage, we select the two best models to generate the base estimators of an ensemble learning approach that delivers enhanced classification results.
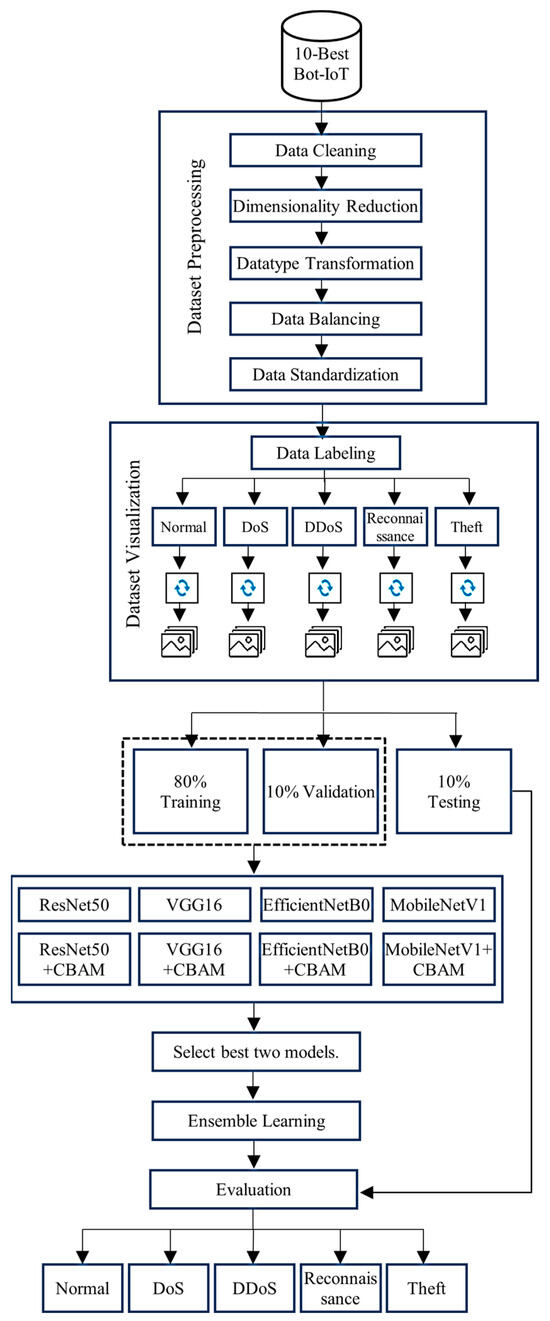
Figure 1.
The proposed IDS model for experimental work.
3.2. Deep Transfer Pre-Trained Models
Pre-trained models provide solid ground for additional training and perform effectively in many areas, such as image recognition, fraud detection, and natural language processing [32]. Researchers have developed these models to address comparable tasks through refinement or fine-tuning. They are beneficial for minimizing the time and resources required to solve complex problems. This study investigates the performance of four pre-trained models: ResNet50, VGG16, MobileNetV1, and EfficientNetB0. Each model has a different approach and unique architecture, thereby ensuring that our research benefits from a broad spectrum of advanced techniques and methodologies. The models are pre-trained using the ImageNet dataset [33]. This huge dataset includes 1000 classes and 14,197,122 arranged according to the WordNet structure. It contains 1,281,167 training images, 50,000 validation images, and 100,000 test images. Many tools and platforms provide models already trained on the ImageNet dataset, such as TensorFlow [34], PyTorch [35], and Keras Application [36]. The availability of such trained models facilitates their implementation, as we directly load the models with the saved weights, which eliminates the need for long training time pre-training time and with a starting point to build our system. In our implementation, we freeze the layers of the pre-trained modes. This approach reduces the number of parameters that need to be stored in memory in forward and backward propagation and eliminates the need to calculate the gradients of the loss function. With respect to the number of parameters, freezing the layers leads to a reduced complexity percentage of 11% for VGG16, 92% for ResNet50, 76% for MobileNetV1, and EfficientNetB0.
- VGG: This model can classify more than a thousand images into thousands of categories and is one of the most important milestones in the object recognition field. VGG has many variants, among which VGG16 is the most well-known. The number “16” refers to the total number of weight layers. It requires an input size of 224 × 224. Despite applying stacked small-sized convolution filters of size 3 × 3, these filters made an effective receptive field like large-sized filters. The hidden layers of this model use the Rectified Linear Units (ReLu) activation function. The model ends with three fully connected layers with 4096, 4096, and 1000 channels, respectively. The final activation function is the softmax function.
- ResNet: Amongst TL models, ResNet has shown outstanding performance. It is a CNN with skip connections in its architecture. These skip connections allow the gradient to flow smoothly and maintain the key features until the last layer of the model. ResNet has different versions; the premier version is ResNet34, which has 34 weighted layers and a 3 × 3 filter inspired by the VGG model. The most widely used model is ResNet50. It includes 50 layers: 48 convolutional layers, 1 MaxPool layer, 1 average pooling layer, and 1 fully connected layer with 1000 nodes. This model uses the softmax activation function.
- MobileNet: This is a lightweight DNN-based model for low-resource devices. It applies two convolution techniques. The first one is a 3 × 3 depth-wise convolution to filter the inputs. The second convolution technique is a 1 × 1 point-wise convolution layer that combines the filtered inputs. MobileNetV1 is the earliest version of this family and encompasses 28 convolutional layers followed by a fully connected layer that is activated by the softmax function.
- EfficientNet: Proposed by Tan et al. [13], this model aims to achieve better results by balancing the depth, width, and resolution of the network via compound scaling. The main block of the model is a mobile inverted residual block (also called MBConv). The authors demonstrated the effectiveness of their model by scaling up the well-known ResNet and MobileNet Architectures, in addition to scaling up a newly proposed network, EfficientNetB0, to induce a family of EfficientNet models. The baseline architecture of this family comprises two convolution layers with sixteen MBConv modules in between.
Table 2 summarizes the base architectures of these models. In this table, “Model size” denotes the size of memory required by the model. “Depth” refers to all layers that have parameters within the model. Lastly, top-1 and top-5 accuracies refer to the accuracies of the model with the ImageNet dataset [36]. All the models have an input size of 224 × 224 for RGB images.
Table 2.
Summary of the base architectures of the implemented pre-trained models.
3.3. Convolutional Block Attention Module (CBAM)
The attention mechanism is an evolving technique that enhances the performance of the model by refining the neural network feature map [14]. It was inspired by the human visual attention system. To capture an entire scene, humans naturally focus on areas of interest by selecting significant objects or regions in the scene while filtering out distractions [37]. This biological mechanism has inspired researchers to develop attention mechanisms in neural networks, and they have been widely used in many fields, such as NLP, computer vision, voice recognition, and robotics. Amongst diverse types of developed attention mechanisms, Woo et al. [14] proposed the CBAM as an effective and simple module that brings attention to key features in feed-forward CNNs. It sequentially applies channel and spatial attention mechanisms to refine feature maps. This dual attention mechanism refines the features by emphasizing important channels and spatial locations, thereby improving the model’s performance across various tasks. CBAM has demonstrated effective results in various domains [38,39,40]. The CBAM study highlights that this attention mechanism can be seamlessly integrated into any CNN structure. Moreover, the CBAM method is well-suited for resource-constrained devices, as it requires minimal additional parameters. The CBAM entails two sequential submodules: a Channel Attention Module (CAM) followed by a Spatial Attention Module (SAM). The channel module works as a feature identifier as it focuses on what is significant in the input image. It takes a feature map F ∈ ℝC×H×W as an input, where C denotes the number of channels, and H and W are the height and width of the map, respectively. The block deduces a 1D channel attention map Mc ∈ ℝC×1×1, and it applies maximum and average pooling on each channel feature across the spatial dimension, resulting in two spatial descriptors: and . Afterward, they are passed to a shared Multi-Layer Perceptron (MLP) with a hidden activation size equal to ℝ(C/r)×1×1, where r stands for the reduction ratio. Element-wise summation merges the feature vectors, then a sigmoid activation function (σ) maps the values between 0 and 1. The overall structure of the CBAM is shown in Figure 2.
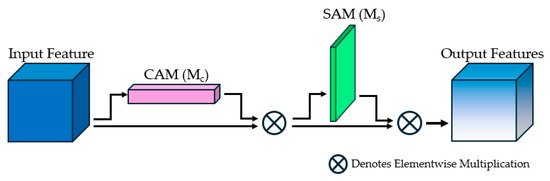
Figure 2.
The overall CBAM structure.
The functionalities of the CAM are expressed as follows:
where σ is the sigmoid function, and W0 ∈ ℝ(C/r)×C and W1 ∈ ℝC×(C/r) are the MLP weights, respectively [14].
The SAM uses average and maximum pooling as well, but it is associated with a convolution layer instead of the MLP. It generates two 2D maps: ∈ ℝ1×H×W and ∈ ℝ1×H×W. It employs a sigmoid activation function and element-wise multiplication to infer a spatial attention map Ms ∈ ℝC×H×W. The operations of the spatial attention module on an input feature map (F) are expressed as follows [14]:
The final outputs of the CBAM are given in Equations (7) and (8).
The integration of these two modules allows the CBAM to effectively acquire channel-wise and spatial contextual information. It improves the classification ability of CNN-based models by highlighting relevant features while suppressing irrelevant ones and any existing noises. Furthermore, because of its lightweight design, CBAM is ideally suited for implementation in resource-constrained situations, such as Internet of Things devices, where computational simplicity and energy economy are crucial [14].
In our approach, we integrate the CBAM on top of our implemented pre-trained models such that it takes the final feature map of the models as an input to highlight regions of interest and determine crucial features. This approach has not been applied in the intrusion detection field before. To illustrate the efficacy of our suggested approach, we examine two scenarios for each model: the pre-trained model with modified top layers and the model with the plugged CBAM, as shown in Figure 3.
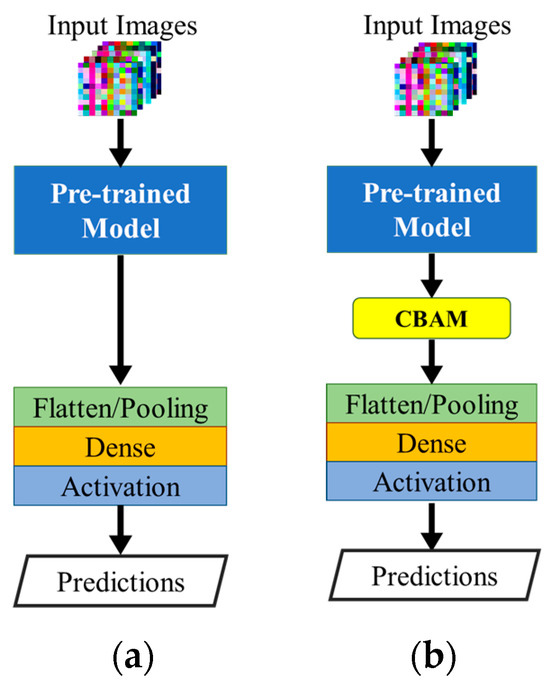
Figure 3.
The architecture of the proposed model: (a) the pre-trained model with customized top layers; (b) the pre-trained model with customized top layers and plugged CBAM.
3.4. Ensemble Learning
Ensemble learning is the last stage in our proposed system. It aggregates an assortment of base learning models to reach an enhanced overall performance. The two broad techniques of ensemble learning are parallel and sequential learning [28]. In the parallel approach, different base learners are trained independently, and then their predictions are combined via a combiner. The sequential approach, on the other hand, trains the base models sequentially, such that each model optimizes the errors of its precedent. The Random Forests algorithm is a widely used parallel ensemble model, while the Boosting algorithm is an example of a sequential ensemble. Ensemble techniques could combine homogenous or heterogeneous classifiers. Homogenous ensembles use the same ML algorithm for the base learners, while heterogeneous ensembles employ diverse ML algorithms [28]. Combining the predictions of the base models is divided into voting techniques and meta-learning techniques. In the voting approach, each base classifier independently predicts the class label for a given input, and the final prediction is determined by aggregating the individual predictions using a specific rule, such as maximum voting, average voting, or weighted average voting. Meta-learning techniques, on the other hand, involve multiple learning stages in which the output of the base learners is used to train meta-models. These meta-models aim to enhance the overall performance using the knowledge they acquired from previous outputs.
In our study, we apply the ensemble averaging approach. The approach fuses the predictions of the base learner and decides the class based on the highest probability. The final probability of a class is the arithmetic mean of all base learners’ probabilities for this class. Given the diverse structures of the network, the inference may take place directly on the devices. The averaging approach is well-suited to this scenario as it requires less computational overhead and memory compared to more complex methods like stacking or boosting. This ensures quicker inference times and lower energy consumption, making it a practical choice for resource-constrained IoT devices. Our models use the softmax activation function to obtain the probability of each class, which is calculated as follows:
where z denotes the input vector, K is the total number of classes, and and are the exponential functions of the input and output vectors, respectively.
4. Experimental Work
4.1. Environmental Setup and Hyperparameters
We conducted our experimental work on Google Colaboratory (Colab) [41], which is a cloud-based Jupyter notebook environment that provides free-of-charge access to substantial computing resources. The hardware allocated for a user is Intel(R) Xeon vCPU @2.3 GHz, 2 cores, and 13 GB RAM. Nevertheless, Colab does not guarantee the assigned resources over time, which eliminates the legitimate comparison of the training and testing time taken by each model. We implemented and wrote the models in Python 3.10 language, along with Keras 2.12 API running on Tensorflow 2.13 backend. In addition, we used NumPy [42], Pandas [43], and Matplotlib [44] libraries. We evaluated the classification results using the Scikit-Learn (sklearn) library [45].
The number of epochs was set to 20 epochs, and the number of batches was set to 64. To save resources and reduce the training time, we monitored the validation accuracy, and the model triggered an early stop callback if it witnessed no improvement for two consecutive epochs. We applied a dynamic learning rate approach, in which we reduced the learning rate at higher epochs. Starting at 0.01, the learning rate was reduced every 2 consecutive epochs to 0.005, 0.001, and 0.0005 until it was set at a minimum value of 0.0001. Regarding the CBAM, we set the kernel size to 3 × 3 and the reduction ratio to 1. For the loss function, we used the sparse categorical cross-entropy, and the optimizer used was the “Adam Optimizer”. In the pre-trained models, and as aforementioned, we froze the trainable layers of the models and removed their top layers. These top layers are responsible for the classification process and were originally designed to match the 1000 classes within the ImageNet dataset. To adapt the VGG16, we removed the final Flatten layer, 2 dense layers, each with 4096 neurons and a ReLU activation layer, and the final dense layer, which compromises 1000 neurons representing the categories of the ImageNet dataset. The top layer becomes a MaxPooling layer that passes an output of size 7 × 7 × 512 to the CBAM, where 512 is the number of channels. For ResNet50, we removed the global average pooling (GAP) layer and the final dense layer with 1000 output units and a softmax activation function. The output feature map of its block is passed as an input to the CBAM, with a size 7 × 7, and 2048 channels. We excluded the top average pooling layer and the fully connected layer, which had 1000 neurons and softmax activation functions from MobileNetV1. The output of its top point-wise convolution block is a 7 × 7 feature map with 1024 channels. For EfficientNetB0, we also excluded the average pooling layer, along with the 1000 neurons fully connected layer that is activated by a sigmoid function. This model passes to the CBAM a feature map of 7 × 7 × 1280, where the latter represents the number of channels.
4.2. Dataset
We validated our intelligent system using the Bot-IoT dataset. It is a real IoT network representation generated at the University of New South Wales (UNSW), Canberra. The raw dataset holds around 70 GB of PCAP files that are processed using a network audit tool, namely Argus. The full dataset has more than 72 million instances and is represented by 43 independent features. The dataset entails both legitimate and adversary traffic. The authors created two subsets of the original BoT-IoT dataset, the 5% subset and the 10-Best features subsets. The first subset includes around 3.6 million records, representing 5% of the full dataset instances. The authors provided this subset as a manageable and compact version for easier implementation. On the other hand, the 10-Best subset encompasses only 10 features out of the 43 elementary independent features. The authors determined these best 10 features by mapping the average correlation coefficient and joint entropy and then selecting the features with the best scores. We used the 10-Best Bot-IoT subset, which is available for public use in a CSV file format. In addition to the 10 selected features, this dataset encloses 5 independent flow identifiers and 3 dependent features [15]. The flow identifiers are “saddr”, “sport”, “daddr”, “dport”, and “proto”. The three dependent features are “attack”, “category”, and “subcategory”. The authors also implanted “pkSeqID”, a numerical feature that serves as a row identifier. The descriptions and datatypes of all features in this subset are depicted in Table 3.
Table 3.
Descriptions and datatypes of the 10-Best Bot-IoT dataset features.
In ML and DL, data preprocessing is an essential phase as it ensures that the input data are consistent and properly formatted, both of which have a direct impact on the performance and accuracy of the model. It also helps in handling missing values, outliers, and feature scaling, making the training process more efficient and the results more reliable [46]. The preprocessing steps are as follows:
- Data Cleaning: In the early data preprocessing stages, we cleared the dataset from null, duplicate, and infinite values. We used the “drop_duplicates()”, “isinf()”, and “isnull()” methods to carry out this process.
- Dimensionality Reduction: Reducing the dimensions plays a vital role in learning-based IoT IDSs, as it removes redundant information that negatively impacts the results of the model. It also decreases the computational and training time costs. We reduced the dimensionality of the dataset by dropping the flow identifiers features. These features provide local information that cannot be generalized and can lead to biased predictions toward the nodes of the networks [47]. The “pkSeqID” feature is also dropped as it has the same task as the automatically created index. Furthermore, since this study aims to detect the main attack category, we dropped the “subcategory” feature along with the “attack” feature, noting that the information provided by the latter is implicitly expressed by the “category” feature.
- Data Transformation: In this step, we converted any categorical features to numerical ones for additional processing. The “category” feature is the only remaining categorical feature after dropping the previously mentioned features. It holds five textual representations of the instance category, which are DoS, DDoS, Reconnaissance, Theft, and Normal. We used the LabelEncoder class from the sklearn library to encode a unique number for each of these five classes. Integer labels require less memory than textual representations, which is beneficial for reducing memory consumption and managing large datasets. Label encoding is also a computationally efficient method that matches most deep learning framework requirements and streamlines the preparation of data. Moreover, most ML models operate on numerical data, making this conversion a necessary step in data preprocessing [48].
- Data Balancing: Table 4 presents the class distribution of the BoT-IoT dataset. As shown, over 98% of data instances fall under DoS and DDoS classes. This data imbalance is a major challenge to accurate detection, as it leads to models that are biased towards the majority classes, reducing the overall predictive performance and generalizability [48]. Therefore, for enhanced performance, the dataset should enclose a consistent number of samples in each class [48,49]. To overcome this problem, many studies have used the oversampling of the minority classes along with the under-sampling of the majority ones [49]. We used a random under-sampling technique to reduce the “DDoS” and “DoS” classes, and we used the Synthetic Minority Oversampling Technique (SMOTE) [50] to augment the minority classes. SMOTE is a k-nearest clustering-based algorithm that creates synthetic data points that are vaguely different from the original data points. The primary benefit of this strategy is that dataset augmentation depends on newly created data points instead of duplicating existing data. Rather than randomly oversampling the minority classes, SMOTE creates for each minority sample xi, a new sample , that is dependent on xj, which is randomly selected from xi’s nearest neighbors (k), and λ is a random value ranged in [0, 1]. The two classes, “Normal” and “Theft”, are oversampled to reach our target number of samples. SMOTE is the most used oversampling technique and is compatible with a wide range of data types [51]. We used the SMOTE class of the Python imbalance library to sample up the minority classes of the dataset automatically with k = 2. Equation (10) defines the generated samples of SMOTE [50].
Table 4. Class distribution of “Bot-IoT 10-Best Features”.
- Data Standardization: Upon examination of the 10-Best Bot-IoT dataset, we deduced that notable skewness and a high frequency of outliers are present in many features, such as “seq”, “min”, “srate”, and “drate”. These findings indicate non-uniform distributions and imbalanced ranges within the dataset, which may lead to a biased classification [52]. Therefore, we scaled our data to a uniform range using the quantile transformer. It is a non-linear transformer that changes the range of each feature’s original distribution to follow a normal or a uniform one. The quantile transformer has shown effective results in overcoming skewed values and outliers [52]. This transformation leads to improved model training, enhanced robustness, and reliable classification performance [46,52].
- Data Visualization: CNN models process images better than tabular data [7,24]. This visual representation allows the combining of multifaceted relationships between the features within pixels or regions of the image, allowing the model to capture complex patterns that are challenging to represent in tabular form. Additionally, converting our tabular data into images leverages the power of selected pre-trained image models. Therefore, after preprocessing the dataset, we transformed our tabular data into a set of images and used them as input for the learning-based model. We first assorted the dataset into five categories, which are DoS, DDoS, Reconnaissance, Theft, and Normal. Afterward, we divided each category into blocks of 30 samples, where each sample had 10 features, and all these 30 × 10 feature vectors were concatenated in a 1D vector of length 300. The vector was then reshaped into a 3D array of size 10 × 10 × 3. In this reshaping process, we grouped 3 consecutive feature values into one pixel to represent the three-color channels of the image. Afterward, we scaled the data from 0 to 255, which is the range of an 8-bit image pixel. The process of transforming a category subset is depicted in Figure 4. The total number of created images is 14,715 images. Figure 5 shows the transformed images.
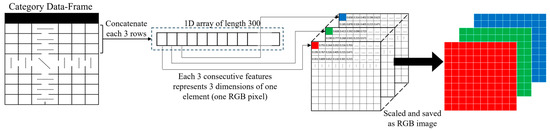 Figure 4. Transformation of the tabular data into RGB images, in which each 3 consecutive feature values represent a color channel of a single pixel.
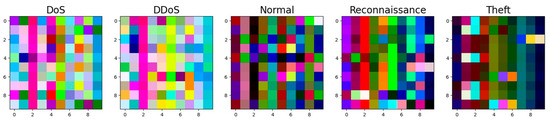 Figure 5. Samples of the generated 10 × 10 × 3 images for each attack. The RGB color variations in the images reveal distinct patterns for each attack type, with bright and scattered RGB distributions for DoS and DDoS, dispersed patterns for Reconnaissance, and block-like RGB clusters for Theft.
4.3. Evaluation Metrics
Evaluation metrics assist in comparing different models or algorithms and offer insight into how well the model works. We quantitatively measure the functionality and efficiency of a learning-based model based on True Negative (TN), True Positive (TP), False Positive (FP), and False Negative (FN) predictions. The combination of these measures results in our main evaluation metrics, which are accuracy, precision, recall, F1-score, and Area Under the Curve (AUC). These metrics are calculated as follows:
where n denotes the number of classes, and AUC(j|k) is the AUC with class j as the positive class and class k as the negative class.
5. Results and Discussion
5.1. Fundamental Models’ Parameters
Since the proposed IDS targets IoT environments, we examine key parameters that affect the resource consumption of network devices. These parameters include the number of parameters per model, the memory used to save the models and weights, and the number of Floating-point Operations (FLOPs). FLOPs denote prevalent mathematical operations such as addition, subtraction, and multiplication and are widely used to estimate and compare the complexity and computational cost of ML models. Table 5 shows the values of our selected parameters for each model. As indicated, VGG16 is a heavy model with a significantly high FLOP number. Despite having only 16 layers and the same input size as the other models, this model depends on Flatten layers in its optimized functionality, leading to a substantial increase in the number of model parameters and complexity. The ResNet50 model has more than 7700 FLOPs, which is almost seven times that of the MobileNetV1 model and ten times that of the EfficientNetB0. As previously mentioned, the CBAM aims to enhance the model performance without adding computational complexity, and the increase in FLOPs after integrating the attention module is negligible.
Table 5.
Fundamental model parameters affecting resource consumption of network devices.
5.2. Classification Results
Table 6 shows the classification results of the implemented models. As recorded, the performance of the models with the plugged CBAM surpasses that of the baseline models in all the evaluation metrics. The accuracy of the VGG16, ResNet50, MobileNetV1, and EfficientNetB0 increases by 0.54%, 0.28%, 0.21%, and 0.4%, respectively. We also witnessed improvements in precision, which ascertains that the CBAM promotes the identification of relevant information from the input images and helps minimize false positives. The precision of the VGG16 improves from 99.13% to 99.67%, the ResNet50 increases from 99.25% to 99.6%, and that of the MobileNetV1 and the EfficientNetB0 increases by 0.21% and 0.34%, respectively. The recall of each model is also increased by the same percentage of its precision, which implies that the model efficiently exploits the relevant information in its prediction. Moreover, the increase in the F1-score after introducing the CBAM refers to enhanced detection of both the positive and negative classes at each category level.
Table 6.
Performance evaluation of the TL models, the two best models that we aggregate, are indicated in bold.
The AUC scores for all the models in this study are impressively high, with values ranging from 0.99987 to 1.0, demonstrating their strong ability to distinguish between positive and negative instances. The integration of the CBAM leads to even higher AUC scores, highlighting its effectiveness in refining feature extraction and enhancing model performance. Specifically, EfficientNetB0 + CBAM and TL-CBAM-EL both achieved a perfect AUC of 1.0, indicating flawless classification. This score can be attributed to the effectiveness of EfficientNetB0, combined with CBAM’s ability to focus on critical features. The TL-CBAM-EL model benefits from ensemble learning, aggregating predictions from the best-performing models to achieve robust classification results. The consistently high AUC scores reflect the effectiveness of both the model architectures and the preprocessing techniques employed, ensuring high-quality data input and optimal learning conditions.
By studying the data in Table 5 and Table 6, we deduce that the most convenient base learners for ensemble learning are the MobileNetV1 + CBAM and EfficientNetB0 + CBAM. Moreover, opting for these models is advantageous due to their lightweight design, ensuring efficient resource utilization and swift performance. As previously mentioned, ensemble learning combines the strengths of multiple models to improve overall performance and robustness. Therefore, we average the predictions of these two models to mitigate any existing weaknesses and provide a more accurate and reliable prediction [53]. As illustrated in Table 6, the aggregation of these two selected models via average ensemble learning outperforms all the single models and succeeds in reaching a 99.93% classification accuracy.
5.3. Overfitting Inspection
To ensure that both base learners generalize well and do not entail any overfitting, we examine their learning curves. Figure 6 shows the training accuracy, validation accuracy, training loss, and validation loss curves of the EfficientNetB0 + CBAM and MobileNetV1 + CBAM models. As depicted, the training loss curves show a good fit, and neither model suffers from overfitting. In each model, the training loss curve decreases until it reaches a stable state, indicating that no further learning is required. Moreover, the training loss and validation loss curves converge and stabilize at similar values, proving consistent performance on the training and validation data [54]. The curves illustrate that the early stop forces the models to stop training when the validation accuracy stabilizes. The decision to terminate training after two stagnant epochs balances computational efficiency with the potential benefits of learning rate adjustments. This approach optimizes efficiency, reduces training time, and minimizes energy consumption.
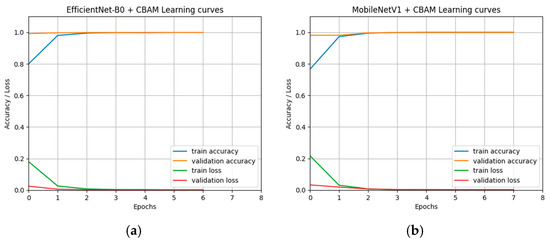
Figure 6.
The learning curves of the two best models: (a) the training and the validation curves of the EfficientNetB0 with the CBAM; (b) the training and the validation curves of MobileNetV1 with the CBAM.
5.4. Significance of the CBAM
During the training phase, the CBAM managed to reduce the training time by accelerating the convergence of the models within fewer epochs. The models integrated with the CBAM had lower training epochs and higher accuracy. The number of training epochs was reduced from 6 to 4 for the VGG model, from 11 to 9 for the ResNet model, from 8 to 7 for the MobileNetV1 model, and from 9 to 7 for the EfficientNet model. Moreover, to further emphasize the significance of integrating the CBAM and the ensemble learning, we compare the classes’ precision, recall, and F1-score obtained in each of our implemented models, and they are illustrated in Figure 7, Figure 8, and Figure 9, respectively.
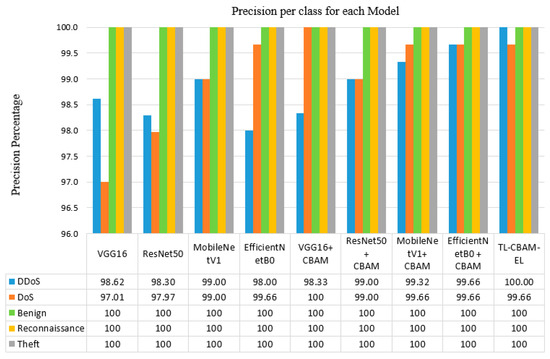
Figure 7.
Precision percentage per class for each of the implemented models.
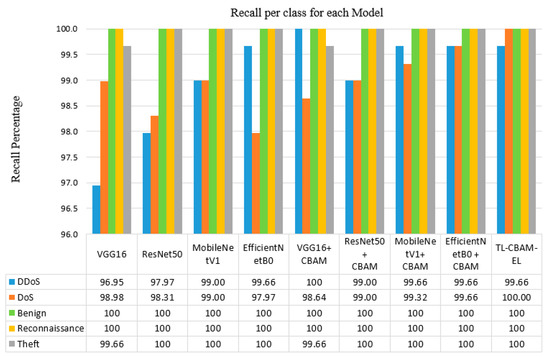
Figure 8.
Recall percentage per class for each of the implemented models.
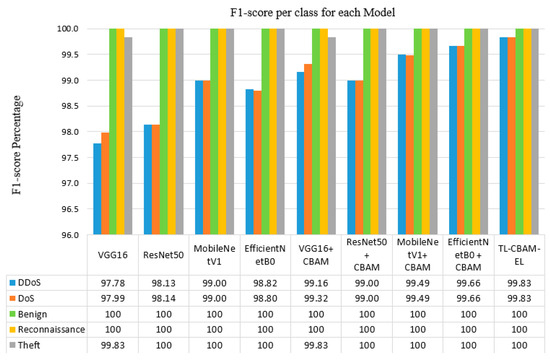
Figure 9.
F1-score percentage per class for each of the implemented models.
As shown in Figure 7, MobileNetV1 and EfficientNetB0 models demonstrate exceptional performance, achieving above 98% precision for “DDoS” and “DoS” attacks and perfect precision for “Normal”, “Reconnaissance”, and “Theft” classes. Moreover, integrating the CBAM enhances the precision of all models, with the TL-CBAM-EL model standing out by recording near-perfect scores across all classes. The high precision indicates that the models are effective at correctly identifying attacks with low FPR.
Figure 8 displays the recall percentages per class for our implemented models. All the models have approximately 100% recall for the “Normal”, “Reconnaissance”, and “Theft” classes, indicating their strong ability to identify the true positive instances across these classes. The recall percentages for the “DoS” and “DDoS”, while slightly lower compared to other classes, remain high and are indicative of robust model performance. They range from 98 to 100%, demonstrating their reliability in detecting these two attacks. This reduction is attributed to the similar features of “DoS” and “DDoS” attacks, as they fundamentally aim to disable the service or the system to its legitimate users. Nevertheless, the incorporation of the attention mechanism enhances the models’ focus on significant features, resulting in improved recall rates.
Figure 9 depicts the F1-score per class of our implemented models. The figure demonstrates that all the models succeed in attaining a high F1 score, indicating a balanced performance in terms of both precision and recall. The findings prove that the models effectively identify true positives while minimizing false positives and false negatives. They also prove that the attention mechanism improves the models’ ability to classify complex patterns in the data, leading to enhanced scores across all classes. Our tested models exhibited high F1-scores for “Normal”, “Reconnaissance”, and “Theft” classes, ranging from 99.7% to 100%. The “DoS” and “DDoS” classes have slightly fewer F1 scores, but they are still high scores in the context of IDSs. This variation in the results indicates that some classes have distinctive features that are easier to learn and classify, which is affirmed by the visual representation of the data depicted in Figure 5.
5.5. Comparison to Other Models
To assess the efficiency of our final model, we compared it to different models previously overviewed in Section 2. In our comparison, we consider diverse approaches to ensure the novelty and competitiveness of our approach. For a valid comparison, all selected models use the BoT-IoT dataset. As shown in Figure 10, incorporating the CBAM with the MobileNetV1 and EfficientNetB0 exhibits superior performance. The TL-CBAM-EL model surpasses all other models concerning accuracy. This strongly supports the conclusion that our TL-CBAM-EL model is an effective model for IoT intrusion detection and demonstrates its capability to accurately identify intrusions with high precision compared to its predecessors.
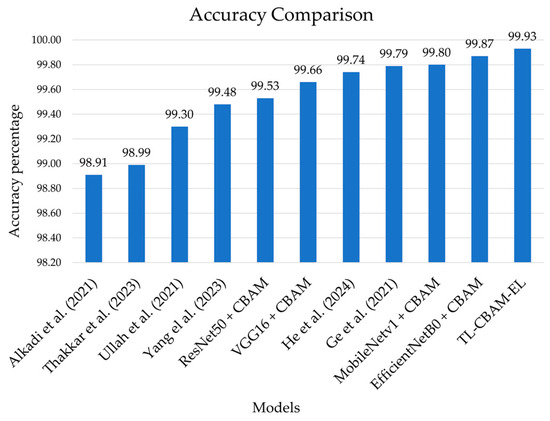
Figure 10.
Comparison between the accuracies of the proposed TL-CBAM-EL model, the pre-trained models integrated with the CBAM, and previously presented models [16,17,18,20,27,29].
5.6. Practical Deployment Considerations
Considering the computational efficiency, accuracy, and resource conservation offered by the two selected base learners, MobileNetV1 + CBAM and EfficientNetB0 + CBAM, we conclude that they are optimal choices for deployment in IoT networks. Their lightweight architectures [55], coupled with the frozen layers during transfer learning, should preserve resource consumption. Our findings support promising robust and efficient intrusion detection capabilities. Nevertheless, to facilitate the practical implementation of the proposed IDS in IoT networks, various deployment scenarios can be considered based on the specific network requirements and structure. This flexibility ensures that the system can adapt to different IoT environments, optimizing resource usage and energy efficiency. The following outlines some potential deployment approaches:
- Hybrid Processing: A hybrid system in IoT takes advantage of different technologies in the network, such as cloud or fog computing, edge computing, and on-device computing, to provide a tailored learning-based IDS [56]. It deploys the training and inference of the model according to the network’s specifications and the diverse needs of the applications. Hybrid approaches aim to balance the trade-off between time–response, computational complexity, and energy consumption.
- AI edge computing: Instead of relying on centralized platforms and cloud databases, giant technology corporations are widely expanding in the development of AI chips that allow intelligent computing to be performed on edge devices [57]. This approach reduces latency and network congestion [56]; however, the energy levels at the selected edge devices should be carefully considered.
- Tiny Machine Learning (TinyML): TinyML is the discipline of implementing ML models on ultra-low-power microcontrollers or embedded devices [58]. It enables cognitive processing and decision-making directly on edge devices without the need for cloud or edge connectivity. This field requires further refinement and investigations to develop benchmark DL models and datasets that can be deployed in an IDS TinyML system.
- Adaptive security: Given the dynamic nature of mobile IoT environments, security measures must be continuously adjusted to ensure ongoing protection of data and devices [59]. Adaptive security represents a promising research avenue for mobile IoT, as it allows for the implementation of a range of defense mechanisms tailored to specific contextual environments. This adaptability involves addressing different types of attacks and vulnerabilities that IoT devices encounter as they move through various zones and networks.
6. Conclusions
This research proposes a novel approach for intrusion detection systems in IoT networks based on transfer learning, ensemble learning, and Convolutional Block Attention Module. The study evaluates four state-of-the-art pre-trained models, which are VGG16, ResNet50, MobileNetV1, and EfficientNetB0. Each model is examined with and without the integrated CBAM, resulting in eight distinct models. Using the 10-Best BoT-IoT dataset, we preprocessed the data to address the class imbalance and transformed tabular data into RGB images, enabling spatially coherent feature representation and complex pattern recognition. Our experimental results prove that our novel approach to integrating a single lightweight CBAM at the top layer of the models leads to faster convergence, higher accuracy, and minimized false positive rates. Among the evaluated models, EfficientNetB0 + CBAM and MobileNetV1 + CBAM exhibited the best performance. By applying ensemble learning to aggregate the predictions of these two top-performing models, we developed the TL-CBAM-EL model. The TL-CBAM-EL model achieved an impressive accuracy of 99.93% in detecting and classifying various intrusion attacks, surpassing the performance of existing methods in this domain. This result underscores the effectiveness of combining transfer learning, CBAM, and ensemble learning techniques for enhancing intrusion detection systems in IoT networks.
For our future work, we aim to conduct a detailed analysis of the model’s complexity, including training and inference times. This will involve assessing various optimization strategies to further enhance computational efficiency. This examination was unattainable due to the instability of the Google Colab resources. Another potential area for future research involves examining the use of different features and different datasets to ensure the generalization and robustness of our model. Moreover, we plan to investigate secure data transformation techniques and incorporate robust security measures to prevent any vulnerabilities or data leaks, ensuring the integrity and confidentiality of the transformed dataset.
Author Contributions
Conceptualization, M.A. and M.R.; Methodology, S.A.; Software, S.A.; Formal analysis, S.A. and I.H.; Investigation, S.A.; Data curation, S.A.; Writing—original draft, S.A.; Writing—review and editing, I.H. and M.R.; Visualization, S.A.; Supervision, I.H., M.A. and M.R. All authors have read and agreed to the published version of the manuscript.
Funding
This research received no external funding.
Institutional Review Board Statement
Not applicable.
Informed Consent Statement
Not applicable.
Data Availability Statement
The dataset used in this study is publicly available by UNSW Canberra at the Australian Defence Force Academy (ADFA) at the following link: https://research.unsw.edu.au/projects/bot-iot-dataset (accessed on 19 June 2022).
Conflicts of Interest
The authors declare no conflicts of interest.
References
- Fortune Business Insights. Internet of Things (IoT) Market. Available online: https://www.fortunebusinessinsights.com/industry-reports/internet-of-things-iot-market-100307 (accessed on 23 April 2023).
- Sarker, I.; Khan, A.; Abushark, Y.; Alsolami, F. Internet of Things (IoT) security intelligence: A comprehensive overview, machine learning solutions and research Directions. Mobile Netw. Appl. 2023, 28, 296–312. [Google Scholar] [CrossRef]
- Almuqren, L.; Alqahtani, H.; Aljameel, S.S.; Salama, A.S.; Yaseen, I.; Alneil, A.A. Hybrid metaheuristics with machine learning based botnet detection in cloud assisted internet of things environment. IEEE Access 2023, 11, 115668–115676. [Google Scholar] [CrossRef]
- Mohammadpour, L.; Ling, T.C.; Liew, C.S.; Aryanfar, A. A Survey of CNN-based network intrusion detection. Appl. Sci. 2022, 12, 8162. [Google Scholar] [CrossRef]
- Abdelhamid, S.; Aref, M.; Hegazy, I.; Roushdy, M. A survey on learning-based intrusion detection systems for IoT networks. In Proceedings of the 2021 Tenth International Conference on Intelligent Computing and Information Systems (ICICIS), Cairo, Egypt, 5–6 December 2021. [Google Scholar]
- Nguyen, C.; Van Huynh, N.; Chu, N.; Saputra, Y.; Hoang, D.; Nguyen, D.; Pham, Q.; Niyato, D.; Dutkiewicz, E.; Hwang, W. Transfer learning for wireless networks: A comprehensive survey. Proc. IEEE 2022, 110, 1073–1115. [Google Scholar] [CrossRef]
- Zhu, Y.; Brettin, T.; Xia, F.; Partin, A.; Shukla, M.; Yoo, H.; Evrard, Y.; Doroshow, J.; Stevens, R. Converting tabular data into images for deep learning with convolutional neural networks. Sci. Rep. 2021, 11, 11325. [Google Scholar] [CrossRef]
- Sharma, A.; Vans, E.; Shigemizu, D.; Boroevich, K.A.; Tsunoda, T. DeepInsight: A methodology to transform a non-image data to an image for convolution neural network architecture. Sci. Rep. 2019, 9, 11399–11405. [Google Scholar] [CrossRef]
- Bazgir, O.; Zhang, R.; Dhruba, S.R.; Rahman, R.; Ghosh, S.; Pal, R. Representation of features as images with neighborhood dependencies for compatibility with convolutional neural networks. Nat. Commun. 2020, 11, 4391. [Google Scholar] [CrossRef]
- Simonyan, K.; Zisserman, A. Very deep convolutional networks for large-scale image recognition. In Proceedings of the 3rd International Conference on Learning Representations (ICLR 2015), San Diego, CA, USA, 7–9 May 2015. [Google Scholar]
- He, K.; Zhang, X.; Ren, S.; Sun, J. Deep residual learning for image recognition. In Proceedings of the IEEE Conference on Computer Vision and Pattern Recognition, Las Vegas, NV, USA, 27–30 June 2016. [Google Scholar]
- Howard, A.; Zhu, M.; Chen, B.; Kalenichenko, D.; Wang, W.; Weyand, T.; Andreetto, M.; Adam, H. Mobilenets: Efficient Convolutional Neural Networks for Mobile Vision Applications. arXiv 2017, arXiv:1704.04861. [Google Scholar]
- Tan, M.; Le, Q. EfficientNet: Rethinking model scaling for convolutional neural networks. In Proceedings of the 36th International Conference on Machine Learning (PMLR), Long Beach, CA, USA, 9–15 June 2019; Volume 97, pp. 6105–6114. [Google Scholar]
- Woo, S.; Park, J.; Lee, J.; Kweon, I. CBAM: Convolutional Block Attention Module. In Proceedings of the European Conference on Computer Vision (ECCV), Munich, Germany, 8–14 September 2018. [Google Scholar]
- Koroniotis, N.; Moustafa, N.; Sitnikova, E.; Turnbull, B. Towards the development of realistic botnet dataset in the internet of things for network forensic analytics: Bot-IoT dataset. Future Gener. Comput. Syst. 2019, 100, 779–796. [Google Scholar] [CrossRef]
- Alkadi, O.; Moustafa, N.; Turnbull, B.; Choo, K. A deep blockchain framework-enabled collaborative intrusion detection for protecting IoT and cloud networks. IEEE Internet Things J. 2021, 8, 9463–9472. [Google Scholar] [CrossRef]
- Ullah, I.; Mahmoud, Q. Design and development of a deep learning-based model for anomaly detection in IoT networks. IEEE Access 2021, 9, 103906–103926. [Google Scholar] [CrossRef]
- Yang, J.; Jiang, X.; Liang, G.; Li, S.; Ma, Z. Malicious Traffic Identification with Self-Supervised Contrastive Learning. Sensors 2023, 23, 7215. [Google Scholar] [CrossRef] [PubMed]
- Awajan, A. A Novel deep learning-based intrusion detection system for IoT networks. Computers 2023, 12, 34. [Google Scholar] [CrossRef]
- He, M.; Huang, Y.; Wang, X.; Wei, P.; Wang, X. A lightweight and efficient IoT intrusion detection method based on feature grouping. IEEE Internet Things J. 2024, 11, 2935–2949. [Google Scholar] [CrossRef]
- Bozinovski, S.; Fulgosi, A. The influence of pattern similarity and transfer of learning upon training of a base perceptron B2. Proc. Symp. Inform. 1976, 3, 121–126. [Google Scholar]
- Pan, S.J.; Yang, Q. A survey on transfer learning. IEEE Trans. Knowl. Data Eng. 2009, 22, 1345–1359. [Google Scholar] [CrossRef]
- Vu, L.; Nguyen, Q.; Nguyen, D.; Hoang, D.; Dutkiewicz, E. Deep transfer learning for IoT attack detection. IEEE Access 2020, 8, 107335–107344. [Google Scholar] [CrossRef]
- Hussain, F.; Abbas, S.; Husnain, M.; Fayyaz, U.; Shahzad, F.; Shah, G. IoT DoS and DDoS attack detection using ResNet. In Proceedings of the 2020 IEEE 23rd International Multitopic Conference (INMIC), Bahawalpur, Pakistan, 5–7 November 2020. [Google Scholar]
- Fan, Y.; Li, Y.; Zhan, M.; Cui, H.; Zhang, Y. IoTDefender: A federated transfer learning intrusion detection framework for 5G IoT. In Proceedings of the 2020 IEEE 14th International Conference on Big Data Science and Engineering (BigDataSE), Guangzhou, China, 31 December–1 January 2020. [Google Scholar]
- Guan, J.; Cai, J.; Bai, H.; You, I. Deep transfer learning-based network traffic classification for scarce dataset in 5G IoT systems. Int. J. Mach. Learn. Cybern. 2021, 12, 3351–3365. [Google Scholar] [CrossRef]
- Ge, M.; Syed, N.; Fu, X.; Baig, Z.; Robles-Kelly, A. Towards a Deep Learning-Driven Intrusion Detection Approach for Internet of Things. Comput. Netw. 2021, 186, 107784. [Google Scholar] [CrossRef]
- Mienye, I.; Sun, Y. A survey of ensemble learning: Concepts, algorithms, applications, and prospects. IEEE Access 2022, 10, 99129–99149. [Google Scholar] [CrossRef]
- Thakkar, A.; Lohiya, R. Attack classification of imbalanced intrusion data for iot network using ensemble learning-based deep neural network. IEEE Internet Things J. 2023, 10, 11888–11895. [Google Scholar] [CrossRef]
- Awotunde, J.B.; Folorunso, S.O.; Imoize, A.L.; Odunuga, J.O.; Lee, C.C.; Li, C.T.; Do, D.T. An ensemble tree-based model for intrusion detection in industrial internet of things networks. Appl. Sci. 2023, 13, 2479. [Google Scholar] [CrossRef]
- Alotaibi, Y.; Ilyas, M. Ensemble-Learning Framework for Intrusion Detection to Enhance Internet of Things’ Devices Security. Sensors 2023, 23, 5568. [Google Scholar] [CrossRef] [PubMed]
- Zhuang, F.; Qi, Z.; Duan, K.; Xi, D.; Zhu, Y.; Zhu, H.; Xiong, H.; He, Q. A comprehensive survey on transfer learning. Proc. IEEE 2020, 109, 43–76. [Google Scholar] [CrossRef]
- Deng, J.; Dong, W.; Socher, R.; Li, L.; Li, K.; Fei-Fei, L. ImageNet: A large-scale hierarchical image database. In Proceedings of the 2009 IEEE Conference on Computer Vision and Pattern Recognition, Miami, FL, USA, 20–25 June 2009; pp. 248–255. [Google Scholar]
- Abadi, M.; Agarwal, A.; Barham, P.; Brevdo, E.; Chen, Z.; Citro, C.; Corrado, G.S.; Davis, A.; Dean, J.; Devin, M.; et al. TensorFlow: Large-scale machine learning on heterogeneous systems. arXiv 2015, arXiv:1603.04467. [Google Scholar]
- Paszke, A.; Gross, S.; Massa, F.; Lerer, A.; Bradbury, J.; Chanan, G.; Killeen, T.; Lin, Z.; Gimelshein, N.; Antiga, L.; et al. PyTorch: An imperative style, high-performance deep learning library. In Proceedings of the Advances in Neural Information Processing Systems 32 (NeurIPS 2019), Vancouver, BC, Canada, 8–14 December 2019. [Google Scholar]
- Keras Documentation: Keras Applications. 2020. Available online: https://www.keras.io/api/applications (accessed on 16 May 2022).
- Soydaner, D. Attention mechanism in neural networks: Where it comes and where it goes. Neural Comput. Appl. 2022, 34, 13371–13385. [Google Scholar] [CrossRef]
- Wang, A.; Liang, G.; Wang, X.; Song, Y. Application of the YOLOv6 combining CBAM and CIoU in forest fire and smoke detection. Forests 2023, 14, 2261. [Google Scholar] [CrossRef]
- Agac, S.; Durmaz, O. On the use of a convolutional block attention module in deep learning based human activity recognition with motion sensors. Diagnostics 2023, 13, 1861. [Google Scholar] [CrossRef]
- Wang, Y.; Chen, X.; Li, J.; Lu, Z. Convolutional Block Attention Module–Multimodal Feature-Fusion Action Recognition: Enabling Miner Unsafe Action Recognition. Sensors 2024, 24, 4557. [Google Scholar] [CrossRef]
- Bisong, E. Google Colaboratory. In Building Machine Learning and Deep Learning Models on Google Cloud Platform: A Comprehensive Guide for Beginners; Springer: Cham, Switzerland, 2019; pp. 59–64. [Google Scholar]
- Van Der Walt, S.; Colbert, S.; Varoquaux, G. The numpy array: A structure for efficient numerical computation. Comput. Sci. Eng. 2011, 13, 22–30. [Google Scholar] [CrossRef]
- McKinney, W. Pandas: A foundational python library for data analysis and statistics. In Proceedings of the Python for High Performance and Scientific Computing, Austin, TX, USA, 14 November 2011; pp. 1–9. [Google Scholar]
- Hunter, J. Matplotlib: A 2D Graphics Environment. Comput. Sci. Eng. 2007, 9, 90–95. [Google Scholar] [CrossRef]
- Pedregosa, F.; Varoquaux, G.; Gramfort, A.; Michel, V.; Thirion, B.; Grisel, O.; Blondel, M.; Prettenhofer, P.; Weiss, R.; Dubourg, V.; et al. Scikit-learn: Machine learning in python. JMLR 2011, 12, 2825–2830. [Google Scholar]
- Talaei Khoei, T.; Kaabouch, N. Machine Learning: Models, Challenges, and Research Directions. Future Internet 2023, 15, 332. [Google Scholar] [CrossRef]
- Sarhan, M.; Layeghy, S.; Moustafa, N.; Gallagher, M.; Portmann, M. Feature extraction for machine learning-based intrusion detection in iot networks. Digit. Commun. Netw. 2024, 10, 205–216. [Google Scholar] [CrossRef]
- Hossain, M.A.; Islam, M.S. A novel hybrid feature selection and ensemble-based machine learning approach for botnet detection. Sci. Rep. 2023, 13, 21207. [Google Scholar] [CrossRef] [PubMed]
- Yang, C.; Guan, W.; Fang, Z. IoT botnet attack detection model based on DBO-CatBoost. Appl. Sci. 2023, 13, 7169. [Google Scholar] [CrossRef]
- Chawla, N.; Bowyer, K.; Hall, L.; Kegelmeyer, W. SMOTE: Synthetic minority over-sampling technique. J. Artif. Intell. Res. 2002, 16, 321–357. [Google Scholar] [CrossRef]
- Zhao, Y.F.; Xie, J.; Sun, L. On the data quality and imbalance in machine learning-based design and manufacturing—A systematic review. Engineering, 2024; in press. [Google Scholar]
- De Amorim, L.B.; Cavalcanti, G.D.; Cruz, R.M. The choice of scaling technique matters for classification performance. Appl. Soft Comput. 2023, 133, 109924. [Google Scholar] [CrossRef]
- Mohammed, A.; Kora, R. A comprehensive review on ensemble deep learning: Opportunities and challenges. J. King Saud Univ. Comput. Inf. Sci. 2023, 35, 757–774. [Google Scholar] [CrossRef]
- Ying, X. An overview of overfitting and its solutions. J. Phys. Conf. Ser. 2019, 1168, 22022. [Google Scholar] [CrossRef]
- Zhou, Y.; Chen, S.; Wang, Y.; Huan, W. Review of research on lightweight convolutional neural networks. In Proceedings of the IEEE 5th Information Technology and Mechatronics Engineering Conference (ITOEC), Chongqing, China, 12–14 June 2020. [Google Scholar]
- Tekin, N.; Acar, A.; Aris, A.; Uluagac, A.S.; Gungor, V.C. Energy consumption of on-device machine learning models for IoT intrusion detection. Internet Things 2023, 21, 100670. [Google Scholar] [CrossRef]
- Liu, D.; Kong, H.; Luo, X.; Liu, W.; Subramaniam, R. Bringing AI to edge: From deep learning’s perspective. Neurocomputing 2022, 485, 297–320. [Google Scholar] [CrossRef]
- Kallimani, R.; Pai, K.; Raghuwanshi, P.; Iyer, S.; López, O.L. TinyML: Tools, applications, challenges, and future research directions. Multimed. Tools Appl. 2024, 83, 29015–29045. [Google Scholar] [CrossRef]
- Golpayegani, F.; Chen, N.; Afraz, N.; Gyamfi, E.; Malekjafarian, A.; Schäfer, D.; Krupitzer, C. Adaptation in Edge Computing: A review on design principles and research challenges. ACM Trans. Auton. Adapt. Syst. 2024; just accepted. [Google Scholar]
Disclaimer/Publisher’s Note: The statements, opinions and data contained in all publications are solely those of the individual author(s) and contributor(s) and not of MDPI and/or the editor(s). MDPI and/or the editor(s) disclaim responsibility for any injury to people or property resulting from any ideas, methods, instructions or products referred to in the content. |
© 2024 by the authors. Licensee MDPI, Basel, Switzerland. This article is an open access article distributed under the terms and conditions of the Creative Commons Attribution (CC BY) license (https://creativecommons.org/licenses/by/4.0/).