Abstract
Recent advances in computer science and geomatics have enabled the digitalization of complex two-dimensional and three-dimensional spatial environments and the sharing of geospatial data on the web. Simultaneously, the widespread adoption of Internet of Things (IoT) technology has facilitated the rapid deployment of low-cost sensor networks in various scientific applications. The integration of real-time IoT data acquisition in 3D urban environments lays the foundation for the development of Urban Digital Twins. This work proposes a possible low-cost solution as a sample of a structure for 3D digital twinning on the web, presenting a case study related to weather monitoring analysis. Specifically, an indoor-outdoor environmental conditions monitoring system integrated with 3D geospatial data on a 3D WebGIS platform was developed. This solution can be considered as a first step for monitoring human and environmental wellness within a geospatial analysis system that integrates several open-source modules that provide different kinds of information (geospatial data, 3D models, and IoT acquisition). The structure of this system can be valuable for municipalities and private stakeholders seeking to conduct environmental geospatial analysis using cost-effective solutions.
1. Introduction
The development of increasingly performant network connections has made it possible in recent years to share complex and voluminous datasets over the internet. The ability to share big data over the network and the speed at which this type of information can be exchanged still pose a challenge in many application sectors. While connections are becoming more efficient, the volume of data to manage is also increasing [1].
In the field of geomatics, for example, the widespread use of a large number of high-resolution images for photogrammetric reconstruction of complex areas or the use of laser scanners for acquiring high-density point clouds has revolutionized and opened new avenues in surveying operations [2,3,4,5,6,7,8]. However, it has also multiplied the size of datasets for managing this data [9]. Point clouds, high-resolution textured 3D models, and parametric Building Information Modeling (BIM) models are now types of highly complex 3D datasets, the sharing of which over the network remains a challenge [10,11,12,13].
At the same time, the recent spread of fast internet connections led researchers to develop new ways to share complex 3D datasets on the web, employing WebGL technologies based on JavaScript graphic libraries [10,11,13,14,15]. Within these systems, it is possible to load complex 3D datasets such as point clouds or textured polygon meshes. It is thus possible to incorporate into the platform the results of a survey campaign from laser scanners or photogrammetric reconstruction, with the aim of sharing and visualizing 3D models online. To achieve this result, it is necessary to upload the models themselves onto the server and call them within the .html page through the insertion of appropriate JavaScript strings. The size of the models that can be shared is limited by the browser’s capabilities. The larger the size of the models to be displayed, the slower the online visualization, with the risk of crashing the web page. Therefore, the digitizations to be shared online must be properly optimized.
Even in the field of web dissemination of geospatial data, Geographic Information Systems (GIS), initially developed within local software, have become a fundamental tool for managing complex geospatial datasets online (WebGIS), associating georeferenced geometric information with semantic information loaded onto servers and accessible remotely [16,17]. The development of web-accessible GIS platforms, or WebGIS, has enabled the management of geospatial data in various fields of application, including transportation [18], atmospheric pollution monitoring [19], remote sensing [20], building energy analysis [21], cultural heritage enjoyment [22], etc.
Within this context, the recent development and diffusion of sensing technologies, particularly IoT (Internet of Things) devices, have provided fundamental added value in the development of GIS, offering the ability to retrieve, analyze, and process real-time data over the internet within WebGIS platforms [23].
Real-time analysis led researchers to focus their interest on the development of territorial Digital Twin applications, which are not merely visualization and data-sharing tools but 3D geospatial representations that resemble the behaviors of real artifacts [24]. Indeed, the concept of the digital twin, which initially matured in the industrial field of automation engineering, is based on creating a digital replica of an existing model connected in real-time with its real counterpart for analysis and control purposes [25].
The object of this research contribution analyzes the framework of a basic 3D Urban Digital Twinning structure developed with open-source technology and low-cost sensor solutions for online monitoring of environmental home wellness (humidity and temperature periodic indoor and outdoor measurements). In fact, the maintenance of appropriate levels of humidity and temperature is essential for obtaining human comfort in both indoor and outdoor environments. In particular, if indoor environments typically achieve the state of comfort within a temperature range of 22 °C to 27 °C and a relative humidity between 30% and 60%, outdoor environments depend on several factors, including temperature, humidity, wind speed, and solar radiation [26,27].
The focus of the research is to provide a framework based on open-source modules able to visualize real-time historic sensor acquisition in a 3D Urban Digital Twin structure on the web. This type of structure allows for the real-time analysis and processing of complex geospatial datasets and shows how it is possible to develop a low-cost digital twin structure, useful for researchers and specialists. Compared to recent literature examples of digital twinning experimentations based on open-source WebGL technology [28,29,30,31], this solution is not based on a prepackaged solution but integrates the open-source libraries using the source code in order to avoid web browsing issues on client web navigation and to freely customize the structure.
The next paragraph will present a literature review analysis in this field, and then the framework of the system will be described, considering the relationships between components and their composition. Subsequently, the results brought by this type of technology will be considered, analyzing the strengths and challenges still to be addressed in this field. Finally, conclusions consider possible future improvements in this field of research.
2. Literature Review
The spread of WebGIS applications offered new possibilities for territorial monitoring and analysis purposes applied in different scenarios: water quality analysis [32], seismic risk analysis [33], real-time power grid control [34], power plant localization [35], cultural heritage valorization [36], natural hazard management [37], and coastal erosion analysis [38]. The recent development of UDT has enabled real-time analysis and processing within GIS [39], giving rise to City Information Models (CIM) [40] and, more generally, digital twin cities [41,42]. The adoption of CIM surely represents a precious instrument for urban planning operations, but, at the same time, some challenges such as limited interoperability, scarce data quality, and insufficient computing resources still limit its diffusion [43].
In some cases, the development of public participatory GIS systems has also allowed for the direct acquisition of data entered by citizens, facilitating the gathering of large amounts of widely distributed data [44,45]. However, the downside of using these participatory systems lies in the challenge of verifying the reliability of acquired data and addressing privacy issues [46,47].
In this regard, it is necessary to underline that from 2018 the (date on which the law becomes effective), the General Data Protection Regulation (GDPR) (EU) 2016/679 is a security and privacy law that regulates the permission that regards the sharing of in-house parameters, with a particular focus on parameters that contain personal or sensitive data [48]. GDPR guarantees that any data related to inhabitants is processed transparently and lawfully and with the explicit consent of individuals. Furthermore, the principles of data minimization require that only the necessary and anonymized data can be shared to avoid personal identification.
In light of what was seen before, territorial management today requires the integration of complex datasets from various sources (survey activities, citizen information, sensing, 3D models, etc.) through the use of web-accessible platforms where data can be visualized and analyzed in its geospatial context [11]. In this case the multiscale 2D/3D levels of visualizations [49] and the possibility of a flexible rendering of 3D environments [50] represent an important strategy to adopt for the improvement of remote exploration of 3D geospatial information, allowing the integration of different sources. The multiplicity and large size of overlapping datasets allow the management and the integration of UDT data complex, especially considering that such platforms are intended not only for visualization but also for analysis and processing of incoming data [39]. Similarly, the need to integrate complex geospatial data is a growing requirement in various research and industrial sectors. In fact, relevant software solutions are investing their technology in UDT [51,52]. Considering this scenario, the development of open-source solutions led to an opportunity to ensure sustainable technological development for managing geospatial datasets, supported by the development of open standards by the Open Geospatial Consortium (OGC). This policy aligns perfectly with the development of IoT sensor technologies, which have enabled the experimentation of complex sensor networks using low-cost technology [53], and open-source geospatial and digital twinning solutions [54,55,56]. In fact, the recent research in UDT development focuses interest on open-source technology integration to reduce the costs of these complex structures [57,58,59].
3. Materials and Methods
In general, a web-accessible 3D geospatial information system presents a general structure connected with different modules that implement additional functions. As previously mentioned, this contribution focuses on the implementation of open-source solutions for 3D Urban Digital Twinning applications using low-cost sensor network data integration (temperature and humidity) for indoor and outdoor wellness monitoring. The case study (Figure 1) used as an example considers an apartment located in an urban residential building located in Palermo (Italy).
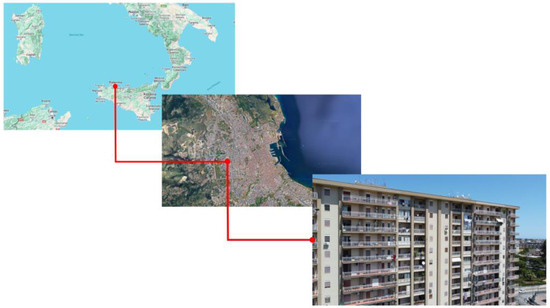
Figure 1.
Localization of the case of study used in the experimentation.
The UDT system is structured in two connected sections: the data module and the visualization module (Figure 2). The data module provides the sensor network acquisition, the storage of the dataset inside a relational database, and the real-time web connection framework based on Python modules. The visualization module provides the 3D web visualization of the data acquisition inside its geospatial context to contextualize and localize the sensor acquisition inside the apartment, the apartment inside the building, and, finally, the building in the surrounding urban environment.
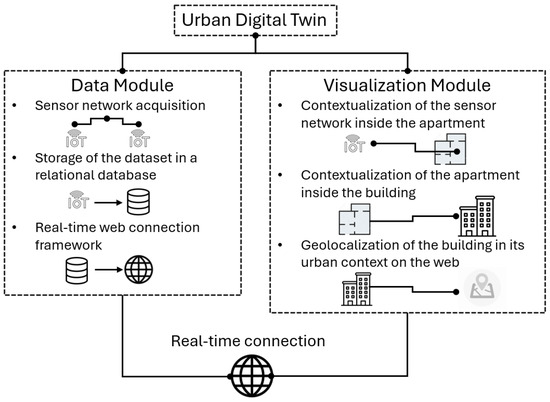
Figure 2.
The structure of the Urban Digital Twin.
Considering web visualization, the main view starts from an urban-scale WebGIS visualization, the general level, comprehensive of the geospatial localization of the building inside the surrounding environment. Then a popup link is provided to visualize the building in detail, with a popup link indicating the sensor network localization inside the structure. This level was named building level. Then, the next level of visualization, the apartment level, shows a horizontal section of the apartment with two popup elements that indicate the outdoor and the indoor sensor positions. This level of visualization integrates an .html window that shows the last five real-time temperature and humidity sensor information acquisitions loaded in the relational database.
3.1. The Data Module
As previously stated, in recent years, technological advancements in sensor technology, particularly the development of IoT technology, have facilitated real-time data acquisition by sensor networks of various origins. The acquisition of data from IoT networks represents an additional module to be integrated into the 3D geospatial information system, and furthermore, it represents a fundamental piece for the development of an urban-scale Digital Twin. The real-time acquisitions can be stored in a relational database in order to preserve the historical trend of the measurements. The historical data can be integrated into WebGIS visualization, linking the information with a popup connection with the database developed in JavaScript. The real-time data can be retrieved and instantly visualized through the creation of a file in Json or GeoJson format and the implementation of specific JavaScript strings within the .html page [11].
In this experiment, the Govee humidity and temperature low-cost sensor network was chosen for testing the functioning of the platform (Figure 3). The network provided two sensors that were located in a civil apartment, respectively, one outdoor and one indoor. In this way it was possible to study the basic level of wellness of the environments considered and, at the same time, provide useful information about the possibility of the occurrence of mold in the apartment. The sensor network allowed the extraction of the data over time acquired, with the possibility to choose different intervals of data extraction. The network allows the exportation of data in csv. format. In this way, it was possible to store the dataset in a relational database system.
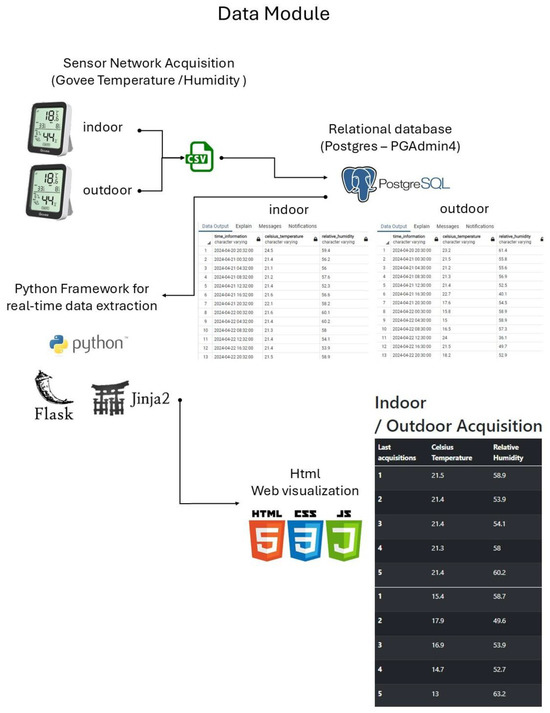
Figure 3.
The data module (from sensor network acquisition to web visualization).
In our case, PostgresSql with the PgAdmin interface was used for the storage of the dataset. Once the implementation of the real-time dataset acquisition in the Postgres database was defined, the connection with the visualization mode was obtained using the Flask micro web framework based on the Werkzeug and Jinja2 utility libraries for Python. This framework allows the development of web applications and APIs and can be integrated with other frameworks and tools. Werkzeug is a WSGI (web server gateway tnterface) that allows developers to handle HTTP requests and responses. Jinja2 is a modern templating engine for Python 3.11.5 that can generate dynamic HTML content.
Flask allowed us to build a Python module that defined the data to extract from Postgres and the route of the reference .html page where the data should be shown.
In detail, a local Python script was activated in a conda environment running in the Anaconda opensource platform. This script defined the URLs of the scripts stored in Apache web server that define the connection to the Postgres database and the structure of the reference .html page. This script launched the Flask application that allowed the real-time web visualization of the data on the port http://127.0.0.1:5000 (accessed 7 April 2025) and its subfolder (Figure 4).
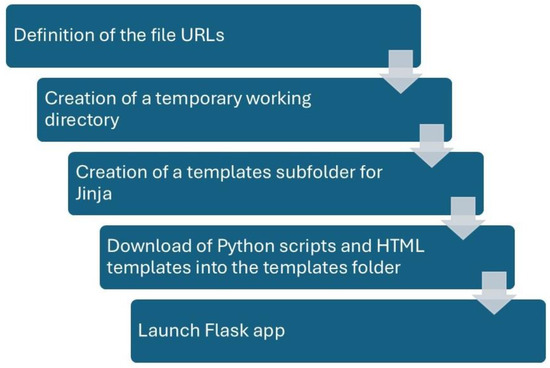
Figure 4.
The structure of the Python script that activates the web visualization of the measurements stored in the Postgres database.
The quality of the system was tested with 3 different slots of data loaded from the Postgres database, with 5, 50, and 500 strings of measurements.
The reference .html page was structured on the basis of the Python scripts stored in the Apache web server, and connected with a popup link to the 3D web visualization of the apartment level (Figure 5). This page allowed us to visualize the measurements of the indoor and outdoor humidity and temperature acquisitions loaded in Postgres.
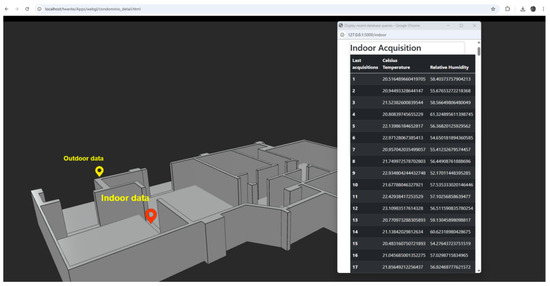
Figure 5.
The popup connection (in red) between the 3D web visualization of the apartment level (stored in the Apache web server) and the reference .html page generated with Flask.
Maintaining active the Anaconda platform, Postgres database, and Apache web server, it is possible to implement the network in real time until the Python module and Postgres stay active.
3.2. The Web Visualization Module
The general structure of the web visualization module was hosted within the Apache server, allowing both local and remote access. As mentioned before, the module is divided into three levels of visualization: general level, building level, and apartment level.
Each level of visualization is developed using different WebGL JavaScript libraries according to the needs required by the corresponding level of visualization (Figure 6). Furthermore, each level of visualization contains different 3D datasets locally or remotely provided (Figure 7).
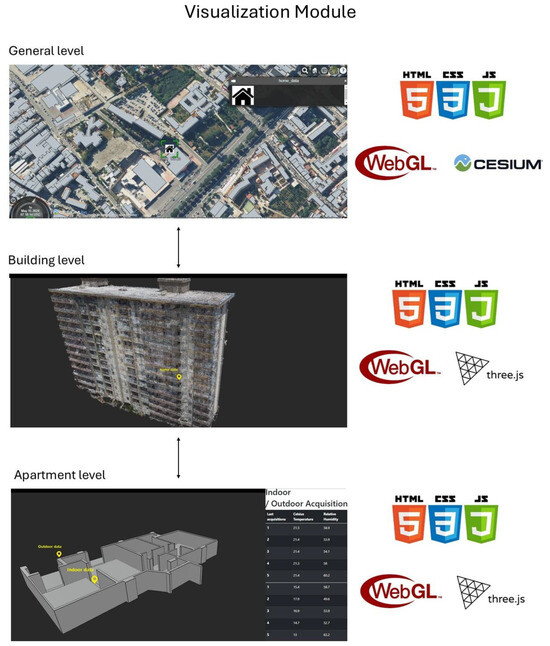
Figure 6.
The different connected levels of the web visualization and the employed technologies.
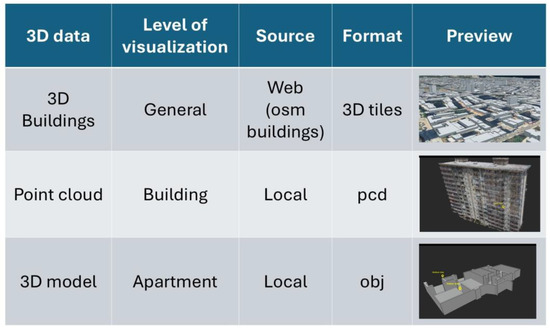
Figure 7.
The 3D integrated dataset in each level of web visualization.
The general level of visualization of the system was developed inside an .html environment with the implementation of open-source WebGL JavaScript graphic libraries that enable the creation of a georeferenced 3D environment based on a three-dimensional virtual simulation of the Earth’s surface. In this case, Cesium.js libraries were chosen as an open-source solution. The geospatial data integrated in this level of visualization was the 3D building dataset freely online shared by OpenStreetMap (link: https://osmbuildings.org/, accessed 7 April 2025), which allowed us to contextualize the building inside the surrounding environment. The coordinate system employed in geospatial visualization is the World Geodetic System 1984 (WGS 84). A popup symbol was integrated into WebGIS visualization in correspondence with the shape of the building, allowing the connection with the building level of visualization.
Considering the building level of visualization, it was developed inside an .html environment with the implementation of open-source WebGL JavaScript graphic libraries. However, in this case, Three.js libraries were more suitable for the building scale visualization. In fact, Three.js libraries represent a more compliant solution for the customization of a 3D visualization of a point cloud environment on the web [37]. For this reason, Three.js libraries were preferred to Cesium.js libraries, which, instead, are more compliant for an urban-scale 3D visualization inside a 3D WebGIS environment [47]. The 3D digitalized dataset integrated in this visualization consisted of the 3D point cloud representation of the building that hosts the apartment object of the experimentation. The visualization contained a popup link in correspondence to the apartment where the sensor network is installed.
The 3D point cloud was obtained through the photogrammetric reconstruction of the building based on SfM (Structure from Motion) algorithms. SfM was applied to a dataset of 325 images with a resolution of 4000 × 2250 pixels obtained from an Unmanned Aerial Vehicle (UAV) survey acquisition. This operation was carried out with a DJI Mavic mini 2 drone. The point cloud was further clustered and simplified in CloudCompare open-source Software, uniformly subsampling the geometric information in order to reduce the size of the .pcd file from 5.718.837 points to 495.233 points. The reduction of the size was mandatory to obtain a lighter 3D point cloud model useful for being hosted in the web visualization environment. A tiled simplified visualization of the point cloud was loaded into the Cesium Ion platform in order to be implemented as a tileset in the general level of visualization with the correct latitude and longitude coordinates, according to the WG84 Geospatial Reference System.
The next and last level of visualization, the apartment level, similar to the previous level is contained inside the .html environment the implementation of Three.js WebGL JavaScript libraries. In this level of visualization, the 3D digitalized dataset was the 3D model that represents the horizontal section of the apartment with two popup elements that indicate the placement of the indoor and outdoor sensors. Also in this case, a schematic 3D visualization of the apartment was chosen in order to safeguard the quality of web navigation for client web browser visualization. Each popup provides a link to the corresponding real-time HTML visualization of the IoT acquisition stored in the database. In this way, it is possible to visualize in real-time the IoT sensor acquisition provided by the data module (on the right side of the page) by clicking on the corresponding link of the 3D web visualization of the apartment level.
4. Discussions and Results
The experimental solution developed in this work is a possible low-cost solution for the generation of an Urban Digital Twinning platform with an IoT sensor network dataset integrated. The development of low-cost Urban Digital Twin solutions represents one of the main topics in urban planning for the development of a smarter urban management framework [27,60]. The studied example considered the wellness monitoring of an apartment, connecting basic temperature and humidity data provided from the sensor network (and stored in a database) with the 3D web visualization of the apartment inside its urban geospatial context. The aim of the research was the development of a low-cost solution for the connection of real-time IoT data with a geospatial 3D visualization. Simple web accessibility and the open-source technology employed can facilitate the diffusion of this framework for several urban applications. In the case of study 3, different slots of temperature and humidity measurements were loaded in the web visualization from the Postgres database, containing 5, 50, and 500 measurements. Checking the LCP (Largest Contentful Paint) parameter, the loading times of the webpage ranged between 0.08 and 0.22 s. It can be considered a satisfying result that underlines the efficiency of the framework. The LCP was checked also in the visualization modules, from the general level to the apartment level, obtaining a maximum level of 0.5 s in the WebGIS visualization.
The entire system was developed on a laptop with an 11th Gen Intel(R) Core(TM) i7-1185G7 @ 3.00GHz processor, 16 GB of RAM, and an NVIDIA GeFORCE GTX 1650 graphic card. The system runs on the client side, employing the WebGL capabilities now widely common to the main web browsers (Chrome, Firefox, Safari).
The case study can be considered a demonstration example of the developed framework that can be implemented in the future to study other factors to consider in wellness monitoring, such as the presence and the dimension of thermal bridges in the environment or the number of inhabitants inside the rooms.
Anyway, the development of a 3D geospatial information system using open-source technology, while on one hand representing a valuable and increasingly necessary tool in various fields of application, on the other hand still presents some challenges. The open-source solutions, certainly sustainable for fair technology and research development, have limitations due to their complexity of use. It is necessary, in fact, to possess scripting skills to edit in different web languages (html, php, JavaScript, css) and not work through the graphical interface of the software. Furthermore, the insertion of 3D data from survey activities is limited by browser capabilities and requires specific data optimization processing to reduce dataset size while preserving necessary geometric information. In fact, the amount of 3D data to be visualized in each .html page still represents a challenge that can be overcome by linking the main page to satellite pages, as in the web structure of the presented work. In this way, a multiscale visualization system can be achieved, which represents an additional module implementable within the platform. Operationally, it is necessary to insert a system of pop-up elements within the main page that allow connection to the satellite pages via links, always through the implementation of JavaScript strings. Satellite pages can be developed using WebGL technology, although not necessarily using even the same libraries in all the visualizations. For example, if the main page is developed using the open-source libraries of Cesium.js, satellite pages, where the model is viewed at a detailed scale, can be developed using the open-source libraries of Three.js. The use of different libraries is sometimes necessary because the capabilities offered by each library are different, and for each scale of visualization, it may be appropriate to use one library over another.
The implementation of real-time sensor connection also requires additional programming skills in the Python language. However, the freedom to implement any type of operation on georeferenced data and transfer them in real-time to the system makes this type of solution very useful in multiple fields of application. Traffic analysis, urban-level energy analysis, territory monitoring for hydrogeological risk, and building monitoring are just some of the possible applications of this type of system.
It is necessary to underline that there are other interesting open-source solutions recently employed by developers involved in digital twinning and web fruition of 3D datasets [28,29,30,31]. These solutions can be considered more suitable because they do not require scripting skills by developers, basing their framework on prepackaged WebGL solutions. Indeed, these solutions present some weaknesses that regard the worse performance in terms of quality in web browsing navigation and limited possibilities of integrations (not present if developers work directly with the original code). Comparing the present work with other similar recent cases of study [10,11], this integrates a data framework based on open-source technology to analyze and visualize in real-time datasets provided by IoT sensors, connecting a web server, a Python platform, and a database management system. Furthermore, the LCP analysis provided a stable web metric to measure the speed of navigation and, in general, the quality of web browsing.
The shown solution, with IoT-Urban Digital Twin integrations in a WebGL globe-based environment, represents a standardized and maintainable application because it is based on a totally HTML5-compliant system and is developed with diffused open-source solutions such as the PostgreSQL database, Anaconda Python platform, Apache web server, and WebGL based JavaScript libraries. It stays in the world of new UDT experimentations, where some solutions consider virtual and augmented reality implementations employing the Unity 3D graphic engine [61], while others integrate API-based geospatial datasets and 3D city models in game engine environments [62]. Recent experiments also considered hybrid solutions for 3D urban visualization, combining commercial software suites and, in parallel, open-source code based on the C++ language [58].
In the future, a further element that can be integrated into the structure of the system is a computational module that, based on the data uploaded from the IoT network and the data present in the georeferenced system, can process real-time data in Python, providing results to be visualized in the 3D information system. Following our framework, these computations can be implemented using open-source Python modules (such as Pandas and Geopandas) capable of loading data from the relational database, initiating processing, and inserting the result back into the database in a georeferenced environment. The datasets thus generated can be uploaded to a geographic server, such as the open-source Geoserver platform, which allows visualization within the 3D information system through WMS connection.
The possibilities of UDT data integration are several, as the involved scientific sectors represent the core for the development of smart cities [63].
5. Conclusions and Open Scenarios
The developed UDT solution integrated complex 3D geospatial information layers with the real-time acquisition of IoT sensor networks that provided wellness monitoring data related to indoor and outdoor acquisition. Inside the system it was possible to upload datasets from geographic servers, 3D models, point clouds generated from survey activities, and information layers from sensor networks (real-time displayed directly in the model). In this solution, the dataset extracted from a network of sensors was stored in a Postgres database and real-time connected with the web visualization by open-source modules stored in the web server and developed in Python language. The existing limitations for the full utilization of this type of technology concern the size of 3D datasets that can be visualized within each web page and the quality of the network connection that determines system efficiency. The ability to integrate different types of datasets and analyze data remotely in real-time from a web platform with a 3D interface makes these systems very useful for future developments, where the sensor analysis component will play an increasingly predominant role.
The low-cost nature of the framework led us to consider this basic structure a possible solution to consider in the future for a participative approach, where the geospatial dataset collected by citizens can be stored and evaluated in real-time on a web platform.
The case of monitoring indoor and outdoor temperature was an example for testing the framework of the structure, based on open-source technologies and low-cost IoT solutions. Future integration will consider the expansion of the proposed framework to more complex IoT structures, with big data acquisitions, to concern big data digital twinning solutions.
Furthermore, the recent development of real-time artificial intelligence processing (machine learning and deep learning) may open up new possibilities for real-time visualization of Python-based operations inside UDT structures.
Funding
This research received no external funding.
Data Availability Statement
The raw data supporting the conclusions of this article will be made available by the authors on request.
Conflicts of Interest
The authors declare no conflict of interest.
References
- Sagiroglu, S.; Sinanc, D. Big data: A review. In Proceedings of the International Conference on Collaboration Technologies and Systems (CTS), San Diego, CA, USA, 20–24 May 2013; pp. 42–47. [Google Scholar] [CrossRef]
- Masiero, A.; Costantino, D. TLS for detecting small damages on a building façade. Int. Arch. Photogramm. Remote Sens. Spatial Inf. Sci. 2019, XLII-2/W11, 831–836. [Google Scholar] [CrossRef]
- Ebolese, D.; Lo Brutto, M.; Dardanelli, G. The integrated 3D survey for underground archaeological environment. Int. Arch. Photogramm. Remote Sens. Spatial Inf. Sci. 2019, XLII-2/W9, 311–317. [Google Scholar] [CrossRef]
- Alsadik, B.; Karam, S. The Simultaneous Localization and Mapping (SLAM)-An Overview. J. Appl. Sci. Technol. Trends 2021, 2, 147–158. [Google Scholar] [CrossRef]
- Toschi, I.; Rodriguezgonzalvez, P.; Remondino, F.; Minto, S.; Orlandini, S.; Fuller, A. Accuracy Evaluation of a Mobile Mapping System with Advanced Statistical Methods. ISPRS Int. Arch. Photogramm. Remote Sens. Spat. Inf. Sci. 2015, 5, 245–253. [Google Scholar] [CrossRef]
- Betti, M.; Bonora, V.; Galano, L.; Pellis, E.; Tucci, G.; Vignoli, A. An Integrated Geometric and Material Survey for the Conservation of Heritage Masonry Structures. Heritage 2021, 4, 585–611. [Google Scholar] [CrossRef]
- Pepe, M.; Fregonese, L.; Scaioni, M. Planning airborne photogrammetry and remote-sensing missions with modern platforms and sensors. Eur. J. Remote Sens. 2018, 51, 412–436. [Google Scholar] [CrossRef]
- Zollini, S.; Alicandro, M.; Dominici, D.; Quaresima, R.; Giallonardo, M. UAV Photogrammetry for Concrete Bridge Inspection Using Object-Based Image Analysis (OBIA). Remote Sens. 2020, 12, 3180. [Google Scholar] [CrossRef]
- Pirotti, F.; Piragnolo, M.; Vettore, A.; Guarnieri, A. Comparing Accuracy of Ultra-Dense Laser Scanner and Photogrammetry Point Clouds. Int. Arch. Photogramm. Remote Sens. Spatial Inf. Sci. 2022, XLIII-B1-2022, 353–359. [Google Scholar] [CrossRef]
- Aricò, M.; La Guardia, M.; Lo Brutto, M. 3D Data Integration for Web Fruition of Underground Archaeological Sites: A Web Navigation System for the Hypogeum of Crispia salvia (Marsala, Italy). Heritage 2023, 6, 5899–5918. [Google Scholar] [CrossRef]
- La Guardia, M.; Koeva, M.; Díaz-Vilariño, L.; Nourian, P. Open-Source Solutions for Real-Time 3D Geospatial Web Integration. Int. Arch. Photogramm. Remote Sens. Spatial Inf. Sci. 2024, XLVIII-4-2024, 289–295. [Google Scholar] [CrossRef]
- Zhan, W.; Chen, Y.; Chen, J. 3D Tiles-Based High-Efficiency Visualization Method for Complex BIM Models on the Web. ISPRS Int. J. Geo-Inf. 2021, 10, 476. [Google Scholar] [CrossRef]
- Liu, Z.; Gu, X.; Dong, Q.; Tu, S.; Li, S. 3D Visualization of Airport Pavement Quality Based on BIM and WebGL Integration. J. Transp. Eng. Part B Pavements 2021, 147, 04021024. [Google Scholar] [CrossRef]
- Resch, B.; Wohlfahrt, R.; Wosniok, C. Web-based 4D visualization of marine geo-data using WebGL. Cartogr. Geogr. Inf. Sci. 2014, 41, 235–247. [Google Scholar] [CrossRef]
- Gaspari, F.; Ioli, F.; Barbieri, F.; Rivieri, C.; Dondi, M.; Pinto, L. Rediscovering Cultural Heritage Sites by Interactive 3D Exploration: A Practical Review of Open-Source WebGl Tools. Int. Arch. Photogramm. Remote Sens. Spatial Inf. Sci. 2023, XLVIII-M-2-2023, 661–668. [Google Scholar] [CrossRef]
- Brovelli, M.A.; Negretti, M. MapServer e servizi web: Introduzione e prime verifiche. Boll. Della Soc. Ital. Fotogramm. Topogr. 2006, 4, 9–23. [Google Scholar]
- Van Oosterom, P.; Stoter, J.; Quak, W.; Zlatanova, S. The Balance Between Geometry and Topology. In Advances in Spatial Data Handling; Richardson, D.E., Oosterom, P., Eds.; Springer: Berlin/Heidelberg, Germany, 2002. [Google Scholar] [CrossRef]
- Santoso, M.; Gulemar, R.G.; Irawan, B. Development of the WebGIS application for transport infrastructure management in the city of Serang. IOP Conf. Ser. Mater. Sci. Eng. 2019, 673, 012072. [Google Scholar] [CrossRef]
- Yakubailik, O.E.; Kadochnikov, A.A.; Tokarev, A.V. WEB Geographic Information System and the Hardware and Software Ensuring Rapid Assessment of Air Pollution. Optoelectron. Instrument. Proc. 2018, 54, 243–249. [Google Scholar] [CrossRef]
- Piragnolo, M.; Pirotti, F.; Zanrosso, C.; Lingua, E.; Grigolato, S. Responding to Large-Scale Forest Damage in an Alpine Environment with Remote Sensing, Machine Learning, and Web-GIS. Remote Sens. 2021, 13, 1541. [Google Scholar] [CrossRef]
- Amado, M.; Poggi, F.; Ribeiro Amado, A.; Breu, S. E-City Web Platform: A Tool for Energy Efficiency at Urban Level. Energies 2018, 11, 1857. [Google Scholar] [CrossRef]
- Vacca, G.; Fiorino, D.R.; Pili, D. A Spatial Information System (SIS) for the Architectural and Cultural Heritage of Sardinia (Italy). ISPRS Int. J. Geo-Inf. 2018, 7, 49. [Google Scholar] [CrossRef]
- Congiu, E.; Desogus, G.; Frau, C.; Gatto, G.; Pili, S. Web-Based Management of Public Buildings: A Workflow Based on Integration of BIM and IoT Sensors with a Web–GIS Portal. Buildings 2023, 13, 1327. [Google Scholar] [CrossRef]
- Tomko, M.; Winter, S. Beyond digital twins—A commentary. Environ. Plan. B Urban Anal. City Sci. 2019, 46, 395–399. [Google Scholar] [CrossRef]
- Singh, M.; Fuenmayor, E.; Hinchy, E.P.; Qiao, Y.; Murray, N.; Devine, D. Digital Twin: Origin to Future. Appl. Syst. Innov. 2021, 4, 36. [Google Scholar] [CrossRef]
- Felemban, E.; Majid, A.R.M.A.; Rehman, F.U.; Lbath, A. Low-Cost Digital Twin Framework for 3D Modeling of Homogenous Urban Zones. In Intelligent Computing; Lecture Notes in Networks and Systems; Arai, K., Ed.; Springer: Cham, Switzerland, 2021; Volume 284. [Google Scholar] [CrossRef]
- Arsad, F.S.; Hod, R.; Ahmad, N.; Baharom, M.; Ja’afar, M.H. Assessment of indoor thermal comfort temperature and related behavioural adaptations: A systematic review. Environ. Sci. Pollut. Res. 2023, 30, 73137–73149. [Google Scholar] [CrossRef]
- Panchal, S.; Raval, P.; Shetty, S.; Ambadekar, S. College 3D Model Rendering Using Three JS. In Proceedings of the 5th International Conference on Advances in Science and Technology (ICAST), Mumbai, India, 2–3 December 2022; pp. 142–147. [Google Scholar] [CrossRef]
- Azfar, T.; Weidner, J.; Raheem, A.; Ke, R.; Cheu, R.L. Efficient Procedure of Building University Campus Models for Digital Twin Simulation. IEEE J. Radio Freq. Identif. 2022, 6, 769–773. [Google Scholar] [CrossRef]
- Azhari, F.F.; Priyana, Y.; Fikriyah, V.N. 3D modeling for flood inundation height mapping based on QGIS and WebGIS in Surakarta. IOP Conf. Ser. Earth Environ. Sci. 2025, 1462, 012060. [Google Scholar] [CrossRef]
- Pavelka, K.; Landa, M. Using Virtual and Augmented Reality with GIS Data. ISPRS Int. J. Geo-Inf. 2024, 13, 241. [Google Scholar] [CrossRef]
- Balla, D.; Zichar, M.; Kiss, E.; Szabó, G.; Mester, T. Possibilities for Assessment and Geovisualization of Spatial and Temporal Water Quality Data Using a WebGIS Application. ISPRS Int. J. Geo-Inf. 2022, 11, 108. [Google Scholar] [CrossRef]
- Mazzei, M.; Quaroni, D. Development of a 3D WebGIS Application for the Visualization of Seismic Risk on Infrastructural Work. ISPRS Int. J. Geo-Inf. 2022, 11, 22. [Google Scholar] [CrossRef]
- He, Y.; Zhang, Y.; Zhang, Y.; Fang, C.; Huang, K.; Han, X. Design and Implementation of Real-time Power Grid WebGIS Visualization Framework Based on New Generation Dispatching and Control System. J. Phys. Conf. Ser. 2021, 2087, 012073. [Google Scholar] [CrossRef]
- Koutroulis, E.; Petrakis, G.; Agou, V.; Malisovas, A.; Hristopulos, D.; Partsinevelos, P.; Tripolitsiotis, A.; Halouani, N.; Ailliot, P.; Boutigny, M.; et al. Site selection and system sizing of desalination plants powered with renewable energy sources based on a web-GIS platform. Int. J. Energy Sect. Manag. 2022, 16, 469–492. [Google Scholar] [CrossRef]
- Spreafico, A.; Chiabrando, F.; Della Coletta, C. 3D WebGIS Applications for Digital Humanities Studies: The Turin 1911 Project. Int. Arch. Photogramm. Remote Sens. Spatial Inf. Sci. 2023, XLVIII-M-2-2023, 1501–1508. [Google Scholar] [CrossRef]
- Daud, M.; Ugliotti, F.M.; Osello, A. Comprehensive Analysis of the Use of Web-GIS for Natural Hazard Management: A Systematic Review. Sustainability 2024, 16, 4238. [Google Scholar] [CrossRef]
- Capolupo, A.; Monterisi, C.; Saponieri, A.; Addona, F.; Damiani, L.; Archetti, R.; Tarantino, E. An Interactive WebGIS Framework for Coastal Erosion Risk Management. J. Mar. Sci. Eng. 2021, 9, 567. [Google Scholar] [CrossRef]
- Weil, C.; Bibri, S.E.; Longchamp, R.; Golay, R.; Alahi, A. Urban Digital Twin Challenges: A Systematic Review and Perspectives for Sustainable Smart Cities. Sustain. Cities Soc. 2023, 99, 104862. [Google Scholar] [CrossRef]
- Xue, F.; Wu, L.; Lu, W. Semantic enrichment of building and city information models: A ten-year review. Adv. Eng. Inform. 2021, 47, 101245. [Google Scholar] [CrossRef]
- Deng, T.; Zhang, K.; Shen, Z. A systematic review of a digital twin city: A new pattern of urban governance toward smart cities. J. Manag. Sci. Eng. 2021, 6, 125–134. [Google Scholar] [CrossRef]
- Martella, A.; Ramadan, A.I.H.A.; Martella, C.; Patano, M.; Longo, A. State of the Art of Urban Digital Twin Platforms. In Extended Reality. XR Salento 2023; Lecture Notes in Computer Science; De Paolis, L.T., Arpaia, P., Sacco, M., Eds.; Springer: Cham, Switzerland, 2023; Volume 14218. [Google Scholar] [CrossRef]
- Bigorra, J.F.; Casals, M.; Gangolells, M. The adoption of urban digital twins. Cities 2022, 131, 103905. [Google Scholar] [CrossRef]
- Cárdenas, I.; Koeva, M.; Davey, C.; Nourian, P. Solid Waste in the Virtual World: A Digital Twinning Approach for Waste Collection Planning. In Recent Advances in 3D Geoinformation Science. 3DGeoInfo 2023; Lecture Notes in Geoinformation and Cartography; Kolbe, T.H., Donaubauer, A., Beil, C., Eds.; Springer: Cham, Switzerland, 2024. [Google Scholar] [CrossRef]
- Radil, S.M.; Jiao, J. Public Participatory GIS and the Geography of Inclusion. Prof. Geogr. 2016, 68, 202–210. [Google Scholar] [CrossRef]
- Hasanzadeh, K.; Kajosaari, A.; Häggman, D.; Kyttä, M. A context sensitive approach to anonymizing public participation GIS data: From development to the assessment of anonymization effects on data quality. Comput. Environ. Urban Syst. 2020, 83, 101513. [Google Scholar] [CrossRef]
- Lee, A.; Lee, K.-W.; Kim, K.-H.; Shin, S.-W. A Geospatial Platform to Manage Large-Scale Individual Mobility for an Urban Digital Twin Platform. Remote Sens. 2022, 14, 723. [Google Scholar] [CrossRef]
- GDPR. General Data Protection Regulation (GDPR). 2018. Available online: https://gdpr.eu/ (accessed on 19 March 2025).
- Aricò, M.; Dardanelli, G.; La Guardia, M.; Lo Brutto, M. Three-Dimensional Documentation and Virtual Web Navigation System for the Indoor and Outdoor Exploration of a Complex Cultural Heritage Site. Electronics 2024, 13, 2833. [Google Scholar] [CrossRef]
- Fascia, R.; Barbieri, F.; Gaspari, F.; Ioli, F.; Pinto, L. PONTI: An Open WebGL-Based Tool in Support to Defect Analysis and 3D Visualisation of Bridges. In Bridge Maintenance, Safety, Management, Digitalization and Sustainability; Sandager Jensen, J., Frangopol, D.M., Wittrup Schmidt, J., Eds.; CRC Press: Boca Raton, FL, USA, 2024; pp. 2353–2361. [Google Scholar]
- Wray, S. Bentley Systems and Microsoft team up on city digital twins, Cities Today. 2020. Available online: https://cities-today.com/bentley-systems-and-microsoft-team-up-on-digital-twins/ (accessed on 17 May 2024).
- Shariatpour, F.; Behzadfar, M. Digital Twin: A Step Towards Smart Cities in Urban Planning, Design and Management. Soffeh 2022, 32, 93–106. [Google Scholar] [CrossRef]
- Scianna, A.; Gaglio, G.F.; La Guardia, M. Structure Monitoring with BIM and IoT: The Case Study of a Bridge Beam Model. ISPRS Int. J. Geo-Inf. 2022, 11, 173. [Google Scholar] [CrossRef]
- Mangiameli, M.; Cappello, A.; Mussumeci, G. A new bridge management system based on spatial database and open source GIS. Environ. Syst. Decis. 2023, 44, 500–513. [Google Scholar] [CrossRef]
- Coetzee, S.; Ivánová, I.; Mitasova, H.; Brovelli, M.A. Open Geospatial Software and Data: A Review of the Current State and A Perspective into the Future. ISPRS Int. J. Geo-Inf. 2020, 9, 90. [Google Scholar] [CrossRef]
- Autiosalo, J.; Siegel, J.; Tammi, K. Twinbase: Open-Source Server Software for the Digital Twin Web. IEEE Access 2021, 9, 140779–140798. [Google Scholar] [CrossRef]
- Naserentin, V.; Somanath, S.; Eleftheriou, O.; Logg, A. Combining Open Source and Commercial Tools in Digital Twin for Cities Generation. IFAC-PapersOnLine 2022, 55, 185–189. [Google Scholar] [CrossRef]
- Yeon, H.; Eom, T.; Jang, K.; Yeo, j. DTUMOS, digital twin for large-scale urban mobility operating system. Sci. Rep. 2023, 13, 5154. [Google Scholar] [CrossRef]
- Park, S.; Kim, J.; Kim, Y.; Kang, J. Participatory Framework for Urban Pluvial Flood Modeling in the Digital Twin Era. Sustain. Cities Soc. 2024, 108, 105496. [Google Scholar] [CrossRef]
- Zhong, T.; Meng, X. Effect of Air Temperature in Indoor Transition Spaces on the Thermal Response of Occupant during Summer. Sci. Rep. 2025, 15, 919. [Google Scholar] [CrossRef] [PubMed]
- Del Campo, G.; Saavedra, E.; Piovano, L.; Luque, F.; Santamaria, A. Virtual Reality and Internet of Things Based Digital Twin for Smart City Cross-Domain Interoperability. Appl. Sci. 2024, 14, 2747. [Google Scholar] [CrossRef]
- Rantanen, T.; Julin, A.; Virtanen, J.-P.; Hyyppä, H.; Vaaja, M.T. Open Geospatial Data Integration in Game Engine for Urban Digital Twin Applications. ISPRS Int. J. Geo-Inf. 2023, 12, 310. [Google Scholar] [CrossRef]
- Yang, S.; Kim, H. Urban digital twin applications as a virtual platform of smart city. Int. J. Sustain. Build. Technol. Urban Dev. 2021, 12, 363–379. [Google Scholar] [CrossRef]


Disclaimer/Publisher’s Note: The statements, opinions and data contained in all publications are solely those of the individual author(s) and contributor(s) and not of MDPI and/or the editor(s). MDPI and/or the editor(s) disclaim responsibility for any injury to people or property resulting from any ideas, methods, instructions or products referred to in the content. |
© 2025 by the author. Licensee MDPI, Basel, Switzerland. This article is an open access article distributed under the terms and conditions of the Creative Commons Attribution (CC BY) license (https://creativecommons.org/licenses/by/4.0/).