Article

Seed and Seedling Detection Using Unmanned Aerial Vehicles and Automated Image Classification in the Monitoring of Ecological Recovery

1
ARC Centre for Mine Site Restoration, School of Molecular and Life Sciences, Curtin University, Kent Street, Bentley, WA 6102, Australia
2
Spatial Sciences, School of Earth and Planetary Sciences, Curtin University, Kent Street, Bentley, WA 6102, Australia
*
Author to whom correspondence should be addressed.
Drones 2019, 3(3), 53; https://doi.org/10.3390/drones3030053
Submission received: 15 May 2019 / Revised: 26 June 2019 / Accepted: 27 June 2019 / Published: 28 June 2019

Abstract

:
Monitoring is a crucial component of ecological recovery projects, yet it can be challenging to achieve at scale and during the formative stages of plant establishment. The monitoring of seeds and seedlings, which represent extremely vulnerable stages in the plant life cycle, is particularly challenging due to their diminutive size and lack of distinctive morphological characteristics. Counting and classifying seedlings to species level can be time-consuming and extremely difficult, and there is a need for technological approaches offering restoration practitioners with fine-resolution, rapid and scalable plant-based monitoring solutions. Unmanned aerial vehicles (UAVs) offer a novel approach to seed and seedling monitoring, as the combination of high-resolution sensors and low flight altitudes allow for the detection and monitoring of small objects, even in challenging terrain and in remote areas. This study utilized low-altitude UAV imagery and an automated object-based image analysis software to detect and count target seeds and seedlings from a matrix of non-target grasses across a variety of substrates reflective of local restoration substrates. Automated classification of target seeds and target seedlings was achieved at accuracies exceeding 90% and 80%, respectively, although the classification accuracy decreased with increasing flight altitude (i.e., decreasing image resolution) and increasing background surface complexity (increasing percentage cover of non-target grasses and substrate surface texture). Results represent the first empirical evidence that small objects such as seeds and seedlings can be classified from complex ecological backgrounds using automated processes from UAV-imagery with high levels of accuracy. We suggest that this novel application of UAV use in ecological monitoring offers restoration practitioners an excellent tool for rapid, reliable and non-destructive early restoration trajectory assessment.

1. Introduction

Ecological restoration is an intentional activity that initiates or accelerates the recovery of an ecosystem with respect to its health, integrity and sustainability [1]. In order to identify whether recovery efforts result in acceptable trajectories toward a desired reference endpoint (e.g., plant communities are establishing towards predetermined targets or goals, usually a resilient, functional and self-sustaining ecosystem), restoration projects undertake ongoing monitoring of a wide range of environmental parameters [2]. However, these diverse parameters often require monitoring at different spatial and temporal scales.
Monitoring needs can be idiosyncratic and complex between different sites, as project requirements can be influenced by factors such as substrate, local vegetation communities and local geomorphology [3]. Examinations of developing plant communities, such as plant establishment from broadcast seeds, species diversity, canopy cover and plant performance, are increasingly becoming commonly desired monitoring outcomes for ecological restoration projects [4,5].
High levels of mortality during the seed germination, seedling emergence and early establishment phases, often exceeding 95%, are considered the most significant bottleneck in ecological restoration [6,7]. The scale of seed-based ecological restoration projects has increased dramatically in recent decades [8], and it is now frequently undertaken in areas where traditional on-foot surveys of seedling emergence and early plant establishment can be challenging (e.g., large post-mining landforms such as waste rock dumps and tailings storage facilities). Additionally, counting and classifying seedlings to species level can be time-consuming and extremely difficult in diverse seedling communities [9,10,11]. As such, there is an increasingly urgent need for technological approaches offering restoration practitioners with fine-resolution, rapid and scalable plant-based monitoring solutions.
Among the suite of new technologies offering advances in ecological monitoring, unmanned aerial vehicles (UAVs) have significant potential for improving plant-based outcomes. The monitoring of vegetation growth and performance greatly benefits from UAV-based remote sensing [12], mainly due to the scales at which monitoring must be undertaken. UAVs are considered the best option for remote sensing at scales up to 250 ha [13], as they offer greater spatial resolution compared with satellite imagery [14], significantly lower operational costs compared with manned aircraft [15], and can be operated in weather conditions that would prevent both satellites and manned aircraft from gathering meaningful data [16,17]. Furthermore, remote sensing using UAVs offer greater repeatability and lower turnaround times than both satellites and manned aircraft [18]. While alternative sensing platforms such as pole photogrammetry may offer utility in the monitoring of fixed and small-scale areas of interest (e.g., vegetation monitoring quadrats), UAV-based remote sensing techniques have been successfully applied to the classification of adult plants (species of invasive trees and shrubs) in bogs and disturbed forest environments [19,20,21], as well as to monitor plant health in a variety of agricultural species [22,23,24,25]. However, the utility of UAVs has been demonstrated almost exclusively in agricultural settings, and little translational research has been undertaken to apply this technology to plant-based monitoring in ecological restoration [26].
This study tested the utility of a small, commercially-available UAV to monitor seed germination and seedling establishment in restoration. We tested the accuracy of eCognition, an object-based image analysis (OBIA) software package, for seed and seedling classification from captured imagery by comparing two OBIA rulesets we developed with the manual object classification of seeds and seedlings on soil surfaces of different color and texture (reflective of local restoration substrates), at multiple flight altitudes. It was hypothesized that OBIA using UAV imagery would readily and effectively discriminate target seeds and seedlings from background soil with a high level of accuracy, but that this accuracy would decrease, and then the rates of false positive classifications would increase, with in turn, increasing background soil complexity (greater texture and lower contrast), increasing cover of non-target seedlings, and increasing flight altitude.

2. Materials and Methods

2.1. Study Site

The study was conducted at the University of Western Australia Shenton Park Field Station, Perth, Western Australia. Unmanned aerial vehicle (UAV) flights were undertaken over a 400 m2 trial area divided into four experimental 100 m2 plots (10 m × 10 m) with different surface treatments representing local restoration substrates in Western Australia (Figure 1).
Surface treatments included a ‘control’ of undisturbed local sandy soil (smooth, homogenous texture and light background color), representative of typical post-mining substrate in Banksia woodland restoration [27]; a ‘textured’ treatment of undisturbed local sandy soil with scattered crushed overburden rock (2–20 cm in size, giving increased surface heterogeneity) used to rock armor the slopes of restoration landforms [28]; a ‘dark’ treatment of undisturbed local sandy soil capped with a 1 cm layer of tailings generated from the processing of magnetite ore [29]; and a ‘high red-ratio’ treatment of undisturbed local sandy soil capped with a 1 cm layer of red clay loam soil from a mine site in the Midwest region of Western Australia [28]. All capping materials were sourced from a major magnetite mining operation located approximately 400 km northeast of Perth, Western Australia. Additionally, to examine whether seed and seedling detection rates were affected by surface topography, half of each treatment plot was manually ripped to a depth of 20 cm, using a backhoe (Figure 1) to mimic standard ripping practices in post-mining restoration [27].
Plots were seeded in September 2017, split into three seeding sub-treatments, representing increasing volumes of broadcast seeds (and, correspondingly, increasing seedling density; Figure 1). The seed mix broadcast included seeds of a target species, Lupinus angustifolia L. (Fabaceae), in a commercial grass species mix comprising Festuca arundinacea Schreb. and Stenotaphrum secundatum (Walter) Kuntze (Poaceae). The target species was selected as its seeds were large (ca. 1 cm) and distinctly colored (white), and its distinctive large, dark green palmate leaves produced from a central stem provided a strong comparison with the small linear leaves of non-target grasses.
The seed mix was intended to represent a potential restoration scenario where monitoring was required for a species of restoration interest with large, distinctly colored seeds and distinctive foliage (e.g., Banksia species, where seeds have been polymer coated [30]) among a matrix of grassy invasive weeds (a situation common in regional restoration initiatives [27]). The seed mix was broadcast at three densities: Low, comprising 15 L. angustifolia seeds and 50 grass seeds per m−2; medium, comprising 25 L. angustifolia and 250 grass seeds per m−2; and high, comprising 50 L. angustifolia and 1000 grass seeds per m−2. In total, 12,000 L. angustifolia seeds were broadcast.
In total, the experimental area comprised a combined 24 sub-treatments (four surface treatments × two ripping sub-treatments × three broadcast seeding densities). Plots were irrigated daily for a 10-week growing season.

2.2. Flights and Image Capture

Manual flights of the study site were conducted daily for the entire 10-week duration of the experiment using a DJI Phantom 4 Pro (Dà-Jiāng Innovations, Shenzhen, China) equipped with a 20 Megapixel red-green-blue (RGB) camera. Each day, flights were conducted at 5, 10 and 15 meter flight altitudes, with 70% sidelap and frontlap. While flight planning software exists that could conduct the flights automatically and with calibrated overlaps, flights were conducted manually, as the low area covered and low flight altitude made such software impractical.

2.3. Image Processing and Classification

Raw images from all UAV flights were stitched together using the Agisoft Photoscan software, to produce RGB-rectified orthomosaics as well as Digital Elevation Models (DEMs) for each flight. The final resolution of orthomosaics was 1.02 mm per pixel for flights undertaken at a 5 m altitude, 2.63 mm per pixel for flights undertaken at the 10 m altitude, and 4.04 mm per pixel for flights undertaken at the 15 m altitude. Manual and automated seed classifications were undertaken on imagery captured the day following broadcast seeding (day 1). Manual image classification was also undertaken daily for all captured imagery to identify the point at which seedlings first became visible in imagery from each flight altitude (e.g., the distinctive palmate leaves of the target species were distinctly identifiable by a manual inspection of orthomosaics). Following the earliest point at which the target seedlings were discernable from the orthomosaics (day 25), total seedling counts were made from daily orthomosaics at each flight altitude until day 68.
For seed classifications, captured orthomosaics of the trial area were split into sub-treatment sections (representing 24 discrete sections), and each sub-treatment section was split into sixteen equal replicates, each representing a 1 m2 area. Five replicates from each sub-treatment section were randomly selected to undertake classification, giving a total of 120 m2 (30% of the trial area) that was examined for seeds. Automated classification of the target seeds from captured imagery was undertaken entirely dependent upon the color and shape of the classified image objects using object-based image analysis (OBIA). Following automated classification, manual classification was undertaken by a visual inspection of the orthomosaics, with all target seeds manually counted to determine the number of missed automated classifications and misclassified seed objects.
Seed Classification Workflow:Image CaptureOrthomosaic GenerationOrthomosaic splitting (24 subtreatments)Subtreatment splitting (16 sections)Random selection of sectionsSections loaded into eCognitionMultiresolution segmentationAutomated seed object classificationManual validation of classification
For seedling classification, each sub-treatment section was split into three equal replicates for manual and automated examination, each representing a ca. 5.3 m2 area. Automated classification of target seedlings from captured imagery was undertaken using two different OBIA methods: “single-date” (utilizing orthomosaics and DEMs generated from RGB imagery from a single point in time, with no post-processing alignment required) and “layered” approaches (utilizing layered ortho-mosaics and DEMs from two different flight times (day 25 and day 68), which requires post-processing alignment).
Single-date classification was undertaken on captured imagery from day 68, after a period of seven consecutive days in which no new seedlings were scored in any treatment at any flight altitude. Seedlings were classified after an initial multiresolution segmentation, with a process in which all objects with a green ratio (defined here as green light intensity divided by total light intensity) above a set threshold, determined by trial and error, were assigned to the ‘target’ class, followed by additional refining of the rule set using Hue-Saturation-Intensity (HSI; for definition see Supplementary S1) transformations, Triangular Greenness Index (TGI, defined here as TGI = RGREEN − 0.39 *RRED − 0.61 *RBLUE [31]), area (of the object, in cm2), compactness (for definition see Supplementary S1), height (represented by the mean difference to neighbor objects in the DEM; see Supplementary S1), perimeter/width and length/width. For each replicate image, the total leaf cover of non-target grass seedlings (including false positive seedling classifications) was used to classify target seedlings for all objects not already classified using green ratio and TGI. Layered classification was undertaken on imagery captured on day 25 as well as imagery captured in the final flight (day 68). Orthomosaics were aligned in QGIS [32] with the ‘georeferencer’ plugin, and were split into discrete sub-treatment sections using the ‘gridsplitter’ plugin. Sections were then layered in eCognition, with target seedlings initially classified using green ratio from day 25 sections, and then this classification was confirmed by a continued presence of the target object in the day 68 sections determined again by green ratio. Manual classification was undertaken by a visual inspection of the orthomosaics following automated classification in all cases (discretely for each flight altitude, by the same observer), with all target seedlings manually counted to determine the number of missed automated classifications and misclassified seedling objects.
Single-date Seedling Classification Workflow:Image CaptureOrthomosaic GenerationOrthomosaic splitting (24 subtreatments)Subtreatment splitting (three sections)Sections loaded into eCognitionMultiresolution segmentationAutomated seedling object classificationManual validation of classification
Layered Seedling Classification Workflow:Image CaptureOrthomosaic GenerationAlignment of orthomosaics from different datesOrthomosaic splitting (24 subtreatments)Subtreatment splitting (3 sections)Sections loaded into eCognitionMultiresolution segmentationAutomated seedling object classificationManual validation of classification
Full rule sets used in classification, and example outputs, are presented in Supplementary S1.

2.4. Statistical Analyses

Dependent variables for seed classification analyses included percentage of correct automated seed classifications (PCAseeds), calculated as the number of correct automated seed classifications in each replicate as a percentage of the total number of seeds manually classified in each replicate, and number of false positive automated seed classifications (FPAseeds), calculated as the number of incorrect automated seed classifications in each replicate (e.g., objects classified as seeds by automated classification that instead represented non-target seed objects). Dependent variables for seedling classification analyses included percentage seedling establishment, calculated as the number of target seedlings classified manually in each replicate from imagery captured at the 5 m flight altitude at day 68 as a percentage of seeds broadcast, percentage of correct automated seedling classifications (PCAseedlings), calculated as the number of correct automated seedling classifications (using OBIA) in each replicate as a percentage of the total number of seedlings manually classified in each replicate (discretely for single-date versus layered classification approaches), and number of false positive automated seedling classifications (FPAseedlings), calculated as the number of incorrect automated seedling classifications (using OBIA) in each replicate (e.g., objects classified as seedlings by automated classification that instead represented non-target seedling objects; independently for single-date versus layered classification approaches). Additionally, the cover of non-target grasses, calculated as the percentage of each classified image representing leaf cover of non-target grass seedlings (excluding false positive seedling classifications) at day 68 (using OBIA) was determined from captured imagery at each flight altitude.
All dependent variables were square root transformed prior to analyses to meet assumptions of normality (assessed by Shapiro-Wilk tests of normality) and homogeneity of variances (as assessed by Levene’s test for equality of variances).
One-way Analyses of Variance (ANOVA) were conducted to determine the effect of flight altitude on PCAseeds, PCAseedlings, FPAseeds and FPAseedlings (independently for single-date versus layered data), and the effect of classification technique (single-date versus layered) on PCAseedlings and FPAseedlings. A two-way ANOVA was conducted to determine the effect of treatment and ripping on percentage seedling establishment using data captured at the 5 m flight altitude. Three-way ANOVA were conducted to determine the effects of surface treatment, ripping and seeding density (i.e., the number of seeds in captured imagery) on PCAseeds and FPAseeds independently for 5 m and 10 m flight altitude data. Three-way ANOVA were also conducted to determine the effects of surface treatment, ripping and seeding density (i.e., the seeding density of non-target seedlings in captured imagery) on PCAseedlings for all flight altitude data combined, and on FPAseedlings independently for 5 m, 10 m and 15 m flight altitude data (single-date classification method), and on PCAseedlings and FPAseedlings independently for 5 m, 10 m and 15 m flight altitude data (layered method). All simple pairwise comparisons were run with a Bonferroni adjustment applied. A two-way ANOVA was conducted to determine the effect of treatment and ripping on cover of non-target grasses, using data captured at the 5 m flight altitude. Linear regression models were fitted to determine the effect of increasing cover of non-target grasses on PCAseedlings and FPAseedlings independently for 5 m, 10 m and 15 m flight altitude data. Data are presented as mean ± standard error, unless otherwise stated.

3. Results

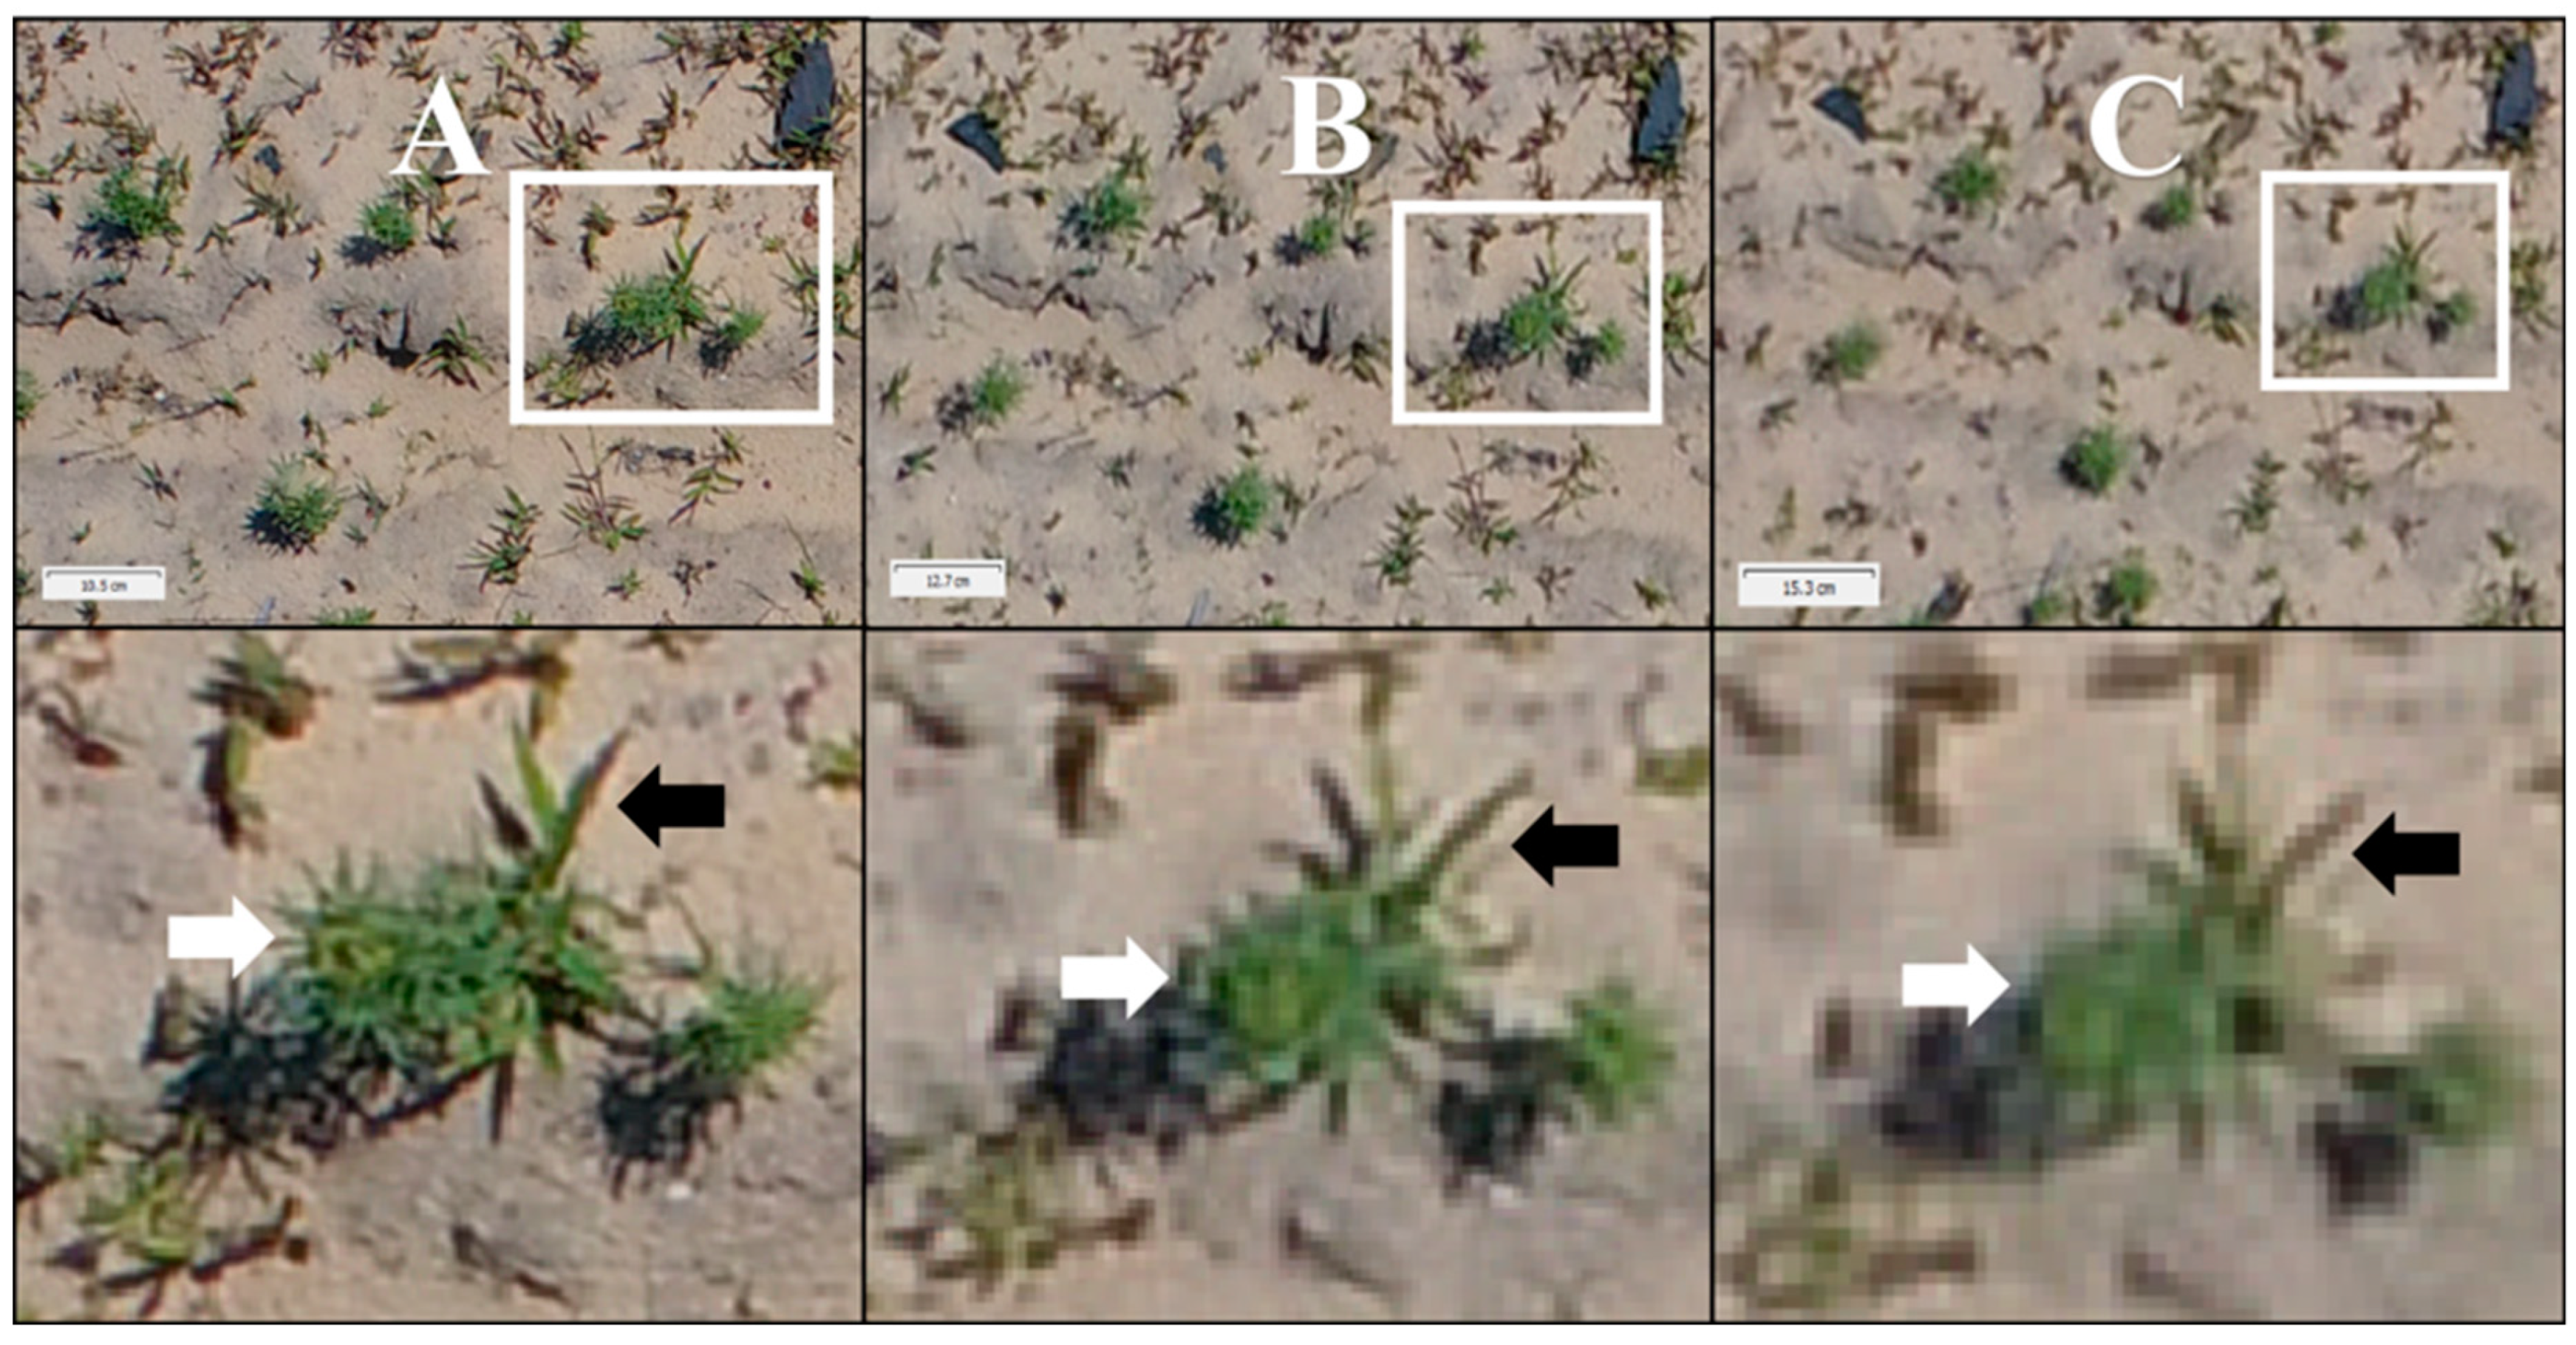
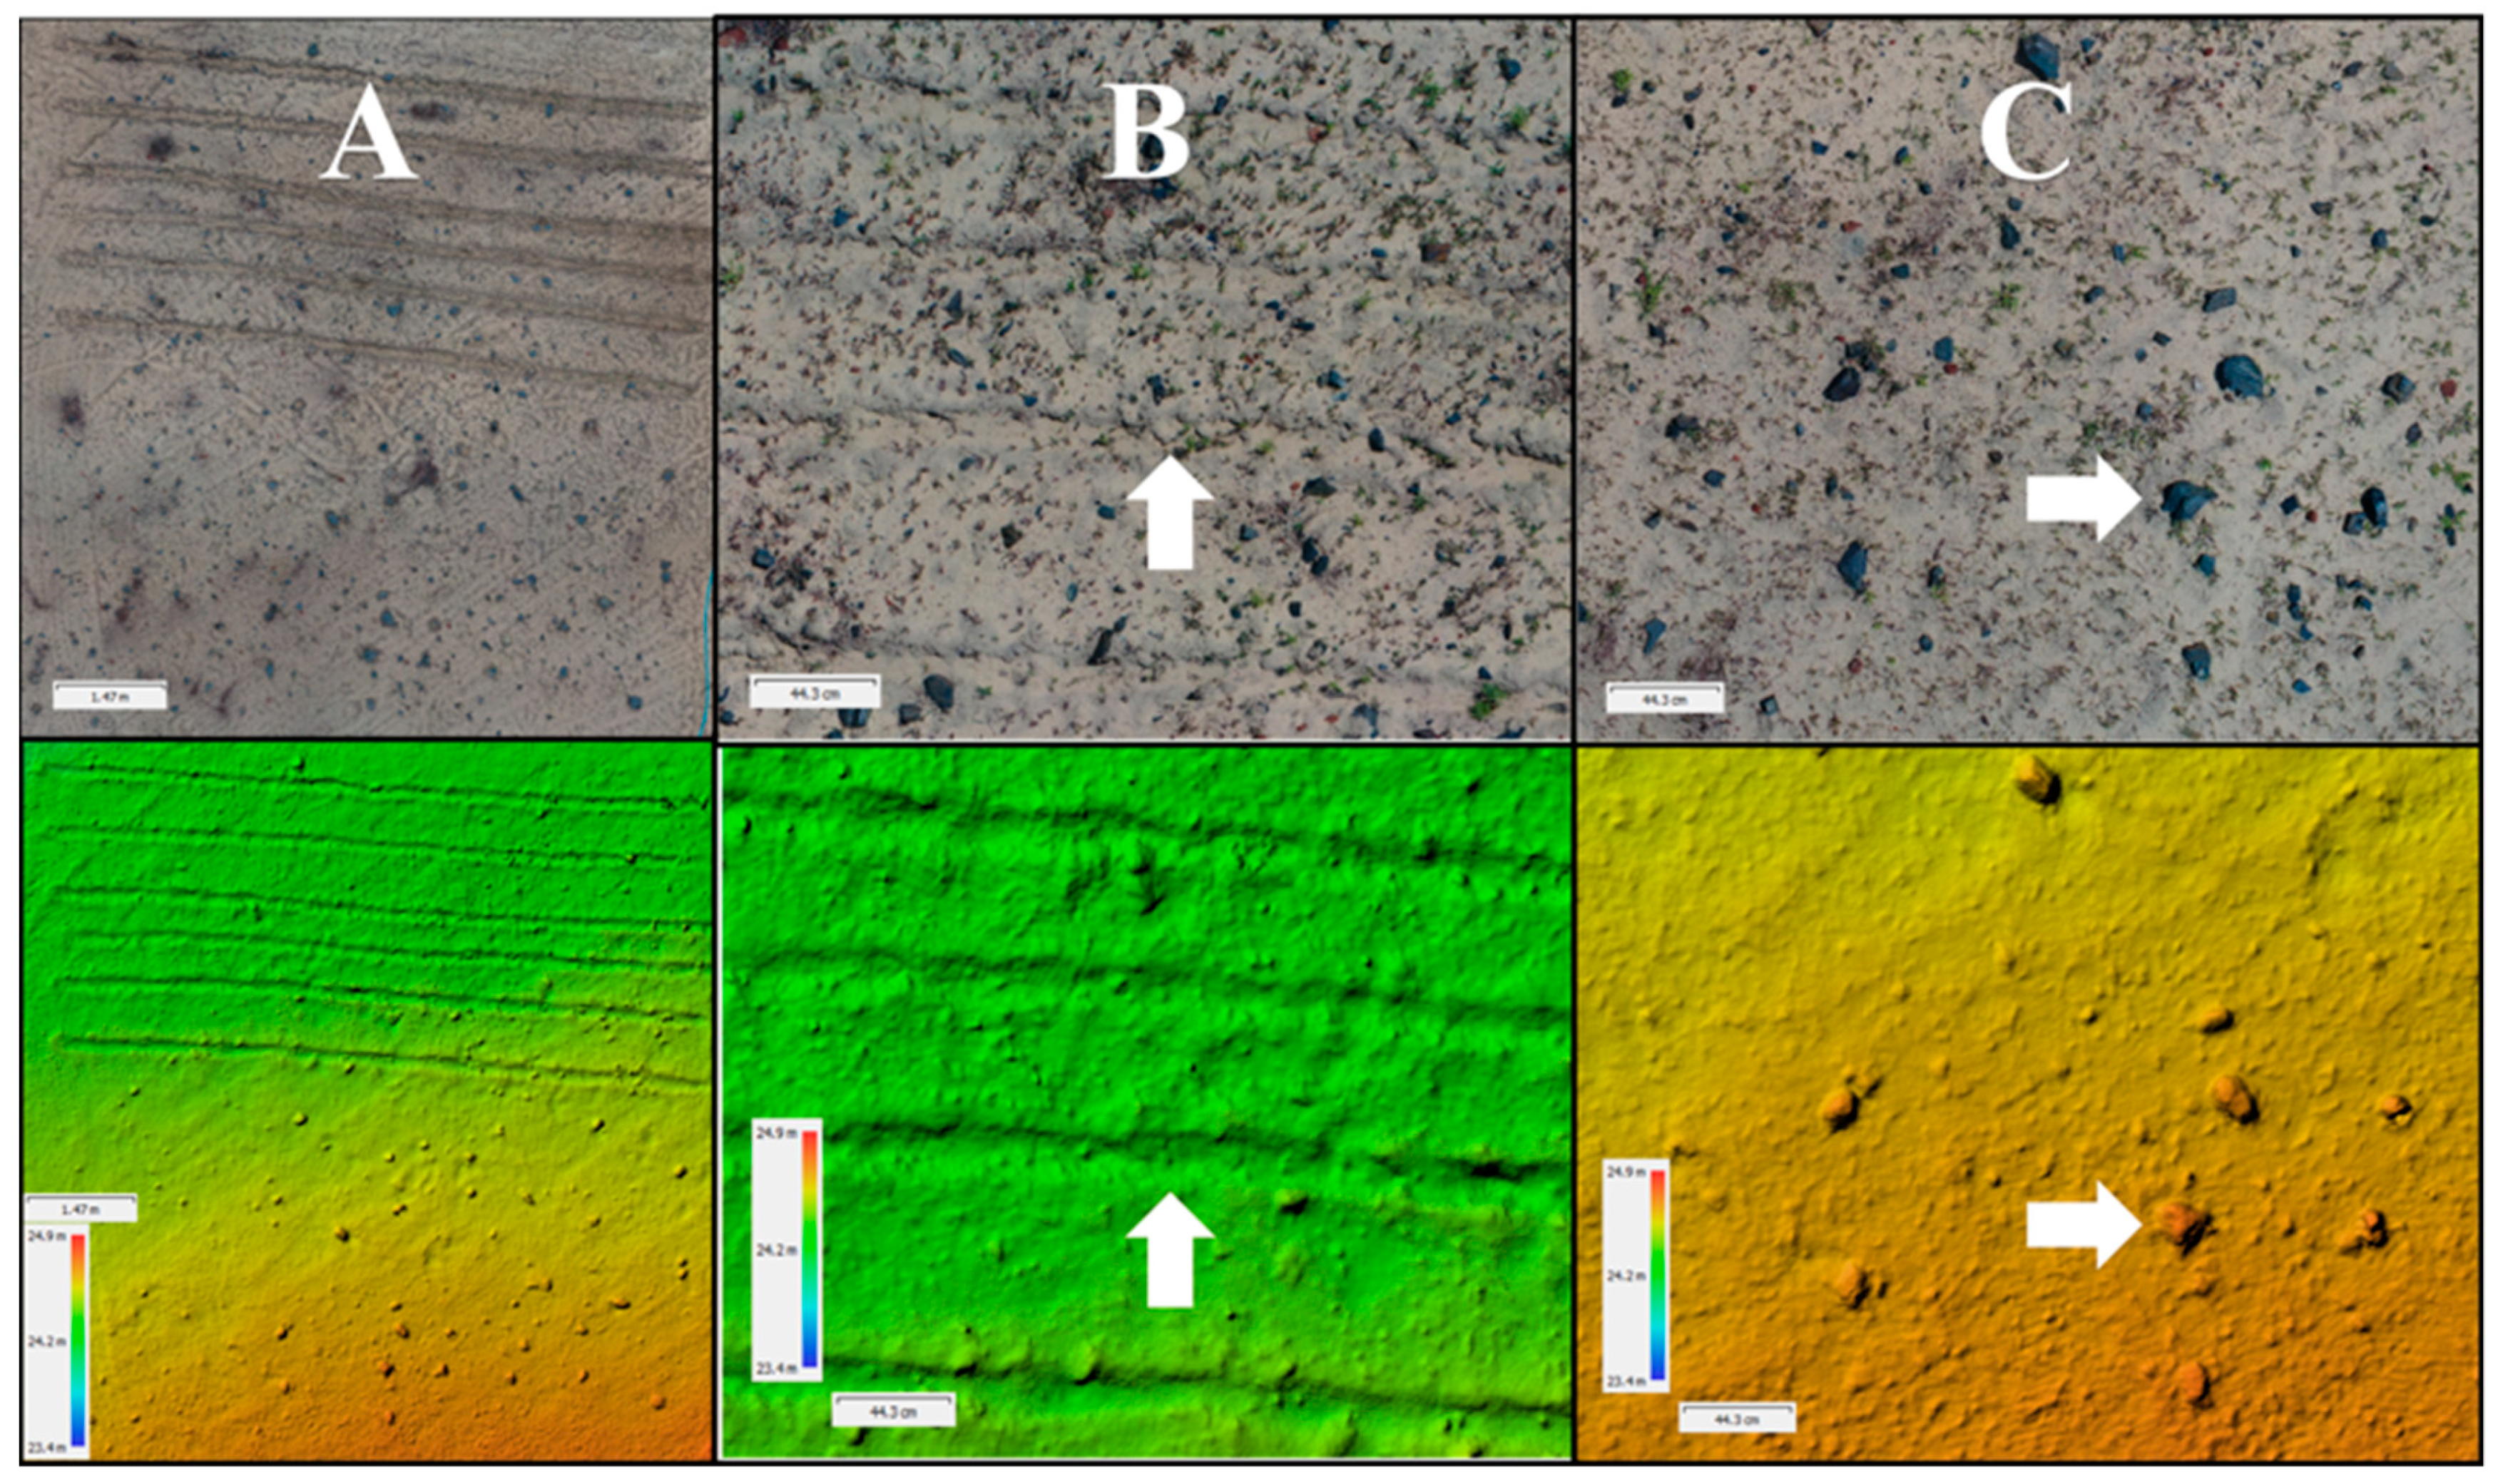
3.1. Classification of Target Seed Objects

A total of 2291 L. angustifolia seeds were manually counted from the 120 m2 of imagery examined from flights at a 5 m altitude (representing ca. 64% of seeds broadcast), and 2274 seeds from imagery captured at 10 m (representing ca. 63% of seeds broadcast). The resolution of imagery captured at 15 m was insufficient to manually or automatically classify seeds with a high level of confidence (Figure 2). The automated classification of seed objects from imagery captured by flights at 5 m was highly accurate, with a global PCAseeds mean of 88 ± 1.0%, and was statistically significantly higher (F = 44.280, P < 0.001) than from imagery captured by flights at 10 m, with a global PCAseeds mean 74 ± 1.7% (95% CI, 70.3% to 77.1%). Similarly, FPAseeds was significantly greater (F = 25.765, P < 0.001) from imagery captured by flights at 10 m, global mean 19 ± 2.5 objects, compared to imagery captured by flights at 5 m, global mean 7 ± 1.4 objects.
There was no statistically significant three-way interaction between surface treatment, ripping and seeding density on PCAseeds from imagery captured at the 5 m flight altitude, F(6, 60) = 0.079, P = 0.380, nor any simple two-way interactions (P > 0.05). There was a statistically significant simple main effect of both surface treatment, F(3, 30) = 6.134, P = 0.001, and ripping, F(1, 60) = 19.693, P < 0.001, on PCAseeds. PCAseeds was generally higher for unripped sub-treatments compared to ripped sub-treatments at the 5 m flight altitude (Figure 3), with the highest values recorded for dark (93 ± 2.8%) and the lowest for high red-ratio (86 ± 3.8%). There was no statistically significant three-way interaction between surface treatment, ripping and seeding density on FPAseeds from imagery captured at this 5 m flight altitude, F(6, 60) = 0.497, P = 0.809, but there was a statistically significant simple two-way interaction between surface treatment and ripping, F(3, 60) = 3.625, P = 0.028. While FPAseeds from imagery at 5 m was zero for control, textured and high red-ratio treatments regardless of ripping, there were 21 ± 9.4 and 33 ± 6.9 falsely classified objects from unripped and ripped dark sub-treatments, respectively.
There was no statistically significant three-way interaction between surface treatment, ripping and seeding density on PCAseeds from imagery captured at the 10 m flight altitude, F(6, 60) = 0.853, P = 0.532, but there was a statistically significant simple two-way interaction between surface treatment and ripping, F(3, 60) = 3.963, P = 0.010. PCAseeds from imagery captured at our 10 m flight altitude was slightly lower (1–3%) in ripped sub-treatments than unripped sub-treatments for control, textured and high red-ratio, but remained >75% (Figure 3), while PCAseeds fell to 65 ± 8.8% and 45 ± 8.8% for unripped and ripped dark sub-treatments, respectively. There was no statistically significant three-way interaction between the surface treatment, ripping and seeding density on FPAseeds from imagery captured at this 10 m flight altitude, F(6, 60) = 1.225, P = 0.300, nor any simple two-way interactions (P > 0.05). There was a statistically significant simple main effect of both surface treatment, F(3, 30) = 162.398, P < 0.001, and ripping, F(1, 60) = 15.131, P < 0.001, on FPAseeds. While FPAseeds from imagery at 10 m was zero for control, it increased from 2 ± 1.3 and 7 ± 2.0 in unripped and ripped textured sub-treatments, respectively, to 7 ± 2.2 and 15 ± 4.8 in unripped and ripped high red-ratio sub-treatments, respectively, and to 52 ± 12.2 and 66 ± 10.6 in unripped and ripped dark sub-treatments, respectively (Figure 3).

3.2. Classification of Target Seedling Objects

A total of 242 L. angustifolia seedlings were manually classified from imagery captured at a 5 m flight altitude, representing an overall seedling establishment rate of ca. 2% of broadcast seeds. A total of 217 target seedlings were manually classified from imagery captured at a 10 m altitude, and 184 target seedlings from imagery captured at the 15 m altitude (Figure 4).
A statistically significant two-way interaction was present between surface treatment and ripping on percentage seedling establishment, F(3, 36) = 6.652, P = 0.001. Higher rates of percentage seedling establishment (increases of ca. 1.5–3%) were reported from ripped compared with unripped sub-treatments in all surface treatments (particularly in ripped dark sub-treatments where percentage seedling establishment reached 4.2 ± 0.2%), except in high red-ratio where values for unripped sub-treatments increased to levels comparable with ripped sub-treatments.
The automated classification of seedlings was significantly more accurate (ca. 10–20% averaged across all sub-treatments and flight altitudes), using single-date classification compared with layered classification, F(1, 404) = 32.430, P < 0.001 (Figure 5). However, layered classification resulted in an average three-fold reduction in false positive classifications, F(1, 430) = 55.708, P < 0.001 (Figure 5).
Automated classification of seedling objects using single-date classification from imagery captured by flights at 5 m was highly accurate. The global PCAseedlings mean was 83 ± 2.3%, and although the classification accuracy was reduced from imagery captured by flights at 10 m (79 ± 2.5%) or 15 m (75 ± 3.2%) the effect of flight altitude on PCAseedlings was not statistically significant, F(2, 72) = 2.049, P = 0.132. The automated classification of seedling objects using layered classification from imagery captured by flights at 5 m was comparably accurate (global PCAseedlings mean of 82 ± 2.1%), but was significantly reduced from imagery captured by flights at 10 m (67 ± 3.2%) and 15 m (38 ± 4.2%), F (2, 205) = 48.424, P < 0.001.
The effect of flight altitude on FPAseedlings using single-date classification was statistically significant (F (2, 213) = 4.030, P = 0.019), with slightly fewer objects misclassified from imagery captured at 15 m (4 ± 0.3 objects) compared with imagery captured at 10 m (6 ± 0.7 objects) or 5 m (7 ± 0.8 objects). This trend was more strongly evident for FPAseedlings using layered classification (F (2, 213) = 39.390, P < 0.001), with fewer objects misclassified from imagery captured at 15 m (0.8 ± 0.14 objects) and from imagery captured at 10 m (global mean 1.4 ± 0.20 objects) than from imagery captured at 5 m (global mean 3.7 ± 0.36 objects).
There was no statistically significant three-way interaction between surface treatment, ripping and seeding density on PCAseedlings using single-date classification, F(6, 105) = 0.985, P = 0.437, but there were statistically significant simple two-way interactions between surface treatment and ripping, F(3, 105) = 3.581, P = 0.015, and surface treatment and seeding density, (3, 67) = 8.601, P = 0.005. PCAseedlings using single-date classification was higher in unripped compared to ripped textured sub-treatments (97 ± 1.5% and 82 ± 2.2%, respectively), but was otherwise comparable between unripped and ripped sub-treatments for all other treatments. PCAseedlings using single-date classification broadly increased with an increasing seeding density, although it remained >70% in all sub-treatments except for low seeding density control (58 ± 4.0%). There was no statistically significant three-way interaction between the surface treatment, ripping and seeding density on PCAseedlings using layered classification, F(6, 105) = 1.193, P = 0.327, nor any statistically significant simple two-way interactions or simple main effects (P > 0.05 in all cases).
There was no statistically significant three-way interaction between surface treatment, ripping and seeding density on FPAseedlings using single-date classification, F(6, 105) = 0.767, P = 0.599, but there was a statistically significant simple two-way interaction between surface treatment and seeding density, F(6, 105) = 3.766, P = 0.004. This interaction effect stemmed predominantly from a 3–4-fold increase in the number of misclassified objects from dark treatment at medium and high seeding density (ca. 20 and 15 objects per image, respectively), compared with low seeding density (ca. 5 objects per image). There was no statistically significant three-way interaction between surface treatment, ripping and seeding density on FPAseedlings using layered classification, F(6, 105) = 1.061, P = 0.399, but there were statistically significant simple two-way interactions between surface treatment and ripping, F(3, 105) = 7.803, P < 0.001, and ripping and seeding density, (3, 67) = 6.044, P = 0.005. FPAseedlings using layered classification remained unchanged at ca. three objects per image for unripped sub-treatments, regardless of seeding density, but increased with seeding density from ca. two objects per image at low seeding density to ca. six objects per image at high seeding density. While FPAseedlings using layered classification generally differed little among ripped sub-treatments by surface treatment, it increased markedly from ca. two objects per image to ca. eight objects per image in unripped and ripped high red-ratio, respectively.
After the 10-week growing period, the mean cover of non-target grasses determined from imagery captured at 5 m was 7 ± 1.1% in low seeding density treatments, 10 ± 0.8 in medium seeding density treatments, and 12 ± 0.8 in high seeding density treatments.
The automated detection of cover of non-target grasses was significantly affected by flight altitude, F(2, 72) = 20.968, P < 0.001, with a lower detection accuracy from imagery captured at 10 m (mean difference 4 ± 0.74%, 95% CI 2.2–5.8, P < 0.001) and 15 m (mean difference 5 ± 0.74%, 95% CI 2.8–6.3, P < 0.001) flight altitudes compared with imagery captured at 5 m.
Linear regression established that PCAseedlings using single-date classification at the 5 m flight altitude was not significantly predicted by cover of non-target grasses, F(1, 64) = 0.016, P = 0.899, and cover of non-target grasses accounted for only 1.5% of the explained variability in PCAseedlings. PCAseedlings was also not significantly predicted by cover of non-target grasses at 10 m, F(1, 66) = 0.269, P = 0.606 (accounting for only 1.1% of the explained variability), or at the 15 m flight altitude, F(1, 62) = 0.355, P = 0.553 (accounting for only 1.0% of the explained variability). Cover of non-target grasses similarly had no statistical effect on PCAseedlings using layered classification at either 5 m flight altitude (F(1, 69) = 0.571, P = 0.453, accounting for only 0.03% of the explained variability), 10 m flight altitude (F(1, 68) = 2.395, P = 0.126, accounting for only 0.1% of the explained variability) or 15 m flight altitude (F(1, 65) = 3.865, P = 0.054, accounting for only 0.2% of the explained variability).
Increasing cover of non-target grasses accounted for 28.8% of the explained variability in FPAseedlings at the 5 m flight altitude using single-date classification, and could statistically significantly predict FPAseedlings, F(1, 70) = 29.773, P < 0.001. The strength of this prediction increased with the increasing flight altitude, with cover of non-target grasses accounting for 46.4% of the explained variability in FPAseedlings at 10 m, F(1, 70) = 60.623, P < 0.001, and for 56.0% of the explained variability in FPAseedlings at 15 m altitude, F(1, 70) = 91.411, P < 0.001. Cover of non-target grasses had no statistical effect on FPAseedlings using layered classification at either 5 m flight altitude (F(1, 70) = 0.102, P = 0.750, accounting for only 0.01% of the explained variability), 10 m flight altitude (F(1, 70) = 0.264, P = 0.609, accounting for only 0.01% of the explained variability) or 15 m flight altitude (F(1, 70) = 0.335, P = 0.565, accounting for only 0.01% of the explained variability).

4. Discussion

Our data suggest that performing OBIA with the eCognition software is a suitable method for classifying and counting both seeds and seedlings. Results from this study provide empirical support for the utility of even low-cost commercially-available UAVs in monitoring ecological recovery, and suggest that UAV-based monitoring of broadcast seeding and seedling establishment can be a viable and effective tool in rehabilitation and ecological restoration. The automated classification of target seeds from the study area was achieved with a high level of accuracy from imagery captured at both 5 m and 10 m flight altitudes. Although this accuracy was reduced at higher altitudes, it should be noted that we employed the 20 megapixel RBG sensor integrated into the commercially-available UAV platform. UAV-mounted sensors will likely become increasingly higher-resolution and affordable with technological improvement [26,33], and undertaking sensing at denser resolution would maintain the accuracy of automated target object classification from imagery obtained at far greater flight altitudes. Not all seeds that were broadcast were classified from captured imagery (64% and 63% of broadcast seeds were classified from imagery captured at 5m and 10 m, respectively), probably due to seed burial during heavy rain the morning following seeding (11.8 mm; www.bom.gov.au, ‘Swanbourne’ weather station 9215) and seed predation by birds. Numerous granivorous birds were observed in the trial area, including Galah (Eolophus roseicapilla) and Western Corella (Cacatua pastinator), and Australian Magpie (Cracticus tibicen) were even captured on UAV imagery in the trial area during sequential flights at 5 m and 15 m altitudes.
OBIA on imagery obtained at 5 m and 10 m flight altitudes provided a high level of accuracy in the automated classification of target seeds (nearly 90% at 5 m, and nearly 75% at 10 m; Figure 3) and target seedlings (ca. 80% at both altitudes; Figure 5) on soil surfaces representing local restoration substrates. The resolution of imagery from flights at the 15 m altitude (4.04 mm per pixel) was too poor for the classification of target seeds (either manually or through automated processes; Figure 2), but remained sufficient for the classification of seedlings (Figure 4), albeit at lower accuracy than 5 and 10 m (ca. 75%). The accuracy of OBIA at classifying seeds was reduced by ca. 14% as the resolution of the imagery decreased from 5 m to 10 m.
Accuracy was slightly lower in dark treatments and in ripped sub-treatments suggesting a significant effect of substrate complexity (e.g., surface texture and color) on classification success.
Rates of false positive classifications were generally very low among treatments (0–10 items m−2), but automated classification of both seeds and seedlings became less successful as the complexity of the non-target background image increased. Rates of false positive classifications for both seeds and seedlings were generally zero or very low for most sub-treatments (<10 objects m−2), but increased markedly as the image resolution decreased for seeds (Figure 3), and as the cover of non-target grasses increased for seedlings. Rated of false positive classifications were highest in dark treatments and in ripped sub-treatments for both seeds (up to ca. 66 objects m−2) and seedlings (up to ca. 20 objects m−2). These high rates likely reflect higher substrate heterogeneity compared with control and textured treatments; as surface cover treatments represented only a one centimeter capping over natural sands, rain over the study period resulted in patchiness in dark and high red-ratio treatments and, thus, less homogeneity compared with other treatments in terms of surface color. This color variability resulted in the manual classification of seeds and seedlings from dark and high red-ratio treatments being more challenging than for control and textured treatments, and a greater number of misclassifications during automated object classification. Future studies should field-test the efficacy of automated seed and seedling classification from imagery captured over real-world restoration trials, as restoration substrates commonly exhibit high surface heterogeneity resulting from land-forming activities, ripping and the inclusion of rocky material and woody debris [29,34].
We present two methods of classifying seedlings from aerial imagery, single-date and layered classification. While these approaches both yielded similar accuracies for target seedling classification from flights undertaken at a 5 m altitude, the accuracy of layered classification declined much more rapidly with the increasing altitude. This suggests that layered classification was significantly more reliant upon high spatial resolution than single-date classification, and may become more viable as sensor resolution improves into the future. However, layered classification also exhibited a markedly lower false positive detection rate than single-date classification, as well as a lack of correlation between the accuracy of target seedling classification and the percentage target area covered by background grasses. This suggests that layered classification may represent a more appropriate method to employ in areas with a high percentage of non-target objects (e.g., high weed coverage), due to the lower prevalence of false positives. Additionally, we employed layered classification solely to classify healthy seedlings—no stress conditions were introduced over the course of the experiment. Future studies could utilize this classification technique to track plant performance in target seedlings over time. This could, for example, allow for the detection of plant performance declines in seedlings, or track the recovery of communities following disturbance events such as droughts or wildfire.
Although our study is not the first to present methods for the automated classification of plants to species level from UAV imagery, previous studies have focused on large, established plants rather than seedlings in early developmental stages [19,20,35]. As seed germination and seedling emergence and early establishment are a critical stage of any restoration project [6,7], developing methods of monitoring this bottleneck phase are critical. Assessments of seedling numbers and species diversity from seed broadcasting efforts are traditionally determined by foot surveys, and UAV-based monitoring represents a significantly faster and lower risk method of undertaking these assessments. While this study focused on a single target species, it represents a successful proof of concept in demonstrating that seedlings of a target species can be classified despite the presence of non-target grasses. Future studies should investigate the viability of this approach when classifying multiple different target species within a more complex background area. Additionally, the ability to provide simultaneous assessments of factors such as weed coverage from captured imagery provides restoration practitioners with a useful tool to achieve multiple restoration monitoring goals in a single pass. However, significantly more research into areas such as developing and testing multi-sensor pods and more robust, reliable UAV platforms is required to realize the full potential of UAV use in ecological monitoring [26].
The techniques described in this study for classifying individual seeds broadcast in restoration areas have significant applicability to large-scale ecological monitoring, as results clearly demonstrate that large and distinctive seeds can be easily be distinguished from background substrates. Restoration projects commonly identify keystone taxa, including rare, threatened or structurally or functionally important species [27], and the seeds of these species are sometimes polymer coated (often in distinctive colors) in order to improve seed delivery or reduce seed predation [29,30]. The monitoring of seeds post broadcasting could be important for adaptive management in ecological restoration [2]; for example, repeated surveys of seeded areas could allow for accurate estimates of seed predation rates, and for examining differences in seedling establishment success among different microhabitats. Microsite availability and diversity can more strongly influence plant species richness at fine scales than seed availability [36], particularly in restoration [34,37], and numerous studies provide evidence that species establishment from seeds is strongly linked to microsite suitability [38,39,40]. UAV-captured imagery can generate a diverse range of ecological data to complement the classification of target objects (e.g., micro-topographic data from DEMs; Figure 6), and quantifying and identifying different microhabitats from aerial imagery prior to broadcast seeding might also allow for more targeted seed delivery. For species with highly specific seed germination biology requirements, which are often rare and threatened species for which seeds are often in limited supply or highly valued [41], ensuring seeds are delivered to the right microsite could maximize establishment, improving restoration outcomes and reducing costs. It should be possible through UAV-based monitoring to follow target geo-referenced individuals through life cycle phases from seed germination and early development to establishment and reproduction, which, when coupled with sensors capturing data relating to plant health and performance, such as hyperspectral and thermal sensors [22,24,26,42], could offer an unprecedented level of resolution in ecological monitoring, particularly for target species of particular interest or value. Given that the agricultural sector has already begun exploring options for UAV-based seed delivery and weed-control methods [43,44], it seems likely that the coming decades will see the rise of increasingly hands-free and increasingly replicable, accurate and reliable approaches to undertaking and monitoring ecological restoration. Further improvement to computer-aided classification techniques, such as more accessible means of utilizing machine learning software, would also improve classification accuracy. This study focused on the classification of large, white seeds (representing a relatively favorable target object in terms of color and contrast), and future work should test the approaches outlined here with smaller and less distinctive seeds. This is likely to require the application of higher resolution sensors, or sensors reliant upon sensing light outside of the visible spectrum. However, it is possible that the application of pelleting and polymer coating technologies sometimes employed in ecological restoration may assist in improving the identification of many smaller and less distinctive seeds if aerial identification of these seeds was desirable.

5. Conclusions

This study provides the first empirical evidence to support the utility of small, consumer grade UAVs as effective tools to monitor seed germination and seedling establishment in ecological restoration. Data show that undertaking OBIA on imagery captured using even low-cost commercially-available UAVs can achieve a high level of accuracy in classifying small target objects such as seeds and seedlings. Additionally, complementary ecological and site data (e.g., microsite topography and landform relief, cover of associated non-target species) can be easily gathered from the same imagery. The use of UAVs and the automated classification of captured sensor data holds great prospects to support ecological monitoring [26], and the application of UAVs to monitoring ecological restoration will increase the reliability, replicability, scale, diversity, speed and accuracy of data collection. This is likely to yield significant long-term cost-savings for restoration practitioners and industry, and has the potential to dramatically improve the quality and success of ecological monitoring efforts. The high spatial resolution required for fine-scale classification and the classification of small objects requires the current generation of UAVs equipped with low-resolution sensor payloads to operate at low altitudes. While the spatial area that can be covered by individual flights is constrained by the interplay between battery life and image footprint width at variable flight altitudes, rapid technological advances in sensor and platform design are likely to improve sensor resolution and improve battery life to increase the UAV operational area [26]. Future studies should explore further opportunities for capturing ecological data using multiple sensors in single flights (such as thermal, multispectral, or hyperspectral sensors), which will improve the amount of information gathered in shorter periods, and bring us closer to a one-pass solution for ecological monitoring.

Supplementary Materials

The following are available online at https://www.mdpi.com/2504-446X/3/3/53/s1, Supplementary S1: Full eCognition rule sets for automated seed and seedling identification from Buters et al. 2019.

Author Contributions

Conceptualization, T.B. and A.C.; methodology, T.B. and A.C.; validation, T.B.; formal analysis, A.C.; investigation, T.B.; data curation, T.B.; writing—original draft preparation, T.B.; writing—review and editing, T.B., A.C., and D.B.; visualization, A.C.; supervision, A.C. and D.B.; project administration, A.C.

Funding

This work was supported by the Australian Government through the Australian Research Council Industrial Transformation Training Centre for Mine Site Restoration (project number ICI150100041).

Acknowledgments

The authors thank Kingsley Dixon and three anonymous reviewers for helpful comments on the manuscript.

Conflicts of Interest

The authors declare no conflict of interest.

References

  1. Society for Ecological Restoration International Science & Policy Working Group. The SER International Primer on Ecological Restoration; Society for Ecological Restoration International: Tucson, AZ, USA, 2004. [Google Scholar]
  2. McDonald, T.; Gann, G.; Jonson, J.; Dixon, K.W. International Standards for the Practice of Ecological Restoration; SER: Washington, DC, USA, 2016. [Google Scholar]
  3. Moreno-de las Heras, M.; Nicolau, J.; Espigares, T. Vegetation succession in reclaimed coal-mining slopes in a Mediterranean-dry environment. Ecol. Eng. 2008, 34, 168–178. [Google Scholar] [CrossRef]
  4. Strohbach, B.J.; Hauptfleisch, M.L.; Green-Chituti, A.; Diener, S.M. Determining rehabilitation effectiveness at the Otjikoto Gold Mine, Otjozondjupa Region, Namibia, using high-resolution NIR aerial imagery. Namib. J. Environ. 2018, 2, 134–146. [Google Scholar]
  5. Johansen, K.; Erskine, P.D.; McCabe, M.F. Using Unmanned Aerial Vehicles to assess the rehabilitation performance of open cut coal mines. J. Clean. Prod. 2019, 209, 819–833. [Google Scholar] [CrossRef]
  6. James, J.J.; Svejcar, T.J.; Rinella, M.J. Demographic processes limiting seedling recruitment in arid grassland restoration. J. Appl. Ecol. 2011, 48, 961–969. [Google Scholar] [CrossRef]
  7. Hallett, L.M.; Standish, R.J.; Jonson, J.; Hobbs, R.J. Seedling emergence and summer survival after direct seeding for woodland restoration on old fields in south-western Australia. Ecol. Manag. Restor. 2014, 15, 140–146. [Google Scholar] [CrossRef]
  8. Nevill, P.; Cross, A.T.; Dixon, K.W. Ethical sourcing of wild seeds - a key issue in meeting global restoration targets. Curr. Biol. 2018, 28, R1378–R1379. [Google Scholar] [CrossRef] [PubMed]
  9. Stucky, J.M. Comparison of two methods of identifying weed seedlings. Weed Sci. 1984, 32, 598–602. [Google Scholar] [CrossRef]
  10. McDonald, A.W.; Bakker, J.P.; Vegelin, K. Seed bank classification and its importance for the restoration of species-rich flood-meadows. J. Veg. Sci. 1996, 7, 157–164. [Google Scholar] [CrossRef]
  11. Hardwick, K.; Healey, J.R.; Elliott, S.; Blakesley, D. Research needs for restoring seasonal tropical forests in Thailand: Accelerated natural regeneration. New For. 2004, 27, 285–302. [Google Scholar] [CrossRef]
  12. Düzgün, H.Ş.; Demirel, N. Remote Sensing of the Mine Environment; CRC Press: Boca Raton, FL, USA, 2011. [Google Scholar]
  13. Felderhof, L.; Gillieson, D. Near-infrared imagery from unmanned aerial systems and satellites can be used to specify fertilizer application rates in tree crops. Can. J. Remote Sens. 2012, 37, 376–386. [Google Scholar] [CrossRef]
  14. Berni, J.; Zarco-Tejada, P.J.; Suarez, L.; Fereres, E. Thermal and Narrowband Multispectral Remote Sensing for Vegetation Monitoring from an Unmanned Aerial Vehicle. IEEE Trans. Geosci. Remote Sens. 2009, 47, 722–738. [Google Scholar] [CrossRef]
  15. Ogden, L.E. Drone ecology. BioScience 2013. [Google Scholar] [CrossRef]
  16. Hunt, J.E.R.; Hively, W.D.; Fujikawa, S.J.; Linden, D.S.; Daughtry, C.S.T.; McCarty, G.W. Acquisition of NIR-Green-Blue Digital Photographs from Unmanned Aircraft for Crop Monitoring. Remote Sens. 2010, 2, 290–305. [Google Scholar] [CrossRef] [Green Version]
  17. Koh, L.P.; Wich, S.A. Dawn of drone ecology: Low-cost autonomous aerial vehicles for conservation. Trop. Conserv. Sci. 2012. [Google Scholar] [CrossRef]
  18. Nishar, A.; Richards, S.; Breen, D.; Robertson, J.; Breen, B. Thermal infrared imaging of geothermal environments and by an unmanned aerial vehicle (UAV): A case study of the Wairakei – Tauhara geothermal field, Taupo, New Zealand. Renew. Energy 2016, 86, 1256–1264. [Google Scholar] [CrossRef]
  19. Knoth, C.; Klein, B.; Prinz, T.; Kleinebecker, T. Unmanned aerial vehicles as innovative remote sensing platforms for high-resolution infrared imagery to support restoration monitoring in cut-over bogs. Appl. Veg. Sci. 2013, 16, 509–517. [Google Scholar] [CrossRef]
  20. Baena, S.; Moat, J.; Whaley, O.; Boyd, D.S. Identifying species from the air: UAVs and the very high resolution challenge for plant conservation. PLoS ONE 2017, 12, e0188714. [Google Scholar] [CrossRef] [PubMed]
  21. Lehmann, J.R.K.; Prinz, T.; Ziller, S.R.; Thiele, J.; Heringer, G.; Meira-Neto, J.A.A.; Buttschardt, T.K. Open-Source Processing and Analysis of Aerial Imagery Acquired with a Low-Cost Unmanned Aerial System to Support Invasive Plant Management. Front. Environ. Sci. 2017, 5. [Google Scholar] [CrossRef] [Green Version]
  22. Berni, J.A.J.; Zarco-Tejada, P.J.; Sepulcre-Cantó, G.; Fereres, E.; Villalobos, F. Mapping canopy conductance and CWSI in olive orchards using high resolution thermal remote sensing imagery. Remote Sens. Environ. 2009, 113, 2380–2388. [Google Scholar] [CrossRef]
  23. Yue, J.; Lei, T.; Li, C.; Zhu, J. The application of unmanned aerial vehicle remote sensing in quickly monitoring crop pests. Intell. Autom. Soft Comput. 2012, 18, 1043–1052. [Google Scholar] [CrossRef]
  24. Calderón, R.; Navas-Cortés, J.A.; Lucena, C.; Zarco-Tejada, P.J. High-resolution airborne hyperspectral and thermal imagery for early detection of Verticillium wilt of olive using fluorescence, temperature and narrow-band spectral indices. Remote Sens. Environ. 2013, 139, 231–245. [Google Scholar] [CrossRef]
  25. Candiago, S.; Remondino, F.; De Giglio, M.; Dubbini, M.; Gattelli, M. Evaluating Multispectral Images and Vegetation Indices for Precision Farming Applications from UAV Images. Remote Sens. 2015, 7, 4026–4047. [Google Scholar] [CrossRef] [Green Version]
  26. Buters, T.M.; Bateman, P.W.; Robinson, T.; Belton, D.; Dixon, K.W.; Cross, A.T. Methodological ambiguity and inconsistency constrain unmanned aerial vehicles as a silver bullet for monitoring ecological restoration. Remote Sens. 2019, 11. [Google Scholar] [CrossRef]
  27. Stevens, J.C.; Rokich, D.P.; Newton, V.J.; Barrett, R.L.; Dixon, K.W. Banksia Woodlands: A Restoration Guide for the Swan Coastal Plain; UWA Publishing: Perth, Australia, 2016. [Google Scholar]
  28. Cross, A.T.; Stevens, J.C.; Sadler, R.; Moreira-Grez, B.; Ivanov, D.; Zhong, H.; Dixon, K.W.; Lambers, H. Compromised root development constrains the establishment potential of native plants in unamended alkaline post-mining substrates. Plant Soil 2018. [Google Scholar] [CrossRef]
  29. Cross, A.T.; Ivanov, D.; Stevens, J.C.; Sadler, R.; Zhong, H.; Lambers, H.; Dixon, K.W. Nitrogen limitation and calcifuge plant strategies constrain the establishment of native vegetation on magnetite mine tailings. Plant Soil 2019. [Google Scholar] [CrossRef]
  30. Turner, S.R.; Pearce, B.; Rokich, D.P.; Dunn, R.R.; Merritt, D.J.; Majer, J.D.; Dixon, K.W. Influence of polymer seed coatings, soil raking, and time of sowing on seedling performance in post-mining restoration. Restor. Ecol. 2006, 14, 267–277. [Google Scholar] [CrossRef]
  31. McKinnon, T.; Hoff, P. Comparing RGB-Based Vegetation Indices with NDVI For Drone Based Agricultural Sensing. AGBX021-17. 2017. Available online: https://agribotix.com/wp-content/uploads/2017/05/Agribotix-VARI-TGI-Study.pdf (accessed on 13 March 2019).
  32. QGIS Development Team. QGIS Geographic Information System. Open Source Geospatial Foundation Project. 2019. Available online: http://qgis.osgeo.org (accessed on 20 February 2019).
  33. Pádua, L.; Vanko, J.; Hruška, J.; Adão, T.; Sousa, J.J.; Peres, E.; Morais, R. UAS, sensors, and data processing in agroforestry: A review towards practical applications. Int. J. Remote Sens. 2017, 38, 2349–2391. [Google Scholar] [CrossRef]
  34. Cross, A.T.; Lambers, H. Young calcareous soil chronosequences as a model for ecological restoration on alkaline mine tailings. Sci. Total Environ. 2017, 607–608, 168–175. [Google Scholar] [CrossRef]
  35. Cao, J.; Leng, W.; Liu, K.; Liu, L.; He, Z.; Zhu, Y. Object-Based Mangrove Species Classification Using Unmanned Aerial Vehicle Hyperspectral Images and Digital Surface Models. Remote Sens. 2018, 10. [Google Scholar] [CrossRef]
  36. Zobel, M.; Otsus, M.; Liira, J.; Moora, M.; Möls, T. Is small-scale species richness limited by seed availability or microsite availability? Ecology 2000, 81, 3274–3282. [Google Scholar] [CrossRef]
  37. Donath, T.W.; Bissels, S.; Hölzel, N.; Otte, A. Large scale application of diaspore transfer with plant material in restoration practice–Impact of seed and microsite limitation. Biol. Conserv. 2007, 138, 224–234. [Google Scholar] [CrossRef]
  38. Hulme, P.E. Natural regeneration of yew (Taxus baccata L.): Microsite, seed or herbivore limitation? J. Ecol. 1996, 84, 853–861. [Google Scholar] [CrossRef]
  39. Dalling, J.W.; Hubbell, S.P. Seed size, growth rate and gap microsite conditions as determinants of recruitment success for pioneer species. J. Ecol. 2002, 90, 557–568. [Google Scholar] [CrossRef]
  40. Mayer, R.; Erschbamer, B. Seedling recruitment and seed-/microsite limitation in traditionally grazed plant communities of the alpine zone. Basic Appl. Ecol. 2011, 12, 10–20. [Google Scholar] [CrossRef]
  41. Merritt, D.J.; Dixon, K.W. Restoration seed banks—A matter of scale. Science 2011, 332, 424–425. [Google Scholar] [CrossRef] [PubMed]
  42. Zarco-Tejada, P.J.; Guillén-Climent, M.L.; Hernández-Clemente, R.; Catalina, A.; González, M.R.; Martín, P. Estimating leaf carotenoid content in vineyards using high resolution hyperspectral imagery acquired from an unmanned aerial vehicle (UAV). Agric. For. Meteorol. 2013, 171–172, 281–294. [Google Scholar] [CrossRef]
  43. Li, J.Y.; Lan, Y.B.; Zhou, Z.Y.; Zeng, S.; Huang, C.; Yao, W.X.; Zhang, Y.; Zhu, Q.Y. Design and test of operation parameters for rice air broadcasting by unmanned aerial vehicle. Int. J. Agric. Biol. Eng. 2016, 9, 24–32. [Google Scholar]
  44. Xue, X.; Lan, Y.; Sun, Z.; Chang, C.; Hoffmann, W.C. Develop an unmanned aerial vehicle based automatic aerial spraying system. Comput. Electron. Agric. 2016, 128, 58–66. [Google Scholar] [CrossRef]
Figure 1. Layout of experimental plots (individual plot area 100 m2) illustrating surface treatments (annotated lettering), ripping sub-treatments (individual rip line indicated by annotated arrow), and broadcast seeding densities. Surface treatments included a ‘control’ of undisturbed local sandy soil (C), a ‘textured’ treatment of undisturbed local sandy soil with scattered crushed overburden rock (T), a ‘dark’ treatment of undisturbed local sandy soil capped with a 1 cm layer of tailings (D), and a ‘high red ratio’ treatment of undisturbed local sandy soil capped with a 1 cm layer of red clay loam soil (R). Broadcast seeding density treatments included low (15 seeds m−2 of target species, 50 seeds m−2 of grasses), medium (25 seeds m−2 of target species, 250 seeds m−2 of grasses) and high (50 seeds m−2 of target species, 1000 seeds m−2 of grasses). The image was taken from an altitude of 20 m using a DJI Phantom 4 Pro UAV.
Drones 03 00053 g001
Figure 2. Variable image resolution used for the classification of target L. angustifolia seeds on the Dark substrate from captured imagery obtained at 5 m (A), 10 m (B) and 15 m (C) flight altitudes using a DJI Phantom 4 Pro unmanned aerial vehicle (UAV). The same region in each image is indicated by a white box, with the same three seeds indicated by annotated arrows.
Drones 03 00053 g002
Figure 3. Percentage of correct automated seed classifications (PCAseeds) and number of false positive automated seed classifications (FPAseeds) among different surface treatments for unripped (filled symbols) and ripped (open symbols) sub-treatments from the imagery obtained at 5 m and 10 m flight altitudes using a DJI Phantom 4 Pro UAV. Control: Undisturbed local sandy soil. Textured: Undisturbed local sandy soil with scattered crushed overburden rock. Dark: Undisturbed local sandy soil capped with a 1 cm layer of mine tailings. High red-ratio: Undisturbed local sandy soil capped with a 1 cm layer of red clay loam soil. Data are presented as mean ± 1 s.e.
Drones 03 00053 g003
Figure 4. Variable image resolution used for classification of target L. angustifolia seedlings and non-target grasses from captured imagery obtained at the 5 m (A), 10 m (B) and 15 m (C) flight altitudes using a DJI Phantom 4 Pro UAV. The same region in each image is indicated by a white box, with the same L. angustifolia seedling (white arrows) and non-target grass seedling (black arrows) indicated.
Drones 03 00053 g004
Figure 5. Comparison of single-date (filled symbols) versus layered (open symbols) classification approaches for percentage of correct automated seedling classifications (PCAseedlings) and number of false positive automated seedling classifications (FPAseedlings) among different surface treatments from imagery obtained at the 5 m and 10 m flight altitudes using a DJI Phantom 4 Pro UAV. Control: Undisturbed local sandy soil. Textured: Undisturbed local sandy soil with scattered crushed overburden rock. Dark: Undisturbed local sandy soil capped with a 1 cm layer of mine tailings. High red-ratio: Undisturbed local sandy soil capped with a 1 cm layer of red clay loam soil. Data are presented as mean ± 1 s.e.
Drones 03 00053 g005
Figure 6. Digital elevation models (DEMs) can offer fine-resolution surface micro-topography data complementing the orthomosaics of target regions (A), with surface textures providing microhabitats for seedling establishment such as ripping contours ((B), arrows indicating an individual rip line) and rocks ((C), arrows indicating an individual rock) shown in relief that may not be easily visible from red-green-blue (RGB) imagery alone. DEMs generated in Agisoft Photoscan Professional from RGB imagery of textured treatment captured at 5 m flight altitude using a DJI Phantom 4 Pro UAV.
Drones 03 00053 g006

