Measuring Wind Speed Using the Internal Stabilization System of a Quadrotor Drone


Abstract
:1. Introduction
2. Method
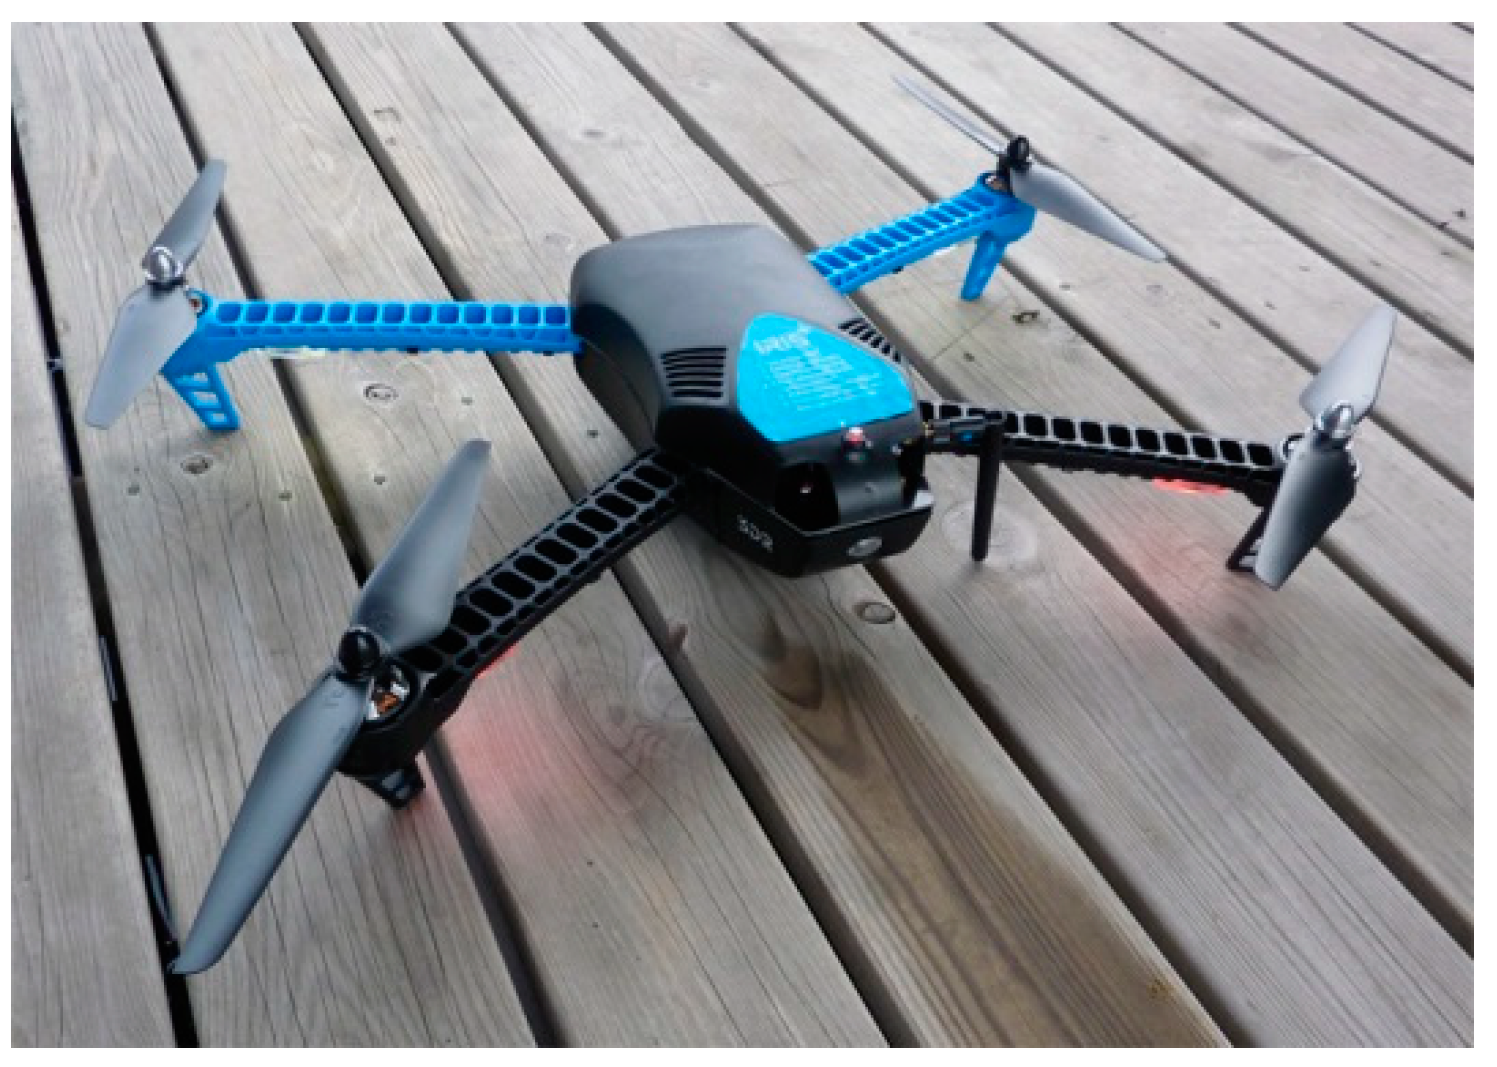
2.1. The IRIS+ Quadrotor
2.2. Aerodynamic Equations
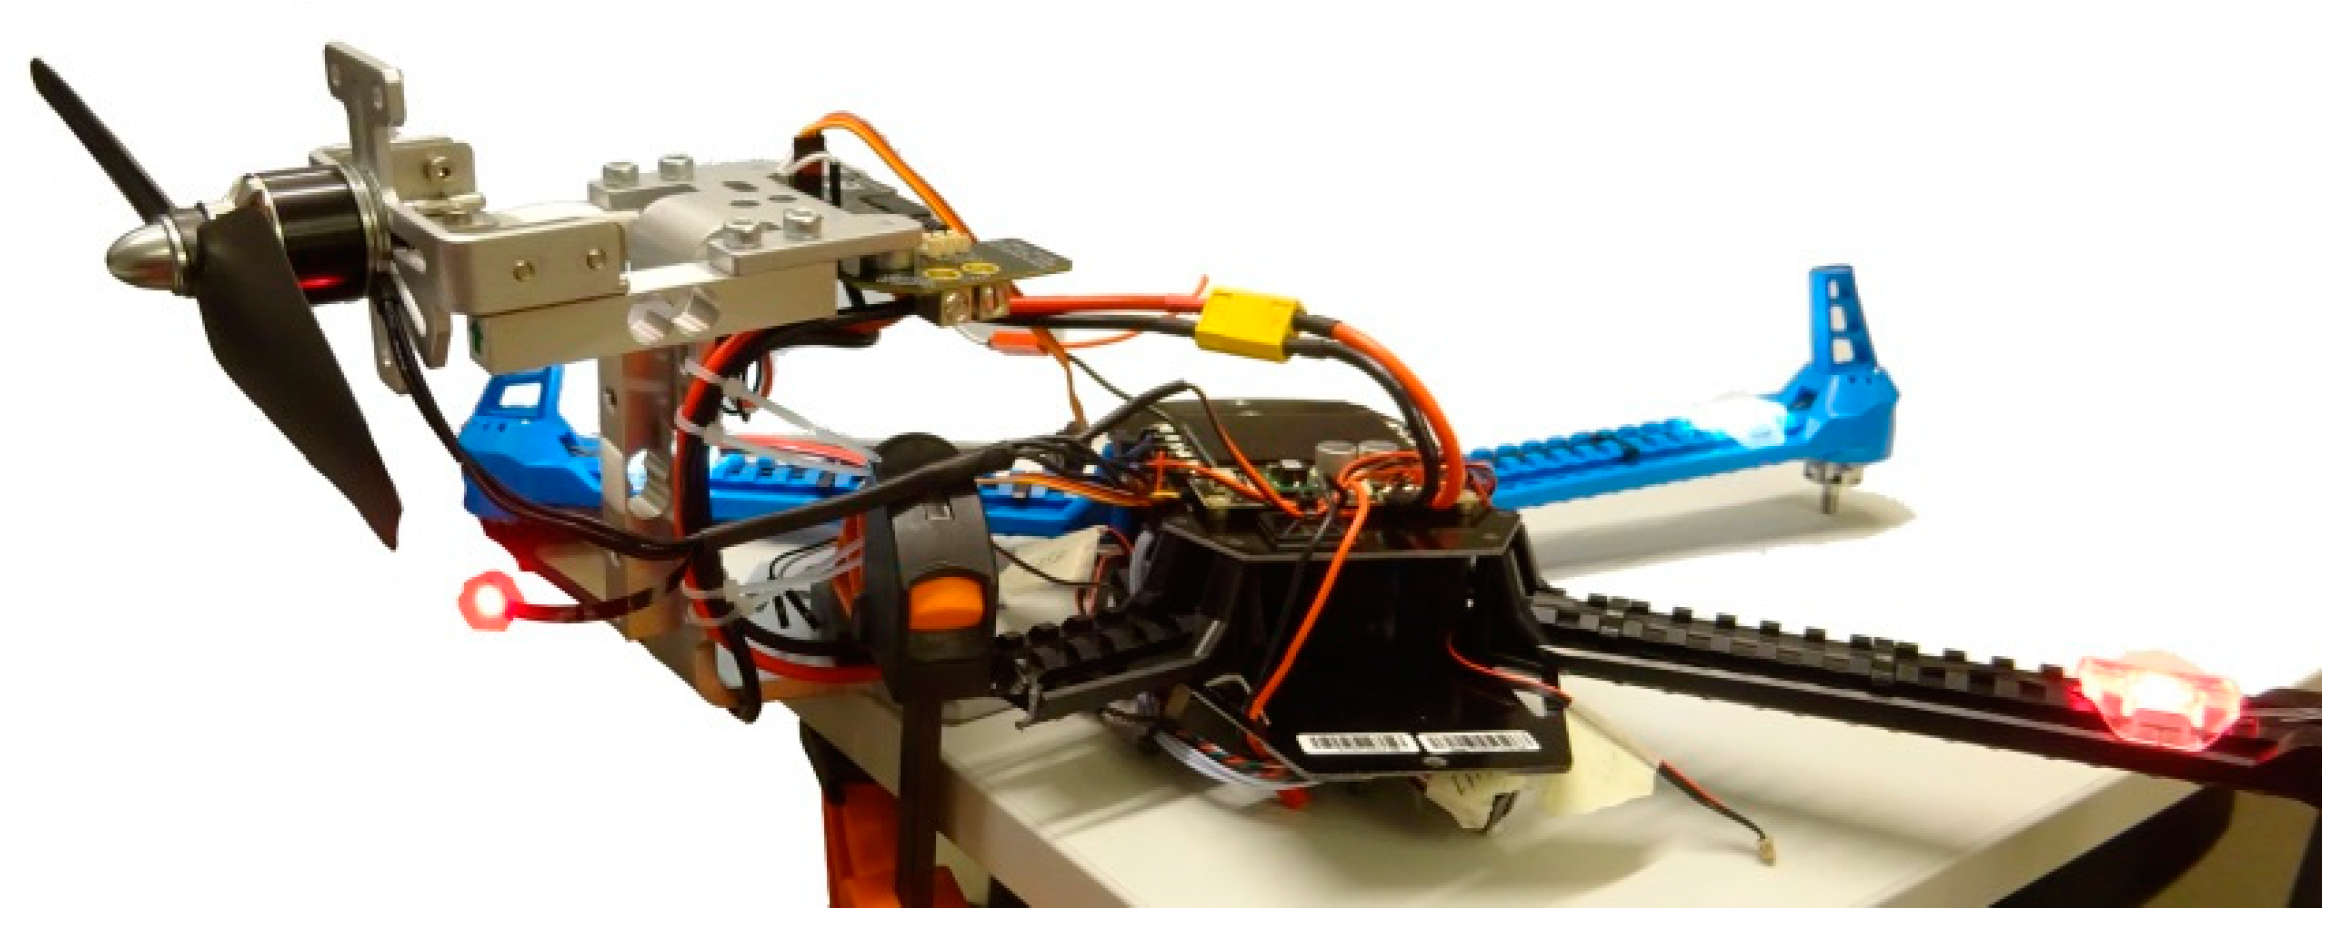
2.3. Static Thrust Test
2.4. Flight Tests
2.5. Data Processing
3. Results
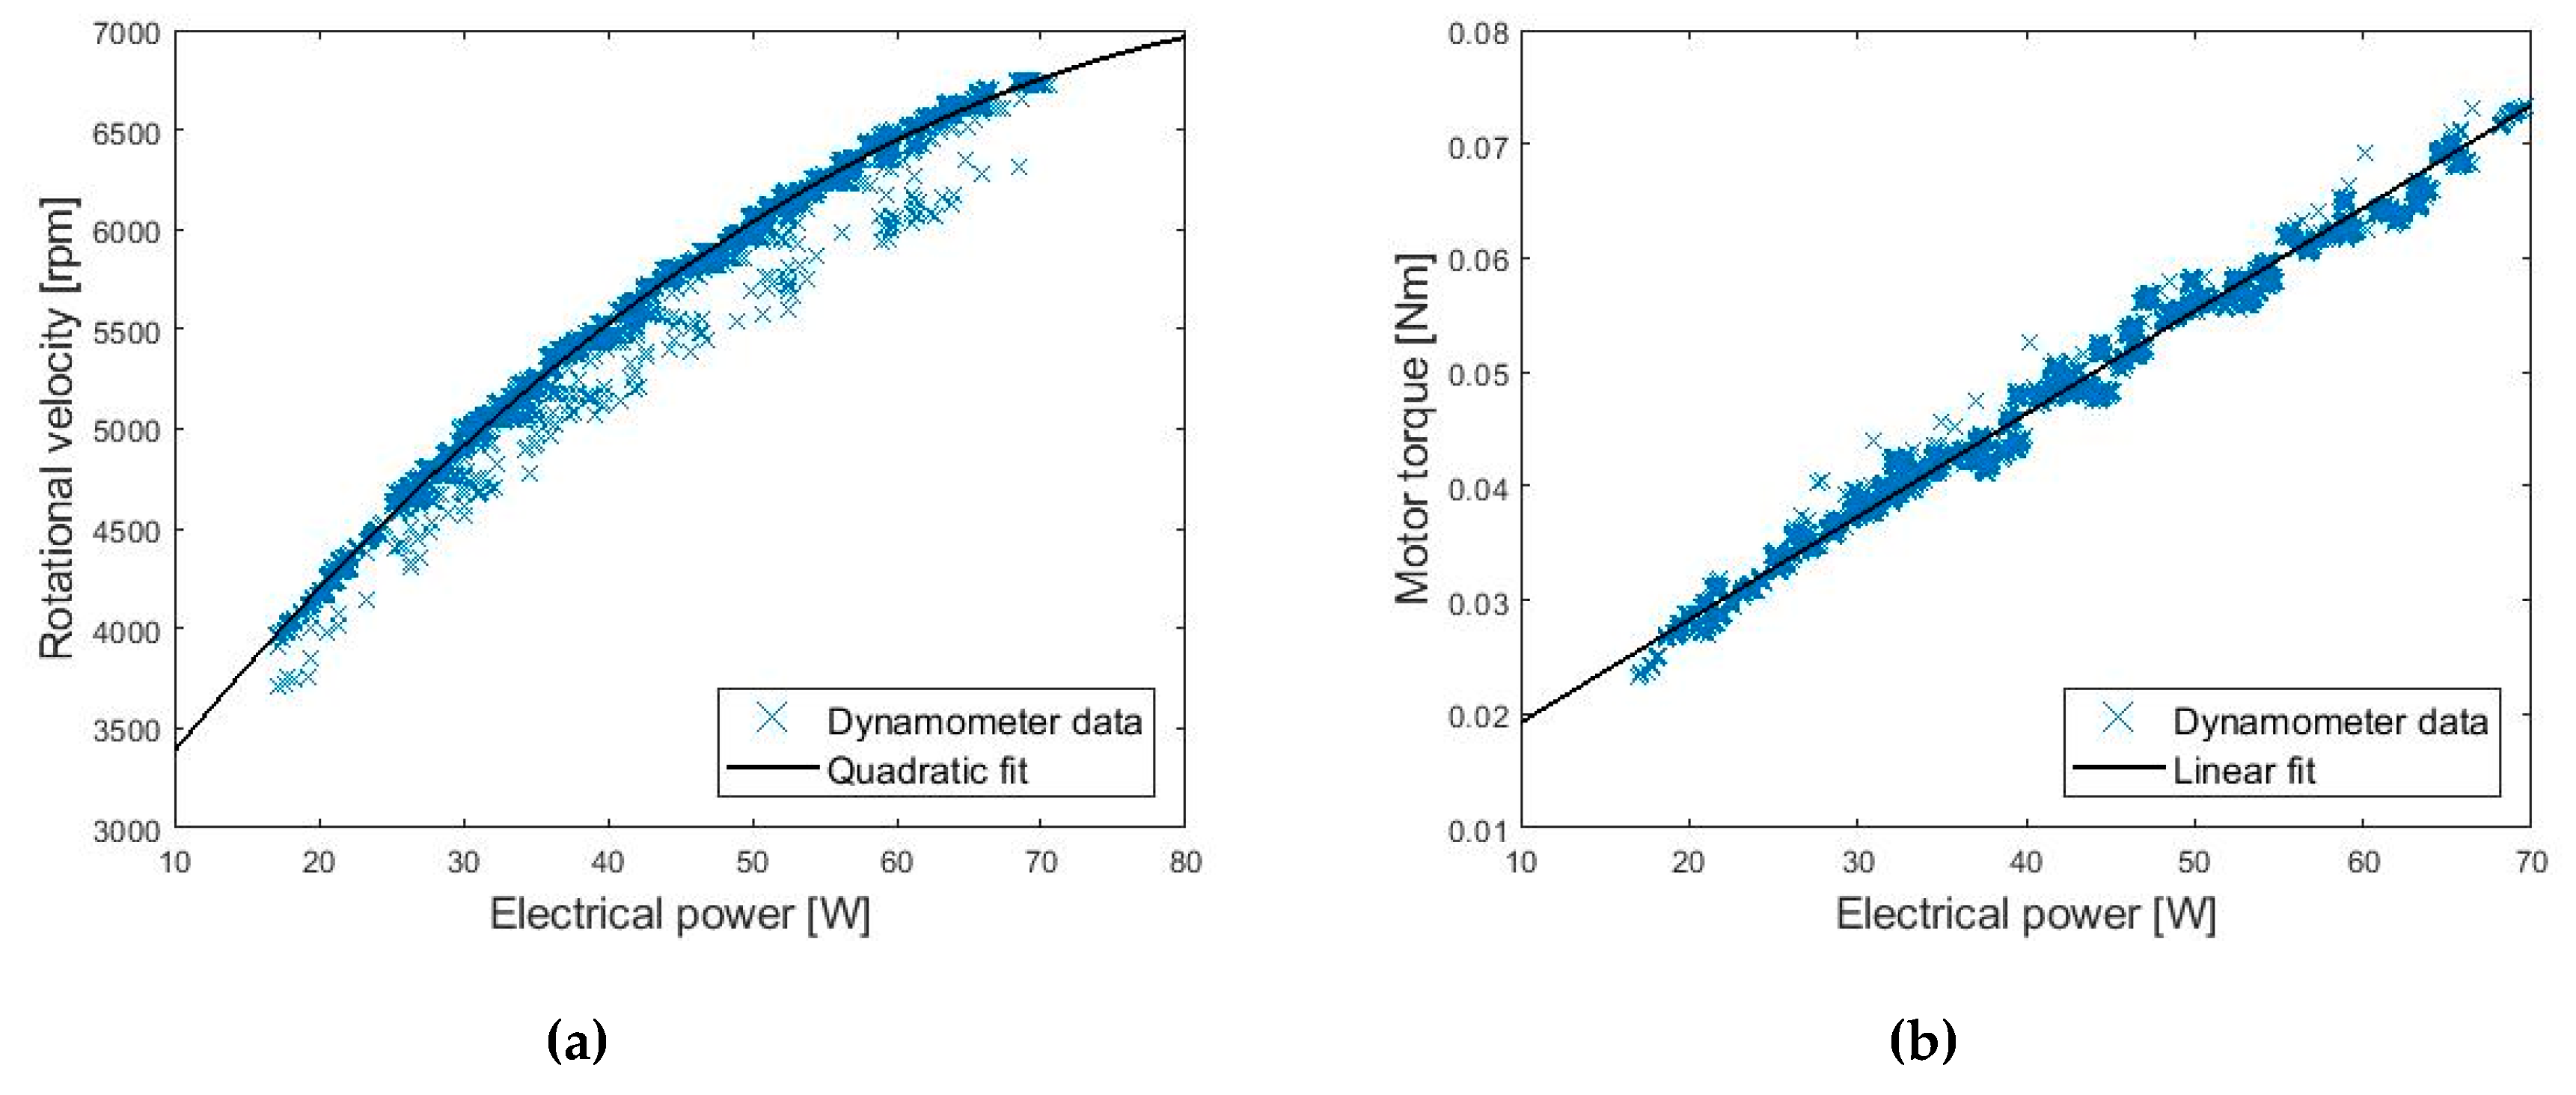
3.1. Static Thrust Test
3.2. Drag Coefficient
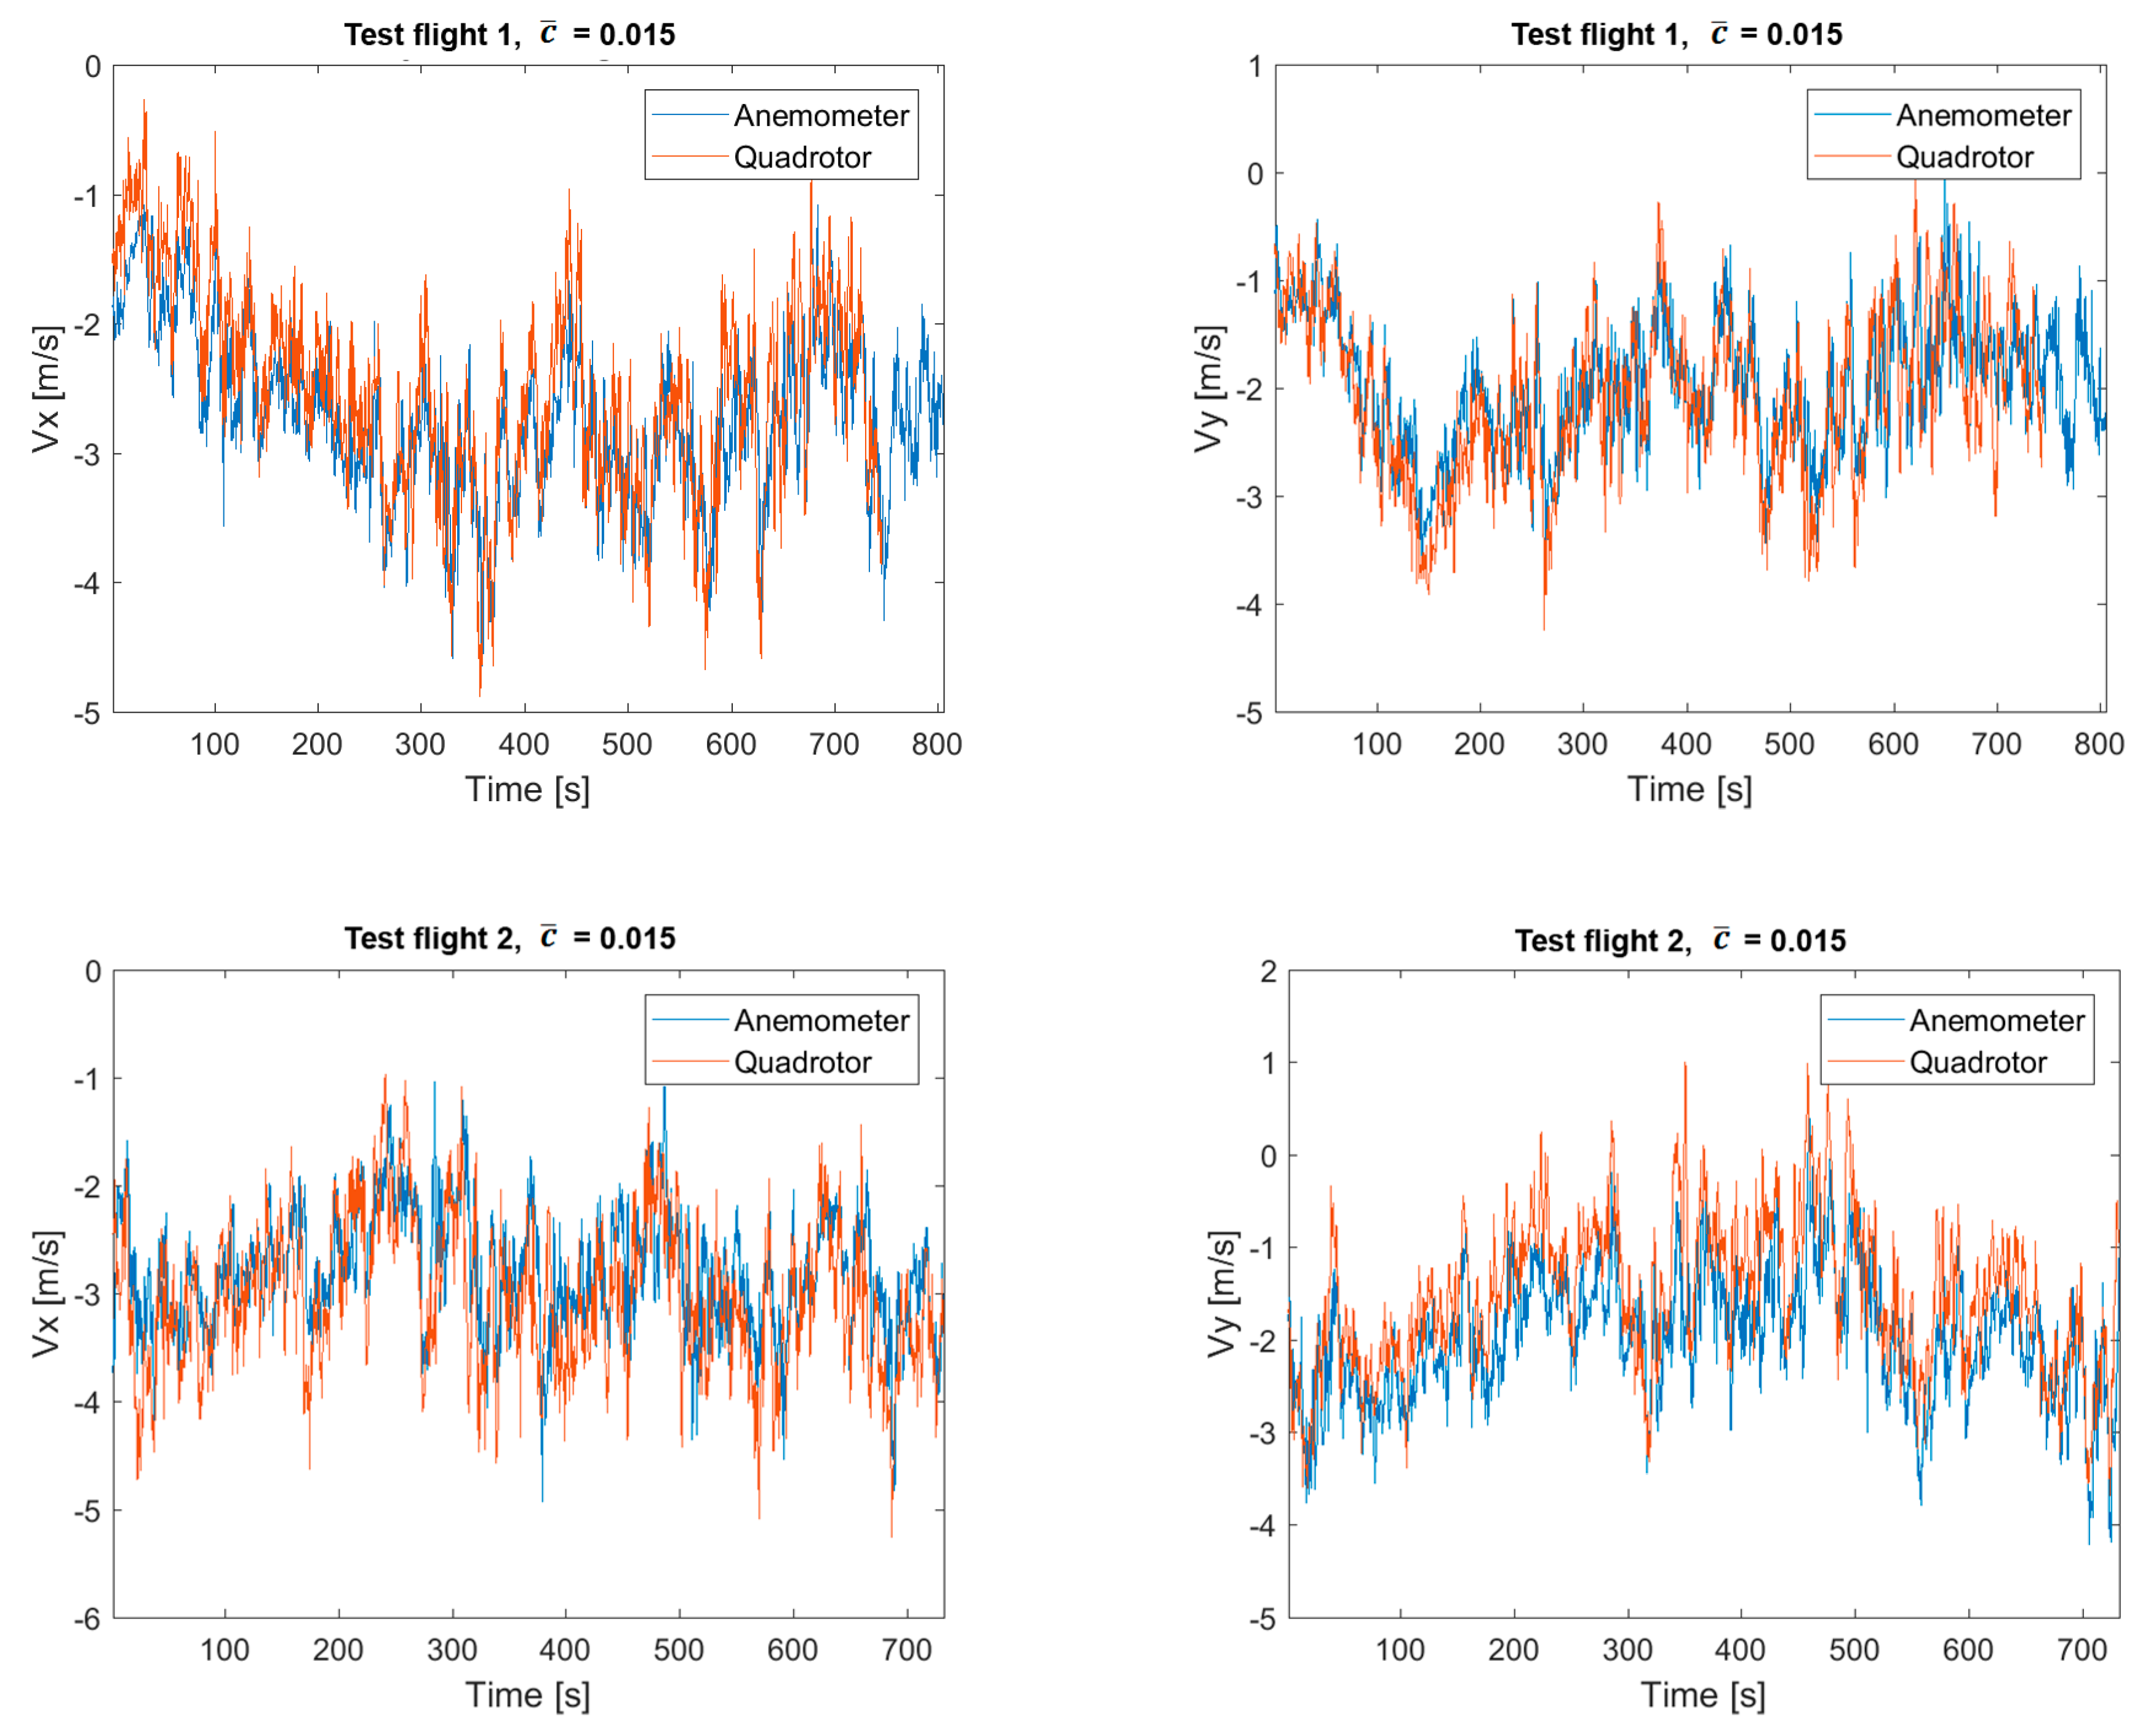
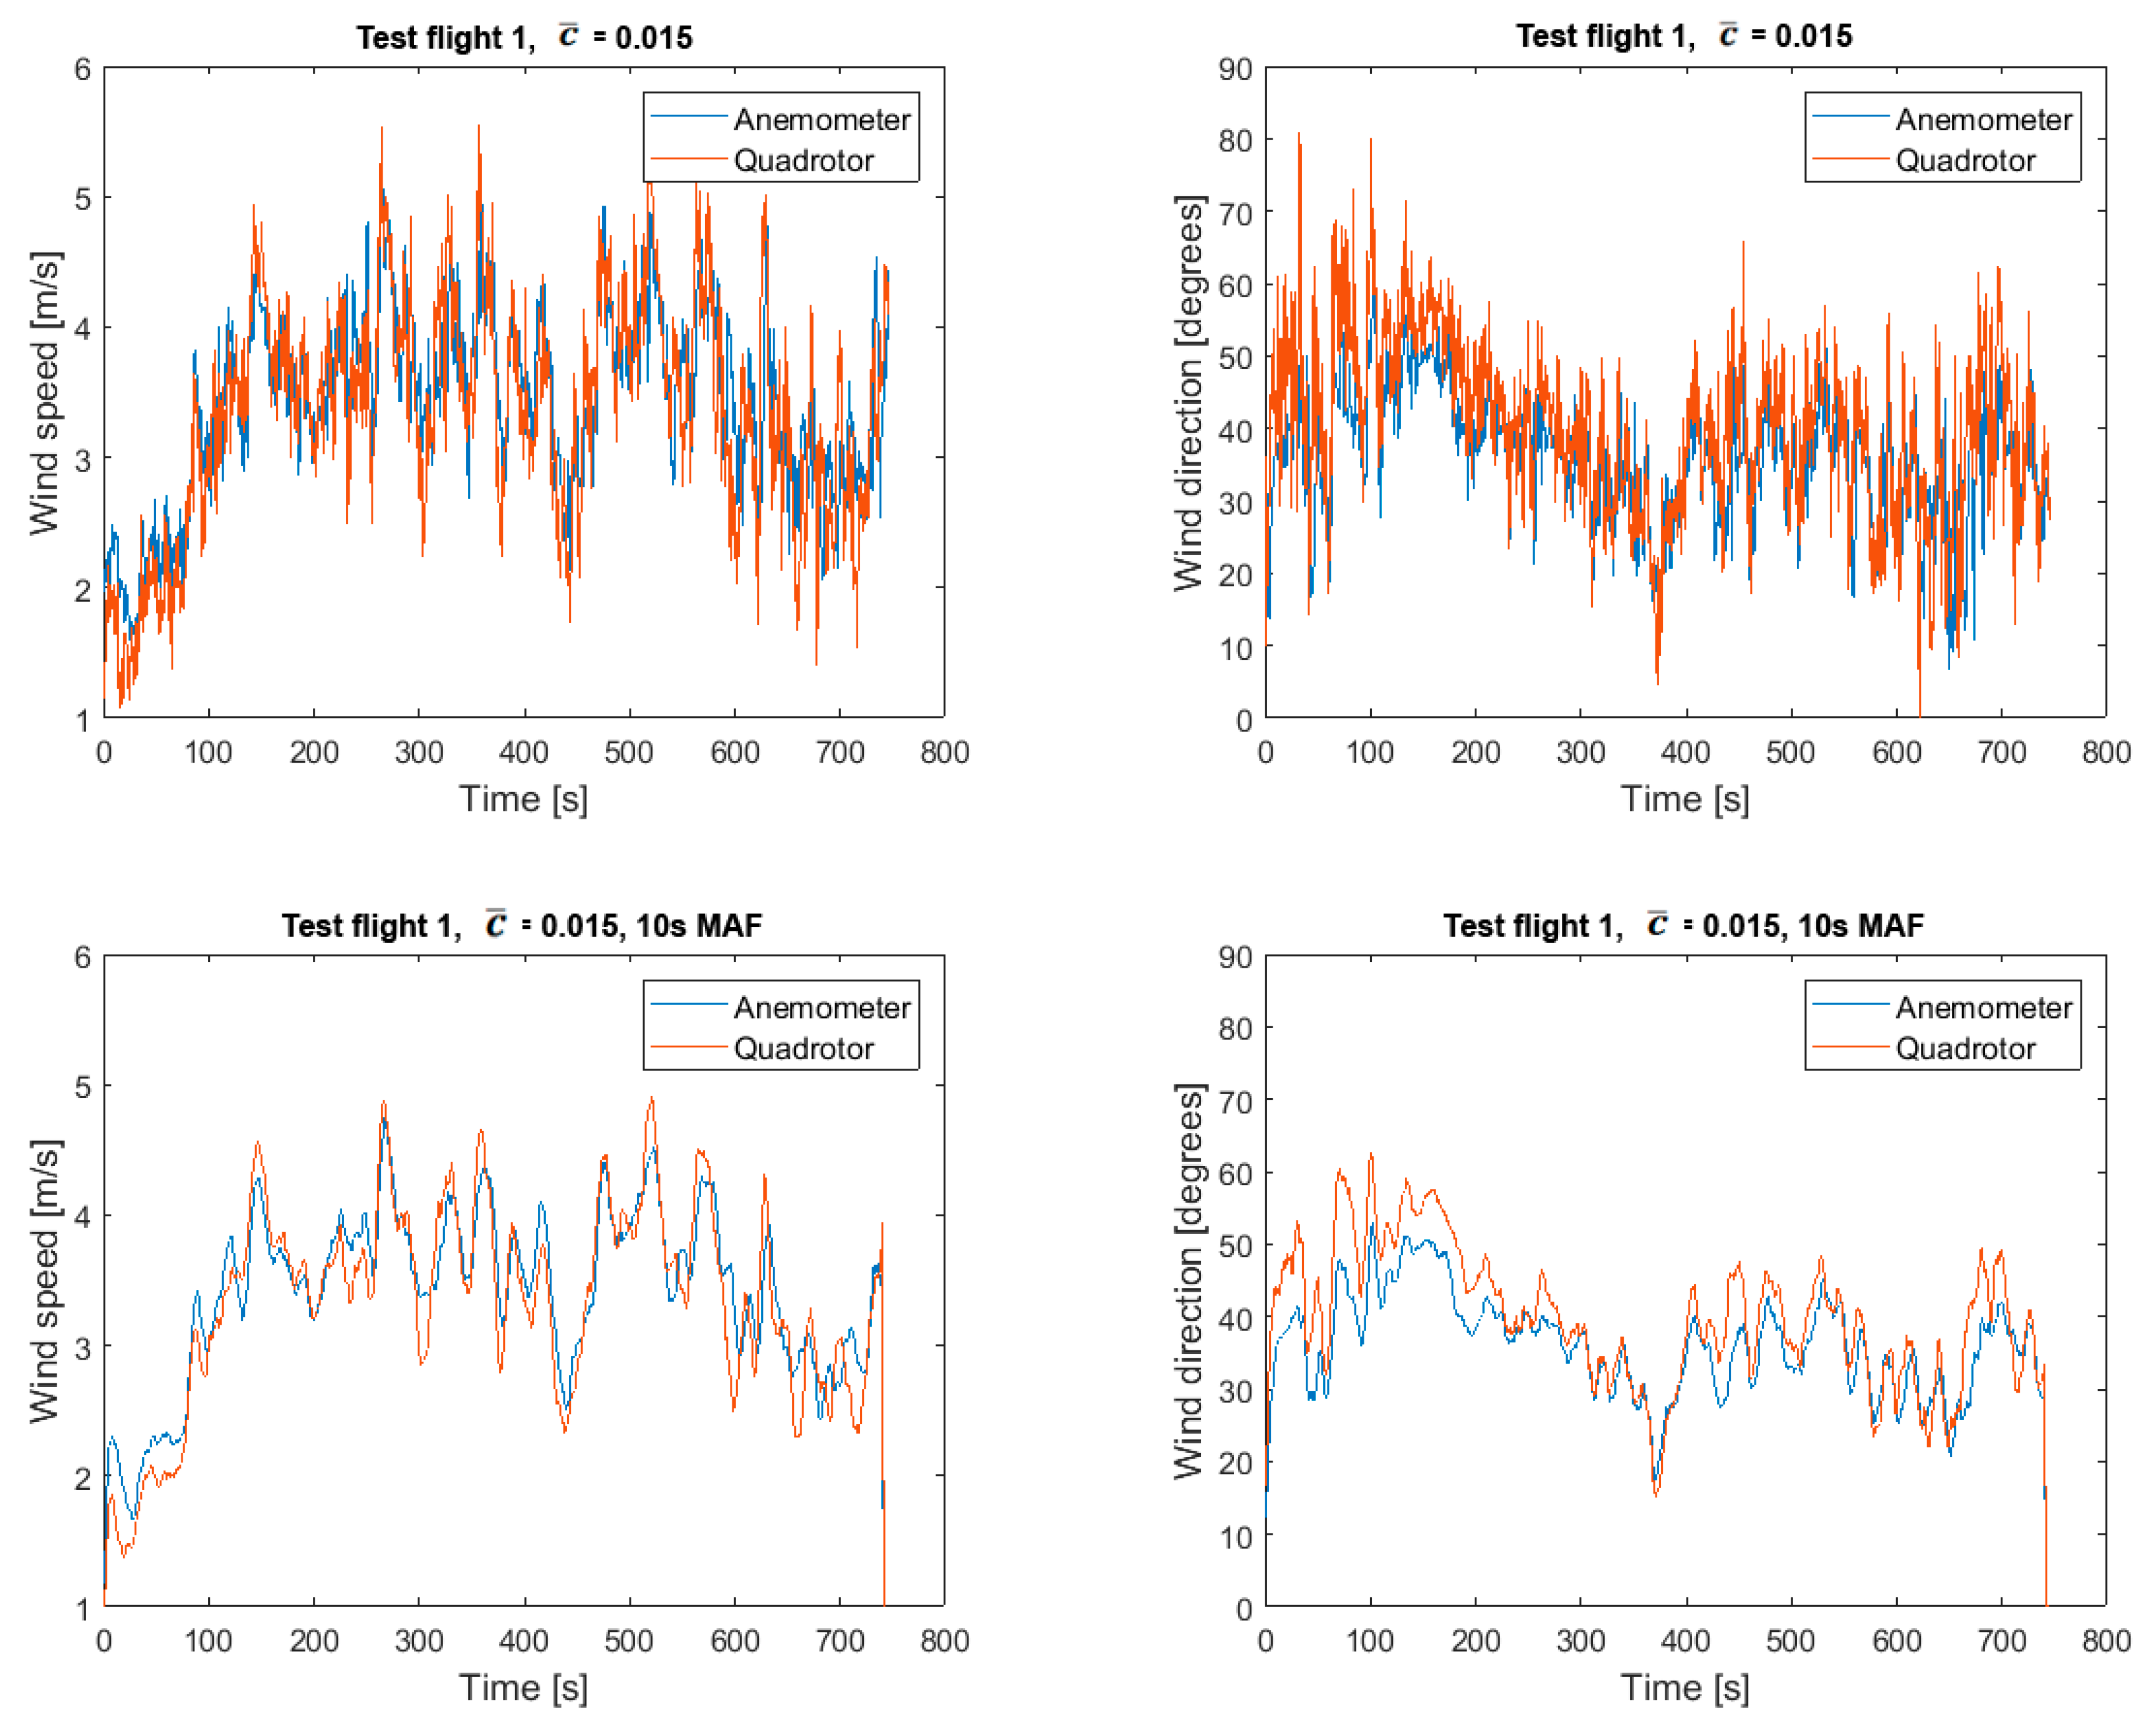
3.3. Flight Tests
4. Discussion
5. Conclusions
Author Contributions
Funding
Conflicts of Interest
Appendix A: Nomenclature
| Air density | [kg/m3] | |
| Motor torque | [Nm] | |
| Rotational velocity of rotor | [rad/s] | |
| Rotor acceleration | [rad/s2] | |
| Total rotor disk area of 4 propellers | [m2] | |
| Specific acceleration | [m/s2] | |
| Lumped linear drag coefficient | ||
| Intercept of linear fit | [A] | |
| Unit vector in z-direction in BFF | ||
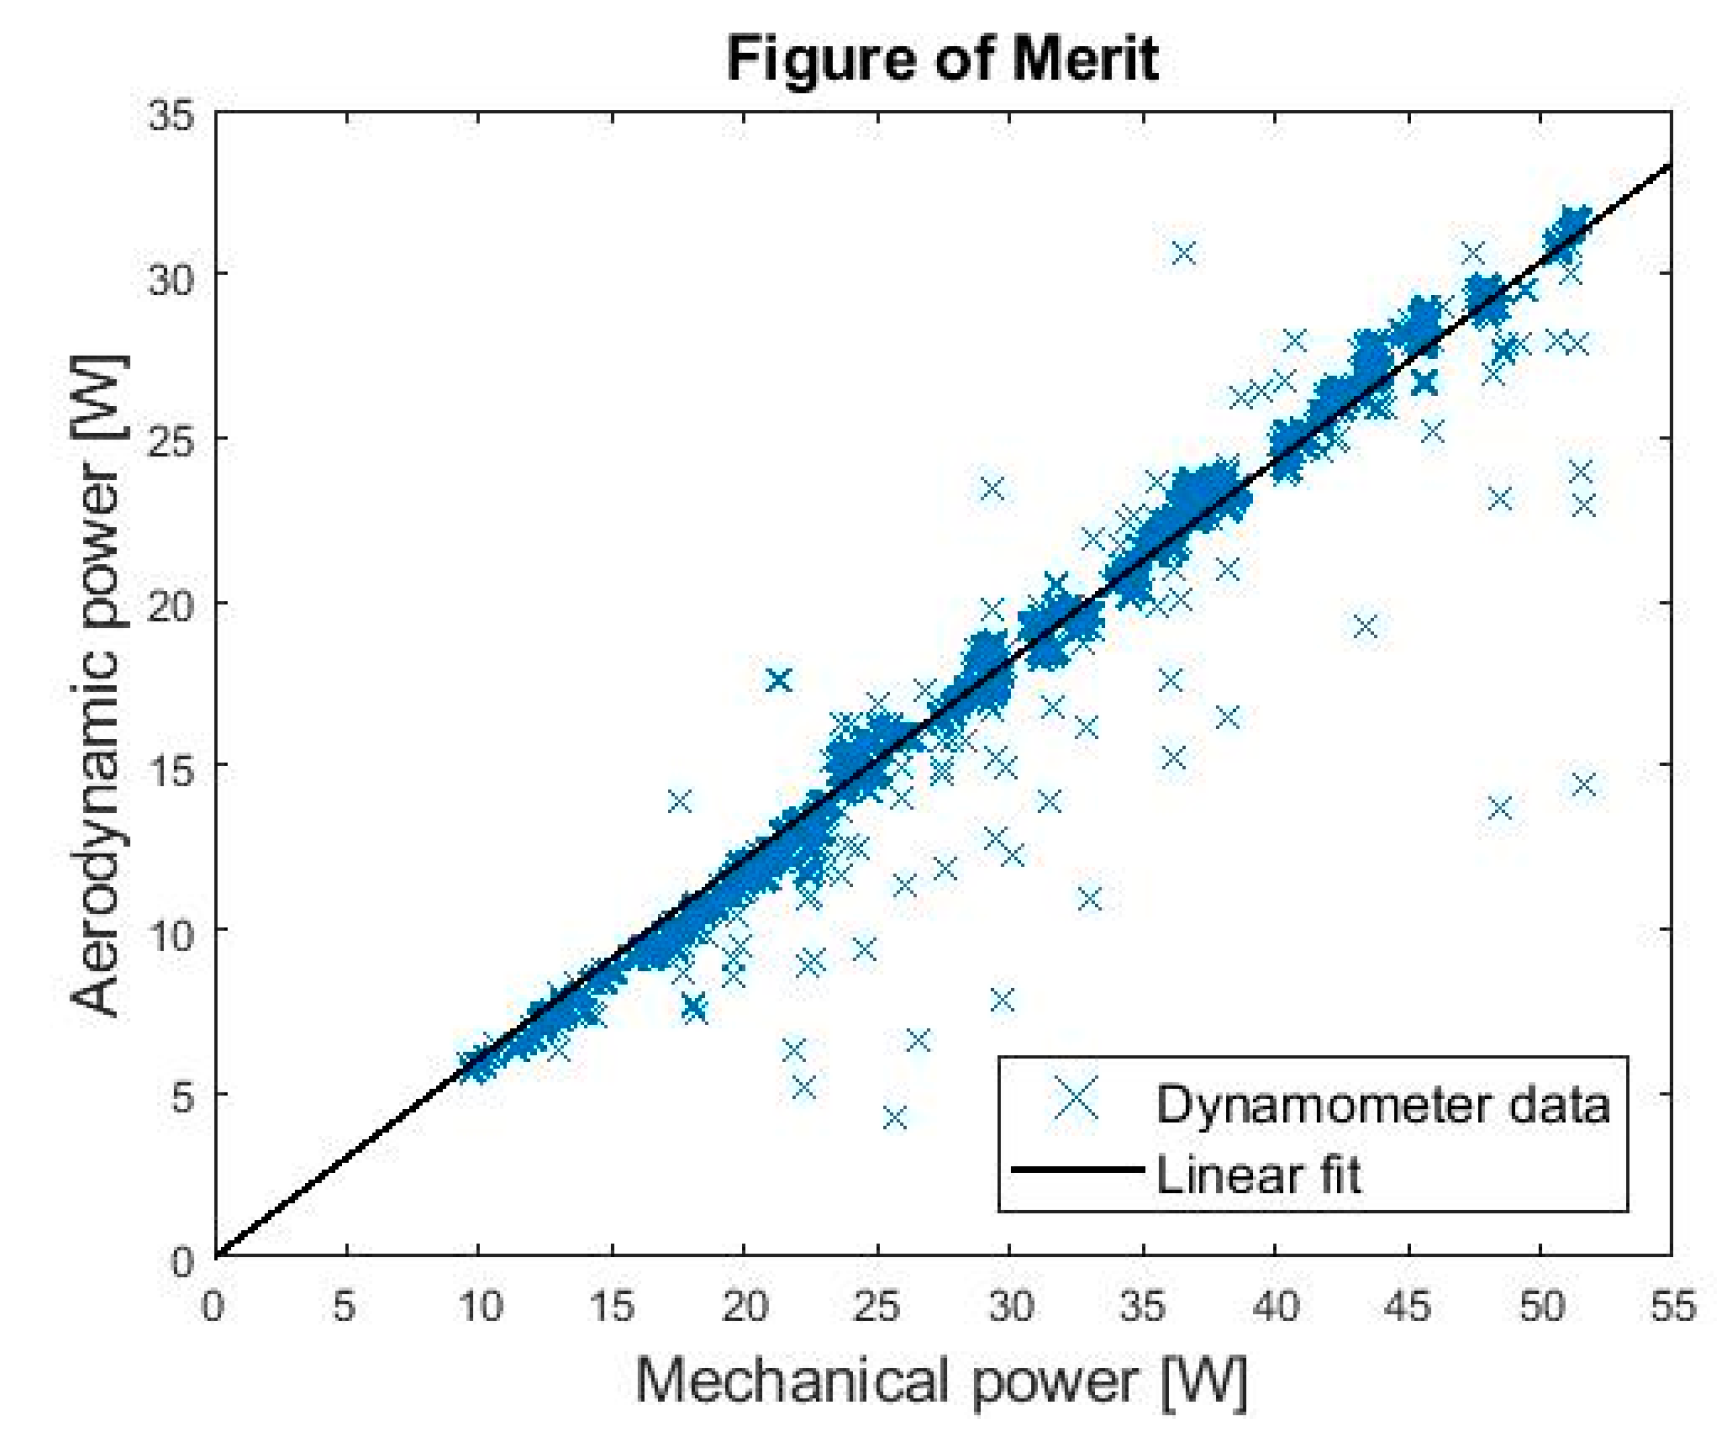
| Figure of merit | ||
| Horizontal force induced by rotors | [N] | |
| Moment of inertia of rotor blade | [kg m2] | |
| Motor current drawn by one motor | [A] | |
| Inclination of linear fit | [A/V] | |
| Mass of the drone | [kg] | |
| Aerodynamic power | [W] | |
| Electrical power | [W] | |
| Power in horizontal force | [W] | |
| Mechanical power applied to rotor | [W] | |
| Power needed to rotate propeller | [W] | |
| Power in thrust | [W] | |
| Thrust force | [N] | |
| Absolute value of induced velocity minus air velocity | [m/s] | |
| Battery voltage | [V] | |
| Air velocity | [m/s] | |
| Induced velocity | [m/s] | |
| Ground velocity | [m/s] | |
| Wind velocity | [m/s] |
References
- Pachter, M.; Ceccarelli, N.; Chandler, P. Estimating MAV’s Heading and the Wind Speed and Direction Using GPS, Inertial, and Air Speed Measurements. In Proceedings of the AIAA Guidance, Navigation and Control Conference and Exhibit, Honolulu, HI, USA, 18–21 August 2008; American Institute of Aeronautics and Astronautics: Honolulu, HI, USA, 2008. [Google Scholar]
- Chan, W.L.; Lee, C.S.; Hsiao, F.B. Real-time approaches to the estimation of local wind velocity for a fixed-wing unmanned air vehicle. Meas. Sci. Technol. 2011, 22, 105203. [Google Scholar] [CrossRef]
- Palanthandalam-Madapusi, H.J.; Girard, A.; Bernstein, D.S. Wind-field reconstruction using flight data. In Proceedings of the 2008 American Control Conference, Seattle, WA, USA, 11–13 June 2008; pp. 1863–1868. [Google Scholar]
- Wolf, C.A.; Hardis, R.P.; Woodrum, S.D.; Galan, R.S.; Wichelt, H.S.; Metzger, M.C.; Bezzo, N.; Lewin, G.C.; de Wekker, S.F.J. Wind data collection techniques on a multi-rotor platform. In Proceedings of the 2017 Systems and Information Engineering Design Symposium (SIEDS), Charlottesville, VA, USA, 28 April 2017; pp. 32–37. [Google Scholar]
- Palomaki, R.T.; Rose, N.T.; van den Bossche, M.; Sherman, T.J.; De Wekker, S.F.J. Wind Estimation in the Lower Atmosphere Using Multirotor Aircraft. J. Atmos. Ocean. Technol. 2017, 34, 1183–1191. [Google Scholar] [CrossRef]
- Neumann, P.P.; Bartholmai, M. Real-time wind estimation on a micro unmanned aerial vehicle using its inertial measurement unit. Sens. Actuators Phys. 2015, 235, 300–310. [Google Scholar] [CrossRef]
- Mazzatenta, M.; Carter, D.; Daniel, Q. APS -72nd Annual Meeting of the APS Division of Fluid Dynamics—Event—Using quadrotor IMU data to estimate wind velocity. In Proceedings of the Bulletin of the American Physical Society; American Physical Society, Seatlle, WA, USA, 25 November 2019; Volume 64. Number 13. [Google Scholar]
- Marino, M.; Fisher, A.; Clothier, R.; Watkins, S.; Prudden, S.; Leung, C.S. An Evaluation of Multi-Rotor Unmanned Aircraft as Flying Wind Sensors. Int. J. Micro Air Veh. 2015, 7, 285–299. [Google Scholar] [CrossRef]
- Wang, J.-Y.; Luo, B.; Zeng, M.; Meng, Q.-H. A Wind Estimation Method with an Unmanned Rotorcraft for Environmental Monitoring Tasks. Sensors 2018, 18, 4504. [Google Scholar] [CrossRef] [PubMed] [Green Version]
- Gonzalez-Rocha, J.; Woolsey, C.A.; Sultan, C.; de Wekker, S.; Rose, N. Measuring Atmospheric Winds from Quadrotor Motion. In Proceedings of the AIAA Atmospheric Flight Mechanics Conference, Grapevine, TX, USA, 9–13 January 2017. [Google Scholar]
- Gonzalez-Rocha, J.; Woolsey, C.A.; Sultan, C.; De Wekker, S.F. Model-based Wind profiling in the Lower Atmosphere with Multirotor UAS. In Proceedings of the AIAA Scitech 2019 Forum, San Diego, CA, USA, 7–11 January 2019. [Google Scholar]
- González-Rocha, J.; De Wekker, S.F.J.; Ross, S.D.; Woolsey, C.A. Wind profiling in the lower atmosphere from wind-induced perturbations to multirotor UAS. Sensors 2020, 20, 1341. [Google Scholar] [CrossRef] [PubMed] [Green Version]
- Müller, K.; Crocoll, P.; Trommer, G.F. Wind estimation for a quadrotor helicopter in a model-aided navigation system. In Proceedings of the 22nd Saint Petersburg International Conference on Integrated Navigation Systems, Saint Petersburg, Russia, 25–27 May 2015; pp. 45–48. [Google Scholar]
- Sikkel, L.N.C.; de Croon, G.C.H.E.; De Wagter, C.; Chu, Q.P. A novel online model-based wind estimation approach for quadrotor micro air vehicles using low cost MEMS IMUs. In Proceedings of the 2016 IEEE/RSJ International Conference on Intelligent Robots and Systems (IROS), Daejeon, South Korea, 9–14 October 2016; pp. 2141–2146. [Google Scholar]
- Schiano, F.; Alonso-Mora, J.; Rudin, K.; Beardsley, P.; Siegwart, R.; Sicilianok, B. Towards estimation and correction of wind effects on a quadrotor UAV. In Proceedings of the IMAV 2014: International Micro Air Vehicle Conference and Competition 2014, Delft, The Netherlands, 12–15 August 2014; pp. 134–141. [Google Scholar]
- Perozzi, G.; Efimov, D.; Biannic, J.-M.; Planckaert, L. Using a Quadrotor as Wind Sensor: Time-Varying Parameter Estimation Algorithms. Int. J. Control. 2020, 1–20. [Google Scholar] [CrossRef]
- Allibert, G.; Abeywardena, D.; Bangura, M.; Mahony, R. Estimating body-fixed frame velocity and attitude from inertial measurements for a quadrotor vehicle. In Proceedings of the 2014 IEEE Conference on Control Applications (CCA), Juan Les Antibes, France, 8–10 October 2014; pp. 978–983. [Google Scholar]
- Simma, M. Measuring Wind Using the Internal Stabilisation System of a Quadrotor Drone. Master’s Thesis, UiT The Arctic University of Norway, Tromsø, Norway, 2018. [Google Scholar]
- 3DR Pixhawk 1·PX4 v1.9.0 User Guide. Available online: https://docs.px4.io/v1.9.0/en/flight_controller/pixhawk.html (accessed on 8 June 2020).
- Air—Density, Specific Weight and Thermal Expansion Coefficient at Varying Temperature and Constant Pressures. Available online: https://www.engineeringtoolbox.com/air-density-specific-weight-d_600.html (accessed on 8 June 2020).
- Gill Instruments Limited. WindSonic User Manual—Ultrasonic Anemometer; Gill Instruments Limited: Lymington, Hampshire, UK, 2015. [Google Scholar]


| Sensor | Model |
|---|---|
| Accelerometer and Gyroscope | Invensense MPU 6000 3-axis |
| Accelerometer and Magnetometer | ST Micro LSM303D 14 bit |
| Barometer | MEAS MS5611 |
| Gyroscope | ST Micro L3GD20H 16 bit |
| Parameters Needed | ||
|---|---|---|
| 1.371 kg | Mass of the drone | |
| 0.1829 | Total rotor disk area | |
| 1.268 kg/ | Air density for local temperature | |
| Propeller moment of inertia | ||
| 0.015 * | Lumped linear drag coefficient | |
| 0.6072 * | Figure of merit | |
| Variables Needed | Unknown Variables | ||
|---|---|---|---|
| Accelerometer data | 3D air velocity | ||
| Rotational velocity of propeller | Vertical induced velocity | ||
| Rotational accel. of propeller | Horizontal drag force | ||
| Motor torque | Vertical thrust | ||
| 0.5 s Average | 10 s MAF | |||
|---|---|---|---|---|
| Flight | Speed [m/s] | Direction [°] | Speed [m/s] | Direction [°] |
| Test flight 1 | 0.49 | 8.9 | 0.26 | 4.1 |
| Test flight 2 | 0.56 | 10.6 | 0.29 | 4.9 |
© 2020 by the authors. Licensee MDPI, Basel, Switzerland. This article is an open access article distributed under the terms and conditions of the Creative Commons Attribution (CC BY) license (http://creativecommons.org/licenses/by/4.0/).
Share and Cite
Simma, M.; Mjøen, H.; Boström, T. Measuring Wind Speed Using the Internal Stabilization System of a Quadrotor Drone. Drones 2020, 4, 23. https://doi.org/10.3390/drones4020023
Simma M, Mjøen H, Boström T. Measuring Wind Speed Using the Internal Stabilization System of a Quadrotor Drone. Drones. 2020; 4(2):23. https://doi.org/10.3390/drones4020023
Chicago/Turabian StyleSimma, Magdalena, Håvard Mjøen, and Tobias Boström. 2020. "Measuring Wind Speed Using the Internal Stabilization System of a Quadrotor Drone" Drones 4, no. 2: 23. https://doi.org/10.3390/drones4020023