Article

Experimental Investigation of Icing Effects on a Hovering Drone Rotor Performance

1
Department of Applied Sciences, University of Québec in Chicoutimi, 555 Boulevard de l’Université, Chicoutimi, QC G7H2B1, Canada
2
Bell Textron Canada Limited, 12 800 rue de l’Avenir, Mirabel, QC J7J1R4, Canada
*
Author to whom correspondence should be addressed.
Drones 2022, 6(11), 345; https://doi.org/10.3390/drones6110345
Submission received: 6 October 2022 / Revised: 31 October 2022 / Accepted: 1 November 2022 / Published: 4 November 2022

Abstract

:
A scaled version of the APT70 drone rotor, typical of small to medium UAV rotors, was tested in a 9-meter-high cold chamber for a wide range of icing parameters. The drone rotor used has four blades with varying chord and twist settings. The objective of this study was to investigate icing effects on the rotor aerodynamic performance, based on experimental data, for varying rotor speeds, precipitation rates, droplet sizes and air temperatures. Aerodynamic loads were measured using the built-in load cell, and data were compared to photographs taken during testing as well as ice thickness measurements at the end of tests. The impact of each test parameter and their variations on the degradation of the rotor’s performances was evaluated. The results show that larger droplets and lower RPMs and pitch angles generate a more rapid degradation of the performances due to the airflow around the blades and tip-vortex affecting the collection efficiency of the blades. With the smaller droplets, the air temperature did not affect the performance degradation, only the type of ice accumulation. However, with the larger droplets, degradation of the performances was less severe at warmer temperatures since almost no ice accumulated at the tip and droplets were expelled before freezing.

1. Introduction

Unmanned Aerial Vehicles (UAVs) are regarded as an interesting part of the business operations of key commercial sectors and are used for a wide range of services and industries such as deliveries, search and rescue, environmental monitoring and agriculture [1,2,3]. Militaries around the world have also equipped their forces with UAVs for their advantages due to their light weight and ease of transport and operation [4]. However, freezing atmospheric conditions threaten the operation of such machines [4,5]. Icing affects all types of UAVs, but for those equipped with rotors, ice accumulation on the blades causes a direct loss of thrust, an increase in torque and may even risk an ultimate crash [6].
Aircraft icing is a well-studied area of research. The literature offers a variety of experimental setups conducted on fixed-wing aircraft [7,8,9,10] as well as helicopters [11,12,13,14,15,16,17,18], and advancements in computational techniques have also led to many works on numerical simulations of icing and de-icing of aircraft [19,20,21,22,23,24,25,26,27]. Yet, studies related to icing on drones have only recently gained momentum [4]. Therefore, an important amount of research is still needed to understand icing effects on drones, develop optimal solutions for ice protection and to ultimately obtain icing certification.
To the best of our knowledge, one of the first UAV icing studies was conducted by Siquig [6], who compared and evaluated the ice accumulation effects between two UAVs, each having different operational parameters in terms of altitude and range. Bottyán [28] outlined a numerical technique for ice accretion prediction based on the 2D Messinger icing model for a UAV wing and airfoil profile. Szilder and McIlwain [29] proposed an analytical model based on the integrated mass and energy balance equations to identify glaze and rime ice formation, based on the air temperature T and liquid water content LWC, along a NACA 0012 airfoil surface intended for UAV applications. They used CFD to compute the flow field for each Reynolds number Re and to obtain the Stanton number St. A droplet trajectory solver then computed the collection efficiency for given droplet sizes, and a morphogenetic model was used to predict the ice accretion shape. Armanini et al. [30] proposed the Icing-Related Decision-Making System (IRDMS), which measures changes in aircraft performance in-flight, along with the surrounding environmental properties, to evaluate icing, its effects on the aircraft and whether the equipped ice protection systems should be activated. Liu et al. experimented on a UAV rotating propeller placed in an icing wind tunnel IWT [31]. They tracked the transient ice accumulation process for a variety of icing conditions while measuring changes in rotor thrust, torque and power consumption. They found that ice accumulation could cause up to 70% thrust loss and power consumption of up to 250% compared to operation prior to icing. In another study, they investigated the effect of applying hydrophilic and superhydrophobic coatings on ice accretion and changes in rotor thrust and torque [32]. They found that the application of superhydrophobic coatings greatly mitigated ice accumulation, reduced thrust loss and caused less demand for extra power consumption compared to the rotor blades with hydrophilic coatings. Hann et al. studied the application of an electro-thermal heating ice protection system on a wing with an RG-15 airfoil profile [33]. The wing was placed in the IWT and two different heating systems were used; the first operated in anti-icing and de-icing modes, while the other was designed as a parting strip de-icing system. They found that the parting strip de-icing system was more efficient in terms of power consumed; it was also more effective in terms of ice protection compared to the conventional anti-icing/de-icing system.
This paper presents a study on the icing of a drone rotor in AMIL’s 9 m high cold room and the effects on its performances. The research project focuses on studying the impact of icing on an 81% scaled version of the Bell APT70 rotor, typical of small to medium UAV rotors, as well as gathering quality experimental data related to the effects of icing on the aerodynamic performance of rotor blades and constructing a database of photographs and measurements of the ice shapes accumulated under different operating parameters. Tests consist of a wide range of pitch angles θ, liquid water content LWC, median volume diameter MVD, air temperatures T, rotor speeds Ω and precipitation rates λ. Thrust, torque, rotational speed, mechanical power, electrical power consumption and rotor vibrations were measured during the tests. Ice shapes were documented using 2D photography, a 3D scanner and manual thickness measurements using digital calipers. The APT70 drone performs vertical take-off and landing (VTOL) with its rotors’ rotation axis mainly vertical. It can transition from vertical flight to horizontal flight to fly on its wings, allowing it to reach higher speeds and cover more ground distance. During horizontal flight, the rotors’ rotation axis is mainly horizontal. This research focuses on the take-off/landing and hover flying mode of drones with the rotor axis perpendicular to the ground. Testing of this flight mode was performed in an icing cold room. A new innovative test setup for this purpose was developed with the test procedures in a previous work [34]. The test conditions were also defined and calibrated in the previous work. The drone rotor blades used have a complex geometrical shape, due to the varying chord length c as well as changing twist from root to tip. The rotation speed Ω is higher compared to that of a helicopter, but the smaller blades cause the operational Reynolds number Re to be lower. This paper is divided as follows. First, the cold room, test setup and conditions are briefly presented. Then, the effect of each test parameter on the icing accumulation and rotor performance is assessed.

2. Materials and Methods
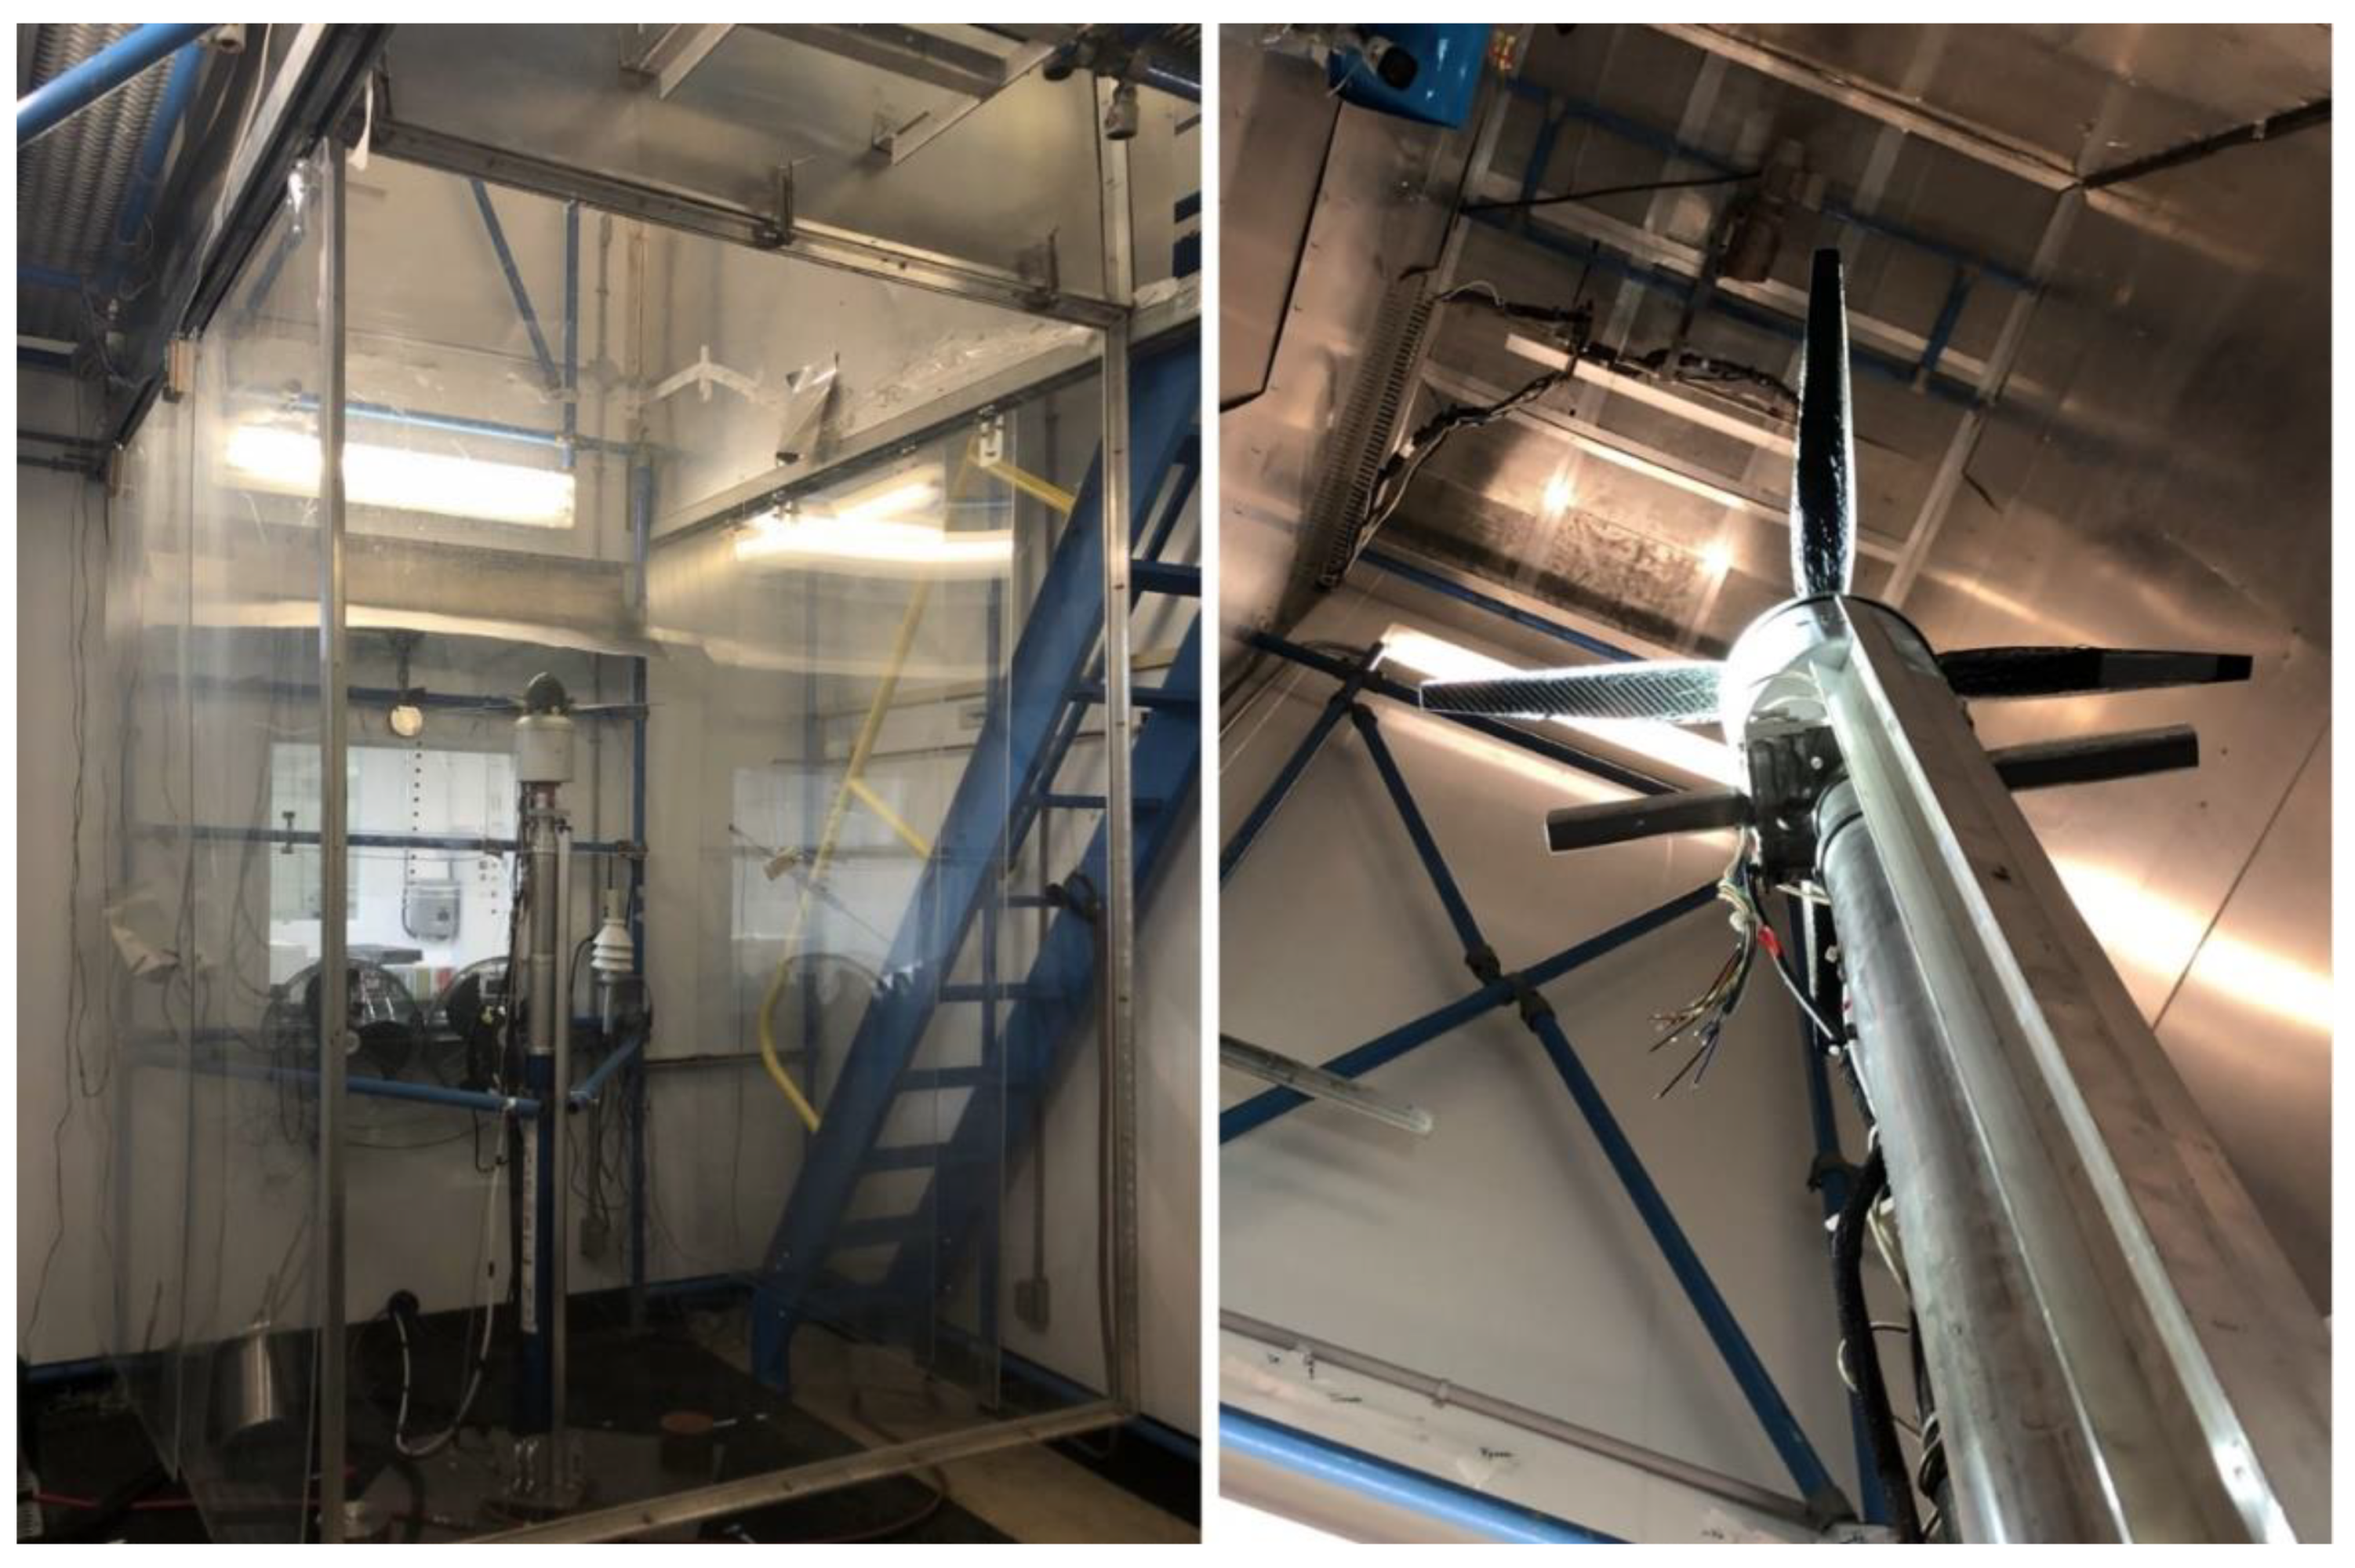
2.1. Cold Chamber

The rotor icing test setup is installed in the AMIL cold chamber, identified as the 9M Chamber (Figure 1), in which the test rotor is positioned at the center of the icing test section. The rotor is positioned 2 m above the ground, which is high enough to prevent ground effect but far enough from the nozzles for the droplets to reach terminal velocity and temperature [34]. The 9M chamber is 9.10 m high, 5.50 m long and 3.50 m wide. Air temperature can be controlled between −35 °C and 5 °C ± 0.5 °C. Two heat exchangers connected to a compressor are set in the upper section of the chamber. The rotor can operate indefinitely at a desired temperature. Inside the chamber and surrounding the rotor, the icing test section has an area of 2 by 2 m, where the icing precipitation is obtained, and is delimited by both the chambers walls and plexiglass movable walls.
Two standard icing nozzles are located on the chamber ceiling to generate the icing cloud. The nozzles are located directly above the center of the rotor shaft to distribute the spray evenly in the chamber. Hydraulic sprinklers produce gravity-fed icing with pressurized nozzle sprayers. Different nozzle heads can be installed to generate different droplet sizes. The droplet speed corresponds to their freefall values in the vertical airflow [34]. Distilled water maintained in a refrigerator is used to produce the precipitation. Equal air pressure and water pressure are delivered to each nozzle. Measuring the water and air pressures at the input of the water and air lines to the nozzles ensures precise readings of the pressure differential controlling the droplet size. A photograph of the spray rig in the ceiling with the two installed nozzles is shown in Figure 2.

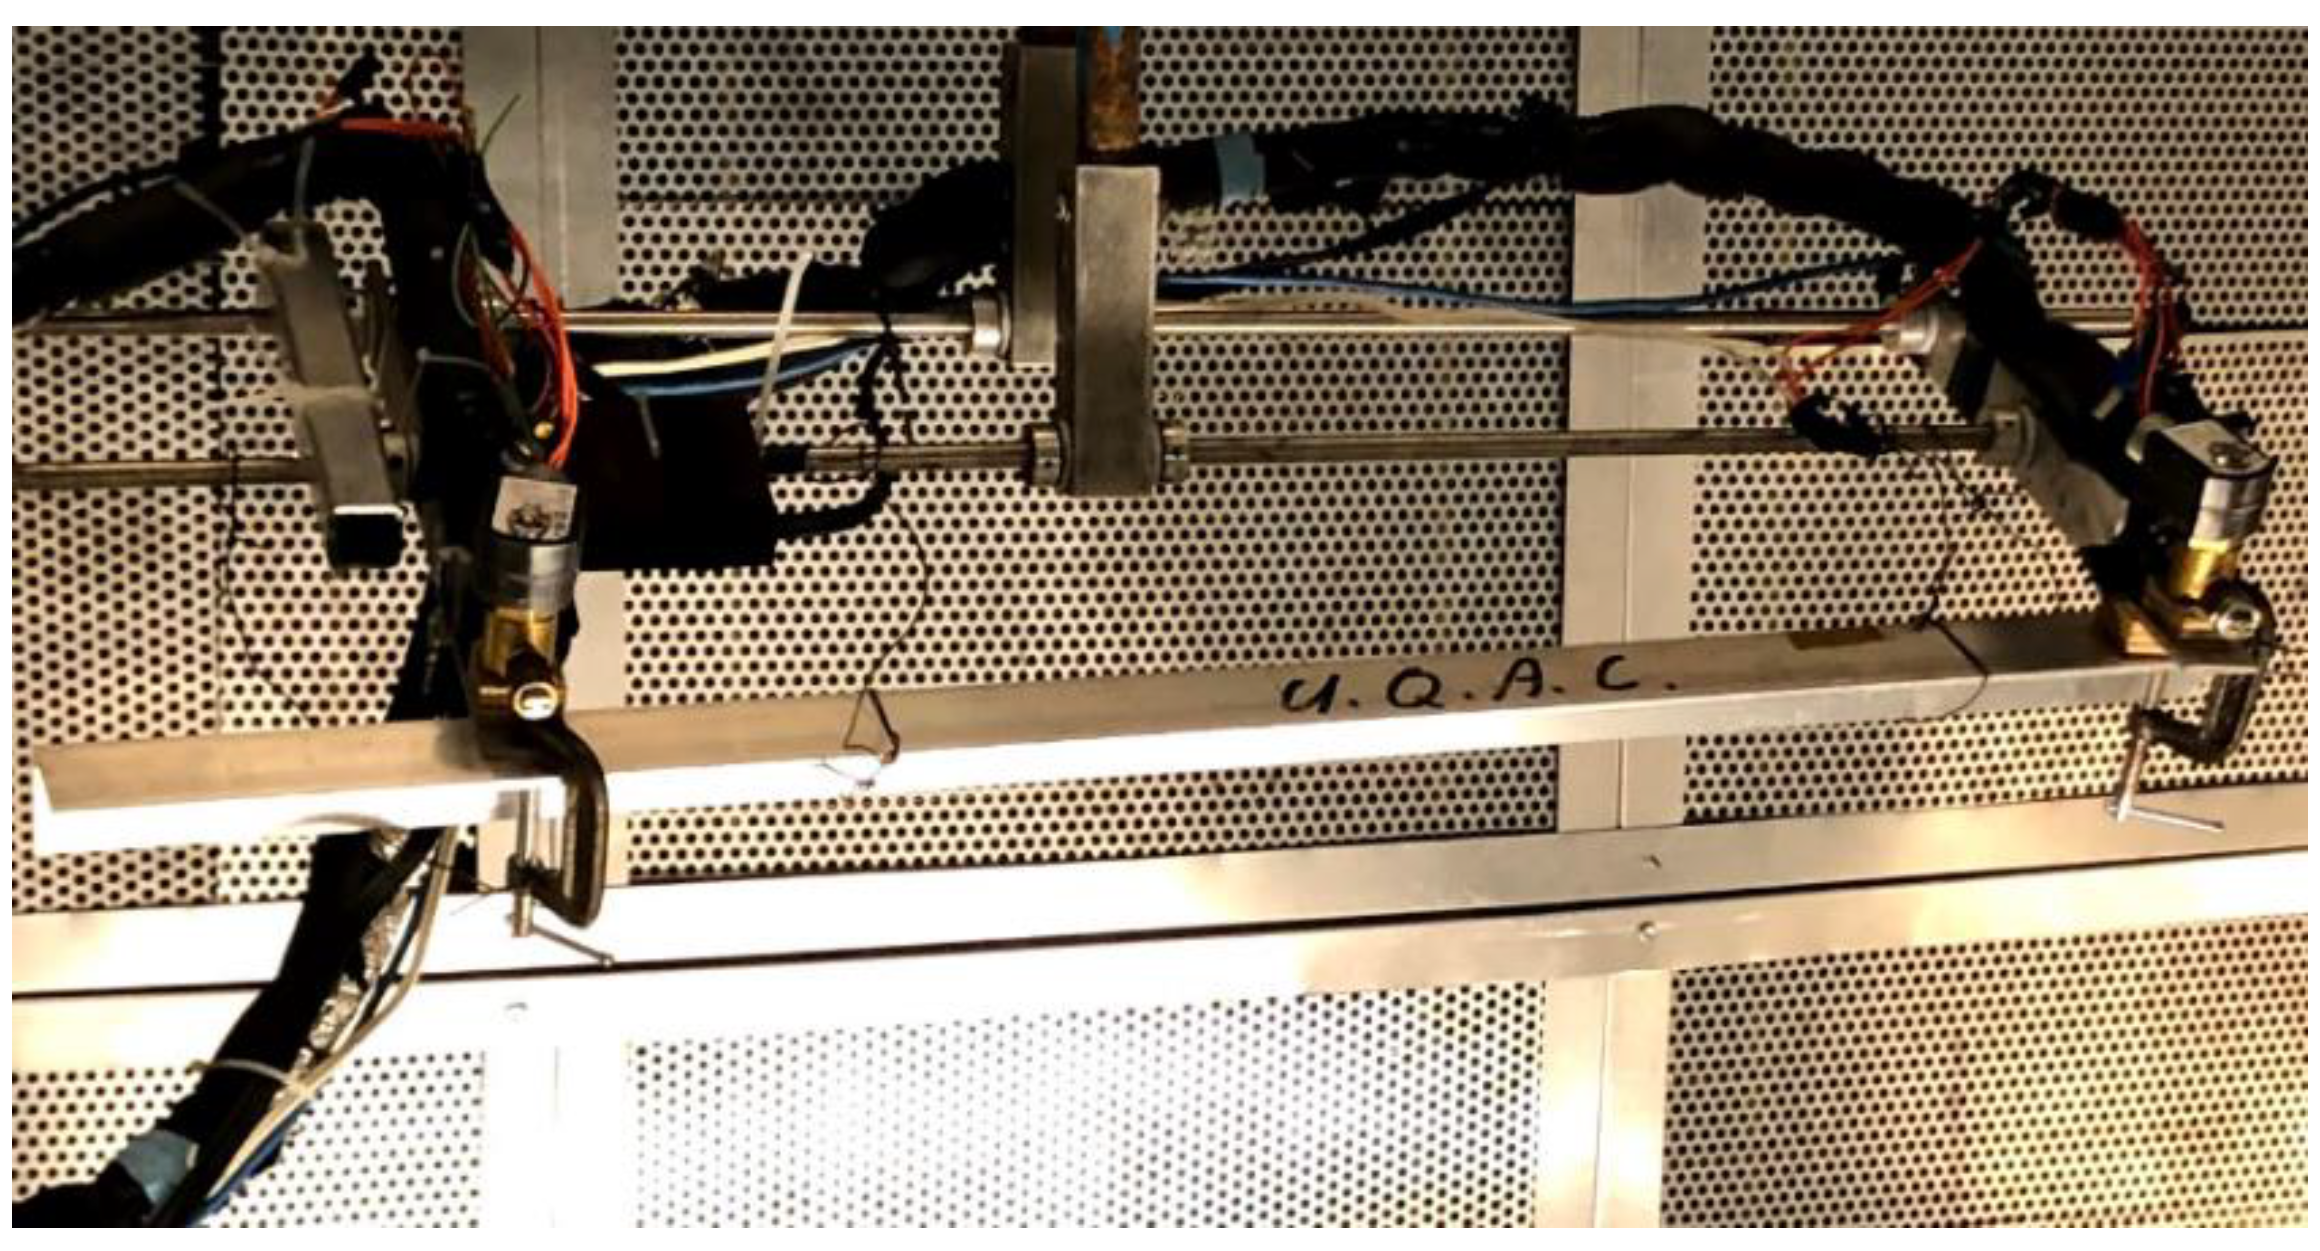
2.2. Drone Rotor Assembly

A 12 kW Hacker Q150-45-4 motor is used to power the drone’s rotor. The motor and hub system are installed in the center of the chamber’s test section on a pneumatic cylinder, as shown in Figure 3. To measure the thrust, torque and mechanical power consumption of the rotor, a 2-axis Futek MBA-FSH04262 load cell was added between the motor and the holding post. Data acquisition and control of the rotor system were performed using a custom LabVIEW interface.
The rotor studied in this experiment is the slightly modified 81% scaled version of the Bell APT70 drone rotor with a total diameter of 0.66 m. It has 4 blades (see Figure 3 and Figure 4) with a NACA 4412 aerodynamic profile. Each blade is formed of two carbon fiber parts that are glued together to form one hollow blade 25.4 cm long. The blades are twisted and have a variable chord from root to tip. Equations (1) and (2) are used to describe the curve fitting result based on the non-dimensional radial location r for the twist ϕ (°) and chord c (m), respectively.
ϕ = −65.187r3 + 169.58r2 − 161.36r + 68.5
c = (−10.632r4 + 30.997r3 − 33.185r2 + 13.566r+0.0397) × 2.54/100

2.3. Test Parameters

To select the icing conditions for testing, two main standards are used: the FAA/AR-09/45 [35] and the SAE ARP 5485 [36] and AS5901 [37]. These documents determine the conditions for ground and low-altitude icing. The two types of precipitation selected are freezing drizzle and freezing rain. In addition to those requirements, an additional requirement of 67 g/dm2/h (0.25 in of water per hour) is also defined by the industrial partner itself. Three air temperatures are selected to obtain glaze, mixed and rime ice accumulations. The comprehensive grid of icing conditions selected for the whole test campaign and the rational for each of those conditions are presented in Table 1.
Three levels of RPM are targeted for a comprehensive investigation: low (3880 RPM), medium (4440 RPM) and high (4950 RPM). The selected rotation speed values were selected based on similarity parameters with the full-scale APT70 rotor. All the details of the test parameter selection and calibration are presented in [34], as well as the comprehensive explanation of the methodology used to convert precipitation rate to LWC.

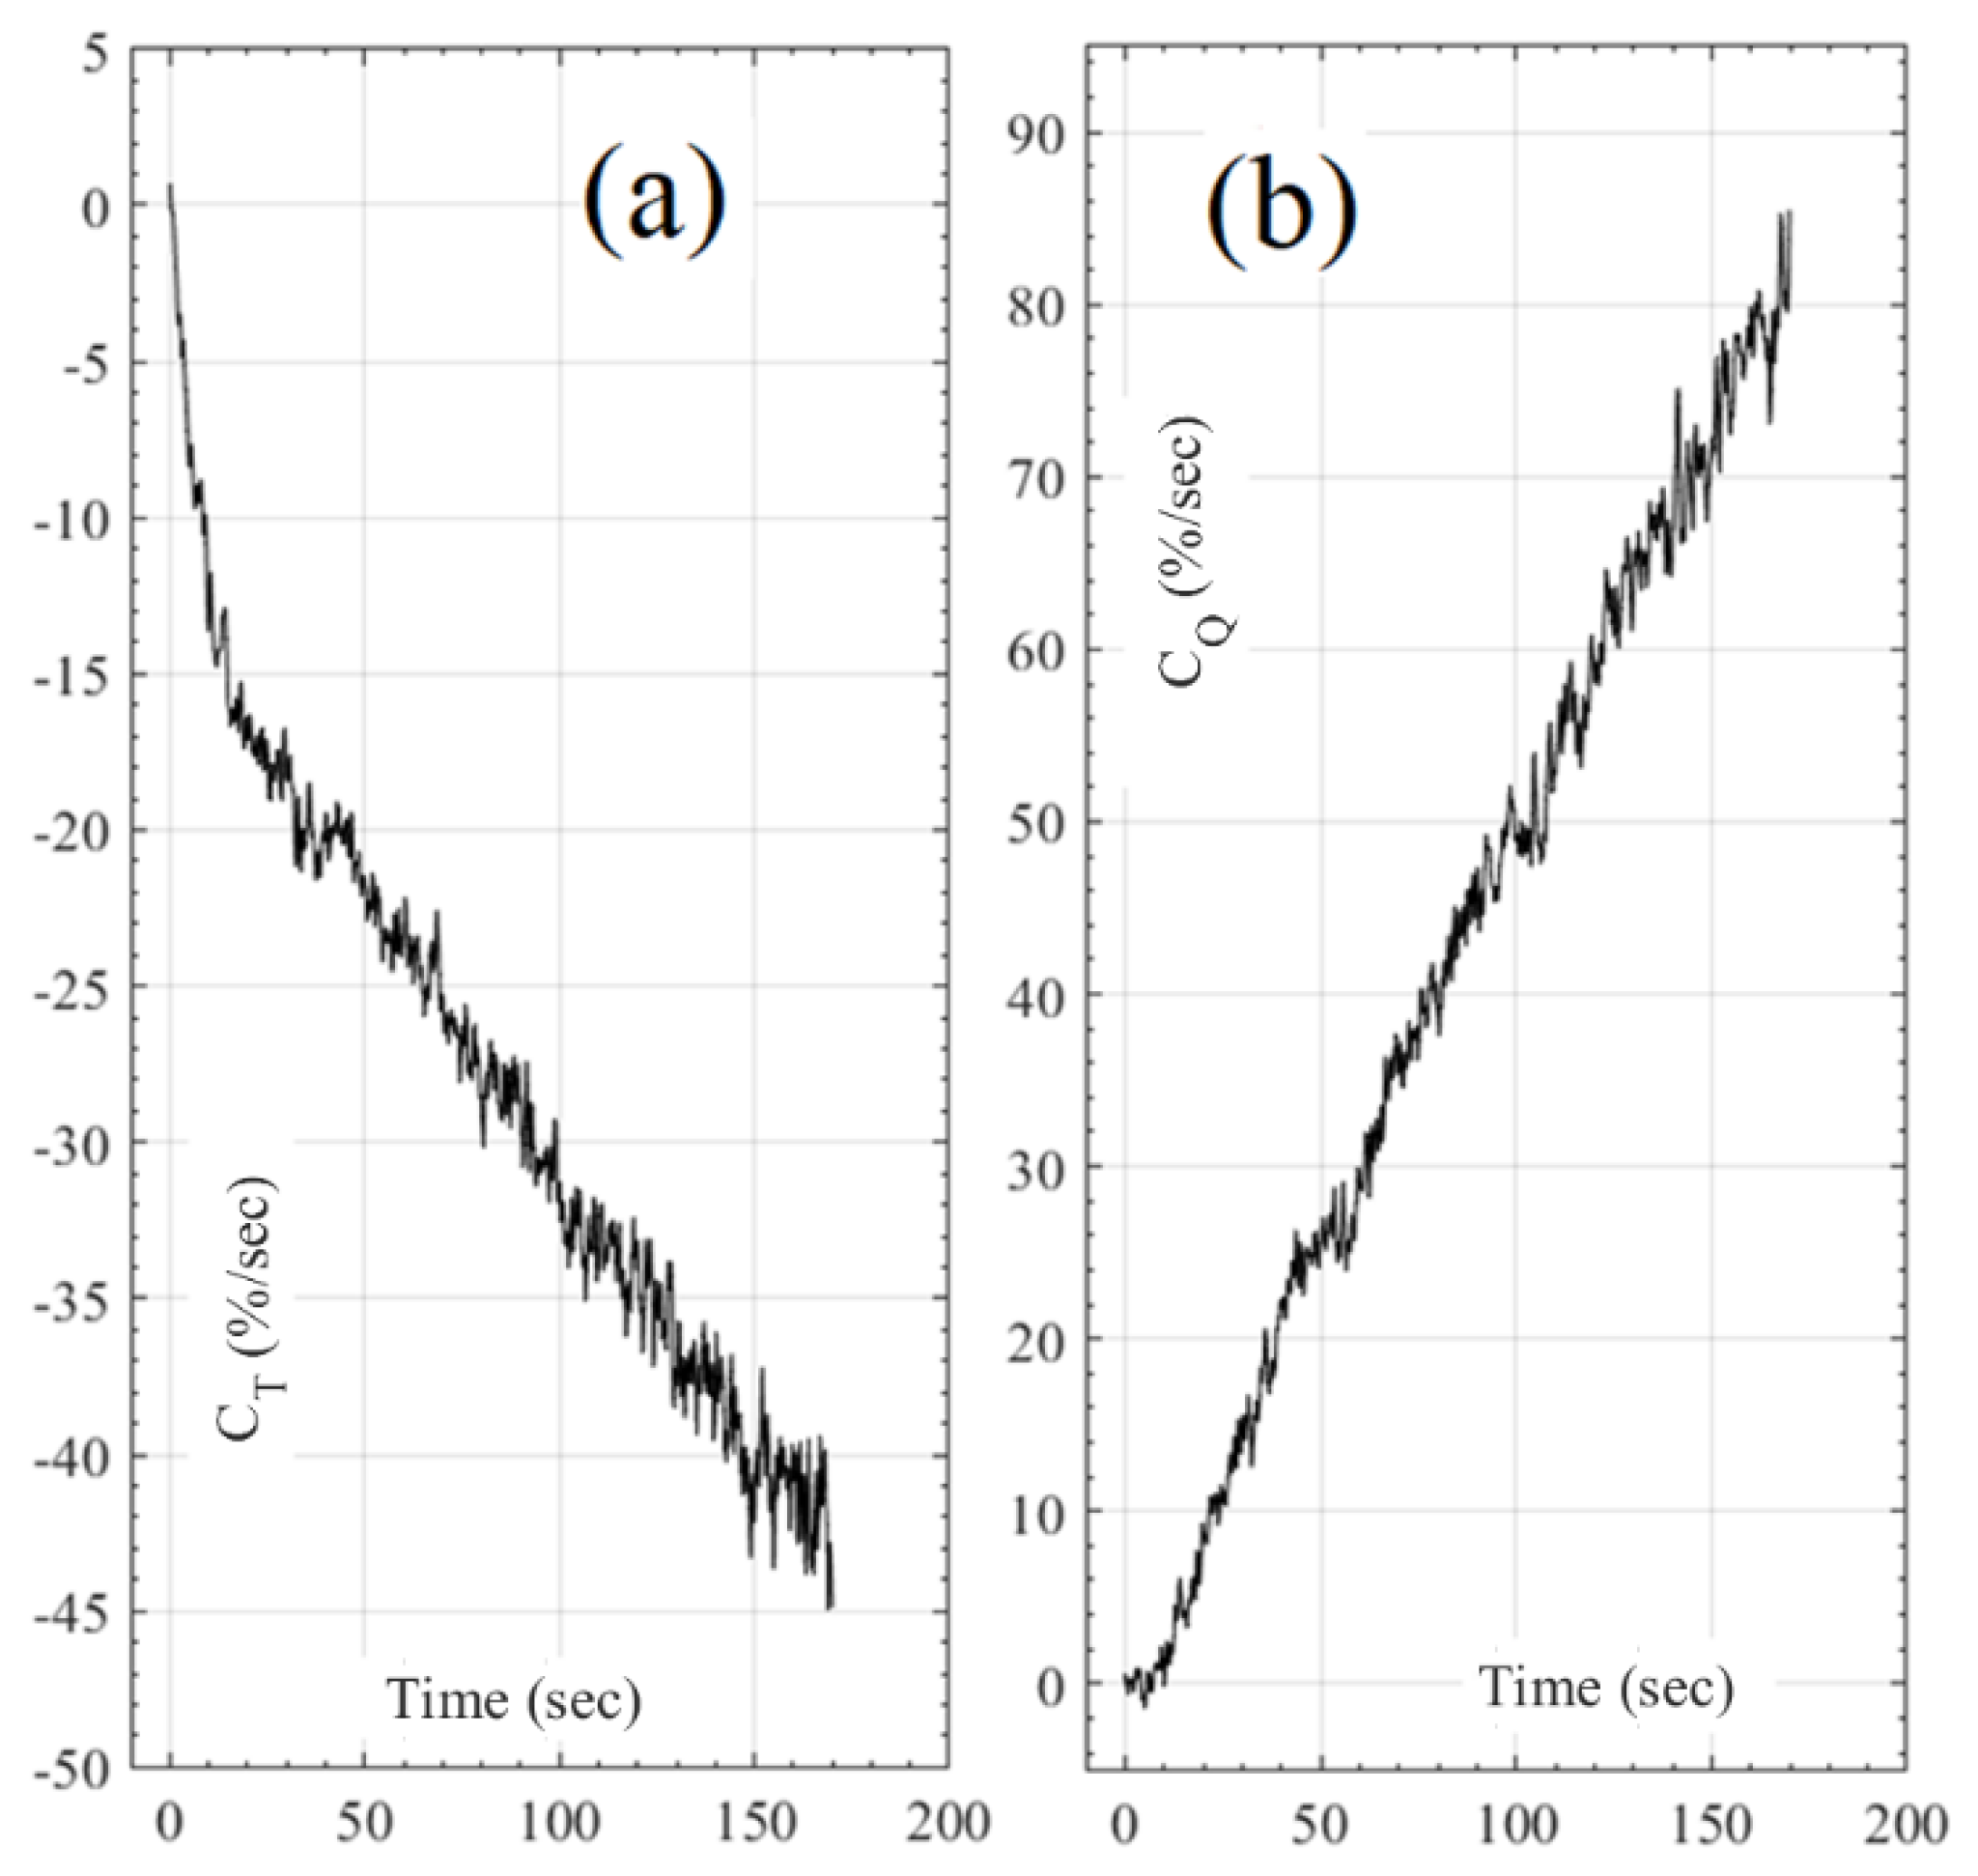
2.4. Post-Processing and Non-Dimensional Coefficients

Icing tests were conducted in the cold chamber following a specific protocol consisting of generating a water spray in the cold room once the rotor had reached the targeted rotation speed. When ice shedding from the blade occurred and vibration levels reached values above a pre-established limit of 1 inch per second (ips), the test was stopped and photography and final measurements were made on the blades.
To process the data and determine the severity of each test, non-dimensional coefficients are used for test comparison. The non-dimensional thrust coefficient CT and the torque coefficient CQ for each test are calculated as shown in Equations (3) and (4), where ρ is the density of air (kg/m3), Ω is the rotor speed (rev/s) and d is the rotor diameter (m).
CT = T/ρΩ2d4
CQ = Q/ρΩ2d5
For each test, average values for each of the recorded parameters during the stabilization period, prior to water initiation, must be established. Figure 5 shows an example of an icing test, where the stabilization period is highlighted in orange for all the curves of rotor speed and electrical power (Figure 5a), as well as for the torque and thrust (Figure 5b). The stabilization period begins after the rotor reaches the target speed and ends at the beginning of the water spray, which is directly followed by an increase in torque and decrease in thrust.
To observe the effect of ice accretion on rotor performance, the measurements taken during icing are compared to their calculated average values prior to water initiation. This is how Figure 6 was obtained, which shows the percentage decline in the measured CT with time (Figure 6a) as well as the parallel percentage increase in CQ (Figure 6b), based on their respective average values without ice. The x-axis in Figure 6 represents the time after the water spray is activated, so t = 0 s is the moment the water spray is initiated, which is also t = 100 s in Figure 5.

3. Results

The results obtained during the experimental test campaign are presented for the different test parameters investigated. The effects of precipitation rate, LWC, MVD, temperature, rotation speed and pitch angle on the calculated thrust and torque degradation during icing and for tests with similar parameters are examined. Measurements of the accreted ice thicknesses at the end of each test are reported and compared. Furthermore, to assist with the data analysis, a photography setup was constructed for the purpose of documenting the accumulated ice on the blades. The use of this setup also made it possible to obtain steady images of the ice accretion during an icing test and at different time intervals, such as the photo sequence shown in Figure 7 and Figure 8.
All the icing tests were run until a piece of ice had naturally shed from one or multiple blades, causing severe vibrations for the rotor and forcing the test to be stopped. Ice shedding was detected by the direct noise of the chunk of ice colliding on the plexiglass walls, as well as by the sudden jump in vibration rates. Figure 9 presents photos taken at the end of an icing test for two different blades, showing a typical ice shedding result. While the rotor is spinning and accumulating ice, the centrifugal forces increase due to the continuously increasing mass of accumulated ice. Once these forces become stronger than the combined adhesion force between the ice and the blade surface and the cohesion force within the ice layer itself, ice shedding occurs. The shedding event causes the vibration rates to skyrocket and exceed the safe operation limit, causing the stopping of the tests.

3.1. Icing Intensity (Precipitation Rate and Liquid Water Content)

This section examines test cases where the icing intensity was increased for constant test parameters. Since an increase in precipitation rate automatically results in an LWC increase (and vice versa), these conclusions apply and are valid for both parameters. For four different icing conditions, the rate of thrust degradation is presented in Figure 10, and Figure 11 shows the corresponding rate of torque degradation. The thrust and torque degradation with time become more significant as the icing intensity (λ and LWC) is increased, as expected. In other words, CT decreases and CQ increases more rapidly as a direct result of an increasing λ and LWC, regardless of the MVD, T and Ω. When all other icing parameters are held constant, this increase leads to a faster and more severe ice accumulation on the blades. In order to prevent or avoid the effects of these icing conditions, an ice protection system must be used, either passive [32], active [17] or hybrid [16], and these systems will be discussed in other papers.
To conduct tests at the same LWC for different water droplet MVD, the precipitation rate needs to be adjusted, as seen in Figure 10 and Figure 11. For example, at LWC = 0.5 g/m3, the precipitation rate is only 5 g/dm2/h for the smaller droplets, while it is 67 g/dm2/h for the larger droplets. The conversion from precipitation rate to LWC for all the tests is shown in Table 1. Since there is no wind velocity, unlike for tests in a wind tunnel, the LWC is calculated using the droplets’ freefall velocities [34]. For a finite volume of air with a constant mass of water (LWC), the mass of water entering the volume of air will equal the mass of water that leaves. Since the freefall velocity of the larger droplets is higher, this will result in a significantly higher precipitation rate for the same LWC. The LWC seems to be a more relevant way to compare the effect of the icing on the rotor performance degradation than the precipitation rate. When the rotor blades are spinning, they hit the relatively static mass of water that is present in the given volume of air in front of them. The droplet vertical velocity is negligible in comparison to the blade velocity. For the range of RPM tested, the blade tangential velocity varies from 67 m/s at 50% of blade radius to 171 m/s at the tip, and the fastest droplet velocity (at MVD = 800 µm) is around 4 m/s [34]. This is more than one order of magnitude faster than the droplet freefall velocity. This is why almost all the ice accretion is at the blade stagnation point close to the leading edge rather than on the blade upper surface, as would be the case if the blades were static. For these reasons, the LWC is used in the rest of the paper instead of the precipitation rate.

3.2. Droplet Size (MVD)

For similar LWC, the degradations of the performances are more important for the larger droplets, as shown in Figure 12. This is also shown in Figure 13 by the thicker ice accretion on the rotor tested with the larger droplets. Even if a small portion of ice has shed close to the tip of the blade with the smaller droplets, the ice accretion is higher close to the blade tip, and for the whole span of the blade for the larger droplet. To achieve similar performance degradation with the smaller droplets as with the larger ones, the LWC needs to be 5 times higher (2.4 g/m3). The higher ice accumulation at constant LWC for the larger droplets can be attributed to their higher inertia. The collection efficiency is dependent on the shape and dimension of an object as well as on the particle inertia, velocity and flow streamlines. The larger droplets are less likely to follow the streamlines around the airfoil due to their higher inertia, and will impact the leading edge instead, resulting in a higher accretion rate [38,39].
Although the water droplet collection efficiency is usually higher near the tips [40], driven by the higher blade local velocity in that region, the lower ice accretion near the tips shown in Figure 7 and Figure 8 was consistent throughout the tests performed in this study, independent of the test conditions. Similar results as the ones reported here were also obtained by NASA’s experiments for the hovering UH-1H [41], as well as those of the NRC’s hovering UAS [39]. Since the collection efficiency is highly dependent on the shape and dimension of an object, the significant differences in profile and chord length along the blade as compared to previous tests performed in the literature could explain the unexpected absence of ice near the tip. The accumulation observed towards the tip in Figure 14 shows the effect of tip-vortex as a function of droplets MVD. In Figure 14a, for the smaller droplets, the accumulation decreases considerably for the last 15–20% of the blade before greatly and abruptly increasing at its very tip, with the droplets being largely impacted by the tip-vortex and airflow. Figure 14b shows that the larger droplets, with more inertia, are less affected and the accumulation follows a more linear accumulation for the same rotation speed. This confirms that ice accretion is generated by the advancing movement of the blade in a volume of air filled with water droplets and not by falling droplets and their freefall velocities. More investigative efforts will be made in the near future to perform a complete investigation of the blade’s collection efficiency and surrounding airflow during rotation for the hovering case.

3.3. Rotor Speed

This section examines the effect of increasing Ω on the aerodynamic degradation during icing. Examples of thrust and torque degradation with time during icing in different test conditions are presented in Figure 15 and Figure 16, respectively, where the main comparison is made between tests for different Ω. The rotor speed had a direct effect on the severity of ice accumulation on the blades. Based on the data of Figure 15 and Figure 16, an increase in Ω directly decreased the degradation of the rotor aerodynamic parameters. Therefore, the thrust degradation was more severe when the rotor operated at the lowest speeds, compared to tests with higher Ω and regardless of all other icing parameters.
Ice measurements for tests at different rotor speeds are presented in Figure 17. Further examination of ice shape photographs taken after testing are presented in Figure 18 and Figure 19. For the case of 120 µm and −5 °C (Figure 18), a thick presence of ice is found at the tips for 3880 RPM, along with the lobster tail shape of ice extending farther from the blade tip (Figure 18a). When the speed is increased, the ice becomes thinner at 4440 RPM with no lobster tail shape (Figure 18b). A further increase to 4950 RPM shows almost no ice accumulation towards the blade tips (Figure 18c). The same phenomena are observed for the other test cases (Figure 17 and Figure 19). Again, the faster performance degradation is due to a faster and heavier accumulation. The fact that the tip is also more severely affected at lower RPM plays a significant role in the higher degradation. More ice at the tips means faster aerodynamic degradation and therefore explains the severity of tests increasing as Ω is decreased. The collection efficiency for rotating blades is directly related to the flow velocity [40,42], so an increase in rotor speed was therefore expected to produce thicker ice as Ω increased. However, such conclusions are usually obtained for forward flight with a high-velocity airflow as well as for standard extruded aerodynamic profiles (NACA0012, untwisted with constant chord length). In this case, the collection is only generated by the rotation of the blades, demonstrated by the absence of ice accumulation on top of the blades where the droplets would otherwise impact, and the blades greatly vary in chord and twist angle along their span. Figure 19 shows once again the large effect of tip-vortex caused by rotation and geometry of the blade on the droplet trajectories and the resulting accumulation, and most importantly how the increase in rotation speed affects the overall vortex/airflow surrounding the blade during rotation. Finally, similar experiments at NASA [41] and the NRC [39] have shown that different outcomes than expected for forward flight can be obtained in hovering mode. Even if they did not test multiple Ω, the absence of ice accumulation towards the tip, as opposed to other studies, show the importance of understanding and studying flow and vortex distributions and collection efficiencies for rotating blades varying in chord length and twisted in hover mode.

3.4. Air Temperature
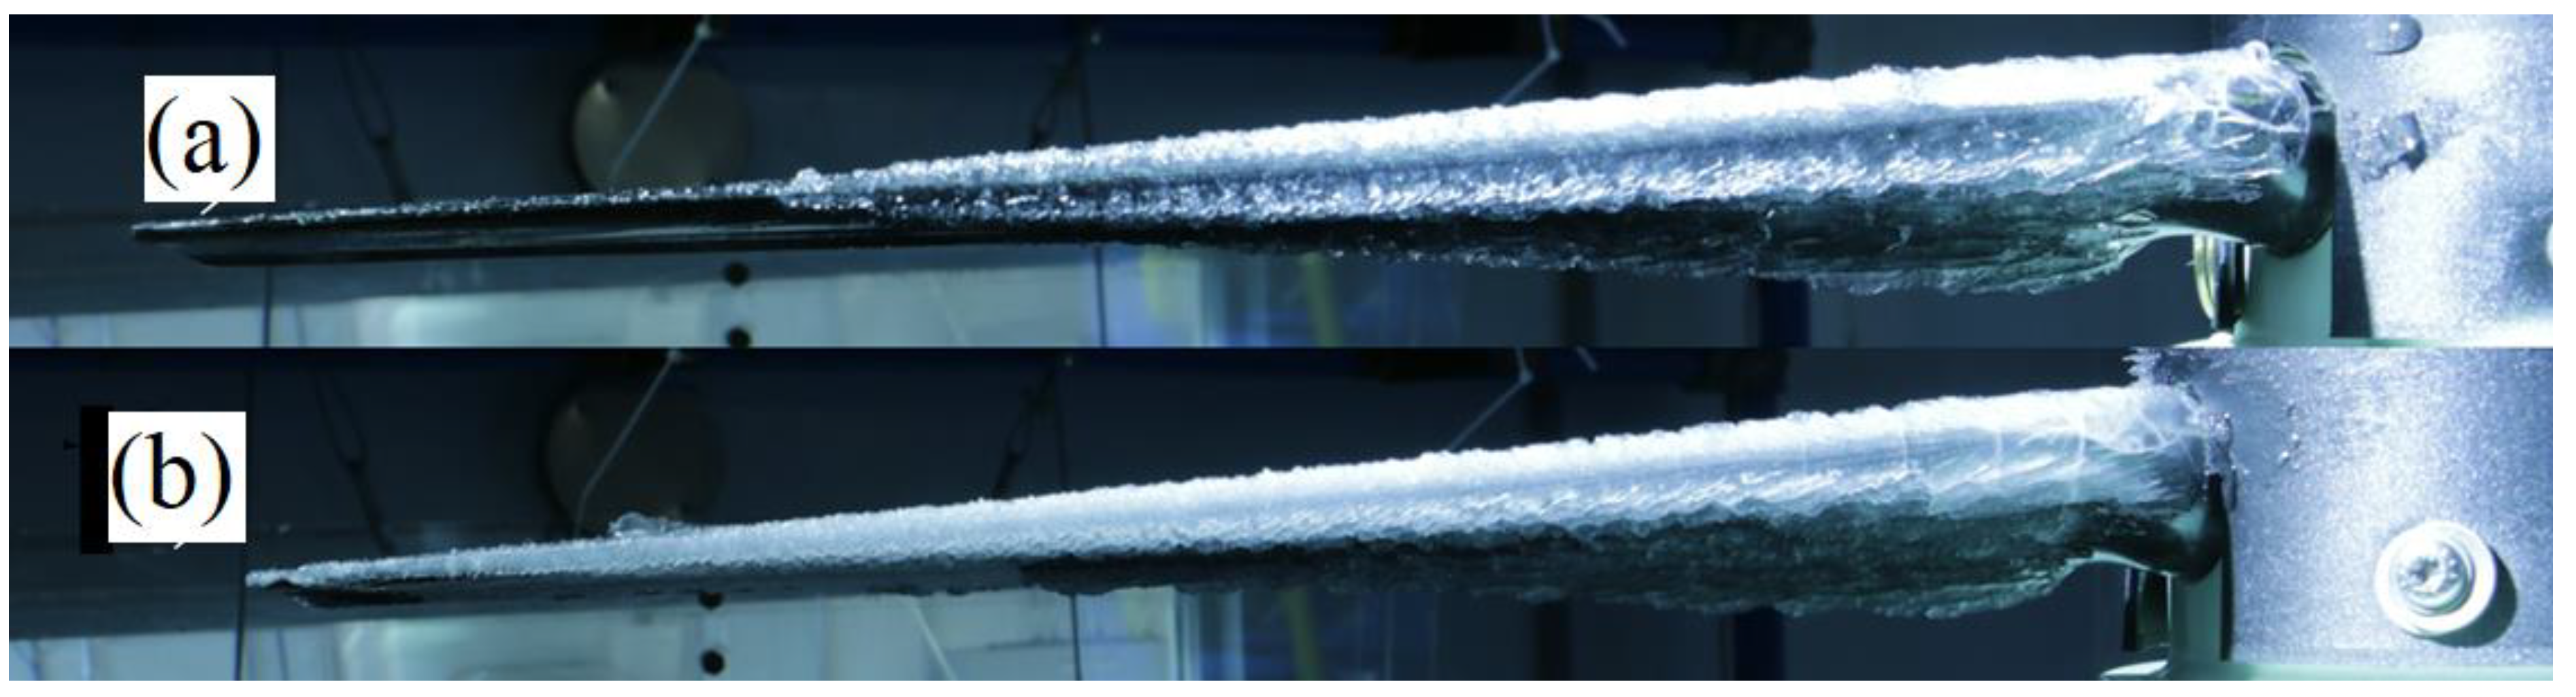
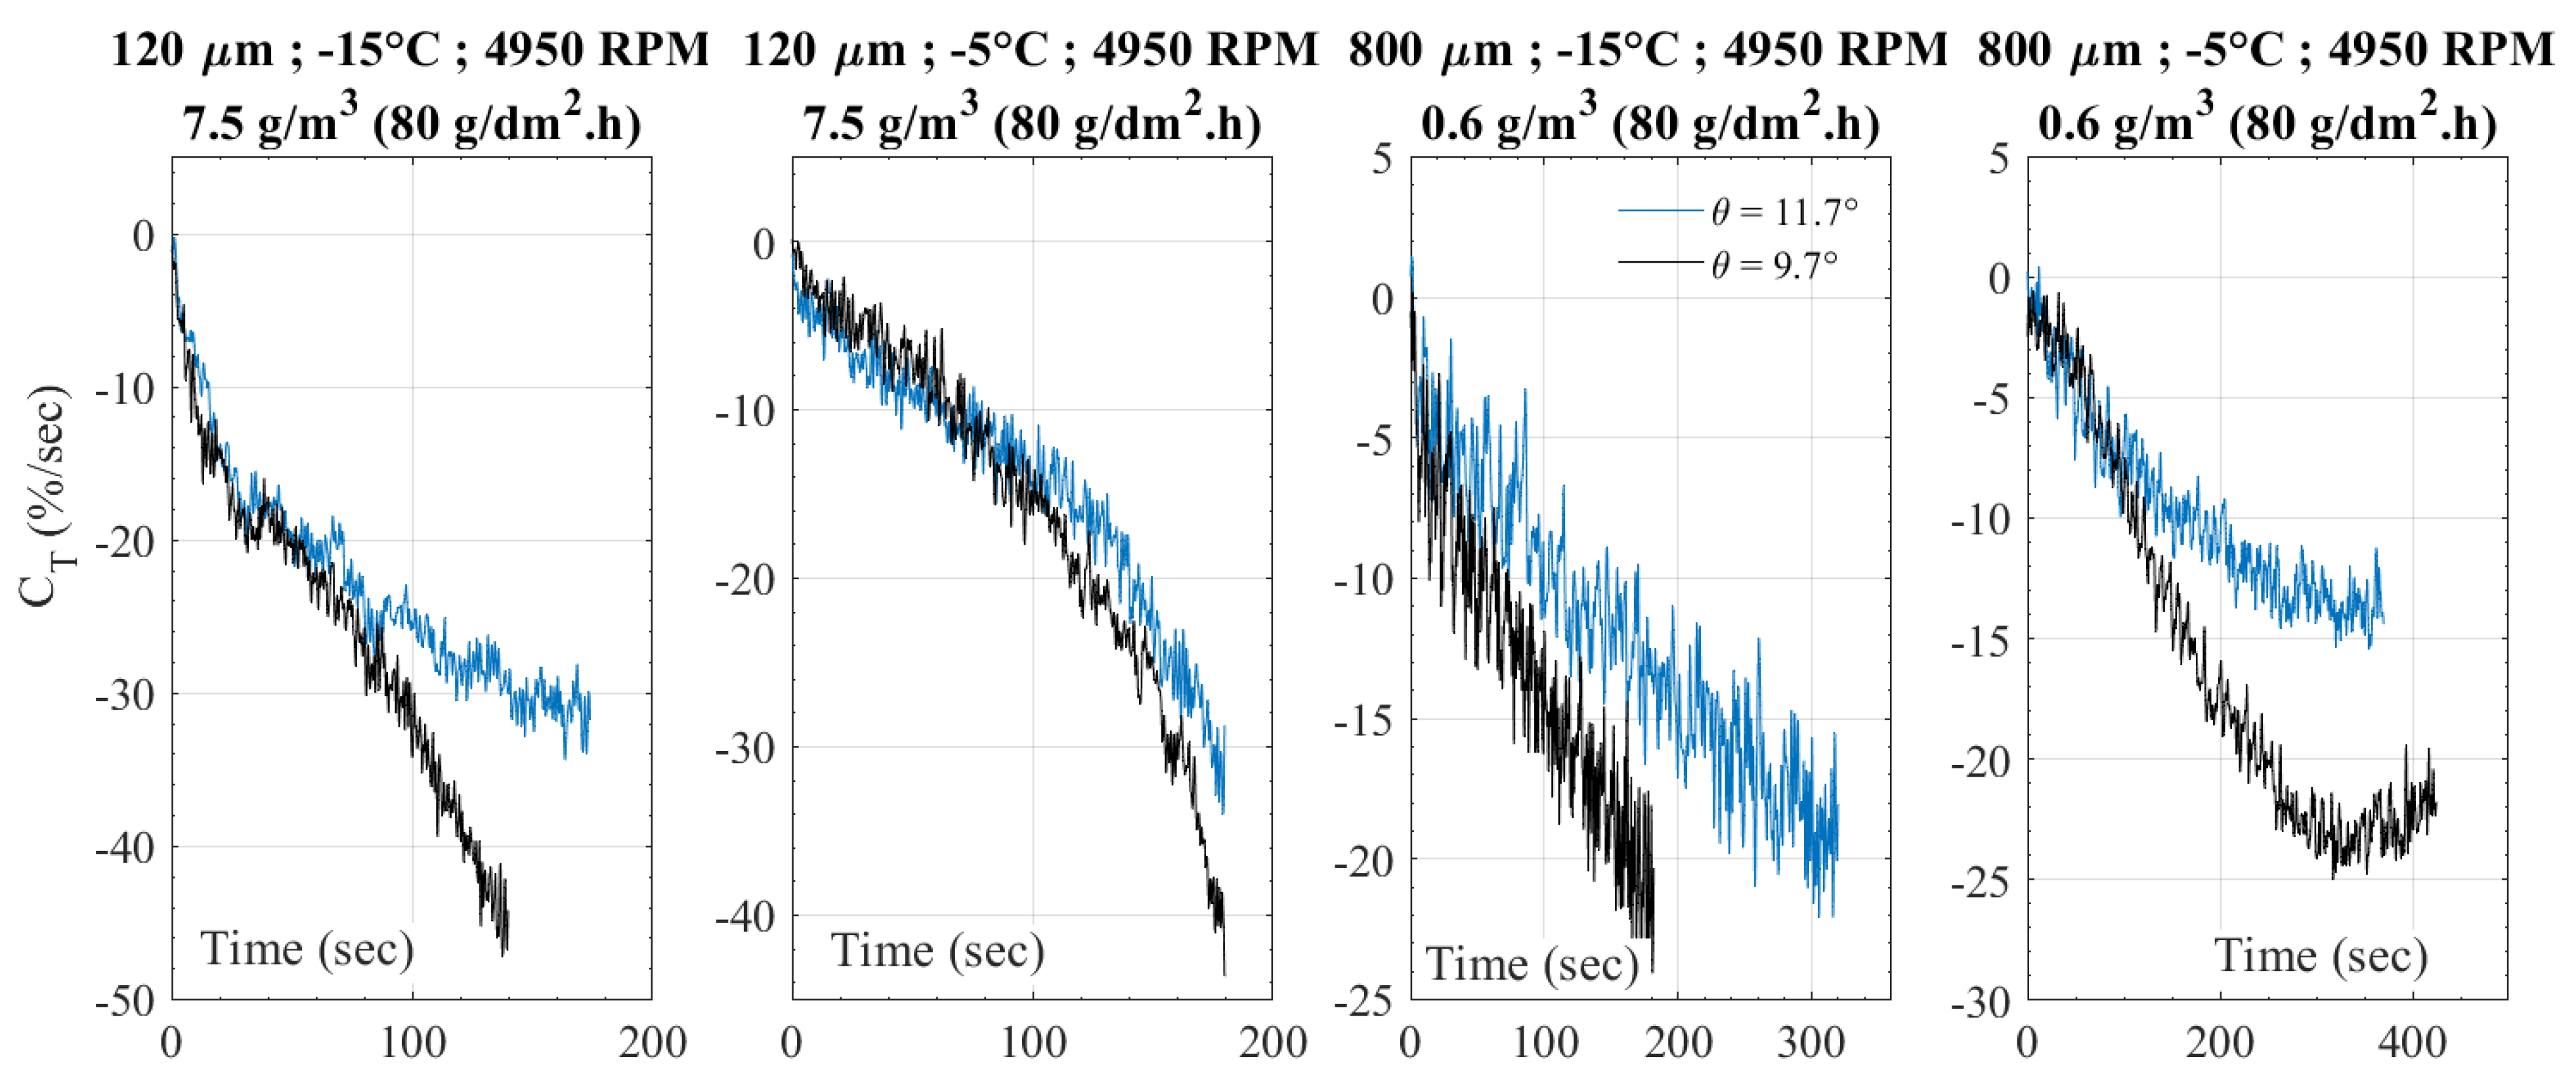
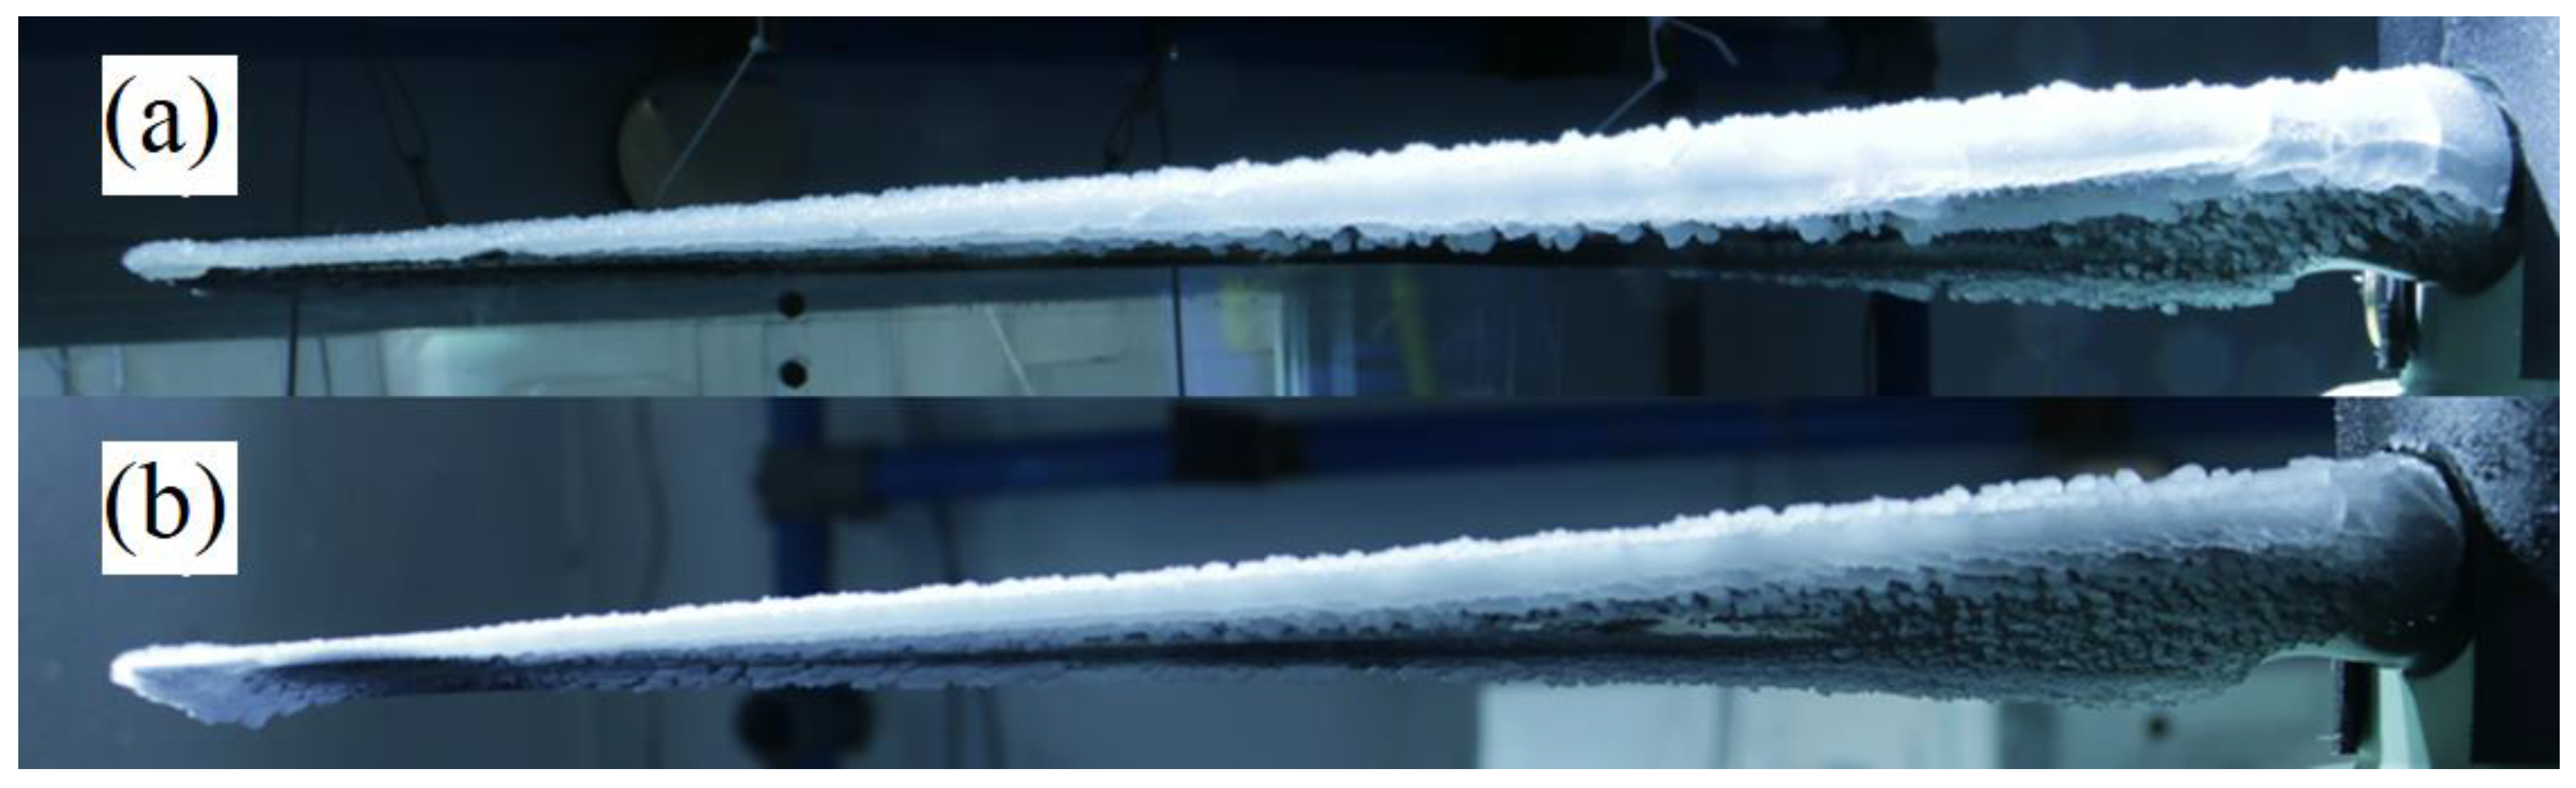
In this section, the results are analyzed for tests performed with the same parameters but at different air temperatures (−15 °C, −12 °C and −5 °C). At the warmer temperature (−5 °C), during the droplet impact on the blade surface and its subsequent solidification, the latent heat of fusion would not be adequately removed either by the surrounding convective heat transfer nor the conductive heat transfer [43]. The resulting ice shape would then be a transparent and smooth ice layer, both being characteristics of glaze ice, clearly seen in Figure 7 and Figure 20a, and similar to that obtained in previous icing studies [18,42]. Glaze ice forms when the impacting droplets partially freeze on the blade while other droplets remain liquid and are transported by the surrounding airflow of the airfoil section, further extending across the blade and filling gaps between the already accreted ice. At lower temperatures (−15 °C and −12 °C), the droplets freeze on the surface more quickly compared to the glaze ice tests, resulting in mixed or rime ice accumulations, such as those seen in Figure 8 and Figure 20b and in [18,42]. Droplets freeze immediately upon impinging the blade and the result is a rime ice shape, characterized by a milky-white and opaque appearance, as shown in Figure 8 and Figure 20b.
The analysis is divided into two parts, with the first one analyzing the effect of temperature for tests with MVD = 120 µm and the second part dedicated to the tests with MVD = 800 µm. Figure 21 and Figure 22 present the thrust and torque degradation, respectively, for the tests with MVD = 120 µm. Based on the data presented in the figures, a decrease in air temperature from −5 °C to either −12 °C or −15 °C did not generally affect the outcome of icing tests for similar conditions at this droplet size. The accumulation rate was similar at both temperatures. However, the type of ice obtained was different for reasons detailed previously. This result is somewhat in line with the results obtained in [39].
The effect of lowering T for tests with MVD = 800 µm had a different effect on the results, as presented in Figure 23 and Figure 24. Tests with lower temperatures showed faster thrust loss and a more rapid torque increase throughout the duration of tests, compared to tests at −5 °C. This behavior was consistent among all tests with the larger droplets. The accumulated ice for these tests presented a different shape at the two temperatures. Figure 25 shows accumulations at the end of tests at both temperatures. For the larger droplets, almost no ice accumulates in warmer temperatures at the tip due to the droplets that do not have time to reach the air temperature and aerodynamic heating increasing their temperature closer to their freezing point, which explains the lower accretion rate and lower degradation at −5 °C. This phenomenon was also observed in some other studies [13] and during the calibration of the test setup height [34]. While [39] obtained similar thicknesses and degradation for different temperatures, their maximum droplet size was 300 µm, significantly lower than 800 µm, where this type of behavior is not expected. The type of ice obtained is also different, with glaze ice obtained at −5 °C, where water does not freeze at impact and flow on or get expelled from the blade before freezing, confirming those conclusions.

3.5. Pitch Angle

Icing tests were carried out to examine the effect of changing the pitch angle between θ = 11.7° and θ = 9.7°. The thrust and torque degradation with time during icing for the different tests performed are presented in Figure 26 and Figure 27, respectively. Changing the pitch angle between θ = 11.7° and θ = 9.7° has a small impact on thrust degradation, as shown in Figure 26. On the other hand, a lower blade pitch strongly increases the torque degradation, as shown in Figure 27. This effect was consistent among all the examined test cases. A previous study found that increasing the pitch angle seems to greatly influence blade tip ice accretion [12], with the increase in pitch leading to thinner ice accumulation near the tips, which agrees with the results seen in this work. Figure 19 shows that for higher RPM, there is less ice accretion under the blade close to the tip due to a stronger tip-vortex caused by higher thrust production, overall leading to less performance degradation. With a higher blade pitch angle, the rotor thrust is higher, similar to increasing RPM, and thus the strength of its tip-vortex is also higher, leading to less ice accretion close to the tip and less performance degradation. Ice accretion outboard the blade tip, as shown in Figure 18a for low RPM testing, could lead to a significant increase in torque and small decrease in thrust, which would be in accordance with the two figures below. Ice accretion outboard the blade tip has a small impact on local blade lift but adds an extra local drag, and due to the long moment arm from the blade tip to the rotation axis, it generates a significant torque increase. Figure 28a shows that at θ = 9.7°, ice accreted outboard the blade tip. With a higher blade pitch, the rotor-induced axial velocity is higher, which could change the droplet trajectories and thus the impact on performance degradation. The effect of blade pitch seems to be in accordance with the effect of RPM, which indicates that a correlation might exist between the performance degradation and thrust coefficient.

4. Conclusions

This paper presented the results and analysis of the icing experiments conducted on the rotor of an APT70 drone in hover mode. Tests were carried out in AMIL’s 9M cold chamber for a wide range of conditions (median volume diameter MVD, air temperatures T, rotor speeds Ω, precipitation rates λ, liquid water content LWC, pitch angles θ). The focus of the study was the ice accretion dynamics on the rotor blade, as well as the effects associated with the aerodynamic degradation induced by the accumulated ice. A parametric study on the effect of each of the tested icing parameters was performed.
The LWC proved to be more representative for hover/VTOL testing than the precipitation rate even if it is less practical to use due to the difficulty of its measurement when there is no airflow. When the rotor blades are spinning, the relatively static mass of water that is present in the given volume of air in front of them is driven by the resulting airflow, as observed from the ice accretion found at the blade stagnation point close to the leading edge.
For the other parameters, the performance degradation was attributed to the icing rates and shape obtained on the blade. Larger droplets, lower rotation speeds, lower pitch angles and lower air temperatures increased the performance degradation of the rotor due to faster ice accumulations and often closer to the tip of the blades. Part of the differences in ice accumulations were attributed to the collection efficiency of the blades and the resulting airstream and tip-vortexes around the rotating blades. For example, increasing the RPM led to more energetic streamlines around the rotating blades, driving the smaller droplets past the blades. More investigations will be conducted on those subjects in the near future for a deeper understanding of the droplets’ trajectories and vortex and air flow distribution around the rotating blades in hover mode, depending on the rotation speed and droplet size.
Future works will also consist of developing suitable and optimized ice protection solutions for the blades. Icephobic coatings as well as heating elements will be installed on the blades in future experiments to determine the efficiency of each system.

Author Contributions

Conceptualization, E.V.; methodology, E.V.; validation, E.V., A.S. and M.B.; formal analysis, E.V. and A.S.; investigation, E.V. and A.S.; resources, C.V. and M.L.; data curation, E.V., A.S. and M.B.; writing—original draft preparation, E.V. and A.S.; writing—review and editing, E.V., A.S. and C.V.; visualization, M.B.; supervision, E.V. and C.V.; project administration, E.V. and M.L.; funding acquisition, C.V. All authors have read and agreed to the published version of the manuscript.

Funding

This research was funded by Bell Textron Canada Ltd.

Institutional Review Board Statement

Not Applicable.

Informed Consent Statement

Not Applicable.

Acknowledgments

We acknowledge the support provided by Bell Textron Canada Ltd.

Conflicts of Interest

The authors declare no conflict of interest.

References

  1. Canada, T. Transport Canada’s Drone Strategy to 2025; Government of Canada: Ottawa, ON, Canada, 2021. [Google Scholar]
  2. Villeneuve, E.; Karmouch, E.; Boulerice, X. Development of a small and transportable de-icing/anti-icing drone-mounted system. Part 1: System design. Drone Syst. Appl. 2022, 2, 28. [Google Scholar] [CrossRef]
  3. Villeneuve, E.; Karmouch, E.; Boulerice, X. Development of a small and transportable de-icing/anti-icing drone-mounted system. Part 2: Prototype testing and proof of concept. Drone Syst. Appl. 2022, 10, 382–398. [Google Scholar] [CrossRef]
  4. Hann, R.; Johansen, T.A. Unsettled Topics in Unmanned Aerial Vehicle Icing; SAE Technical Paper; SAE International: Warrendale, PA, USA, 2020. [Google Scholar]
  5. Yamazaki, M.; Jemcov, A.; Sakaue, H. A Review on the Current Status of Icing Physics and Mitigation in Aviation. J. Aerosp. 2021, 8, 188. [Google Scholar] [CrossRef]
  6. Siquig, R. Impact of Icing on Unmanned Aerial Vehicle (UAV) Operations; Naval Environmental Prediction Research Facility: Monterey, CA, USA, 1990. [Google Scholar]
  7. Henry, R.C.; Guffond, D.; Atilde, F.; Garnier, O.; Andre, B. Heat transfer coefficient measurement on iced airfoil in small icing wind tunnel. J. Thermophys. Heat Transf. 2000, 14, 348–354. [Google Scholar] [CrossRef]
  8. Dukhan, N.; Dukhan, N.; de Witt, K.J.; Masiulaniec, K.C.; van Fossen, G.J., Jr. Experimental Frossling numbers for ice-roughened NACA 0012 airfoils. J. Aircr. 2003, 40, 1161–1167. [Google Scholar] [CrossRef]
  9. Tsao, J.-C.; Lee, S. Evaluation of Icing Scaling on Swept NACA 0012 Airfoil Models; NASA Glenn Research Center: Cleveland, OH, USA, 2012. [Google Scholar]
  10. Tsao, J.-C. Further Evaluation of Swept Wing Icing Scaling with Maximum Combined Cross Section Ice Shape Profiles. In Proceedings of the 2018 Atmospheric and Space Environments Conference, 25–29 June 2018; American Institute of Aeronautics and Astronautics: Atlanta, GA, USA, 2018; p. 3183. [Google Scholar]
  11. Korkan, K. Experimental Study of Performance Degradation of a Rotating System in the NASA Lewis RC Icing Tunnel; Texas A&M University; Department of Aerospace Engineering: College Station, TX, USA, 1992. [Google Scholar]
  12. Brouwers, E.W.; Palacios, J.L.; Smith, E.C. The experimental investigation of a rotor hover icing model with shedding. In Proceedings of the American Helicopter Society 66th Annual Forum, Phoenix, AZ, USA, 11–13 May 2010; pp. 1863–1875. [Google Scholar]
  13. Palacios, J.L.; Han, Y.; Brouwers, E.W.; Smith, E.C. Icing environment rotor test stand liquid water content measurement procedures and ice shape correlation. J. Am. Helicopter Soc. 2012, 57, 29–40. [Google Scholar] [CrossRef]
  14. Liu, Y.; Li, L.; Hu, H. An Experimental Study on the Effects of Surface Wettability on the Ice Accretion over a Rotating UAS Propeller. In Proceedings of the 9th AIAA Atmospheric and Space Environments Conference, AIAA, Denver, CO, USA, 5–9 June 2017. [Google Scholar]
  15. Villeneuve, E.; Volat, C.; Ghinet, S. Numerical and Experimental Investigation of the Design of a Piezoelectric De-Icing System for Small Rotorcraft Part 3/3: Numerical Model and Experimental Validation of Vibration-Based De-Icing of a Flat Plate Structure. J. Aerosp. 2020, 7, 54. [Google Scholar] [CrossRef]
  16. Villeneuve, E.; Blackburn, C.; Volat, C. Design and Development of an Experimental Setup of Electrically Powered Spinning Rotor Blades in Icing Wind Tunnel and Preliminary Testing with Surface Coatings as Hybrid Protection Solution. J. Aerosp. 2021, 8, 98. [Google Scholar] [CrossRef]
  17. Villeneuve, E.; Ghinet, S.; Volat, C. Experimental Study of a Piezoelectric De-Icing System Implemented to Rotorcraft Blades. J. Appl. Sci. 2021, 11, 9869. [Google Scholar] [CrossRef]
  18. Samad, A.; Villeneuve, E.; Blackburn, C.; Morency, F.; Volat, C. An experimental investigation of the convective heat transfer on a small helicopter rotor with anti-icing and de-icing test setups. J. Aerosp. 2021, 8, 96. [Google Scholar] [CrossRef]
  19. Narducci, R.; Kreeger, R.E. Analysis of a Hovering Rotor in Icing Conditions; NASA: Phoenix, AZ, USA, 2012. [Google Scholar]
  20. Narducci, R.; Kreeger, R.E. Application of a High-Fidelity Icing Analysis Method to a Model-Scale Rotor in Forward Flight; NASA: Virginia Beach, VA, USA, 2012. [Google Scholar]
  21. Aubert, R. Additional Considerations for Analytical Modeling of Rotor Blade Ice. In Proceedings of the SAE 2015 International Conference on Icing of Aircraft, Engines, and Structures, 22–25 June 2015; SAE International: Prague, Czech Republic, 2015. [Google Scholar]
  22. Beaugendre, H.; Morency, F.; Habashi, W.G. FENSAP-ICE’s three-dimensional in-flight ice accretion module: ICE3D. J. Aircr. 2003, 40, 239–247. [Google Scholar] [CrossRef]
  23. Hannat, R.; Morency, F. Numerical validation of conjugate heat transfer method for anti-/de-icing piccolo system. J. Aircr. 2014, 51, 104–116. [Google Scholar] [CrossRef]
  24. Pendenza, A.; Habashi, W.G.; Fossati, M. A 3D mesh deformation technique for irregular in-flight ice accretion. Int. J. Numer. Methods Fluids 2015, 79, 215–242. [Google Scholar] [CrossRef]
  25. Chen, L.; Zhang, Y.; Wu, Q.; Chen, Z.; Peng, Y. Numerical Simulation and Optimization Analysis of Anti-/De-Icing Component of Helicopter Rotor Based on Big Data Analytics. In Proceedings of the Theory, Methodology, Tools and Applications for Modeling and Simulation of Complex Systems, AsiaSim 2016, SCS AutumnSim 2016, Beijing, China, 8–11 October 2016; Springer: Singapore, 2016; pp. 585–601. [Google Scholar]
  26. Lavoie, P.; Pena, D.; Hoarau, Y.; Laurendeau, E. Comparison of thermodynamic models for ice accretion on airfoils. Int. J. Numer. Methods Heat Fluid Flow 2018, 28, 1004–1030. [Google Scholar] [CrossRef]
  27. Özgen, S.; Canıbek, M. Ice accretion simulation on multi-element airfoils using extended Messinger model. J. Heat Mass Transf. 2009, 45, 305–322. [Google Scholar] [CrossRef]
  28. Bottyán, Z. Landscape and Environment. In-flight icing characteristics of unmanned aerial vehicles during special atmospheric condition over the carpathian-basin. ACTA Geogr. Debrecina Landsc. Environ. 2014, 7, 74–80. [Google Scholar]
  29. Szilder, K.; McIlwain, S. In-flight icing of UAVs–the influence of flight speed coupled with chord size. Can. Aeronaut. Space J. 2012, 58, 83–94. [Google Scholar] [CrossRef]
  30. Armanini, S.F.; Polak, M.; Gautrey, J.E.; Lucas, A.; Whidborne, J.F. Decision-making for unmanned aerial vehicle operation in icing conditions. CEAS Aeronaut. J. 2016, 7, 663–675. [Google Scholar] [CrossRef] [Green Version]
  31. Liu, Y.; Li, L.; Ning, Z.; Tian, W.; Hu, H. Experimental investigation on the dynamic icing process over a rotating propeller model. J. Propuls. Power 2018, 34, 933–946. [Google Scholar] [CrossRef] [Green Version]
  32. Liu, Y.; Li, L.; Li, H.; Hu, H. An experimental study of surface wettability effects on dynamic ice accretion process over an UAS propeller model. Aerosp. Sci. Technol. 2018, 73, 164–172. [Google Scholar] [CrossRef]
  33. Hann, R.; Enache, A.; Nielsen, M.; Stovner, B.; van Beeck, J.; Johansen, T.; Borup, K. Experimental Heat Loads for Electrothermal Anti-Icing and De-Icing on UAVs. J. Aerosp. 2021, 8, 83. [Google Scholar] [CrossRef]
  34. Villeneuve, E.; Samad, A.; Volat, C.; Béland, M.; Lapalme, M. An Experimental Apparatus for Icing Tests of Low Altitude Hovering Drones. Drones 2022, 6, 68. [Google Scholar] [CrossRef]
  35. Jeck, R.K. FAA/AR-09/45: Models and Characteristics of Freezing Rain and Freezing Drizzle for Aircraft Icing Applications; Federal Aviation Administration, Department of Transportation: Springfield, VA, USA, 2010. [Google Scholar]
  36. SAE. Endurance Time Tests for Aircraft Deicing/Anti-Icing Fluids SAE Type II, III, and IV—Aerospace Standard ARP5485; G-12HOT Holdover Time Committee; SAE International: Warrendale, PA, USA, 2004. [Google Scholar]
  37. SAE. Water Spray and High Humidity Endurance Test Methods for AMS1424 and AMS1428 Aircraft Deicing/Anti-Icing Fluids–Aerospace Standard ARP5901; G-12ADF Aircraft Deicing Fluids; SAE International: Warrendale, PA, USA, 2019. [Google Scholar]
  38. Anttho, A.M.; Slupski, B.J.; Mohiudeen, A.; Kara, K. Determination of Water Droplet Collection Efficiency: An Empirical Model. In Proceedings of the AIAA Atmospheric Flight Mechanics Conference, Grapevine, TX, USA, 9–13 January 2017. [Google Scholar]
  39. Orchard, D. Investigation of tolerance for icing of UAV rotors/propellers: Phase 3 test results. In Laboratory Memorandum (National Research Council of Canada. Aerospace. Aerodynamics Laboratory); no. LM-AL-2021-0051; National Research Council of Canada; Aerospace: Ottawa, ON, Canada, 2021. [Google Scholar]
  40. Xi, C.; Qi-Jun, Z. Numerical simulations for ice accretion on rotors using new three-dimensional icing model. J. Aircr. 2017, 54, 1428–1442. [Google Scholar] [CrossRef]
  41. Lee, J.D.; Harding, R.; Palko, R.L. Documentation of Ice Shapes on the Main Rotor of a UH-1H Helicopter in Hover; NASA: Columbus, OH, USA, 1984. [Google Scholar]
  42. Wang, Z.; Zhu, C.; Zhao, N. Experimental Study on the Effect of Different Parameters on Rotor Blade Icing in a Cold Chamber. Appl. Sci. 2020, 10, 5884. [Google Scholar] [CrossRef]
  43. Hansman, R.J., Jr.; Yamaguchi, K.; Berkowitz, B.; Potapczuk, M. Modeling of surface roughness effects on glaze ice accretion. J. Thermophys. Heat Transf. 1991, 5, 54–60. [Google Scholar] [CrossRef]
Figure 1. Photos of the experimented rotor system placed inside the cold chamber.
Drones 06 00345 g001
Figure 2. The cold chamber’s icing nozzle array.
Drones 06 00345 g002
Figure 3. A photograph of the installed rotor showing the blades and load cell.
Drones 06 00345 g003
Figure 4. A photo of the rotor blades used for the experimental icing tests.
Drones 06 00345 g004
Figure 5. Example of variation of rotor performance data with time for (a) rotation speed and electrical power; (b) thrust and torque.
Drones 06 00345 g005
Figure 6. Example of the variation of non-dimensional parameters with time during icing for (a) thrust coefficient CT; (b) torque coefficient CQ.
Drones 06 00345 g006
Figure 7. Photographs showing the ice evolution on the rotor blade during 5 time intervals; T = −5 °C, Ω = 4950 RPM, MVD = 800 µm and λ = 80 g/m2/h.
Drones 06 00345 g007
Figure 8. Photographs showing the ice evolution on the rotor blade during 5 time intervals; T = −12 °C, Ω = 4950 RPM, MVD = 800 µm and λ = 80 g/m2/h.
Drones 06 00345 g008
Figure 9. A photograph showing the ice accumulation at the end of an icing test for (a) the entire blade with no shedding and (b) a large piece of ice shed while ice was still attached near the root and tip.
Drones 06 00345 g009
Figure 10. Effect of precipitation rate on the rate of rotor thrust degradation for selected icing conditions.
Drones 06 00345 g010
Figure 11. Effect of precipitation rate on the rate of rotor torque degradation for selected icing conditions.
Drones 06 00345 g011
Figure 12. Comparison of rotor thrust and torque degradation for tests with similar LWC (0.5 g/m3).
Drones 06 00345 g012
Figure 13. Photographs of blades after icing tests at −12 °C, LWC = 0.5 g/m3 and (a) 120 µm, 5 g/dm2.h (top); (b) 120 µm, 5 g/dm2.h (front); (c) 800 µm, 67 g/dm2.h (top); (d) 800 µm, 67 g/dm2.h (front).
Drones 06 00345 g013
Figure 14. Photographs of blades after icing tests at (a) 3880 RPM, −15 °C, 120 µm, 7.5 g/m3 (80 g/dm2.h) and (b) 3880 RPM, −15 °C, 800 µm, 0.6 g/m3 (80 g/dm2.h).
Drones 06 00345 g014
Figure 15. Effect of rotor speed on the rate of rotor thrust degradation for selected icing conditions.
Drones 06 00345 g015
Figure 16. Effect of rotor speed on the rate of rotor torque degradation for selected icing conditions.
Drones 06 00345 g016
Figure 17. Comparison between the measured ice thickness at 3880 RPM, 4440 RPM and 4950 RPM for selected icing conditions.
Drones 06 00345 g017
Figure 18. Photographs of blades after icing tests at −5 °C, 120 µm, 6.3 g/m3 (67 g/dm2.h): (a) 3880 RPM: ice is spread across the whole radius and a lobster tail shape of ice is seen; (b) 4440 RPM: ice is spread across blade with minimal ice near the tip and no lobster tail-shaped ice; (c) 4950 RPM: no ice accumulation between around 80% of the blade radius and the tip.
Drones 06 00345 g018
Figure 19. Photographs of blades after icing tests at −15 °C, 120 µm, 7.5 g/m3 (80 g/dm2.h): (a) 3880 RPM (front), (b) 3880 RPM (top), (c) 4950 RPM (front) and (d) 4950 RPM (top).
Drones 06 00345 g019
Figure 20. Photographs of blades after icing tests at 4440 RPM, 800 µm, 0.5 g/m3 (67 g/dm2.h): (a) −5 °C and (b) −12 °C.
Drones 06 00345 g020
Figure 21. Effect of air temperature on the rate of rotor thrust degradation for selected icing conditions at MVD = 120 µm.
Drones 06 00345 g021
Figure 22. Effect of air temperature on the rate of rotor torque degradation for selected icing conditions at MVD = 120 µm.
Drones 06 00345 g022
Figure 23. Effect of air temperature on the rate of rotor thrust degradation for selected icing conditions at MVD = 800 µm.
Drones 06 00345 g023
Figure 24. Effect of air temperature on the rate of rotor thrust degradation for selected icing conditions at MVD = 800 µm.
Drones 06 00345 g024
Figure 25. Photographs of blades after icing tests at 4950 RPM, 800 µm, 0.5 g/m3 (67 g/dm2.h): (a) −5 °C and (b) −12 °C.
Drones 06 00345 g025
Figure 26. Effect of pitch angle on the rate of rotor thrust degradation for selected icing conditions.
Drones 06 00345 g026
Figure 27. Effect of pitch angle on the rate of rotor torque degradation for selected icing conditions.
Drones 06 00345 g027
Figure 28. Photographs of blades after icing tests at 4950 RPM, −15 °C, 120 µm, 7.5 g/m3 (80 g/dm2.h): (a) θ = 9.7° and (b) θ = 11.7°.
Drones 06 00345 g028
Table 1. Details of icing parameters used for tests, along with their rational.
Temp. (°C)λ (g/dm2.hr)MVD (μm)LWC (g/m3)Rational
−15, −12 and −551200.50.5 g/m3 (FAA/AR-09/45)
251202.4Typical Ground Icing +
Light Rain (2 L/h/m2)
258000.2Typical Ground Icing +
Light Rain (2 L/h/m2)
671206.30.25 in. Water/h for APT70 Requirement +
Moderate Rain (6.75 L/h/m2)
678000.50.25 in. Water/h for APT70 Requirement +
0.5 g/m3 (FAA/AR-09/45) +
Moderate Rain (6.75 L/h/m2)
801207.5Typical Ground Icing +
Moderate Rain (8 L/h/m2)
808000.6Typical Ground Icing +
Moderate Rain (8 L/h/m2)
Publisher’s Note: MDPI stays neutral with regard to jurisdictional claims in published maps and institutional affiliations.

