Article

Joint Efficient UAV Trajectory and Velocity Optimization for IoT Data Collection Using a New Projection Algorithm †

1
Peng Cheng Laboratory, Department of Mathematics and Theories, Shenzhen 518055, China
2
School of Electronics and Information Engineering, Beihang University, Beijing 100191, China
*
Author to whom correspondence should be addressed.
This paper is an extended version of our paper published in IEEE International Conference on Space-Air-Ground Computing (SAGC).
Drones 2022, 6(12), 376; https://doi.org/10.3390/drones6120376
Submission received: 7 November 2022 / Revised: 18 November 2022 / Accepted: 20 November 2022 / Published: 24 November 2022

Abstract

:
Unmanned aerial vehicle (UAV)-assisted networking and communications are increasingly used in different applications, especially in the data collection of distributed Internet of Things (IoT) systems; its advantages include great flexibility and scalability. However, due to the UAV’s very limited battery capacity, the UAV energy efficiency has become a bottleneck for longer working time and larger area coverage. Therefore, it is critical to optimize the path and speed of the UAV with less energy consumption, while guaranteeing data collection under the workload and time requirements. In this paper, as a key finding, by analyzing the speed–power and the speed–energy relationships of UAVs, we found that there should be different speed selection strategies under different scenarios (i.e., fixed time or fixed distance), which can lead to much-improved energy efficiency. Moreover, we propose CirCo, a novel algorithm that jointly optimizes UAV trajectory and velocity for minimized energy consumption. CirCo is based on an original projection method, turning a 3D problem (GN locations and transmission ranges on the 2D plane, plus the minimum transmission time requirements on the temporal dimensions) into a 2D problem, which could help to directly find the feasible UAV crossing window, which greatly reduces the optimization complexity. Moreover, CirCo can classify the projected conditions to calculate the optimal path and speed schedule under each category, so that the energy consumption of each situation can be fine-regulated. The experiments demonstrate that CirCo can save as much as 54.3 % of energy consumption and 62.9 % of flight time over existing approaches.

1. Introduction

The advantages of unmanned aerial vehicles (UAVs) include deployment flexibility, large coverage ability, and cost reduction [1,2]; they have been increasingly used in many emerging applications, such as target detection [3,4], video monitoring [5,6], package delivery [7,8], mobile edge computing [9,10], and communication networks [11,12,13]. In particular, for some space–air–ground–ocean IoT applications, UAVs help with data collection/transmission from distributed IoT nodes [14,15,16]. Previously, in this scenario, a large number of IoT ground nodes (GNs) not only needed to transmit their own data to the remote stations, but also needed to relay data to the other nodes, which was inconvenient and inefficient [17,18,19], running contrary to the limitation of the sensor’s small battery capacity, short transmission range, and the requirements for a long service life. However, as shown in Figure 1, leveraging UAVs to collect data directly and periodically from the GNs in a close range can greatly save the energy consumption of the IoT ground nodes in many large-scale and long-term IoT application scenarios, such as smart cities [20], air quality sensing [21,22], intelligent agriculture [23,24], as well as new scenarios, such as disaster relief, emergency communication, and fire/flood monitoring [25,26,27].
In the above scenarios, due to the very limited energy supply of UAVs (usually running with batteries), energy consumption becomes a crucial bottleneck for longer working times and a larger area coverage [28,29,30]. Therefore, it is critical to find methods to improve the energy efficiency of the UAV. Meanwhile, for data collection applications, a UAV needs to visit a large number of irregularly distributed ground nodes crossing large areas and is required to finish data transmission tasks on time. Since the main UAV energy power consumption comes from the flying part [31,32], both shorter paths and more efficient speeds would help to reduce the energy costs, there exist many energy efficiency improvement opportunities as well as challenges with the UAV trajectory and velocity scheduling.
Many studies focus on reducing UAV energy consumption or minimizing flight times by optimizing the trajectory or velocity. For example, Shan et al. [31] developed an inspiring speed scheduling solution to minimize energy consumption by finding paths through virtual rooms. Gong et al. [18] proposed an energy-efficient algorithm that considered data collection time, sensor transmit power, and UAV speed. Mozaffari et al. [33] analyzed the optimal movement of the UAV trajectory with the limitation of the active time of IoT devices to achieve the minimum UAV energy consumption. Baek et al. [34] jointly optimized the UAV Hovering location and duration to reduce the energy consumption of sensors and maximize energy harvesting under data collection at a fixed speed. Fewer studies have jointly considered the speed adjustment and trajectory scheduling. Zhan et al. [35] used alternating optimization and successive convex approximation techniques to minimize energy consumption. Zeng et al. [36] used a path discretization method and a successive convex approximation technique to reduce energy consumption. However, the data transmission tasks were assumed to be finished instantaneously in this article, which ignored the fact that, in some cases, the task volume may have been too large to complete the transmission instantaneously. When considering this case, the optimization becomes much more complex because the UAV needs to stay within the transmission range of each mission for enough time to complete the transmission task. However, if we can jointly find a trajectory to keep the total distance as short as possible, and adjust the actual velocity close to the most energy-efficient speed while meeting the transmission time requirements, it could greatly improve the UAV energy efficiency.
Hence, in this paper, we propose CirCo (circle-crossing), a UAV energy optimization algorithm that jointly considers its path planning and speed scheduling for data collection tasks with a certain number of GNs. Specifically, this paper makes the following contributions:
  • In the previous studies, the UAV velocity optimization is only based on the relationship between speed and power, which we found may not always lead to the best energy efficiency. As a key finding in this paper, we also analyzed the relationship between speed and energy consumption per unit distance, and found that there should be different speed selection strategies under different flying scenarios (i.e., fixed-time cases or fixed-distance cases), leading to much better UAV energy efficiency.
  • We propose CirCo, a novel algorithm to jointly optimize the trajectory and velocity of the UAV for minimized total energy consumption while meeting all communication task requirements. It adopts an original projection method to convert the 3D scenario to the 2D plane corresponding to the transmission ranges and time requirements of GNs, which greatly reduces the complexity of the problem. Then CirCo leverages a speed selection strategy to determine the most energy-efficient speed and the corresponding path within the constraint range derived by the projection method.
  • We verify the effectiveness of CirCo through experiments with real UAV data. Simulation results show that CirCo can save as much as 54.3 % energy and 62.9 % in flight times and it is very close to the lower bounds of energy–flight time consumption to complete the transmission tasks.
The rest of the paper is organized as follows. Section 2 introduces the UAV energy consumption model and presents the problem formulation. Section 3 describes the design of CirCo in detail with an example. Section 4 presents the evaluation results. Finally, Section 5 concludes the paper.

2. Materials and Models

Before the joint trajectory and velocity optimization of UAVs, we first need to formulate a reliable model of the energy consumption of UAVs. Since we do not intend to introduce a new physical model for the power consumption of rotary-wing UAVs, we derived an analytical energy model that is suitable for research in UAV communications based on [36]. Interested readers may refer to [36] for more detailed theoretical derivations based on the actuator disc theory and blade element theory [37]. The notations used in this appendix are summarized in Table 1.
Next, we analyze the UAV energy consumption model, introduce the system model, and give the key principles for speed adjustments based on two energy relationships. We then formulate the joint speed and trajectory management as a constrained optimization problem.

2.1. Energy Consumption Model

The energy consumption of a UAV mainly has two parts, the transmission part and the flight part. According to related studies [31,38], the transmission takes only 0.1% of the total UAV energy in our scenario, which is relatively negligible. Therefore, similar to previous work [32,36], we formulate the UAV power by focusing on the flight energy, shown as Equation (1):
P ( v ) = P 0 ( 1 + 3 v 2 ( Ω R ) 2 ) + P i ( 1 + v 4 4 v 0 4 2 v 2 2 v 0 2 ) 1 2 + 1 2 d F ρ s π R 2 v 3 P 0 = δ ρ s π R 2 ( Ω R ) 3 8 , P i = ( 1 + k ) W 1 . 5 2 π R 2 ρ
Similarly, the energy consumption per unit distance of the UAV can also be calculated, shown in Equation (2).
E p d ( v ) = P ( v ) t / v t = P ( v ) / v , v > 0
Figure 2 shows that both the curve of power (P) and energy consumption per unit distance ( E p d ) increase and then decrease as the velocity V increases. However, these two curves are not identical; hence, there will be different optimal velocities to minimize P or E p d , respectively. We use V P to represent the most energy-efficient speed under the curve of the relationship between V and P. Similarly, V E represents the most energy-efficient speed under the curve of the relationship between V and E p d .
The difference between optimal velocities V P and V E means that the energy consumption is different when adopting the optimal velocity based on different curves. On one hand, to cope with a speed optimization problem with a fixed time limit T, choosing V P over V E can save more energy. The total energy Q is the product of power P and time T, and Q is minimum when P is minimum for a fixed value of T. Moreover, V P corresponds to the minimum power, which will lead to the minimum energy in this scenario. On the other hand, for a speed optimization problem with a fixed distance D, choosing V E over V P can save more energy. Therefore, the principles of the UAV speed selection are: (1) select a speed as close as V E for a fixed-distance scenario. (2) Select a speed as close as V P for a fixed-time scenario.

2.2. System Model

We assume a series of GNs, e.g., wireless sensors and IoT devices, are irregularly distributed on the ground, such as in large-scale factories, farms, forests, etc., to perform monitoring tasks and sensing data, as shown in Figure 3. GNs have different transmission ranges and different data sizes to be transmitted. We assume that the data size of the task between UAV and each GN is pre-known and the transmission rate is determined in the communication areas of every GN, so that the minimum transmission time τ i , j required for the UAV to finish the data transmission with GN can be calculated in advance. Without the loss of generosity, we use settings and parameters; these parameters can be adjusted to different real cases accordingly. We assume UAV can only communicate with one GN at a time, due to limited channel capacity [31]. A UAV files over the transmission ranges of these GNs to collect sensed data from these nodes. The UAV can fly slowly, fly fast, or even hover to finish each data collection task within the transmission range.
The parameters in the process of UAV-assisted data collection in the system are shown in Table 2.
Since every GN has a limited communication range, two GNs can either have overlapped ranges or disjoint ranges. Therefore, to better model the GN relationship, we define the concept of the ground node cluster (GNC), in which GNs with overlapped communication ranges form a connected domain, as shown in Figure 3. In addition, we also define the coordinates of the center point for a GNC as the average of all locations of GNs within, which can be described as Equation (3).
X i = j = 1 J i x i , j J i , Y i = j = 1 J i y i , j J i , i [ 1 , I ]
In the GNC range, the trajectory and velocity planning need to consider the limitations of the transmission tasks for each GN while the UAV only considers how to reduce the energy consumption since no sensor nodes among GNCs means no transmission tasks. Therefore, we divided the whole trajectory and velocity optimization into two parts: intra-GNC part and inter-GNC part, representing the optimization within GNCs and among GNCs, respectively. In the range of GNC, for two GNs with overlapping transmission ranges (such as g i , j and g i , j + 1 ), the UAV can communicate with either one of the two GNs in this area. Therefore, in some cases, when the UAV begins to transfer the data of g i , j + 1 , it is still in the range of g i , j . So, we define the time interval between the starting time of g i , j and that of g i , j + 1 as the actual flight time of g i , j .

2.3. Problem Formulation

To jointly optimize the UAV trajectory and velocity, with J GNs in I GNCs, the problem is formulated as Equation (4):
m i n ( Q t o t a l ) = m i n ( Q i n t r a ) + m i n ( Q i n t e r )
The total energy can be divided into two parts. Moreover, the energy consumption inside GNC can be calculated by Equation (5):
Q i n t r a = i = 1 I ( j = 1 J i t s i , j t s i , j + 1 P ( v i , j ) d t ) , f i x e d t i m e ; i = 1 I ( j = 1 J i l i , j E p d ( v i , j ) d s ) , f i x e d d i s t a n c e .
In addition, the energy consumption among GNCs can be calculated by Equation (6):
Q i n t e r = i = 0 I ( T E i t S i + 1 P ( V i ) d t ) , f i x e d t i m e ; i = 0 I ( L i E p d ( V i ) d s ) , f i x e d d i s t a n c e .
where Q i n t e r , 0 and Q i n t e r , I represent the energy consumption from the take-off point of the UAV to G 1 and from G I to the UAV take-off point, respectively.
In addition, the optimization problem needs to meet the following constraints:
t e i , j t s i , j τ i , j , i [ 1 , I ] , j [ 1 , J i ]
t s i , j + 1 t e i , j 0 , i [ 1 , I ] , j [ 1 , J i ]
T S i + 1 T E i > 0 , i [ 1 , I ]
| x i , j x i , j + 1 | 2 + | y i , j y i , j + 1 | 2 < | r i , j + r i , j + 1 | , i [ 1 , I ] , j [ 1 , J i 1 ]
| x s i , j + 1 x s i , j | 2 + | y s i , j + 1 y s i , j | 2 | x e i , j x s i , j | 2 + | y e i , j y s i , j | 2 , i [ 1 , I ] , j [ 1 , J i 1 ]
| X S i + 1 X E i | 2 + | Y S i + 1 Y E i | 2 > r i , J i + r i + 1 , 1 , i [ 1 , I ]
Constraint (7) ensures that each UAV flight time with GN satisfies the minimum transmission time requirements. Constraint (10) is the extension of the definition of GNC, which enforces the transmission ranges of two adjacent GNs to intersect while determining the order in which the UAV communicates with the GNs of every GNC. Constraints (8) and (11) demand that the UAV complete one transmission task before communicating with the next GN. Similarly, constraints (9) and (12) demand that the UAV complete all the transmission tasks in one GNC before starting to communicate with that of the next GNC.
The above optimization problem is a non-integer and nonlinear programming problem with many complicated constraints, which is difficult to solve directly. Therefore, we propose CirCo, which can provide a practically approximate optimal solution with much less complexity.

3. CirCo Methods

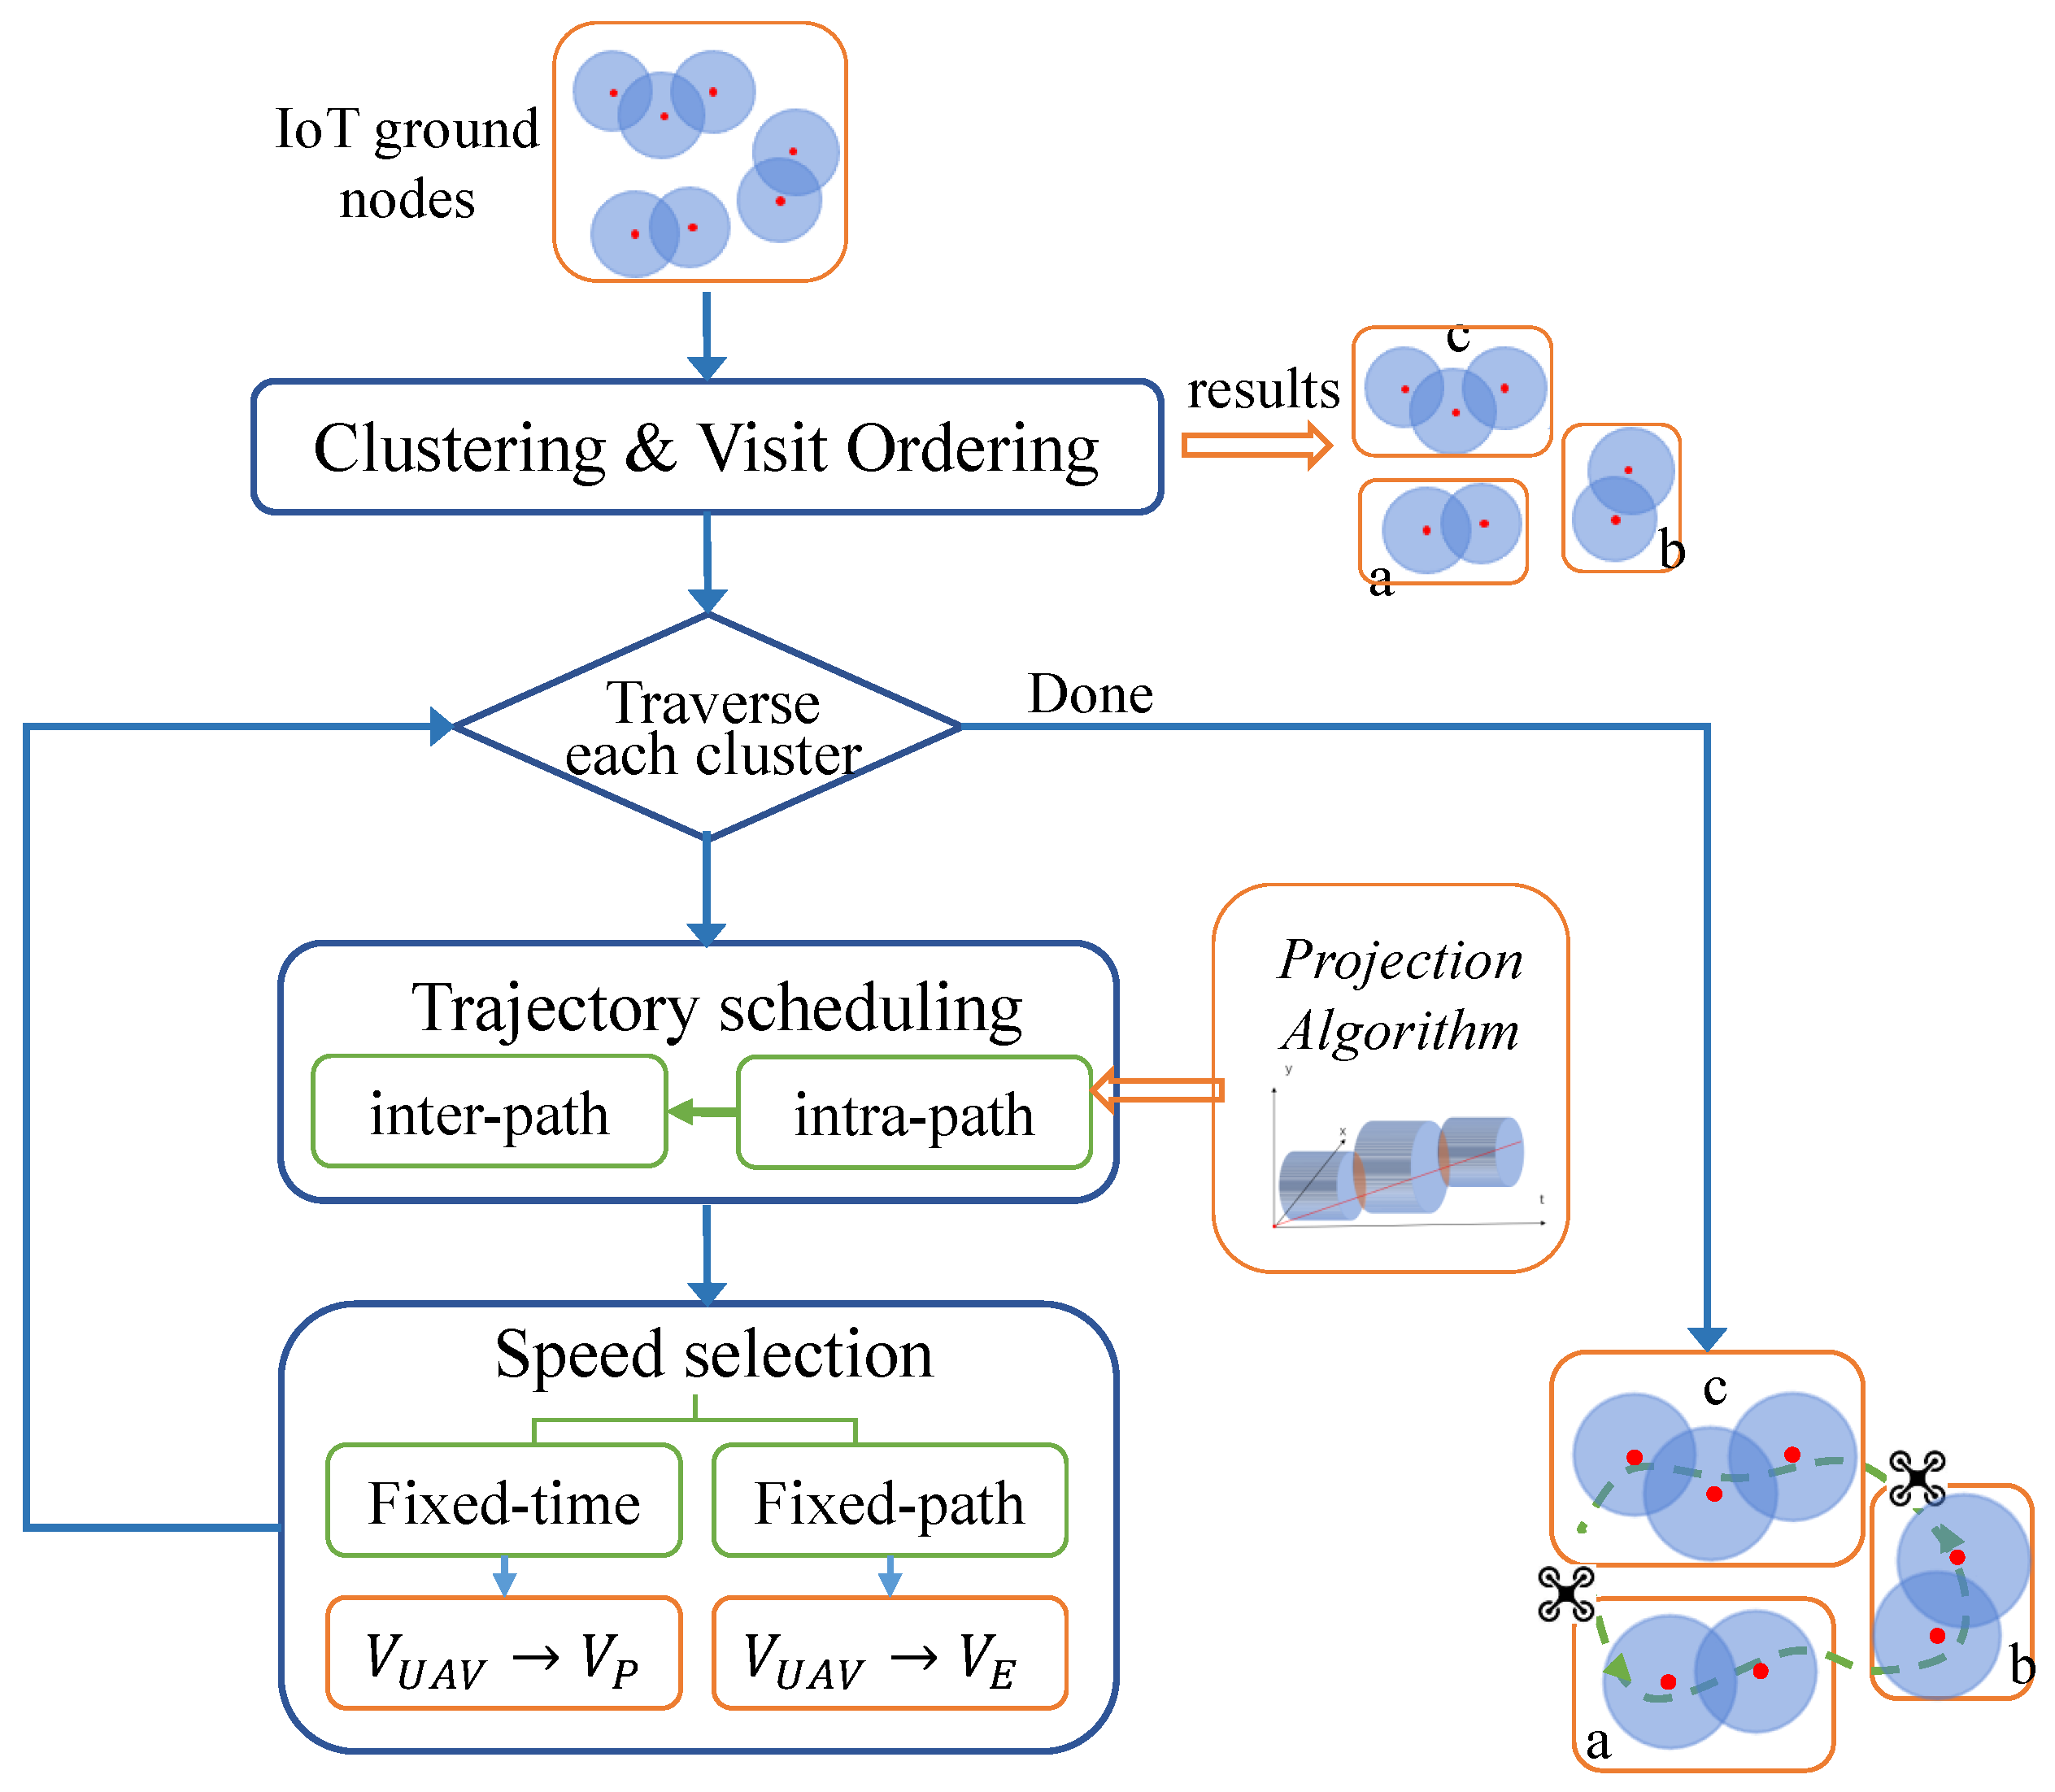
In this section, we first introduce CirCo, a joint UAV trajectory and velocity optimization framework, as shown in Figure 4. First, the information of all IoT ground nodes would be collected, including location information and the sizes of the data that need to be transferred. Then, CirCo would group these GNs based on the overlapped transmission ranges, which means all GNs in a connected domain are considered as one cluster, called a GNC. Moreover, a greedy strategy would be adopted to determine the visiting order on the GNC and GN levels, respectively. Furthermore, based on the order and cluster information, CirCo would design the trajectory of the process in each cluster by an algorithm of the projection method and determine the corresponding speed with two-speed selection principles. Moreover, the UAV would finish all data collection tasks as scheduled and calculate the total energy consumption and flight time.

3.1. Cluster and Order Determination

As shown in Figure 4, CirCo begins with GNs clustering after the GN information collection. Based on the overlapping transmission ranges, all GNs in a connected domain are considered as one cluster, called a GNC. Then, CirCo adopts a greedy strategy to determine the visiting order on the GNC and GN levels, respectively. For each time, CirCo selects the GNC (GN) closest to the current location. First, CirCo determines the order of GNCs to be visited based on the distance relationship between the central coordinates of each GNC. Then the order that the UAV visits the GNs in each GNC is determined in sequence according to the distance relationship between the GNs. In addition, CirCo selects the GN nearest to the last GN of the previous GNC as the starting GN in this GNC. For the initial GNC, the starting GN is the one that is nearest to the starting position of the UAV.

3.2. Design of the Projection Method

After determining the visiting order, the next step is to find the optimal trajectory and velocity to minimize energy consumption. Firstly, we divide the problem into two parts, intra-GNC and inter-GNC.
The inter-GNC is a process where the UAV travels to the next GNC after completing all tasks of the previous GNC. Due to no data collection tasks between GNCs, the UAV only needs to fly at V E from the starting point to the endpoint between any two sequential GNCs, accordingly, Moreover, for the inter-part between the G i and G i + 1 , the starting point is the leaving point when the UAV comes out of G i . Then UAV flies in the direction of the location of the first GN in G i + 1 . Moreover, the endpoint is the border point where the UAV flies to the border of the transmission range of the first GN in G i + 1 .
The intra-GNC is a process where the UAV flies across a series of transmission ranges inside each GNC and finishes all data collection tasks from all GNs within. When planning the trajectory and speed of the UAV, we need to ensure that the UAV could remain long enough in each range of nodes for data collection tasks, which would be more complex. Moreover, it is a key part of the optimization procedure of CirCo. We propose a projection method to simplify and directly solve this problem. Before elaborating on the algorithm details, the mathematical principles are presented in this part.
We leveraged a 3 D model with three axes, x, y, and t; the x and y axes are used to describe the location of the UAV, while the t axis represents the time of the UAV at a certain location. The velocity of the UAV is described in Equation (13).
V = ( Δ x Δ t ) 2 + ( Δ y Δ t ) 2 = Δ x 2 + Δ y 2 Δ t
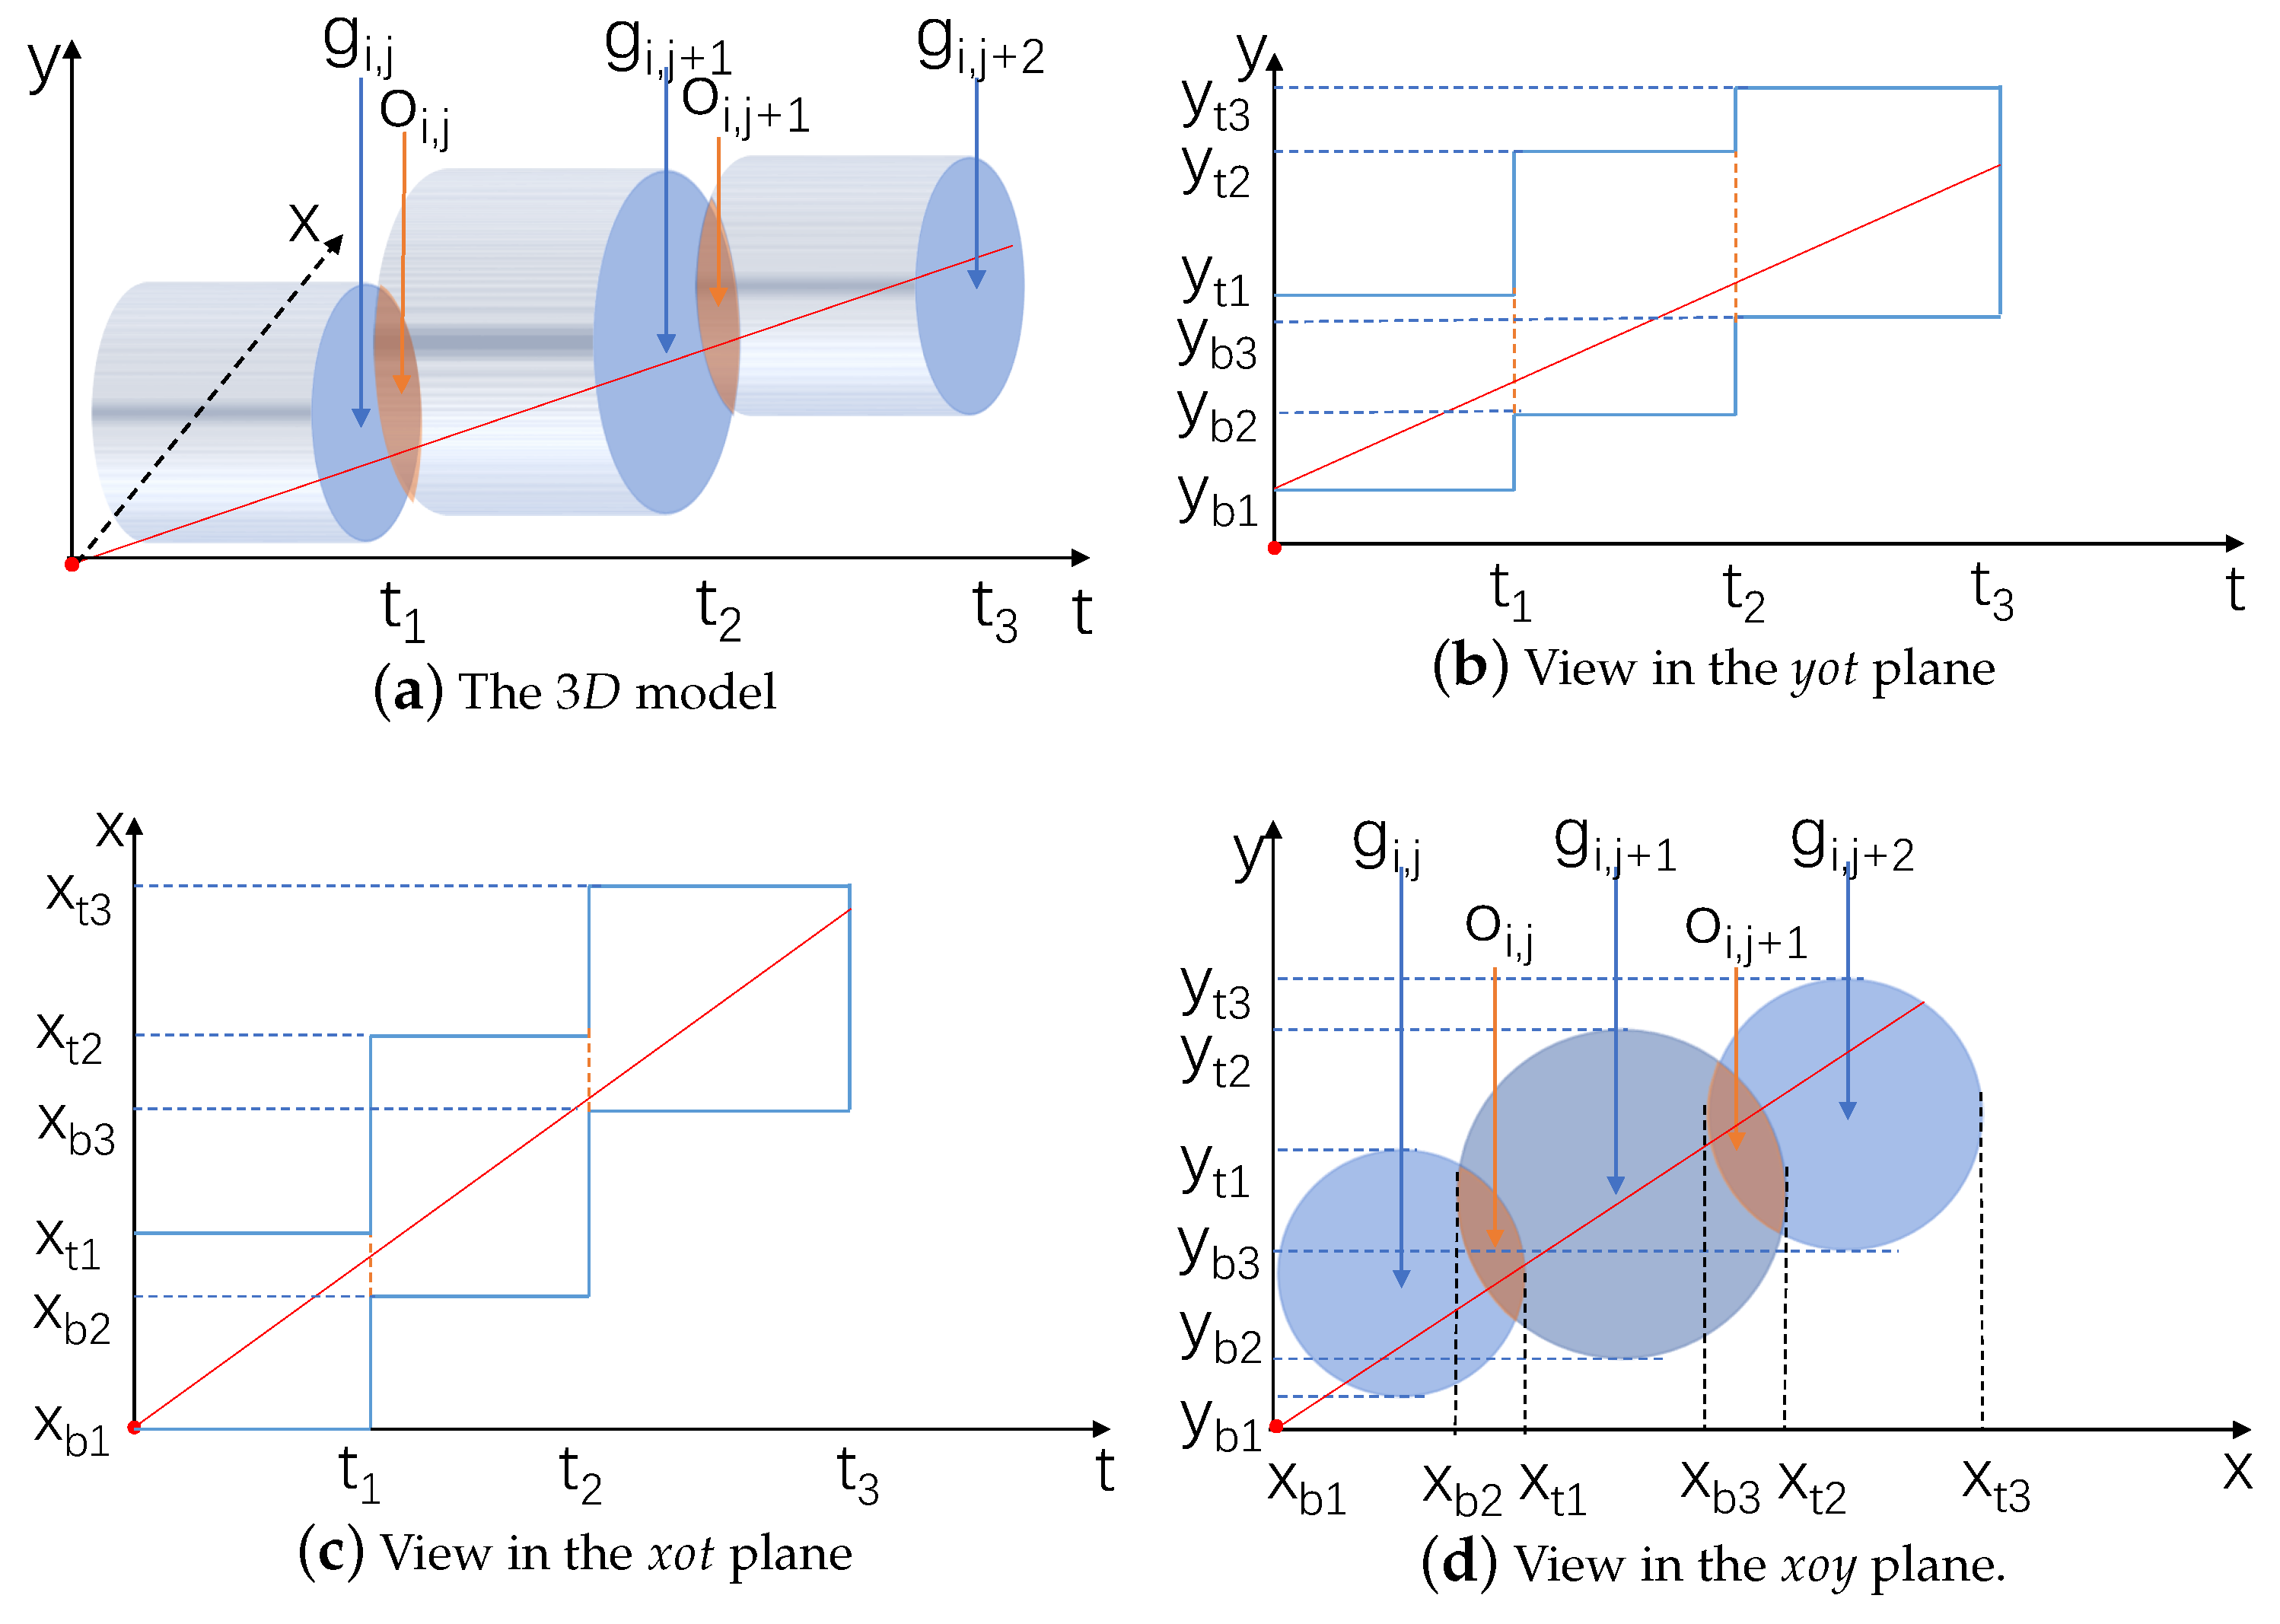
When the UAV collects data from a GN, it needs to satisfy two constraints: (1) within the transmission range of this GN; (2) the transmission time between the UAV and this GN must be greater than the minimum time requirement of this GN. In a 3 D space, each GN constraint is a cylinder, as shown in Figure 5a. The UAV needs to pass through the interior of each cylinder from one circular surface to the other. The heights of the cylinders on the t-axis are the values of the actual flight times of these GNs.
Ideally, the UAV should fly in a straight line from the starting point to the endpoint at V P , always within the communication ranges of the GNs, which means that the trajectory in a 3 D space can pass through all cylinders as the minimum transmission time of these GNs. However, in reality, due to the distribution of GNs and the time requirements of transmission tasks, this ideal case can hardly be achieved. Therefore, in every step, CirCo chooses to pass through as many cylinders as possible, in a straight line, to obtain an approximate optimal solution. However, it is difficult to intuitively judge how many cylinders CirCo can pass through all at once.
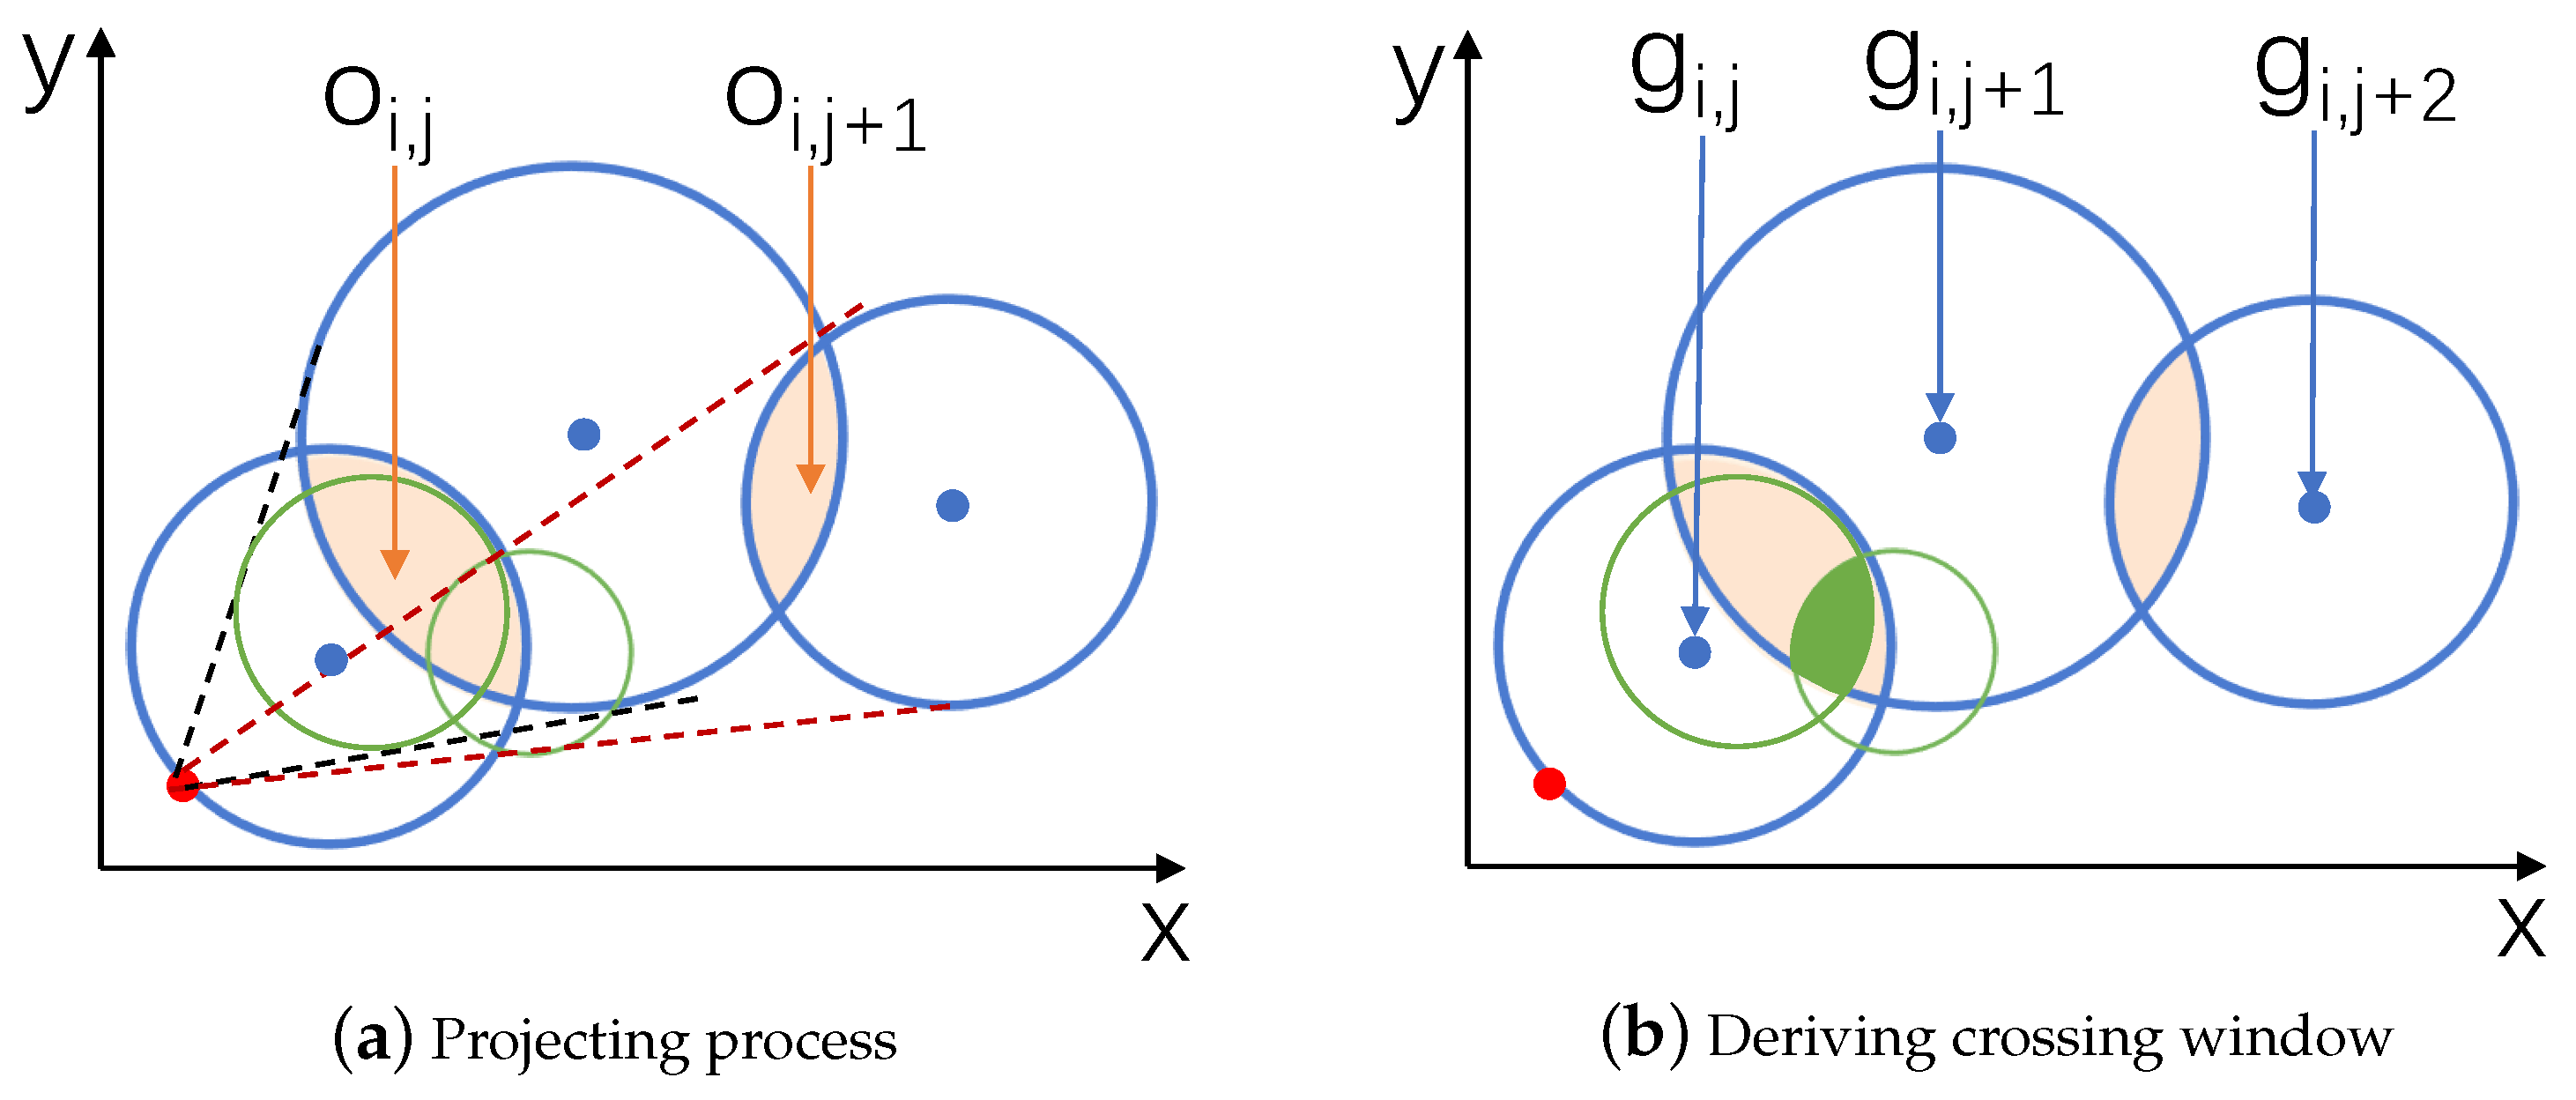
Therefore, we propose an ingenious projection method to map this 3 D problem to 2 D . Figure 6 illustrates the process of projection. Firstly, CirCo leverages the plane of the first overlapped area ( o i , j ) as the projection plane, i.e., the plane that t = t 1 in Figure 5a. Then, CirCo projects the following overlapped area ( o i , j + 1 ) to this plane, and the result is the overlapped area of the two green circles, as shown in Figure 6a. Then, CirCo can directly derive the feasible crossing window, which is the common intersected region of the first overlapped area ( o i , j ) and the projection area of the following overlapped area ( o i , j + 1 ), marked in green in Figure 6b. If there are more GNs in this cluster, similarly, CirCo needs to project as many overlapped areas as possible until the projection of the next overlapped area has no feasible crossing window. Moreover, the final common intersection region of the first overlapped area ( o i , j ) and all the projection areas are the feasible crossing window. At this point, one projection ends. (The new projection could repeat if needed). Note that the contraction ratio of the projection area to the original overlapped area is related to the minimum transmission time required by each GN. As shown in Figure 5a, if CirCo projects o i , j + 1 to the plane of o i , j based on the red starting point, then the ratio of the o i , j + 1 projection o i , j + 1 to o i , j + 1 is t 1 / t 2 .
After the projection is finished, CirCo will find the optimal trajectory and velocity in the feasible crossing window, which will be explained in detail in the following section.

3.3. Algorithm of CirCo

The algorithm to find the optimal trajectory and velocity in the intra-part leverages an iteration method. Each iteration has three steps. The first step is to find a feasible crossing window. Specifically, project the overlapped areas behind the current overlapped area ( o i , j ) until there is no common region between the initial overlapped area ( o i , j ) and all the projected regions in line 2 of the algorithm, and then the final common region is the feasible crossing window. The second step is to calculate the speed range of the UAV based on the information on the borders of the feasible crossing window. Note that V l o w is the low-bound ratio of the shortest trajectory and the minimal time requirement, as parameters used to determine the speed of the UAV, which will be further explained in the following part of choosing the speed. Moreover, it is not the minimal speed of the UAV in reality because if the UAV flies at a lower speed than V l o w , it can still finish all of the tasks but may consume more time and energy. The third step is to determine the speed and route of the UAV based on the following Algorithm 1 of choosing the speed.
Algorithm 1 The CirCo algorithm in the jth intra-GNC part
Input:
  • Initialize the first GN ( g i , 0 ) in the ith GNC; The total number of GNs in the ith GNC J i ; Initialize two integer variates t = 1 and k = 1 ; Define the feasible crossing window as F; The speed of the UAV V; The speed range { V l o w , V u p } .
1:
while g i , j ( j J i ) unvisited do
2:
   while Project o i , j + t to the plane of o i , j , and obtain o i , j + t AND
 
    o i , j + t has no common region with all o i , j + k ( k [ 1 , t ] ) and o i , j together do  
3:
       Projecting terminate
4:
        F = o i , j all o i , j + k , k [ 1 , t ] )
5:
       Obtain the border location of the window
6:
       Calculate the speed range { V l o w , V u p } by Equation (9)
7:
       Determine the optimal speed (V)
8:
       Determine the corresponding route of UAV
9:
        i i + t
10:
   end while
11:
end while
Output: the speed and route of the UAV in the jth GNC
The projecting principle of the feasible crossing window (the first step) is illustrated in Section 3.2. CirCo needs to calculate the speed range and calculate the optimal velocity and trajectory within the feasible crossing window (the second step). Due to the requirement of the minimum transmission time, we can derive the speed range [ V l o w , V u p ] by calculating the ratio of the distance between the farthest point in the boundary and the nearest point of the feasible window to the minimum time, according to Equation (13). We need to choose suitable speeds and trajectories for different conditions (the third step) according to the relationship between the speed range and the minimum power consumption speed. There are three different cases for trajectory and velocity optimization shown in Figure 7.
Case1: If V u p V P , then V U A V = V u p , and UAV follows the path corresponding to V u p .
Case2: If V l o w V P , then (1) if V l o w > V E , then V U A V = V E , and UAV follows the path corresponding to V l o w ; (2) V l o w V E , then V U A V = V l o w and UAV follows the path corresponding to V l o w .
Case3: If V u p > V P and V l o w < V P , V U A V = V P , and UAV follows the path corresponding to V P .
In addition, for the last GN in one GNC, CirCo needs to determine the trajectory and velocity separately. The location of the endpoint satisfies that: (1) The transmission time must exceed the minimum transmission time. (2) The transmission time must be as close as the minimum transmission time. (3) The speed of the UAV must be as close as the optimal velocity.
To summarize the above procedures—CirCo firstly groups all GNs into multiple GNCs. Then, CirCo determines the visiting order of GNCs and GNs in each GNC, respectively. Finally, CirCo finds the optimal trajectory and velocity in the intra-GNC and inter-GNC parts. For the intra-GNC part, CirCo leverages a projection algorithm to find the feasible crossing window that maps a 3 D problem to a 2 D problem for the intra-GNC part. Moreover, CirCo classifies the specific condition and fine-planning of the optimal trajectory and velocity of each condition. For the inter-GNC part, CirCo determines its path and speed based on some proposed principles.

3.4. Computation Complexity Analysis

To determine the trajectory and velocity of the UAV in the range of each node, we may use partial exhaustive research that calculates all situations by traversing all of the points in the transmission range for each node; we then find the optimal set among them for each GN based on the information of the current GN and the following one. However, the computational complexity is too high. Specifically, it is assumed that n GNs in a projection process and the average radius of the transmission range is r. Moreover, the search step is k 100 (i.e., the default value is 5, which means the step is 0.05 m. Moreover, it can be changed based on the actual scenario). The computational complexity of the exhaustive search is O ( n π ( 100 r k ) 2 ) . However, CirCo only needs to traverse the border of an intersection area of multiple projected circles in a projection process, so we use 2 π r a to represent the lengths of these borders, in which 1 a < < 1 . Moreover, the computational complexity of CirCo is O ( 200 π r a k ) ) . Therefore, the partial exhaustive research is 100 a n r k times as complex as CirCo, pointing out that CirCo can dramatically reduce the computing overhead. Moreover, the result from the exhaustive research method may be inferior to that from CirCo; the exhaustive research only considers the information from the current GN and the following one while CirCo takes the global information into account. The simulations of the trajectory and planning with tens of GNs only need a few seconds on our computing platform (Intel i7-10710U CPU @ 12 cores @ 1.10 GHz).

4. Experiment Evaluation

In this section, we evaluate the performance of CirCo with real-life UAV parameters.

4.1. Experimental Settings

In our experiments, GNs were randomly distributed in an area of 3 km 3 km. The UAV altitude was fixed at 100 m [38,39] and the speed range was [0 m/s, 30 m/s] [36]. In addition, the acquiescent communication range of GN varied from 20 to 50 m [38]. In addition, due to the heterogeneity of the IoT devices [39,40], we evaluated the performance comparison when the transmission range was 50, 100, 200, 300, 400, and 500 m, separately. Moreover, the amount of to-be-collected data of each IoT device varied from an interval of 2 to 10 Mb and the data transmission rate b was 1 Mb/s [40,41,42], which can be changed in different scenarios if necessary.
We compare CirCo with the following baselines:
  • OnlySpeed [31]: An algorithm of speed optimization. The UAV passes through the location of the GNs in turn. When the UAV reaches the communication range of the next GN, the UAV starts the next data collection task immediately. In addition, the speed of the UAV is chosen as close as V E while ensuring the completion of the data collection tasks.
  • OnlySpeed_noE: A variant of OnlySpeed, which does not consider the relationship between energy consumption per unit distance and velocity. Moreover, the UAV speed is set as close as V P while ensuring the completion of the data collection tasks.
  • CirCo_noE: A variant of CirCo, such as OnlySpeed_noE, CirCo_noE does not consider the relationship between energy consumption per unit distance and velocity when optimizing the velocity of the UAV.
  • Lower-bound: A theoretical (may be infeasible) baseline with the minimum energy consumption of the joint trajectory and speed optimization problem. The energy consumption of its intra-GNC (inter-GNC) part is the product of the minimum transmission time (distance) of the corresponding optimal speed V P ( V E ). The energy consumption of the inter-GNC part is the product of the minimum distance among GNCs times the corresponding optimal speed V E .
  • Hovering [36]: A joint speed and path optimization. It leverages the UAV to fly in the nearest line at a speed that minimizes the power of the UAV. If the UAV cannot finish the current transmission task when out of the current transmission range, the UAV hovers at the border until the task is finished. Moreover, Hovering does not consider the relationship between energy consumption per unit distance and velocity when optimizing the velocity of the UAV.

4.2. Energy Consumption and Flight Time Performance Comparison

This section evaluates the total energy consumption and flight time of the UAV of five optimization strategies and the lower bound. Though the flight time is not the main optimization target, our proposed method ensures that the UAV minimizes unnecessary paths and selects the appropriate speed so that the UAV completes the mission collection as precisely as possible while meeting the minimum transmission time requirements. Therefore, we also evaluate the performance of the flight times of the UAV under different parameter settings. Figure 8 shows the total energy consumption and flight time of the UAV for different algorithms when the GNs vary from 5 to 20. It can be seen that the more GNs deployed, the higher the energy and the longer the flight times. Moreover, CirCo always has the closest energy consumption and flight time to the lower bounds among the different algorithms with the change of GN quantities. On the one hand, Figure 8a shows the energy consumption comparison among the different algorithms. Specifically, CirCo can save 19.3 % and 35.4 % of total energy consumption on average, compared with OnlySpeed and Hovering. This is because CirCo optimizes the trajectory and speed while OnlySpeed focuses on speed optimization of a certain path; Hovering considers the combination of the optimal speed and Hovering, which is worse than adopting the superior speed series, as CirCo does. Moreover, CirCo_noE consumes 7.2 % more energy compared with CirCo and OnlySpeed_noE consumes 15.3 % more energy compared with OnlySpeed, which means that additional consideration of the relationship between speed and energy consumption per unit distance during speed optimization can further improve the UAV energy efficiency. On the other hand, Figure 8b shows the total flight time comparisons among the different algorithms. CirCo also presents a great performance of the flight times compared with other algorithms, since the optimization of the trajectory and velocity are also beneficial to shortening the flight time. It shows that CirCo has the closest flight time to the lower bound and CirCo can save 10.4 % and 34.8 % of the total flight time when compared with OnlySpeed and Hovering. This is not hard to explain since CirCo_noE and CirCo attempt to ensure that the transmission time can be minimized when jointly planning the path and speed of the UAV. Moreover, OnlySpeed has no trajectory scheduling and the speed scheduling of Hovering is not optimal, leading to some unnecessary time consumption. In addition, CirCo can save 10.8 % of the time compared to CirCo_noE and OnlySpeed can save 24.6 % of the time compared to OnlySpeed_noE since CirCo and OnlySpeed also consider the relationship between energy consumption per distance and the speed of the UAV, respectively. This illustrates that leveraging the relationship between speed and energy consumption per unit distance is also beneficial in terms of a shorter flight time.
Figure 9 demonstrates the effect of the GNC number on both the energy consumption and flight time of the UAV with the total number of GNs fixed at 15. All the algorithms show an upward trend with the increase of the GNC number; more GNC means that longer paths exist among GNCs and consume more energy and longer flight times of the UAV. CirCo has the closest performances on both energy consumption and flight time to the lower bound. CirCo_NoE does not have the second closest flight time to the lower bound but it has the second-closest energy consumption. This is because the extra consideration of the relationship between speed and energy consumption per unit distance has much more influence on the flight time than energy consumption. Compared to other algorithms, CirCo can save up to 32.5% of energy and 33.4% of flight time.
Figure 10 shows the performances of different algorithms by varying the transmission range of each GN from 50 to 500 m when the data amount of each GN is fixed at 20 Mb. It can be seen that the total energy and flight time of the lower bound increases slowly, the data amount has no change, and the increase in the distance among GNCs contributes to the increase in the total energy and flight. Moreover, CirCo has no obvious superiority compared to other algorithms when the transmission range is small since there is little room for optimization when completing these tasks in small ranges. Moreover, the performances of all algorithms expect that the lower bounds show slight decreases when the range of IoT nodes increases from 50 to 100 m, indicating that fewer ranges do not mean less energy consumption and flight times. Moreover, as the transmission range increases, all algorithms would have more energy consumption and flight times. Moreover, CirCo has a more obvious performance advantage with the increase of the transmission ranges of GNs compared with other algorithms and has up to 54.3 % energy and 62.9 % flight time savings. This is because the larger range means a larger optimization room for the trajectory and velocity planning.
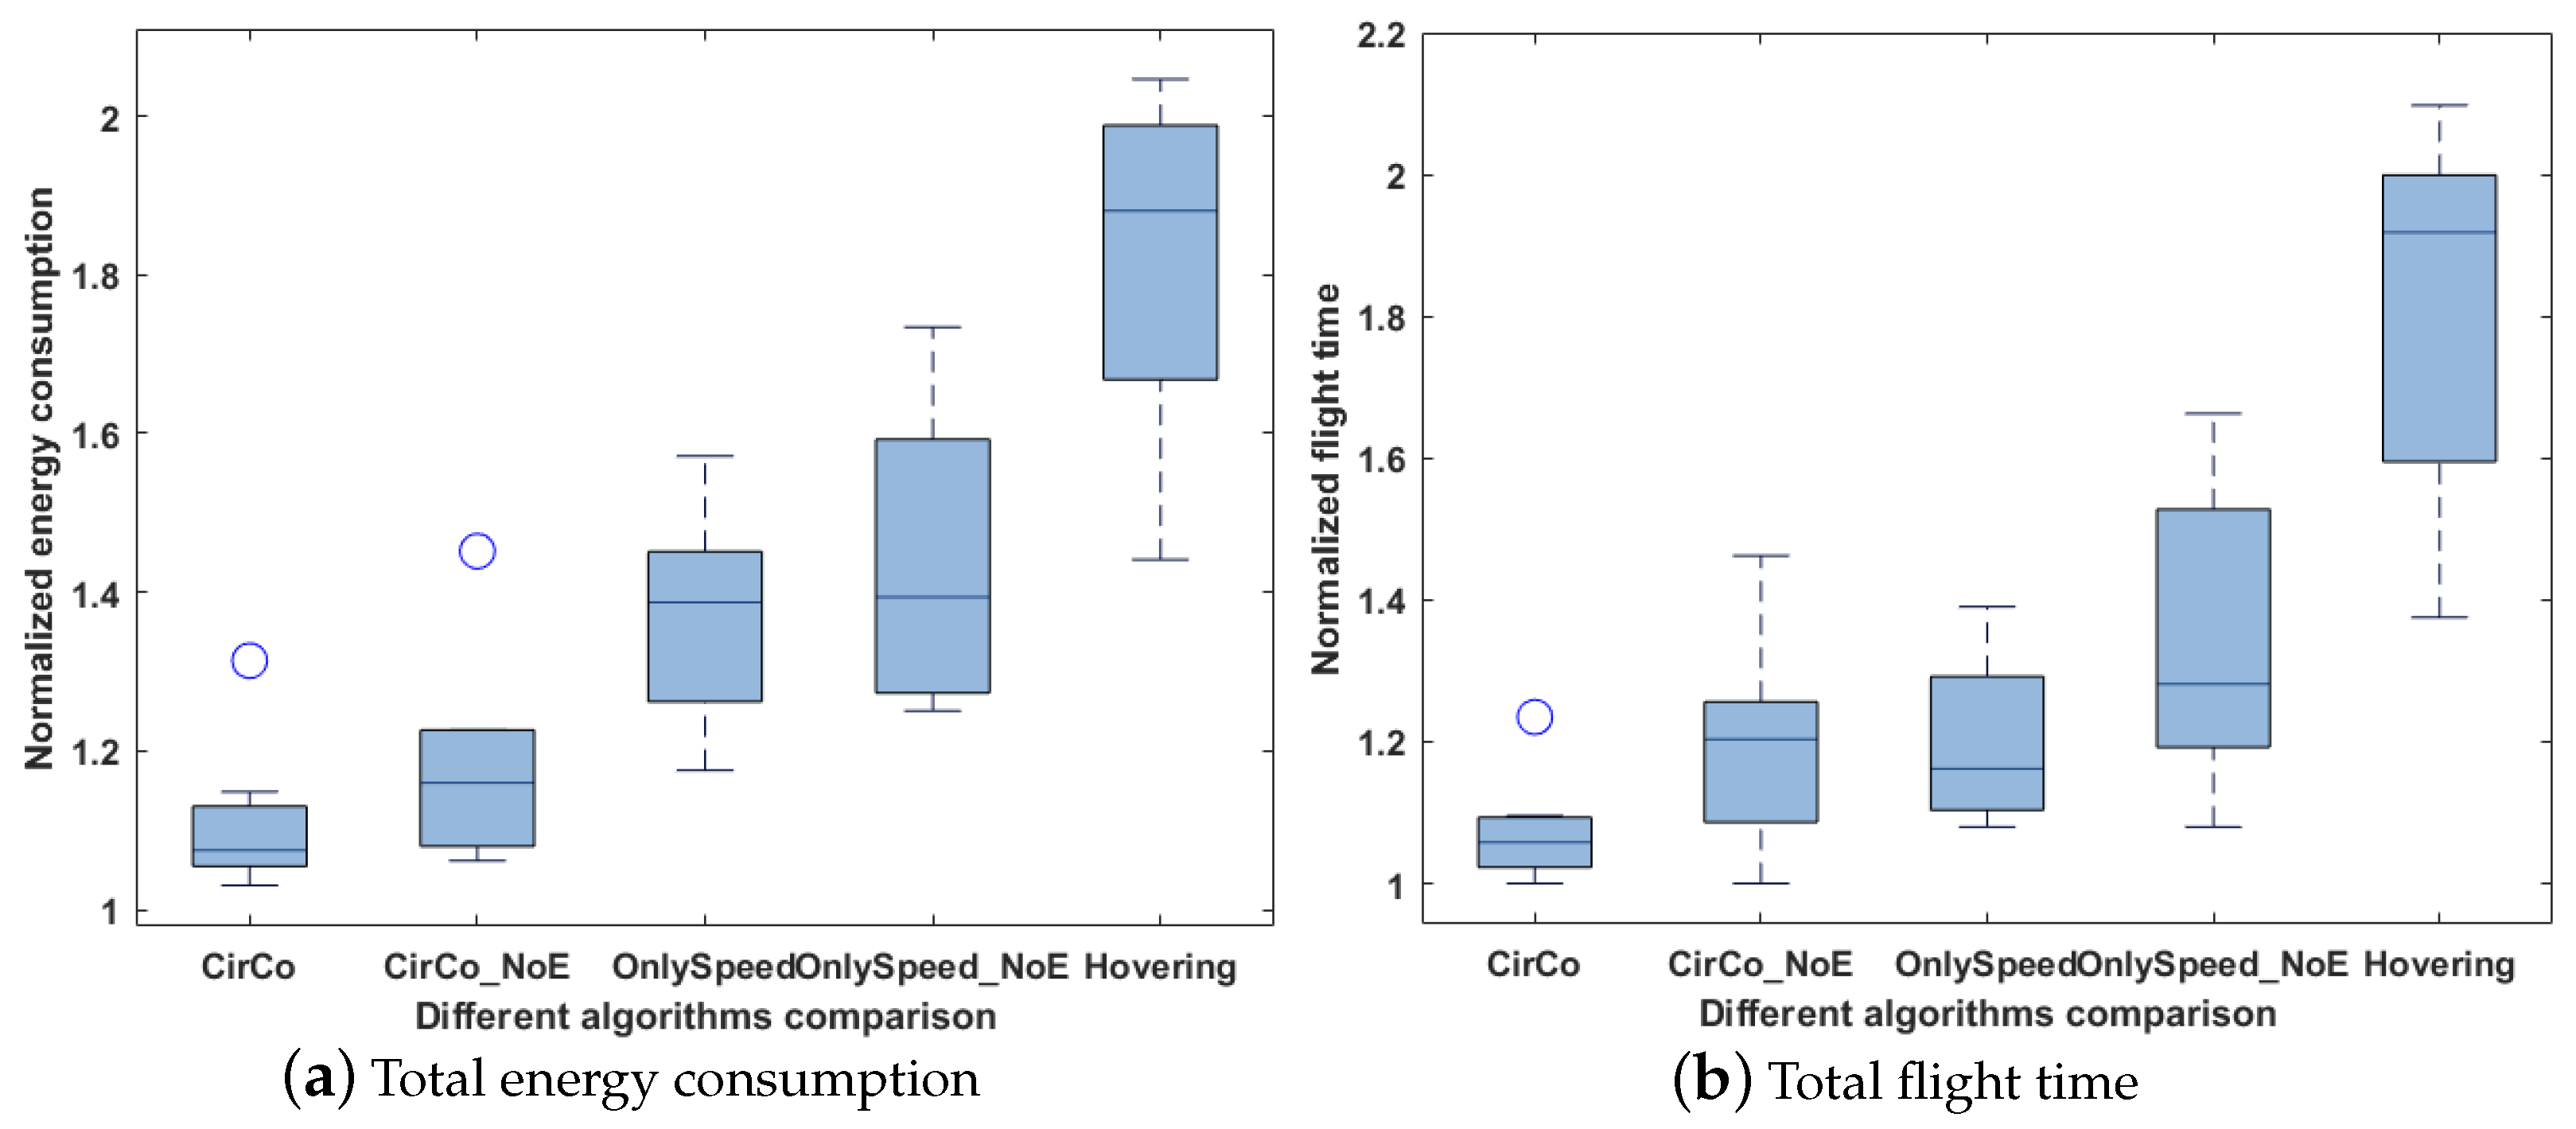
To show the robustness of the proposed algorithm, we tested eight cases with random data (location information and data size), as shown in Figure 11. Since random tasks would result in large variations in energy consumption and time, we used normalized metrics (normalized to the value of the lower bound) to evaluate the performances of different algorithms. We can see that CirCo has the best performance among these algorithms and the range of CirCo is relatively small, showing the stability of CirCo. Therefore, considering the results, CirCo is shown to perform great in both energy consumption and completion time, compared with the other algorithms.

4.3. Discussion

The trajectory and velocity optimization of the UAV for a longer work time in the UAV-assisted IoT network has become the focus of many studies. Compared with other studies, the most significant difference in our work is that an original algorithm based on the principle of projection in space is proposed, which can greatly reduce the complexity of the joint trajectory and velocity optimization problem with the time requirements of transmission tasks. Specifically, through the projection of the time dimension and the two-dimensional space, the time requirement can be skillfully transformed into the boundary restriction condition on the two-dimensional space, so as to transform the whole optimization problem into the optimization problem with the restriction condition on the two-dimensional space. However, there are two limitations for CirCo. First, CirCo is based on a simplified transmission model, where the transmission rate is fixed in each range of the IoT device. Due to the complex situation of different environments, the transmission range is not a changeless constant. The communication performance would degrade with distance due to many types of waste. Therefore, we believe that considering attenuation in the communication process will be necessary for future work. Moreover, due to the limited energy supply of the UAV, and the transmission tasks that a UAV can accomplish in a single flight, it is difficult for a UAV to complete the corresponding data collection work for a large-scale network containing many IoT nodes. In this case, the UAV swarm would be a more reasonable choice to complete the data collection efficiently [43,44]. In this scenario, our proposed algorithm can be the basis for trajectory and velocity planning for each UAV in the area where the UAV is assigned.

5. Conclusions

Leveraging UAVs to collect data from the ground nodes can be used in many large-scale and long-term IoT application scenarios, such as smart cities, air quality sensing, intelligent agriculture, fire/flood monitoring, and so on. Compared with traditional data collection in wireless sensor networks, where each ground node needs to relay data for the others while transmitting its own data, UAVs can collect data directly and periodically. In this case, energy optimization is crucial due to the limited energy supply of the UAV. In this paper, we proposed CirCo, a power optimization strategy to minimize energy consumption by jointly planning the trajectory and velocity of the UAV. CirCo firstly identifies and adopts two relationships (speed vs. power and speed vs. energy per unit distance) to regulate the speed in the different scenarios for improved energy efficiency. Then, an ingenious projection method to find the feasible UAV crossing window directly was applied, which can reduce the optimization complexity significantly by mapping a 3 D problem (GN location and transmission ranges on the 2 D plane, plus the minimum transmission time on the temporal dimension) to a 2 D problem. Then, based on the feasible crossing window derived from the projection algorithm, CirCo can classify the specific conditions and fine-planning of the optimal trajectory and velocity of each condition. Finally, the experiment demonstrates that CirCo can save as much as 54.3 % in energy consumption and 62.9 % in flight time for the UAV.

Author Contributions

Conceptualization, K.Z. and Z.M.; methodology, Z.M.; software, Z.M.; validation, Z.M.; formal analysis, Z.Z. (Zhuyang Zhou) and M.Z.; investigation, Z.M.; resources, K.Z.; data curation, Z.M., Y.L.; writing—original draft preparation, Z.M.; writing—review and editing, K.Z.; visualization, Z.Z. (Ziheng Zhang); supervision, K.Z. All authors have read and agreed to the published version of the manuscript.

Funding

This research received no external funding.

Institutional Review Board Statement

Not applicable.

Informed Consent Statement

Not applicable.

Data Availability Statement

Not applicable.

Acknowledgments

The authors thank the anonymous reviewers for their constructive suggestions and comments, which greatly improved the manuscript. The authors also thank the editor for the kind assistance and beneficial comments. The authors are grateful for the kind support from the editorial office.

Conflicts of Interest

The authors declare no conflict of interest.

Abbreviations

The following abbreviations are used in this manuscript:
UAVunmanned aerial vehicle
IoTInternet of Things
GNground node
GNCground node cluster

References

  1. Ma, Z.; Zhou, Z.; Zhao, M.; Zheng, K. WinCross: Find the Energy-efficient Crossing Window for UAV with Joint Optimization of Path and Speed. In Proceedings of the 2021 International Conference on Space-Air-Ground Computing (SAGC), Huizhou, China, 23–25 October 2021; pp. 137–142. [Google Scholar]
  2. Lin, T.J.; Stol, K.A. Autonomous Surveying of Plantation Forests Using Multi-Rotor UAVs. Drones 2022, 6, 256. [Google Scholar] [CrossRef]
  3. Unal, G. Visual target detection and tracking based on Kalman filter. J. Aeronaut. Space Technol. 2021, 14, 251–259. [Google Scholar]
  4. Kiyak, U. Small aircraft detection using deep learning. Aircr. Eng. Aerosp. Technol. 2021, 93, 671–681. [Google Scholar] [CrossRef]
  5. Trotta, A.; Andreagiovanni, F.D.; Di Felice, M.; Natalizio, E.; Chowdhury, K.R. When UAVs ride a bus: Towards energy-efficient city-scale video surveillance. In Proceedings of the INFOCOM, Honolulu, HI, USA, 16–19 April 2018. [Google Scholar]
  6. Vecchi, E.; Tavasci, L.; De Nigris, N.; Gandolfi, S. GNSS and Photogrammetric UAV Derived Data for Coastal Monitoring: A Case of Study in Emilia-Romagna, Italy. J. Mar. Sci. Eng. 2021, 9, 1194. [Google Scholar] [CrossRef]
  7. Huang, H.; Savkin, A.V.; Huang, C. Round Trip Routing for Energy-Efficient Drone Delivery Based on a Public Transportation Network. IEEE Trans. Transp. Electrif. 2020, 6, 1368–1376. [Google Scholar] [CrossRef]
  8. Zhao, M.; Ma, Z.; Zhou, Z.; Zheng, K. WSpeed: Drone Energy Optimization for Multiple-Package Delivery Considering Weight Changes. In Proceedings of the 2021 International Conference on Space-Air-Ground Computing (SAGC), Huizhou, China, 23–25 October 2021; pp. 1–6. [Google Scholar]
  9. Tan, T.; Zhao, M.; Zhu, Y.; Zeng, Z. Joint Offloading and Resource Allocation of UAV-assisted Mobile Edge Computing with Delay Constraints. In Proceedings of the ICDCSW, Washington, DC, USA, 7–10 July 2021. [Google Scholar]
  10. Bai, T.; Wang, J.; Ren, Y.; Hanzo, L. Energy-efficient computation offloading for secure UAV-edge-computing systems. IEEE Trans. Veh. Technol. 2019, 68, 6074–6087. [Google Scholar] [CrossRef] [Green Version]
  11. Liu, Q.; Sun, S.; Rong, B.; Kadoch, M. Intelligent Reflective Surface Based 6G Communications for Sustainable Energy Infrastructure. IEEE Wirel. Commun. 2021, 28, 49–55. [Google Scholar] [CrossRef]
  12. Fu, S.; Tang, Y.; Wu, Y.; Zhang, N.; Gu, H.; Chen, C.; Liu, M. Energy-efficient UAV-enabled data collection via wireless charging: A reinforcement learning approach. IEEE Internet Things J. 2021, 8, 10209–10219. [Google Scholar] [CrossRef]
  13. Liu, D.; Xu, Y.; Xu, Y.; Sun, Y.; Anpalagan, A.; Wu, Q.; Luo, Y. Opportunistic data collection in cognitive wireless sensor networks: Air–ground collaborative online planning. IEEE Internet Things J. 2020, 7, 8837–8851. [Google Scholar] [CrossRef]
  14. Hinke, J.T.; Giuseffi, L.M.; Hermanson, V.R.; Woodman, S.M.; Krause, D.J. Evaluating Thermal and Color Sensors for Automating Detection of Penguins and Pinnipeds in Images Collected with an Unoccupied Aerial System. Drones 2022, 6, 255. [Google Scholar] [CrossRef]
  15. Bai, T.; Ben-Othman, J.; Han, S.; Kadoch, M.; Li, W.; Rong, B. Guest Editorial: Ubiquitous IoT with Integrated Space, Air, Ground, and Ocean Networks. IEEE Netw. 2021, 35, 98–99. [Google Scholar] [CrossRef]
  16. Mignardi, S.; Marini, R.; Verdone, R.; Buratti, C. On the performance of a uav-aided wireless network based on nb-iot. Drones 2021, 5, 94. [Google Scholar] [CrossRef]
  17. Baek, J.; Han, S.I.; Han, Y. Energy-efficient UAV routing for wireless sensor networks. IEEE Trans. Veh. Technol. 2019, 69, 1741–1750. [Google Scholar] [CrossRef]
  18. Gong, J.; Chang, T.H.; Shen, C.; Chen, X. Flight time minimization of UAV for data collection over wireless sensor networks. IEEE J. Sel. Areas Commun. 2018, 36, 1942–1954. [Google Scholar] [CrossRef] [Green Version]
  19. Liu, J.; Tong, P.; Wang, X.; Bai, B.; Dai, H. UAV-aided data collection for information freshness in wireless sensor networks. IEEE Trans. Wirel. Commun. 2020, 20, 2368–2382. [Google Scholar] [CrossRef]
  20. Gaur, A.; Scotney, B.; Parr, G.; McClean, S. Smart city architecture and its applications based on IoT. Procedia Comput. Sci. 2015, 52, 1089–1094. [Google Scholar] [CrossRef]
  21. Wang, J.; Su, J.; Hua, R. Design of a smart independent smoke sense system based on NB-IoT technology. In Proceedings of the 2019 International Conference on Intelligent Transportation, Big Data & Smart City (ICITBS), Changsha, China, 12–13 January 2019. [Google Scholar]
  22. Klein Hentz, Â.M.; Kinder, P.J.; Hubbart, J.A.; Kellner, E. Accuracy and optimal altitude for physical habitat assessment (PHA) of stream environments using unmanned aerial vehicles (UAV). Drones 2018, 2, 20. [Google Scholar] [CrossRef] [Green Version]
  23. Yang, D.; Zhang, X.; Huang, X.; Shen, L.; Huang, J.; Chang, X.; Xing, G. Understanding power consumption of NB-IoT in the wild: Tool and large-scale measurement. In Proceedings of the 26th Annual International Conference on Mobile Computing and Networking, London, UK, 21–25 September 2020. [Google Scholar]
  24. Xie, L.; Feng, X.; Zhang, C.; Dong, Y.; Huang, J.; Cheng, J. A Framework for Soil Salinity Monitoring in Coastal Wetland Reclamation Areas Based on Combined Unmanned Aerial Vehicle (UAV) Data and Satellite Data. Drones 2022, 6, 257. [Google Scholar] [CrossRef]
  25. Erdelj, M.; Natalizio, E. UAV-assisted disaster management: Applications and open issues. In Proceedings of the 2016 international conference on computing, networking and communications (ICNC), Kauai, HI, USA, 15–18 February 2016; pp. 1–5. [Google Scholar]
  26. Liu, M.; Yang, J.; Gui, G. DSF-NOMA: UAV-assisted emergency communication technology in a heterogeneous Internet of Things. IEEE Internet Things J. 2019, 6, 5508–5519. [Google Scholar] [CrossRef]
  27. Pádua, L.; Guimarães, N.; Adão, T.; Sousa, A.; Peres, E.; Sousa, J.J. Effectiveness of sentinel-2 in multi-temporal post-fire monitoring when compared with UAV imagery. ISPRS Int. J. Geo-Inf. 2020, 9, 225. [Google Scholar] [CrossRef] [Green Version]
  28. Fu, X.; Ding, T.; Peng, R.; Liu, C.; Cheriet, M. Joint UAV channel modeling and power control for 5G IoT networks. EURASIP J. Wirel. Commun. Netw. 2021, 2021, 106. [Google Scholar] [CrossRef]
  29. Zhou, Z.; Ma, Z.; Zhao, M.; Zheng, K. E-Cube: Energy-efficient UAV Trajectory Scheduling with Height and Speed Optimization. In Proceedings of the 2021 International Conference on Space-Air-Ground Computing (SAGC), Huizhou, China, 23–25 October 2021; pp. 12–17. [Google Scholar]
  30. Yang, Z.; Xu, W.; Shikh-Bahaei, M. Energy efficient UAV communication with energy harvesting. IEEE Trans. Veh. Technol. 2019, 69, 1913–1927. [Google Scholar] [CrossRef] [Green Version]
  31. Shan, F.; Luo, J.; Xiong, R.; Wu, W.; Li, J. Looking before Crossing: An Optimal Algorithm to Minimize UAV Energy by Speed Scheduling with a Practical Flight Energy Model. In Proceedings of the INFOCOM, Toronto, ON, Canada, 6–9 July 2020. [Google Scholar]
  32. Abeywickrama, H.V.; Jayawickrama, B.A.; He, Y.; Dutkiewicz, E. Comprehensive Energy Consumption Model for Unmanned Aerial Vehicles, Based on Empirical Studies of Battery Performance. IEEE Access 2018, 6, 58383–58394. [Google Scholar] [CrossRef]
  33. Mozaffari, M.; Saad, W.; Bennis, M.; Debbah, M. Mobile Unmanned Aerial Vehicles (UAVs) for Energy-Efficient Internet of Things Communications. IEEE Trans. Wirel. Commun. 2017, 16, 7574–7589. [Google Scholar] [CrossRef]
  34. Baek, J.; Han, S.I.; Han, Y. Optimal UAV route in wireless charging sensor networks. IEEE Internet Things J. 2019, 7, 1327–1335. [Google Scholar] [CrossRef]
  35. Zhan, C.; Lai, H. Energy Minimization in Internet-of-Things System Based on Rotary-Wing UAV. IEEE Wirel. Commun. Lett. 2019, 8, 1341–1344. [Google Scholar] [CrossRef]
  36. Zeng, Y.; Xu, J.; Zhang, R. Energy Minimization for Wireless Communication With Rotary-Wing UAV. IEEE Trans. Wirel. Commun. 2019, 18, 2329–2345. [Google Scholar] [CrossRef] [Green Version]
  37. Wang, C.N.; Yang, F.C.; Nguyen, V.T.T.; Vo, N.T. CFD analysis and optimum design for a centrifugal pump using an effectively artificial intelligent algorithm. Micromachines 2022, 13, 1208. [Google Scholar] [CrossRef]
  38. Ye, W.; Wu, W.; Shan, F.; Yang, M.; Luo, J. Energy-efficient Trajectory Planning and Speed Scheduling for UAV-assisted Data Collection. In Proceedings of the 2020 16th International Conference on Mobility, Sensing and Networking (MSN), Tokyo, Japan, 17–19 December 2020. [Google Scholar]
  39. Song, D.; Zhai, X.B.; Liu, X.; Tan, C.W. Jointly Optimal Fair Data Collection and Trajectory Design Algorithms in UAV-Aided Cellular Networks. In Proceedings of the 2021 IEEE Wireless Communications and Networking Conference (WCNC), Nanjing, China, 29 March–1 April 2021. [Google Scholar]
  40. Zhang, J.; Li, Z.; Xu, W.; Peng, J.; Liang, W.; Xu, Z.; Ren, X.; Jia, X. Minimizing the number of deployed UAVs for delay-bounded data collection of IoT devices. In Proceedings of the INFOCOM, Vancouver, BC, Canada, 10–13 May 2021. [Google Scholar]
  41. Zhan, C.; Zeng, Y.; Zhang, R. Energy-efficient data collection in UAV enabled wireless sensor network. IEEE Wirel. Commun. Lett. 2017, 7, 328–331. [Google Scholar] [CrossRef] [Green Version]
  42. Ren, X.; Liang, W.; Xu, W. Data collection maximization in renewable sensor networks via time-slot scheduling. IEEE Trans. Comput. 2014, 64, 1870–1883. [Google Scholar] [CrossRef]
  43. Sial, M.B.; Zhang, Y.; Wang, S.; Ali, S.; Wang, X.; Yang, X.; Liao, Z.; Yang, Z. Bearing-Based Distributed Formation Control of Unmanned Aerial Vehicle Swarm by Quaternion-Based Attitude Synchronization in Three-Dimensional Space. Drones 2022, 6, 227. [Google Scholar] [CrossRef]
  44. Torky, M.; El-Dosuky, M.; Goda, E.; Snášel, V.; Hassanien, A.E. Scheduling and Securing Drone Charging System Using Particle Swarm Optimization and Blockchain Technology. Drones 2022, 6, 237. [Google Scholar] [CrossRef]
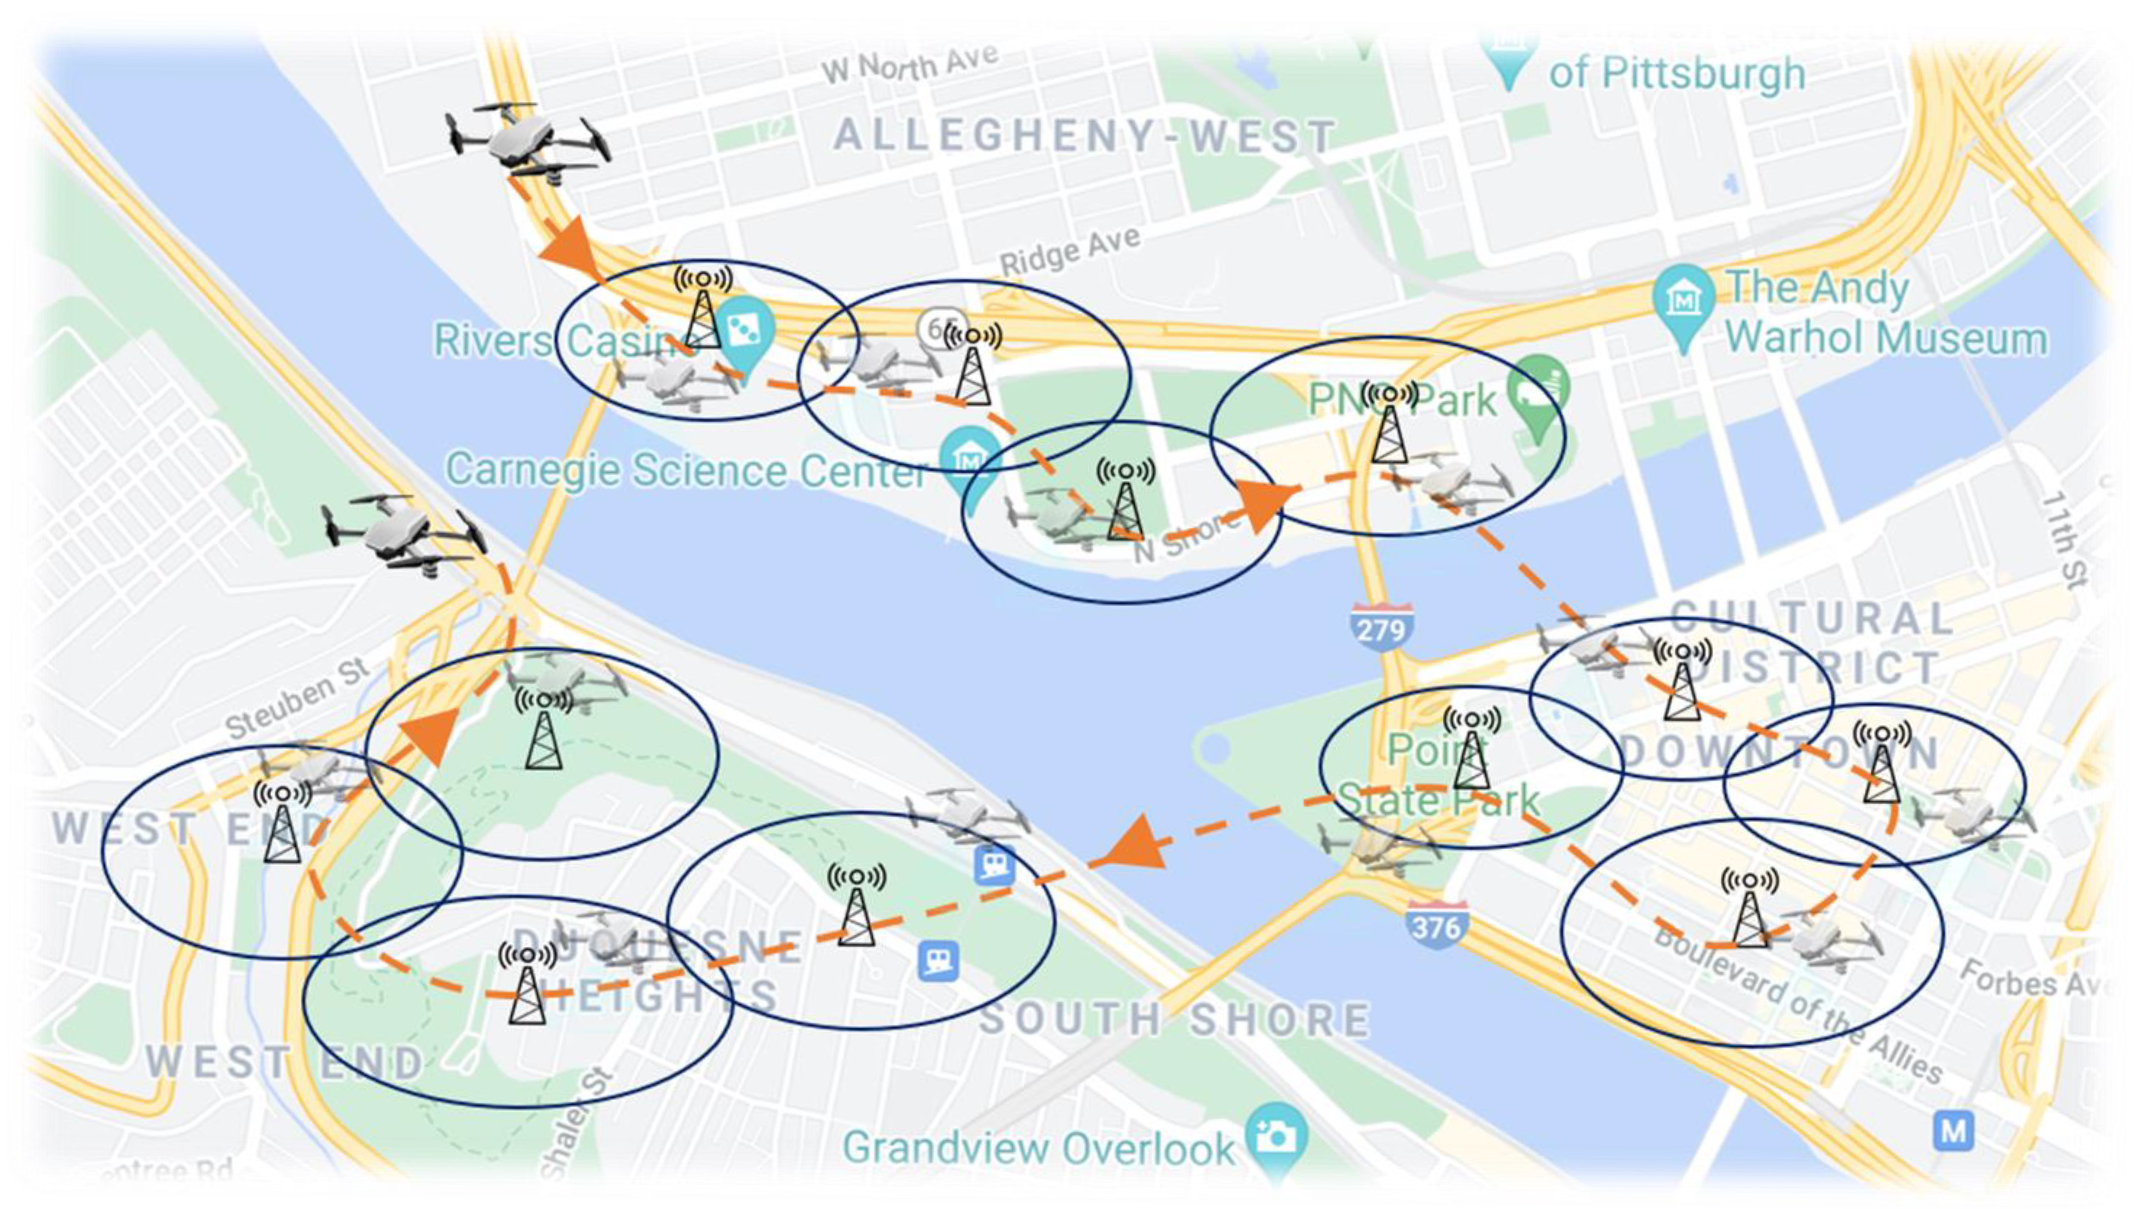
Figure 1. An illustration example: A UAV is dispatched to collect data from a series of ground IoT nodes for scenarios such as fire/flood monitoring, intelligent farming, air quality sensing, etc.
Drones 06 00376 g001
Figure 2. The UAV power or energy consumption functions. The blue and orange-dashed curves represent the relationship between power consumption, speed, and energy consumption per unit distance( E p d ), respectively.
Drones 06 00376 g002
Figure 3. Scenario modeling: irregularly distributed GNs ( g i , j ) could have different transmission ranges and different amounts of transmission workloads. The GNs with ranges in a connected domain are grouped as a cluster ( G i ).
Drones 06 00376 g003
Figure 4. Illustration of the framework for the whole data collection process.
Drones 06 00376 g004
Figure 5. An illustration of the workload transmission problem in 3 D ( 2 D x o y plane + temporal dimension). A UAV should finish data collection within every GN’s blue transmission range; each has its own minimal time requirement, such as t 2 t 1 for g i , j + 1 in (b,c). [ x b j , x t j ] and [ y b j , y t j ] represent the views of the GN transmission ranges on the x and y axes, respectively. The overlapped areas are marked orange in (a,d). The red UAV trajectory shows a desired straight path through the orange windows.
Drones 06 00376 g005
Figure 6. The process of using the CirCo projection method to find the feasible crossing window. The three blue circles are transmission ranges of GNs forming two orange overlapped areas o i , j and o i , j + 1 . Based on the red starting point, the two green circles are the projection results that project the two following blue circles to the plane of o i , j + 1 , in proportion to their minimum transmission time requirements, as shown in Figure 5a. Then, the green part in (b) is the common region between o i , j and the projection area of o i , j + 1 , which is the feasible UAV crossing window we desire.
Drones 06 00376 g006
Figure 7. The projected conditions and corresponding trajectory and velocity.
Drones 06 00376 g007
Figure 8. The energy consumption and flight time of the UAV varies with the device quantity, from 5 to 20.
Drones 06 00376 g008
Figure 9. The energy consumption and flight time comparison with different GNC quantities and a fixed number of GNs, such as 15.
Drones 06 00376 g009
Figure 10. The energy consumption and flight time vary with different transmission ranges of the IoT nodes (from 50 to 500 m), with 8 GNs and 2 GNCs.
Drones 06 00376 g010
Figure 11. The performance comparison between different algorithms and lower bound. All results are normalized to the value of lower bound. Circles denote outliers in the test.
Drones 06 00376 g011
Table 1. Main notations and terminologies of the UAV.
NotationPhysical MeaningSimulation Value
WWeight of UAV in Newton20
ρ Air density ( kg   m 3 )1.225
RRoter radius (m)0.4
nNumber of blades4
lblade chord length (m)0.0157
Ω Blade angular velocity (r/s)300
sRoter solidity, defined as the ratio of the total blade area to the rotor disc area, = n × l × R π × R 2 0.05
S F Fuselage equivalent flat area ( m 2 )0.0151
d F Fuselage drag ratio, = S F s × π × R 2 0.6
kIncremental correction factor to induced power0.1
v 0 Mean rotor induced velocity in hover, = W 2 × ρ × π × R 2 0.0157
δ Profile drag coefficient0.012
Table 2. List of the major notations.
NotationDescription
G i The ith ground node cluster (GNCs)
I/JThe total number of GNCs/GNs
( X i , Y i ) The location of the center point for the ith GNC
T S i / T E i The time when the UAV leaves S i or arrives E i
L i The vector path from E i to S i + 1
V i The velocity of the UAV between E i and S i + 1
g i , j The j ground node(GNs) in the ith GNC
J i The total number of GNs in the ith GNC
( x i , j , y i , j ) The location of g i , j
r i , j The radius of g i , j
τ i , j The minimum communication time of g i , j
o i , j The overlapped area between g i , j and g i , j + 1
s i , j / e i , j The starting/endpoint of communication in g i , j
t s i , j / t e i , j The time when the UAV leaves s i , j or arrives at e i , j
l i , j The vector path from s i , j to s i , j + 1
v i , j The velocity of the UAV between s i , j and e i , j
HThe altitude of the UAV
E p d /PThe power/(energy consumption per mile) of UAV
V P / V E The UAV velocity corresponding to minimum P/ E p d
Q t o t a l The total consumption of UAV
Q i n t r a / Q i n t e r The consumption of the UAV insides/among GNCs
Publisher’s Note: MDPI stays neutral with regard to jurisdictional claims in published maps and institutional affiliations.