Article

A Case Study of Vignetting Nonuniformity in UAV-Based Uncooled Thermal Cameras

1
Independent Researcher, Burr Ridge, IL 60527, USA
2
Department of Agricultural and Biological Engineering, The Pennsylvania State University, University Park, PA 16802, USA
*
Author to whom correspondence should be addressed.
Drones 2022, 6(12), 394; https://doi.org/10.3390/drones6120394
Submission received: 30 October 2022 / Revised: 26 November 2022 / Accepted: 30 November 2022 / Published: 3 December 2022

Abstract

:
Uncooled thermal cameras have been employed as common UAV payloads for aerial temperature surveillance in recent years. Due to the lack of internal cooling systems, such cameras often suffer from thermal-drift-induced nonuniformity or vignetting despite having built-in mechanisms to minimize the noise. The current study examined a UAV-based uncooled thermal camera vignetting regarding camera warmup time, ambient temperature, and wind speed and direction, and proposed a simple calibration-based vignetting migration method. The experiments suggested that the camera needed to undergo a warmup period to achieve stabilized performance. The required warmup duration ranged from 20 to 40 min depending on ambient temperature. Camera vignetting severity increased with camera warmup time, decreasing ambient temperature, and wind presence, while wind speed and direction did not make a difference to camera vignetting during the experiments. Utilizing a single image of a customized calibration target, we were able to mitigate vignetting of outdoor images captured in a 30 min duration by approximately 70% to 80% in terms of the intra-image pixel standard deviation (IISD) and 75% in terms of the pixel-wise mean (PWMN) range. The results indicated that outdoor environmental conditions such as air temperature and wind speed during short UAV flights might only minimally influence the thermal camera vignetting severity and pattern. Nonetheless, frequent external shutter-based corrections and considering the camera nonlinear temperature response in future studies have the potential to further improve vignetting correction efficacy for large scene temperature ranges.

1. Introduction

Thermal cameras, or infrared imagers, are a type of sensor capable of gauging areal surface temperature remotely by measuring, ideally, only emitted infrared radiation fluxes from objects. Current thermal cameras can be classified into two types: cooled and uncooled. Cooled thermal cameras have integrated cryocoolers that can reduce thermally-induced internal noise; thus, they have high sensitivity and accuracy [1]. On the other hand, uncooled thermal cameras are small, light, and have low power consumption as they lack internal cooling systems [2]. Due to these advantages, uncooled thermal cameras are commonly employed as unmanned aerial vehicle (UAV) payloads, especially for agricultural applications such as crop water stress monitoring, disease detection, phenotyping, and yield estimation [3].
Because of their low cost, integration ease, and wide resistance change range with radiation absorption, microbolometers are the most popular type of infrared radiation detector used in uncooled thermal cameras [4]. Assembling a set of microbolometers into an array at the focal plane of a thermal camera lens forms a focal plane array (FPA), which can be heated by the infrared radiation focused through the lens [5,6]. The electrical resistance of each individual microbolometer is dependent on its temperature [7] and varies proportionally to the incident infrared radiation. A readout circuitry (ROIC) reads the resistance of the microbolometers, and thus provides the temperature information of a scene observed by the camera [8].
As each microbolometer in a FPA has unique dark current bias and sensitivity to scene temperatures, output signals of individual microbolometers will be different despite having the same scene temperature. The nonuniform microbolometer responses lead to a fixed pattern noise (FPN) in thermograms, which is known as the nonuniformity issue. Notably, the relationship between microbolometer sensitivity and scene temperature is not linear in a wide temperature range, but generally can be approximated to be linear in a narrow temperature range [9]. At factory level, a nonuniformity correction (NUC) needs to be carried out for an FPA to achieve uniform microbolometer responses to unit infrared radiation change. Common NUC methods include one-point, two-point, and multi-point corrections, where one, two, and multiple uniform blackbody radiation sources at different temperatures are used as calibration targets [10,11]. Under the linear microbolometer response assumption [12]:
Sij(φ) = Kijφ + Qij,
where φ is the incident irradiance on the microbolometer at the ith row and jth column, Sij(φ) is the output of the microbolometer, Kij is the gain of the microbolometer, and Qij is the offset of the microbolometer; NUC aims to find the gain and offset parameters of each microbolometer.
For a UAV-based thermal camera, the temperature of the camera interior, lens, and microbolometer housing can be affected by camera internal electronics, gimbal motor heat, and propeller slipstream cooling. Due to the camera temperature unevenness, an FPA even with factory NUC may still output thermal images with prominent nonuniformity [5]. The camera behavior change resulting from camera temperature variation is known as thermal drift, and the new nonuniform noise pattern in images is often described as “vignetting” or “halo” since the edges and corners of images usually appear cooler than the centers [13]. Another type of FPN other than vignetting, called strip noise, also commonly exist in thermal images, which is introduced by the ROIC amplifier nonuniformity of an FPA [14] and manifests as vertical and horizontal line artifacts.
There are currently two approaches to correct post-production nonuniformity in thermal cameras. The term “flat-field correction” has been used to refer to NUC conducted at this stage [15]. The first and most well-known approach is shutter-based correction. Often an opaque shutter is built into a thermal camera and automatically and periodically introduced in between the lens and FPA to cover the camera’s field of view (FOV). The FPA offset parameters are then updated utilizing a sequence of consecutive thermal images of the shutter [5]. The shutter-based correction is essentially a one-point NUC. It requires shutter surfaces to have uniform temperatures but unfortunately disrupts a thermal camera’s normal operation by causing image freezing for a few seconds. The second approach is scene-based correction, which updates FPA parameters iteratively utilizing information extracted from inter-frame motion of real scene images [16]. Statistical analysis [17,18], algebraic computation [19], Kalman filter [20], temporal high-pass filter [21,22], image registration [23], and neural networks [16,24] have all been utilized in scene-based correction algorithms, although most of them were intended for correcting strip noise rather than vignetting. While scene-based techniques remove the need for a shutter and show better correction performance for time-varying offset and variable integration time [25], they are computationally complex, typically require multiple image frames, and do not guarantee corrected temperature accuracy [11,26]. These disadvantages prevent the implementation of scene-based techniques in hardware and real-time processing; hence, almost all thermal cameras still rely on shutter-based correction [27].
Even though nonuniformity has been well-documented in the technical thermography literature, it does not seem to have received enough attention from the UAV community. Most studies that utilized UAV-based thermal cameras simply did not acknowledge the influence of nonuniformity on temperature measurement accuracy, and very few studies addressed the issue. Xu et al. [28] modeled the vignetting of a FLIR Tau 2 (Teledyne FLIR LLC, Wilsonville, OR, USA) based on a sixth order polynomial, and calibrated the camera using a blackbody and the mean of ten images through least squares fitting. In the study, image centers were assumed to have zero vignetting effect and utilized as the standard for vignetting correction. They observed that vignetting could offset pixels near image edges by up to 3 °C, and noted that multiple vignetting correction models needed to be created for different ambient temperatures. However, they eventually did not perform vignetting correction and simply discarded edge pixels and measured temperatures using only central pixels. Israel and Reinhard [29] utilized a microbolometer optimization algorithm to mitigate the vignetting of a FLIR Tau 640, which consisted of a dead pixel correction based on a lookup table with known dead pixels, a low pass filtering with a kernel size of 147 × 147, and finally a bit depth compression from 14 bits to 8 bits. Labbé et al. [30] corrected the vignetting of a FLIR ThermaCAM B20HSV, by first calculating the mean of a series of images and its radiometric profile, and then fitting a multiplicative polynomial function that was minimally quadratic. Lin et al. [31] first performed temporal NUC to counter ambient temperature influence on a FLIR A65, and then corrected the camera vignetting through multi-point correction. They used a water bath blackbody as the calibration target and least squares to find pixel-wise gain and offset parameters. Kelly et al. [13] captured thermal images of a blackbody at 19 °C with a FLIR Vue Pro 640 and observed the presence of conspicuous vignetting with a 2.6 °C temperature range. Virtue et al. [32] evaluated an external heated shutter for improving the stability and accuracy of a FLIR Vue Pro R. They briefly mentioned that vignetting is a known issue associated with the camera and created a filter utilizing a blackbody to counter the nonuniformity. Aragon et al. [33] calibrated a FLIR A655sc and a TeAx 640 (TeAx Technology GmbH, Wilnsdorf, Germany) with a blackbody in an environmental chamber at varying ambient temperatures. They used multilinear regression to model the influence of ambient temperature on individual pixel outputs as a proxy of FPA temperature. They reduced the average standard deviation and interquartile range of vignetting in FLIR A655sc from, respectively, 0.109 °C and 0.141 °C to 0.059 °C and 0.078 °C, and those in TeAx 640 from 1.059 °C and 1.387 °C to 0.096 °C and 0.099 °C.
The current study was motivated by two reasons. First, a detailed description of vignetting nonuniformity in uncooled thermal cameras is missing in the current UAV literature. Second, insulated environments with controllable temperatures and high-end blackbody equipment are not available for all researchers to conduct precise camera calibration. A practical solution for vignetting reduction is still in need. This article bridges the knowledge gaps by providing a behavior examination of a UAV-based uncooled thermal camera under laboratory and field conditions with a focus on vignetting severity and pattern, and an assessment of a proposed methodology to improve thermal image degradation from vignetting. Specifically, the objectives of the study included: (1) characterizing vignetting in relation to camera warmup time; (2) evaluating vignetting in controlled environments under different ambient temperatures and wind conditions; and (3) establishing a simple calibration-based method for vignetting mitigation.

2. Materials and Methods

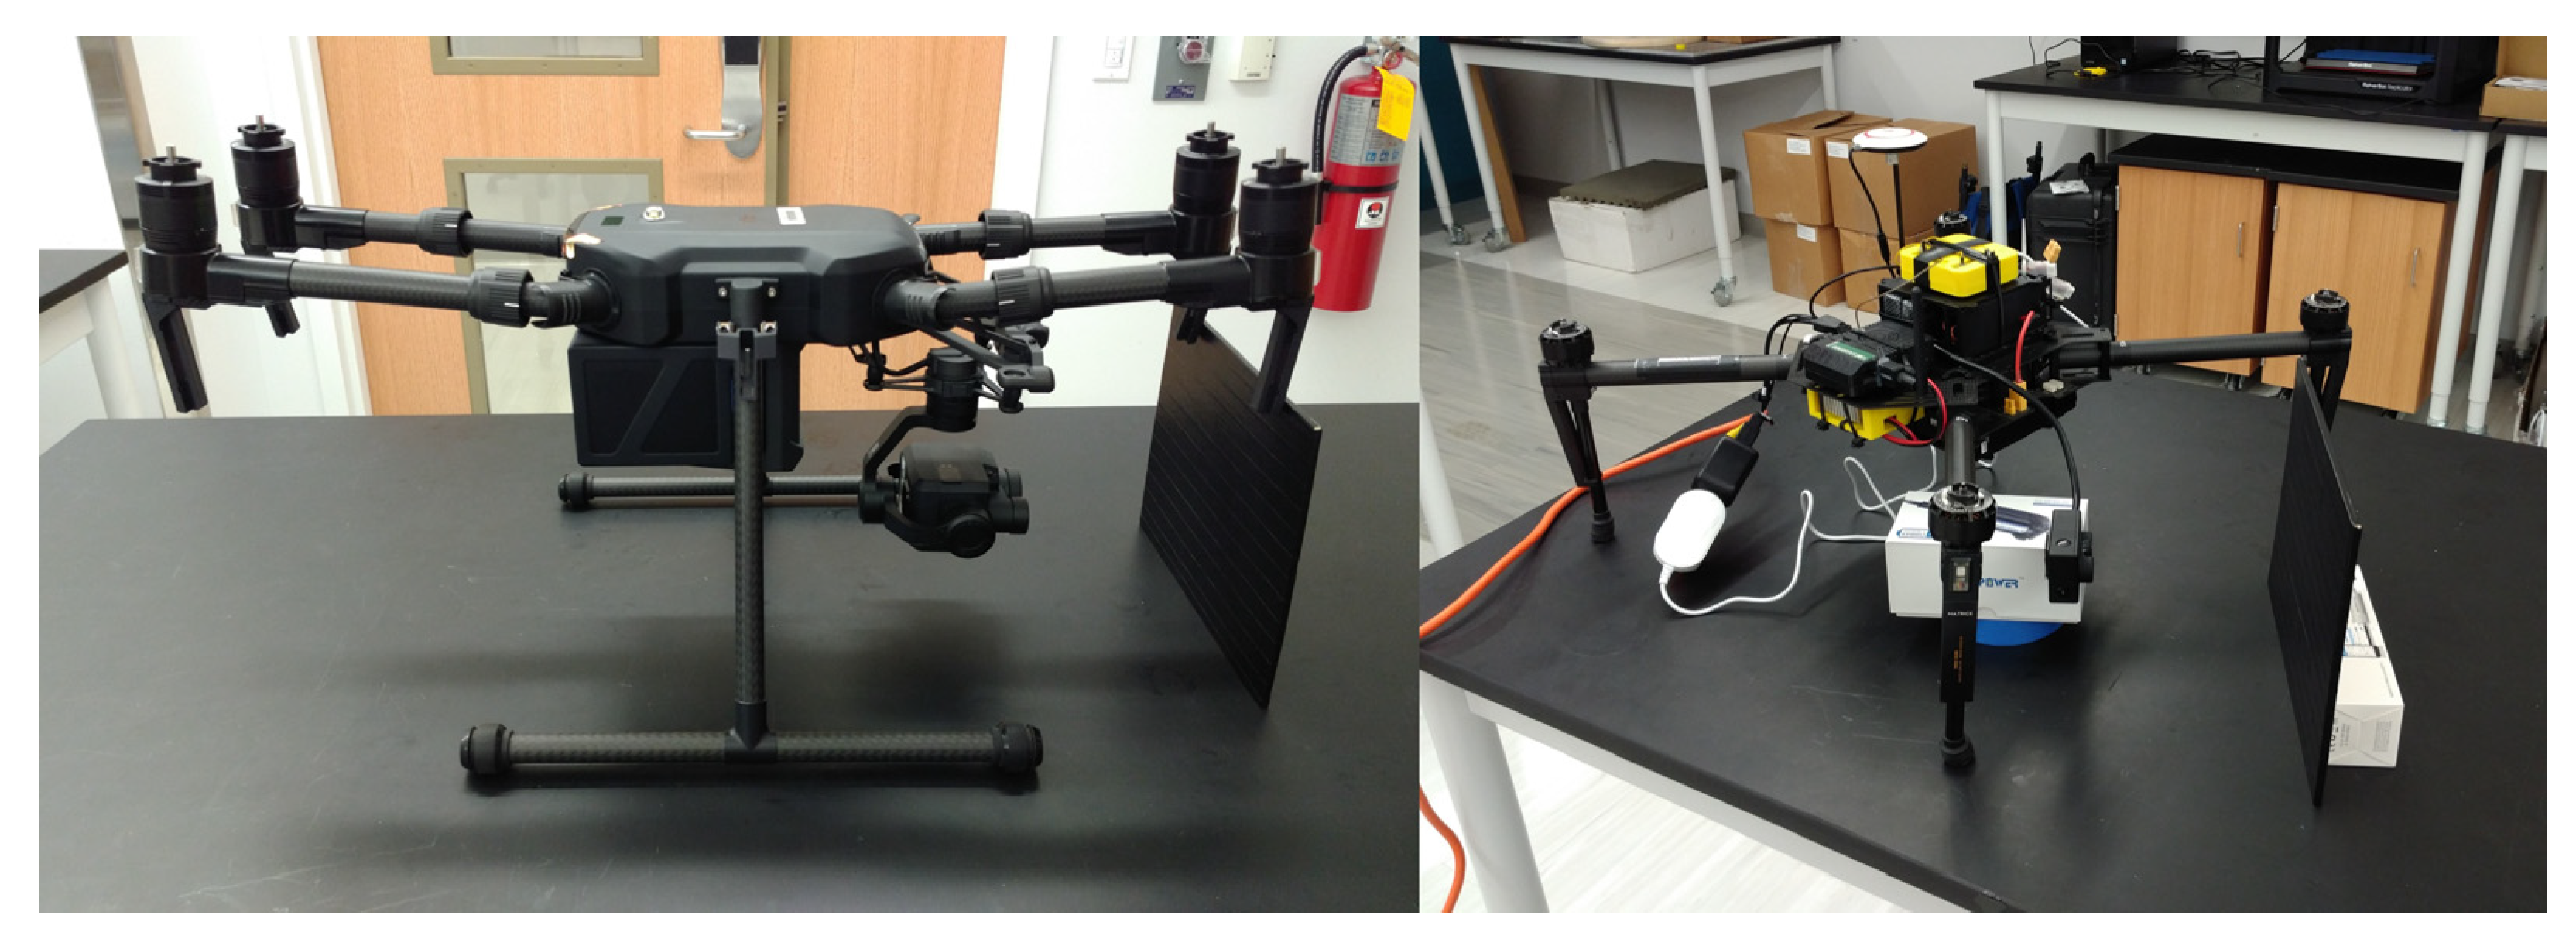
2.1. Thermal Cameras

There were two uncooled thermal cameras involved in the study. The first camera was a DJI Zenmuse XT2 (SZ DJI Technology Co. Ltd., Shenzhen, China), which features a FLIR Tau 2 thermal camera module. A DJI Matrice 200 V2 was used as the power source for the camera. The second camera was a FLIR Duo R, which was used to confirm certain observations from XT2 not caused by hardware defects. An onboard computer ODROID-XU4 (Hardkernel Co., Ltd., Anyang, South Korea) was used to supply power to the camera. Key specifications of the two cameras are listed in Table 1.

2.2. Radiometric Calibrations

Evaluating thermal cameras in terms of temperature requires radiometric calibration to convert image pixel values into temperature readings. As an alternative to expensive blackbody radiation equipment, a piece of 20.3 cm × 25.4 cm plywood board covered with electrical tape was used as the calibration target for XT2. Electrical tapes are known to have high emissivity values (e.g., 0.95) [34], therefore they are an ideal materiel for simulating a blackbody surface. A thermoelectric incubator (ReptiPro 6000, ReptiPro, Treasure Island, FL, USA) was used to alter the calibration target temperature at a 5 °C step from 10 to 60 °C. A digital thermometer (TP-50, ThermoPro, Toronto, ON, Canada) was placed inside the incubator to monitor its internal temperature (Figure 1), which has a ±0.56 °C accuracy.
Before collecting calibration data, XT2 was “warmed up” or powered on for at least one hour for its internal parts to reach thermal equilibrium. Although being arbitrarily selected, one hour was later proven in the experiments to be sufficient for XT2 to achieve internal thermal equilibrium regardless of ambient temperature. During calibration, when the incubator internal temperatures stabilized to desired levels, the incubator door was carefully opened and five pictures fully filled with the calibration target were captured consecutively within one second. XT2 lens was always kept perpendicular to the calibration target during data collection, although camera viewing angle was unimportant in our case as the calibration target had a diffuse reflecting surface.
The calibration process was repeated three times under different ambient temperature conditions to study the influence of ambient temperature on XT2’s radiometric response. Specifically, XT2 was warmed up and kept first in an air-conditioned laboratory at 20 °C, then in an insulated cold room at 4 °C, and finally in an insulated freezer room at −17 °C.
After obtaining the calibration data, the average pixel value of each image was calculated, and the relationship between the thermometer readings and the average pixel values under each ambient temperature condition as well as the overall relationship were estimated using linear regression. The calibration accuracies were evaluated in terms of coefficient of determination (R2) and root mean square error (RMSE).

2.3. Warmup Experiments

To study the duration required for XT2 to reach internal thermal equilibrium under different ambient temperature conditions, the following procedure was repeated three times in the 20 °C laboratory, 4 °C cold room, and −17 °C freezer room, respectively, in total nine times. Before the experiments, XT2 was first kept in the 20 °C laboratory for at least 24 h, simulating a normal camera storage condition. Meanwhile, the calibration target was also placed inside the designated environment for at least 24 h to reach the same temperature as the environment, simulating a uniform blackbody radiation surface. During the experiments, right after power-up, XT2 was placed inside the designated environment. The calibration target was then placed in front of XT2 at a 14 cm distance to the camera lens so that the camera’s FOV was fully filled with the target. Calibration target images were continuously captured every 30 s for one hour. To study XT2’s stability after reaching thermal equilibrium, one of the three experiments under each ambient temperature condition lasted two hours.
To confirm that the observed behaviors of XT2 regarding vignetting were not caused by sensor detects, a two-hour long warmup experiment with an identical setup as XT2’s warmup experiments was also conducted using Duo R in the 20 °C laboratory (Figure 2).

2.4. Wind Experiments

To study the influence of wind speed on XT2’s thermal equilibrium and vignetting, the following procedure was repeated three times in the 20 °C laboratory using two fans, in total six times. The small fan (HF-1008W, Mainstays Direct, Las Vegas, NV, USA) generates wind at 2 m s−1, and the large fan (RMC-FA150DGD, GHP Group Inc, Niles, IL, USA) generates wind at 7 m s−1. Fan speeds were measured using a digital anemometer (HP-866B, Zhuhai Holdpeak instrument Co., Ltd., Zhuhai, China). Before the experiments, the calibration target was placed inside the laboratory for at least 24 h to reach the same temperature as the environment, and XT2 was powered on for at least one hour to stabilize. During the experiments, the calibration target was placed in front of XT2 at a 14 cm distance to the camera lens, and one of the fans was placed on the right side of XT2 as close as possible (Figure 3). Images of the calibration target were continuously captured every 2 s first for 15 min without the fan being powered on, and then for another hour with the fan being powered on. Note that, theoretically, the simulated windy condition should have minimum influence on the calibration target temperature.
To study whether wind direction makes a difference on XT2’s vignetting pattern and whether the presence of wind can speed up camera warmup, an additional wind experiment was conducted in the 20 °C laboratory using each fan, respectively. Before the experiments, the calibration target was placed inside the laboratory for at least 24 h to reach the same temperature as the environment. During the experiments, the calibration target was placed in front of XT2 at a 14 cm distance to the camera lens, and the fan was placed on the left side of XT2 as close as possible. Both XT2 and the fan were powered on at the same time, and calibration target images were collected continuously every 30 s for an hour and 10 min. The images captured in the first hour were used to study camera warmup speed, and the images captured in the last 10 min were used to study wind direction effect on camera vignetting.

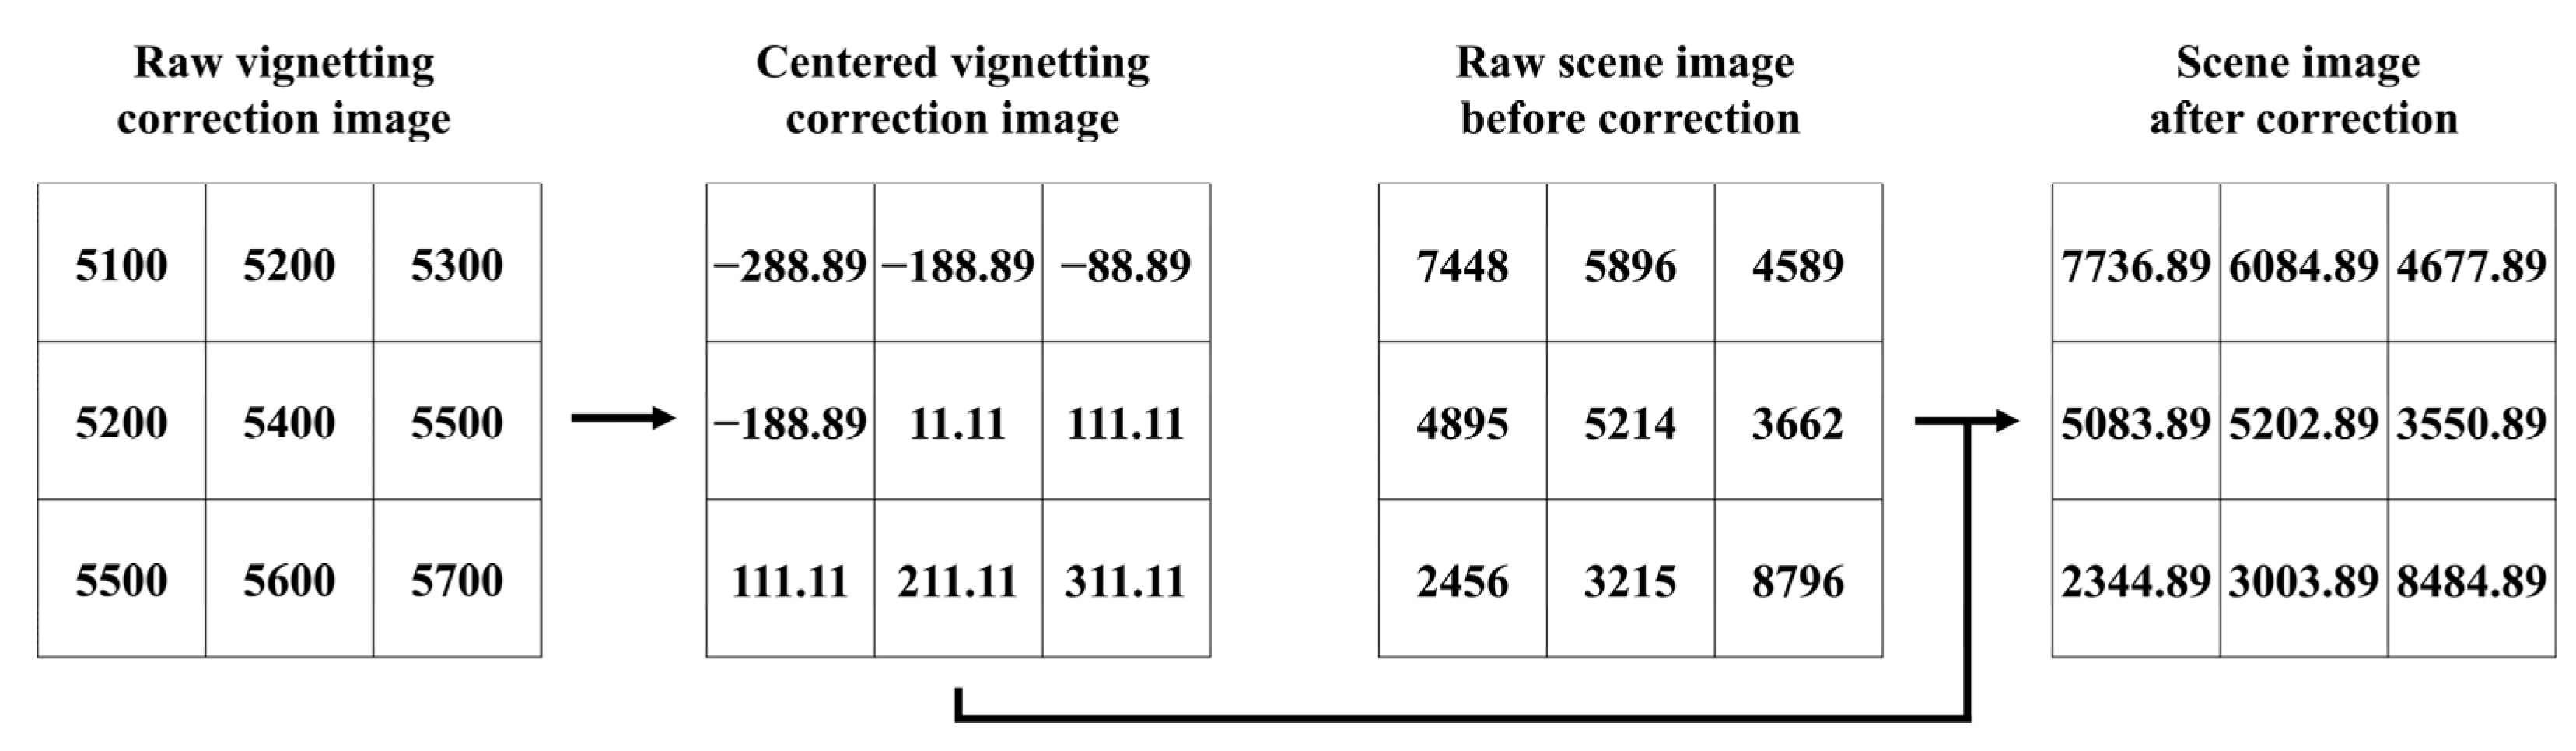
2.5. Proposed Vignetting Mitigation

As mentioned in Introduction, under the linear microbolometer response assumption, when thermal drift in thermal cameras occurs within a narrow temperature range, one-point NUC can be a simple but effective way of correcting thermal camera vignetting since only the offset parameters of an FPA need to be updated. Current commercial UAVs typically have a hovering time below 40 min, while heavy UAV payloads can even compress the time below 20 min. If thermal cameras stabilize thermally in the air before data collection and weather variation during short UAV flight missions is negligible, then the vignetting of all images collected within the same flight can potentially be mitigated by a single image of a uniform radiation surface. Since thermal camera temperature will likely change after UAV takeoff or landing due to the presence or absence of propeller slipstream, ideally a vignetting correction image or an image fully filled with a uniform radiation target should be captured while the camera is in midair. Preparing an enormous calibration target in the field is simply infeasible and impractical. Using an external camera shutter could be a solution [32], which unfortunately can be expensive and incontinent.
Alternatively, after UAV landing, thermal cameras might exhibit very similar temperatures and vignetting patterns to what they have in the air for a short period of time, and this time window can potentially be utilized for capturing effective vignetting correction images on the ground. Based on this presumption, we proposed using a calibration target image captured on the ground right after UAV landing as the vignetting correction image for all scene images collected during a flight mission. The vignetting mitigation procedure included first centering a vignetting correction image by subtracting the average pixel value of the image from each pixel, and then subtracting the centered vignetting correction image from the rest of the scene images (Figure 4).
To identify the period duration post UAV landing that is suitable for vignetting correction image collection, the following procedure was repeated three times in field conditions at Russell E. Larson Agricultural Research Center, Pennsylvania Furnace, Pennsylvania, USA. Before the experiments, XT2 was first warmed up on the ground for at least one hour to stabilize. Meanwhile, using the atmosphere as a natural incubator, the calibration target was also left in the shade for at least an hour to minimize its surface temperature variation. During the experiments, the UAV was controlled manually to take off, hover in the air for at least 15 min, and land to simulate regular flight missions. As soon as the UAV landed, the calibration target was placed in front of XT2 such that it filled the camera’s FOV, and calibration target images were captured every 2 s for 15 min.
To evaluate the efficacy of our proposed vignetting mitigation method for changeable outdoor environments, the following procedure was repeated three times in field conditions again at Russell E. Larson Agricultural Research Center. Before the experiments, in a shaded open area, the calibration target was placed in front of XT2 at a 14 cm distance to the camera lens, and XT2 was warmed up on the ground for at least an hour to stabilize. During the experiments, images of the calibration target were captured every 1 s for half an hour, simulating data collection during a regular UAV flight. At the end of a data collection, an extra image was captured as the vignetting correction image for the whole dataset.

2.6. Data Analysis

Depending on the experiment, the collected calibration target images were analyzed using one or more of the following metrics, including intra-image pixel mean (IIMN), intra-image pixel standard deviation (IISD), pixel-wise maximum (PWMA), pixel-wise minimum (PWMI), pixel-wise medium (PWMM), pixel-wise range (PWRA), and pixel-wise mean (PWMN). The two intra-image metrics IIMN and IISD, which were the average pixel value and the pixel value standard deviation of an image, respectively, reflect the thermal camera measurement accuracy and vignetting severity. The five pixel-wise metrics were the pixel value statistics of a fixed pixel location during a period across multiple images, which reflect individual pixel or microbolometer behavior difference. While PWMA, PWMI, PWMM, and PWMN are intuitive, PWRA was calculated by subtracting the minimum value from the maximum value of a pixel location during a specified period. Image processing and data analysis were completed using MATLAB R2021a (The MathWorks, Inc., Natick, MA, USA). Image colorization in the subsequent figures was based on the jet colormap.

3. Results and Discussion

3.1. Radiometric Calibrations

Figure 5 shows the individual calibrated relationships between the image pixel value and the temperature of XT2 under different ambient temperature conditions as well as the overall relationship. Note each apparent data point in the graphs actually represents five data points since five images were captured consecutively for each temperature step during the calibration process. Highly linear responses from XT2 with R2s larger than 0.99 were observed for all ambient temperature conditions, which did not seem to have a large impact on the slopes and intercepts of the calibrated relationships. The difference between the RMSEs of the individual calibrated relationships was likely due to the inaccuracy of the calibration equipment and errors induced during the calibration process. Nonetheless, the RMSE of the overall relationship is 38% to 150% higher than the individual ones. Note that at each temperature step, the blue data points at −17 °C have consistently lower pixel values than the red data points at 20 °C, implying that ambient temperature does have a systemic influence on XT2’s temperature measurements.
Unlike what Kelly et al. [13] observed in their FLIR Vue Pro, which responded to the same blackbody temperature under 21 °C and 10 °C ambient temperature conditions with more than a 1000 pixel value difference, XT2 demonstrated a stable performance against ambient temperature for radiometric calibration, despite −17 °C being considered an extreme camera operating temperature. Comparing the overall 1.502 °C RMSE to the ±10 °C accuracy specified in the user manual, we conclude that after XT2 reaches thermal equilibrium, ignoring intra-image pixel value variation, air temperature does not impact the camera’s temperature measurement accuracy in a major way.
Since several other factors also affect the temperature measurement accuracy of thermal cameras such as object emissivity, humidity, and distance between the camera and object [13], it is worth noting that the calibrated relationships above should only be used for calculating temperature values of the calibration target images collected in this study. For accurate temperature measurements, in-field radiometric calibrations for specific target objects under a unique UAV flight setup and distinctive environments should be carried out individually.

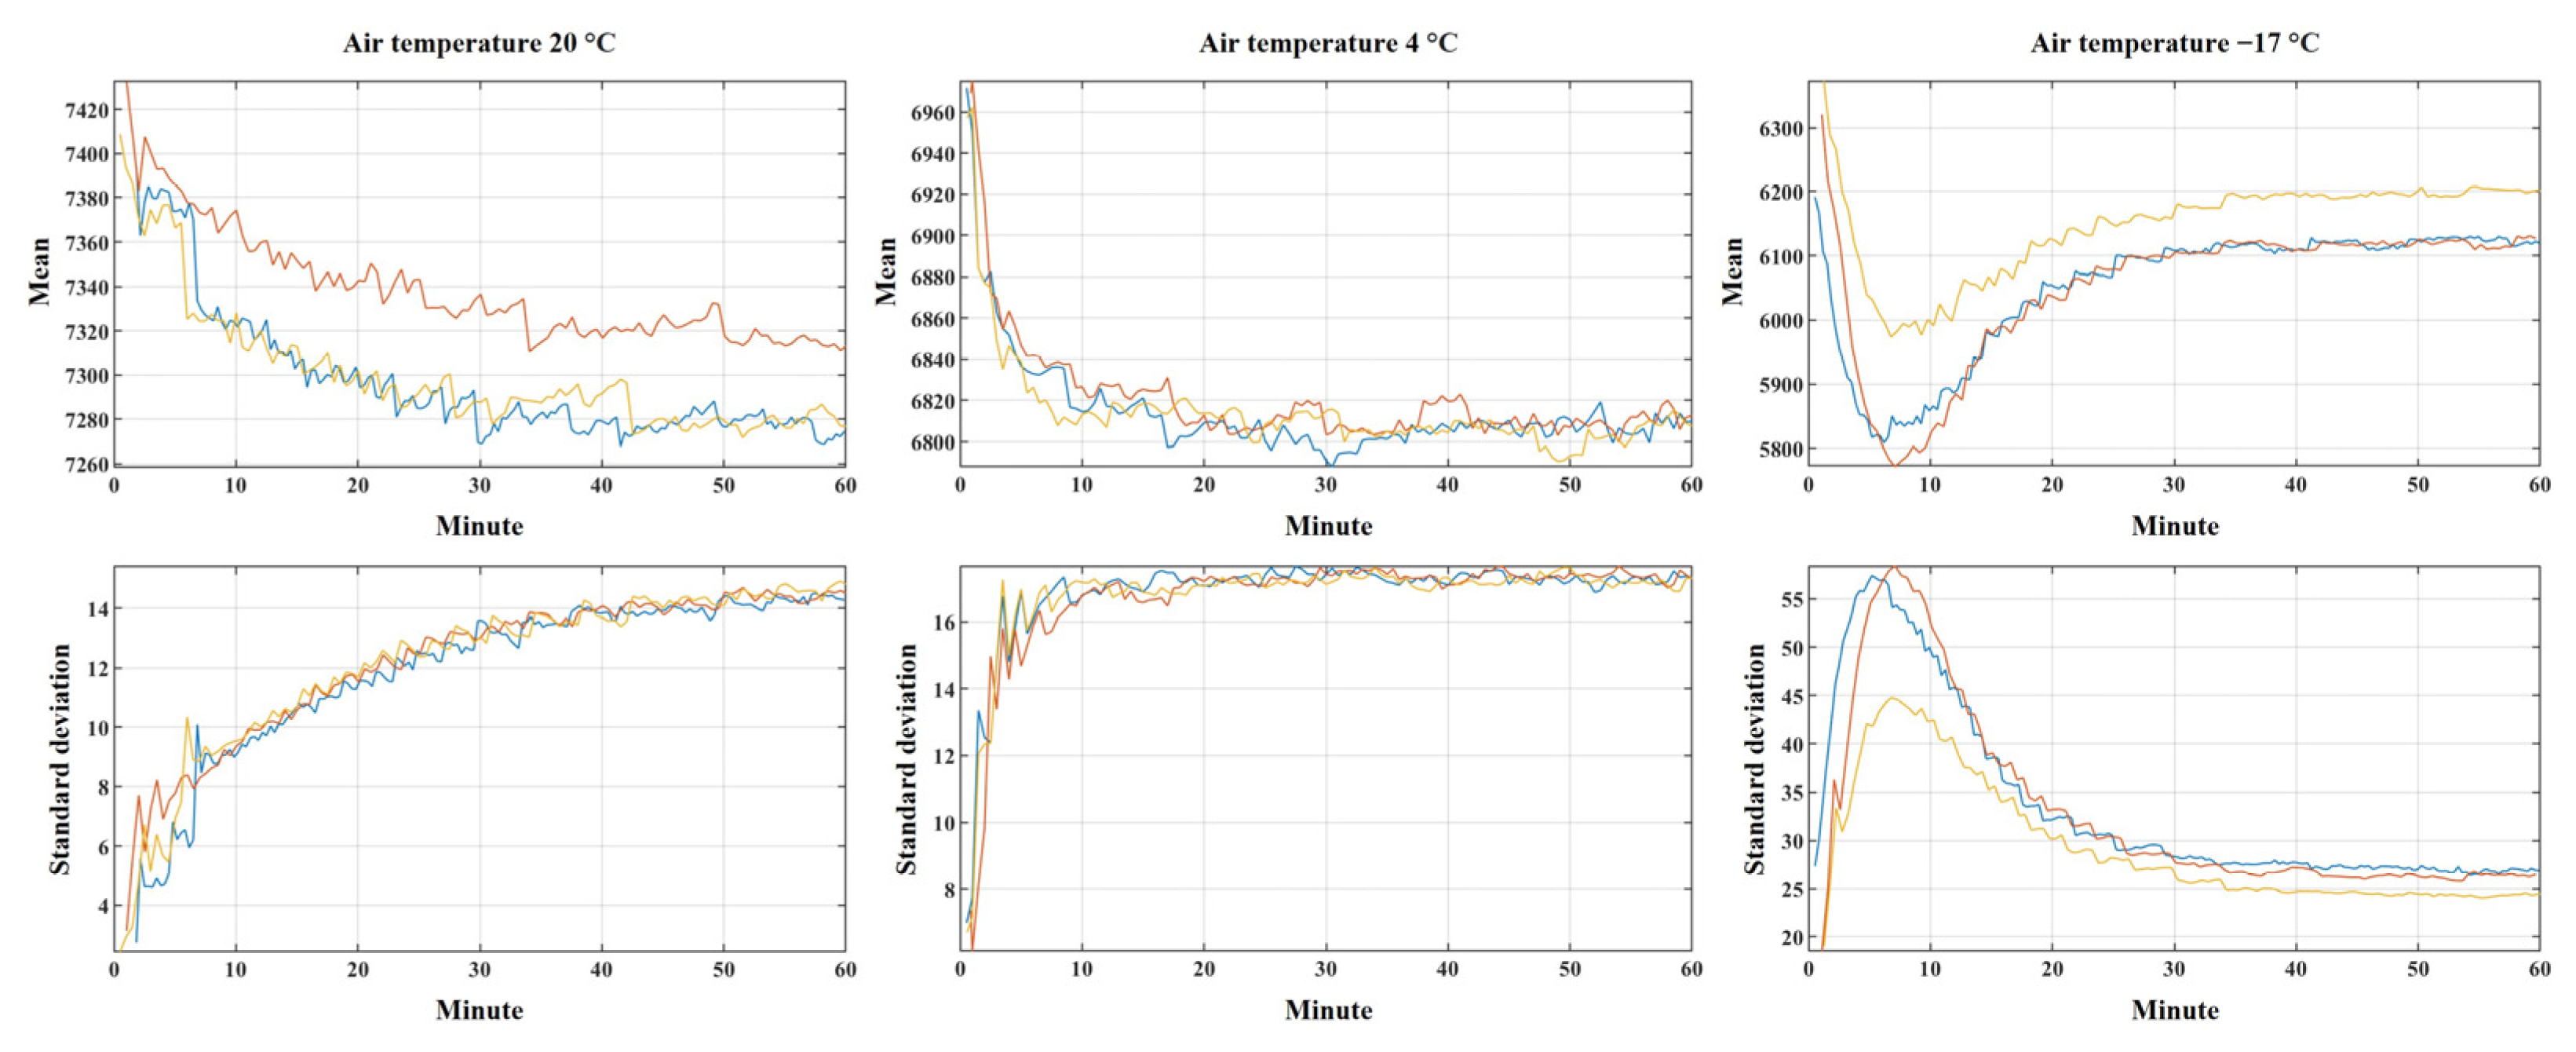
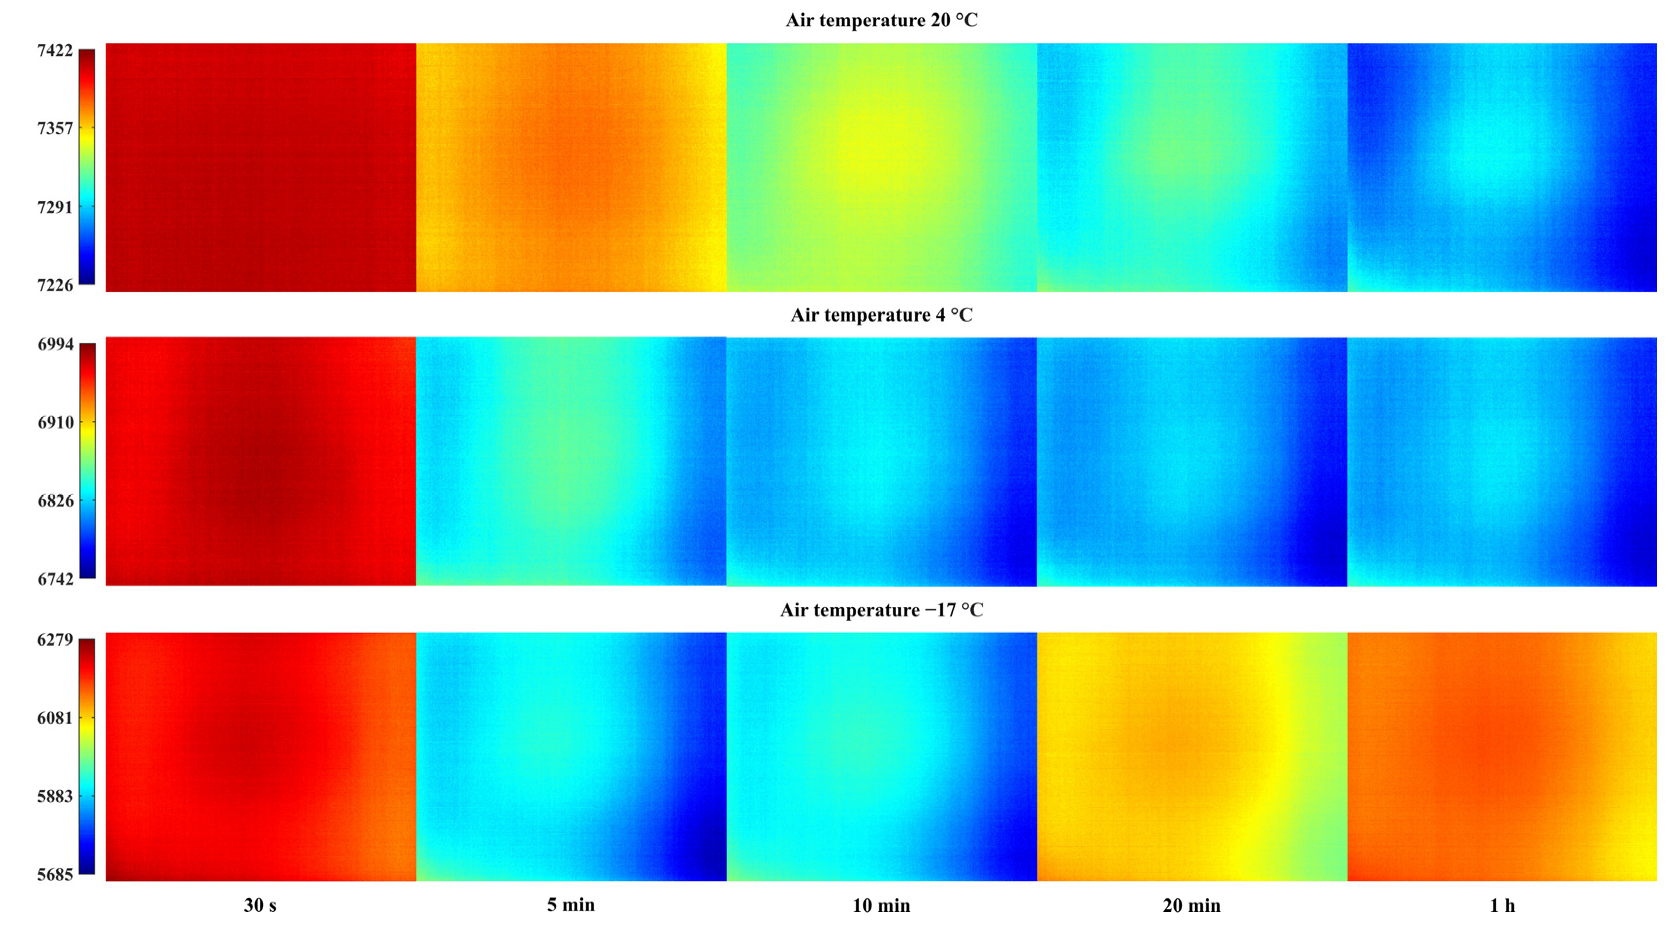
3.2. Warmup Experiments

3.2.1. XT2 during Stabilization

Our results clearly indicated that a warmup period is vital for XT2. During the first 40 to 60 min depending on the ambient temperature, the IIMNs and IISDs of XT2 changed substantially (Figure 6), which ideally should not occur since the calibration target temperature never changed during the experiments. Considering both IIMN and IISD, it took XT2 about 60 min under 20 °C, 20 min under 4 °C, and 40 min under −17 °C to fully stabilize. Low ambient temperature seemed to help with speeding up camera stabilization since the rates of change for both IIMN and IISD in the initial 5 min camera warmup became larger as ambient temperature decreased. However, too low an ambient temperature such as −17 °C seemed to “overhelp” camera stabilization, as valleys of IIMN and peaks of IISD formed after a 5 to 8 min warmup (Figure 6). From a practical standpoint, warming up thermal cameras on the ground would be good practice if no relative movement between air and camera exists during flight missions since it helps avoid the initial erratic camera measurements after power-up and should only minimally affect UAV battery life. Unfortunately, UAV propellers and UAV movement will inevitably cause airflow around thermal cameras, and as is shown in Section 3.3, wind can disrupt camera thermal equilibrium. To achieve the best camera performance in the air, precautions still need to be taken to counter the thermal camera instability after UAV takeoff.
The stabilized IIMNs were always lower than the initial values, indicating XT2 tended to overestimate object temperatures during its early warmup periods. The stabilized IISDs were always higher than the initial values, indicating XT2 vignetting grew stronger with time. As shown in Figure 7, vignetting was nearly nonexistent at the beginning of the warmup experiments. It is well known that different types of vignetting are characteristic of any optical systems, such as mechanical vignetting, optical vignetting, natural vignetting, and sometimes pixel vignetting [35]. Aperture radiation blocking, angle, distance, and misalignment between the sensor and lens, and lens radiation refraction have been used to explain vignetting in thermal cameras [13]. In the case of XT2, we believe thermal drift is the primary reason for camera vignetting considering the varying vignetting pattern with camera warmup time and ambient temperature.
XT2 vignetting severity became worse as ambient temperature decreased. The stabilized IISD levels were approximately 14 under 20 °C, 17 under 4 °C, and 27 under −17 °C. While under each ambient temperature condition all three of the IISDs were relatively similar, the stabilized IIMNs were not always the same. Under 20 °C, the stabilized IIMN of one experiment was roughly larger than the other two by 40, while under −17 °C the same phenomenon was observed and the difference was roughly 100 (Figure 6). This camera behavior inconsistency might be caused by two reasons, namely environmental temperature difference and XT2 hardware and firmware irregularity. Further research is still needed to determine the true cause. If XT2 is the issue source, in-field radiometric calibration is unfortunately required for every data collection event as the phenomenon is unpredictable.
Assuming the stabilized IIMNs of the 20 °C, 4 °C, and −17 °C experiments were 7300, 6810, and 6150 (Figure 6), respectively, we observed that based on the individual calibrated radiometric relationships (Figure 5), the corresponding temperatures were 21.29 °C, 3.55 °C, −28.55 °C, respectively, which ideally should be 20 °C, 4 °C and −17 °C. We consider the deviations for the 20 °C and 4 °C experiments likely came from radiometric calibration errors and environmental temperature fluctuation. The large deviation for the −17 °C experiments showed that the radiometric relationship was no longer applicable to very low scene temperatures, disproving the validity of the linear microbolometer response assumption for a wide temperature range as we mentioned in the Introduction. This result indicated the necessity of conducting dedicated radiometric calibrations for extreme temperature ranges when using UAV-based thermal cameras for low or high temperature monitoring.
Figure 8 shows the pixel-wise statistics at each pixel location during the first hour of one of the warmup experiments under 20 °C, 4 °C, and −17 °C ambient temperature conditions, which allows the visualization of individual pixel behaviors relative to each other during the warmup periods. Under the same ambient temperature, the maximum, median, and minimum values of a pixel location tended to be in the similar scales relative to other pixels during the first hour of camera warmup. For example, if a pixel’s maximum value is in the upper quartile relative to other pixels (e.g., “hot” or reddish pixels in the PWMA images), its median and minimum values also tend to be in the upper quartile ranges (e.g., hot pixels in the PWMM and PWMI images). The same also held true for “cold” or blueish pixels. Relative to other pixels under different ambient temperatures, the behaviors of each pixel were not always consistent. For example, a pixel might have a median value in the lower quartile under 20 °C but a median value in the upper quartile under −17 °C. At the same time, certain pixels such as the ones located at the center, lower left corner, and lower right corner of XT2 had consistent behaviors regardless of ambient temperature.
As ambient temperature decreased, the outputs of individual pixels experienced larger fluctuations during the warmup experiments, stressing the importance of camera stabilization for accurate temperature measurements. Using the most extreme cases as examples, the differences between the largest PWMA and smallest PWMI during the first hour of camera warmup under 20 °C, 4 °C, and −17 °C ambient temperature conditions corresponded to 6.47 °C, 12.11 °C, and 27.68 °C, respectively, which suggested that camera instability during warmup as well as vignetting are the major measurement error sources of XT2. An interesting observation was that under each ambient temperature condition, hot pixels in the PWMA, PWMM, and PWMI images usually had lower ranges, or more stable performances than cold pixels during the warmup experiments. Nevertheless, during the first hour of warming up XT2 under 20 °C, 4 °C, and −17 °C ambient temperature conditions, even the most stable pixels had corresponding temperature changes of 1.89 °C, 6.73 °C, and 14.31 °C, respectively, while the least stable pixels had corresponding temperature changes of 4.89 °C, 10.92 °C, and 22.91 °C, respectively.

3.2.2. XT2 after Stabilization

No apparent fluctuation differences for either IIMN or IISD were observed in the second hour of the three two-hour warmup experiments (Figure 9). The narrow fluctuation range of IISD also indicated that once XT2 was stabilized, its vignetting severity only had minimal changes in between images. We conclude that ambient temperature does not affect the stability of XT2 after it reaches thermal equilibrium under a static environment.
Figure 10 shows the PWMNs of the calibration target images collected in the second hour of the three two-hour warmup experiments, which represents the stabilized vignetting patterns of XT2 under different ambient temperature conditions. In terms of pixel values, lower ambient temperatures led to higher intra-image pixel variation. For example, the corresponding temperature variations within the 20 °C, 4 °C, and −17 °C images in Figure 10 are 3.79 °C, 4.27 °C, and 5.90 °C, respectively. The decreasing vignetting severity with ambient temperature implied that uncooled thermal camera applications in tropical regions may experience less interference from vignetting than temperate and polar regions. The different vignetting patterns also suggested that a universal vignetting correction will likely fail under different ambient temperature conditions. In that sense, vignetting correction should either take ambient temperature into consideration, or be performed specifically for individual UAV flight missions, although the vignetting difference between flights under the same ambient temperature is likely to be minor.

3.2.3. Duo R

The warmup experiment of Duo R confirmed the observations from XT2 in terms of camera instability during warmup, vignetting presence, varying vignetting pattern with time, and individual pixel behavior inconsistency. It took about 40 min for Duo R to stabilize under 20 °C (Figure 11). During this period, Duo R had similar behaviors to XT2 such that the IIMN decreased and the IISD increased considerably with time. As camera instability upon power-up has also been observed in previous studies [13,36], it is likely a universal issue for many uncooled thermal cameras, which is generally not discussed by manufacturers. We believe minimal and optimal camera warmup times in the user manuals and datasheets of radiometric thermal camera products would be a piece of valuable information to consumers.
Similar to XT2, the vignetting severity of Duo R was also minor at the beginning of the warmup and increased with time. Note that during 14 to 18 min and 27 to 28 min of the experiment, apparent horizontal line artifacts appeared in the images (Figure 12), which were never observed in XT2. Although strong vignetting also existed in Duo R, the vignetting patterns of Duo R and XT2 were completely different, implying every thermal camera likely has its own unique vignetting pattern and would require dedicated calibrations for correction.
Regarding individual pixel behaviors, many similarities also existed between XT2 and Duo R. Hot and cold pixels still tended to be at the same locations across the PWMA, PWMM, and PWMI images (Figure 13). Again, hot pixels in those images tended to have lower ranges than cold pixels, meaning a more stable performance during the camera warmup period. According to the user guide from FLIR, a 260 to 530 pixel value change in Duo R represents a 2.6 to 5.3 °C temperature change, which is slightly higher than XT2’s 1.89 to 4.89 °C temperature change during warmup under the same ambient temperature condition. This implies Duo R’s initial measurements after power-up were more erratic than XT2’s. The observations from Duo R confirmed that the vignetting in XT2 was not due to sensor detects, but rather a characteristic issue of UAV-based uncooled thermal cameras, which unfortunately has yet to receive enough attention from the UAV research community.

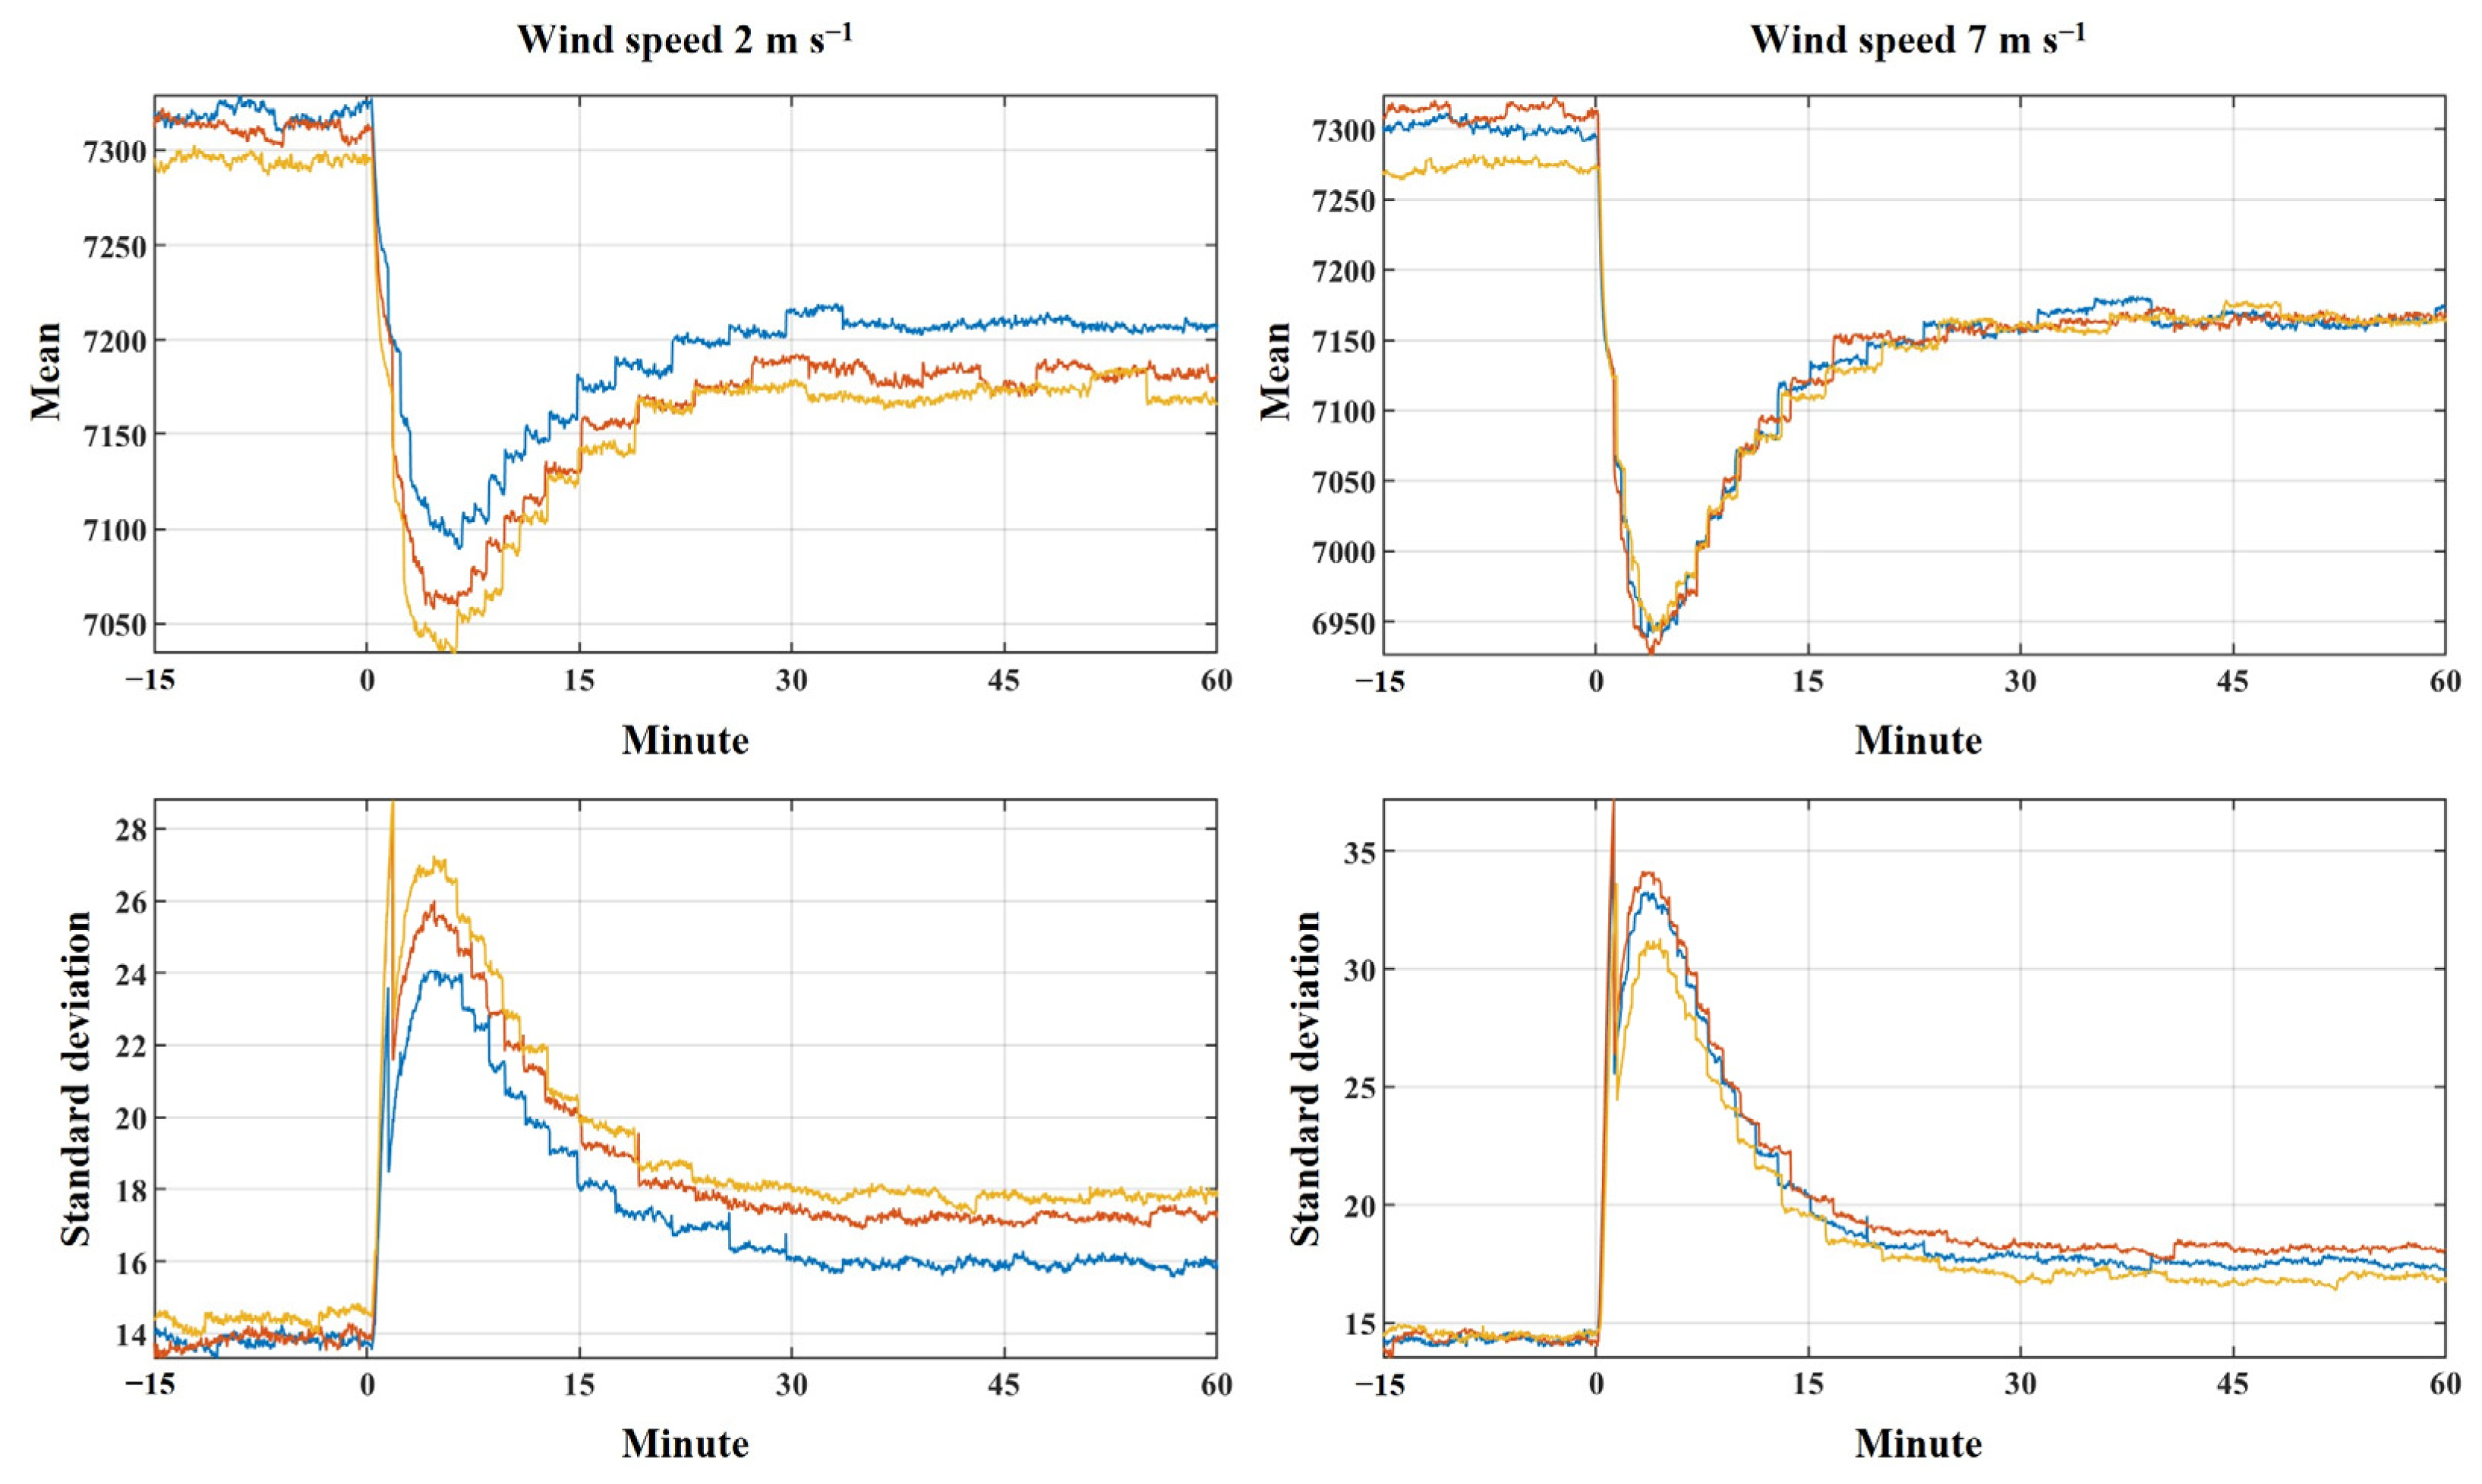
3.3. Wind Experiments

3.3.1. Influence on Vignetting Severity

Figure 14 shows how the IIMN and IISD of the calibration target images changed after wind was supplied to the stabilized XT2. Both wind speeds disturbed the thermal equilibrium of XT2 substantially, and the initial disturbance became larger as wind speed increased, although XT2 eventually stabilized to similar levels of IIMN and IISD. Comparing XT2’s equilibriums before and after wind supply, both wind speeds roughly decreased the IIMN by 125 or 5.51 °C and increased the IISD by 3, indicating underestimated scene temperatures and slightly stronger vignetting are associated with wind presence. Interestingly, Kelly et al. [13] observed their Vue Pro 640 stabilized to higher IIMN levels after 2 m s−1 and 3.3 m s−1 winds were supplied. Wind speed did not change the time required for XT2 to regain its thermal equilibrium after wind was supplied, which was about 30 min. The large fluctuations of IIMN and IISD of XT2 caused by wind imply that even if UAV-based uncooled thermal cameras stabilize on the ground, they can still undergo another unstable period after UAV takeoff due to the airflow around cameras. Therefore, without proper precautions, collecting thermal images right after a UAV takes off does not seem to be good practice. To stabilize thermal cameras to similar wind conditions during data collection, using a portable fan to assist camera warmup on the ground and directly warming up thermal cameras in the air using a spare set of UAV batteries are two potential solutions.
During the wind experiments, we again observed the different stabilized IIMN and IISD levels both before and after wind was supplied, whose cause is still unclear as discussed in Section 3.2.1. Combining Figure 6 and Figure 14, higher stabilized IIMNs generally corresponded to lower stabilized IISDs, which was also consistent with the observation in the warmup experiments that higher ambient temperatures led to weaker vignetting. This potentially implies that current uncooled thermal camera technologies have better performances under high ambient temperatures but can suffer more from vignetting under low ambient temperatures.

3.3.2. Influence on Vignetting Pattern

Wind speed and wind direction made virtually no difference on XT2’s vignetting pattern in this study as shown in Figure 15. We suspect the two wind speeds from both directions caused similar levels of wind chill to XT2; hence, the vignetting patterns appeared to be similar. Fundamentally, it is thermal drift or camera temperature variation that affects vignetting pattern and severity, while wind is only a factor that influences camera temperature. Comparing the images in Figure 15 with the 20 °C image in Figure 10, which have corresponding intra-image pixel variations of 3.96 to 4.23 °C and 3.79 °C, a noticeable vignetting pattern difference can be observed. This result indicates that wind did not affect all pixels of XT2 equally, and it is necessary to stabilize UAV-based uncooled thermal cameras under the presence of propeller slipstream or similar wind conditions before conducting vignetting correction.
Considering the effects of wind and ambient temperature on XT2 vignetting, although the two factors cannot be directly compared since they have different units, ambient temperature seems to be a more influential variable in practice. Most commercial UAVs can be operated under a wide range of ambient temperatures, which can lead to distinct thermal camera vignetting patterns (Figure 10). On the other hand, due to UAVs’ inherent limitation, UAV flights can only be conducted below a certain wind speed. While a 7 m s−1 wind is already approaching some UAVs’ maximum wind resistance capacity, it only increased intra-image pixel variation of XT2 by 0.26 to 0.44 °C when compared to the no wind condition (Figure 10 and Figure 15). Moreover, propellers are likely to be a much stronger and more persistent wind source than outdoor environments. Based on our in-field measurements, the propeller slipstream speed of DJI M200 V2 can reach approximately 10 m s−1. We believe the addition of a slow natural wind to a propeller slipstream will have little to no impact on UAV-based uncooled thermal camera vignetting (Figure 15). However, we do expect wind to cause greater wind chill to thermal cameras under lower ambient temperatures. Based on the observations in the study, during a regular UAV flight mission, we consider wind would only result in minor thermal camera vignetting severity and pattern changes, after a camera has reached thermal equilibrium under the presence of a propeller slipstream.

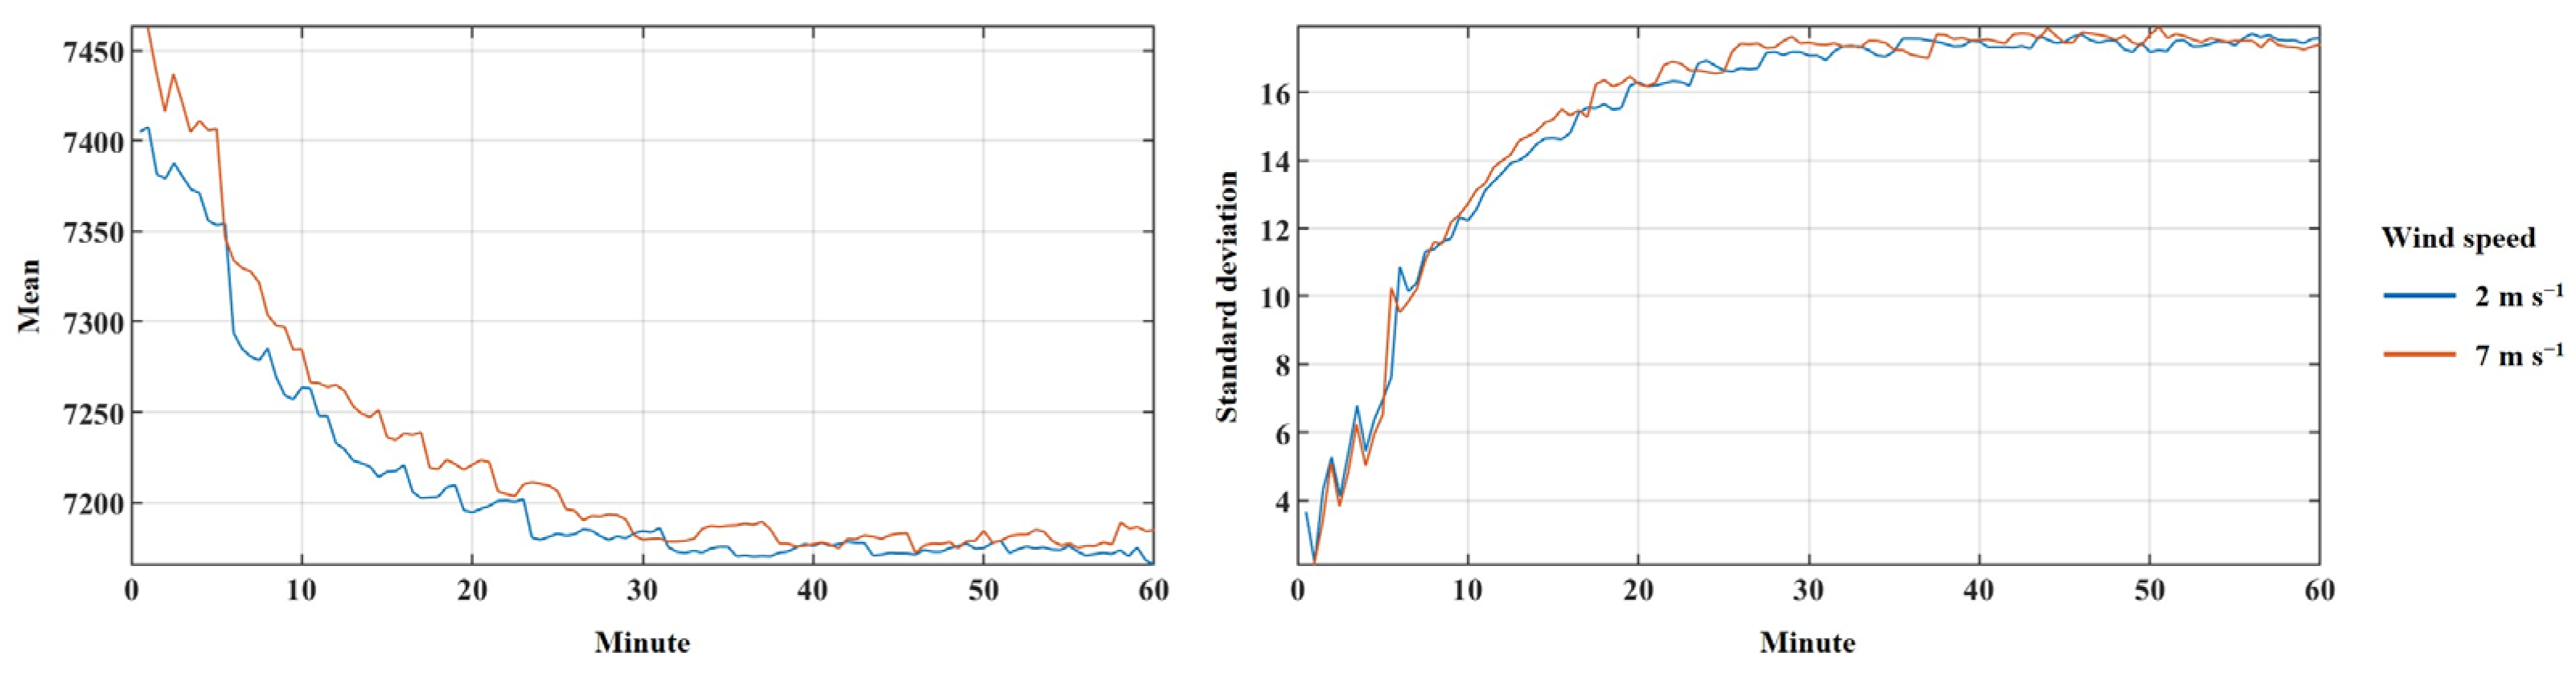
3.3.3. Influence on Warmup

Our experiment indicated that wind presence was able to shorten XT2 warmup time by almost 50%. Under 20 °C, it took XT2 about an hour to reach thermal equilibrium after power-up (Figure 6), while with both 2 m s−1 and 7 m s−1 winds, it only took XT2 about half an hour to stabilize (Figure 16), which is similar to the stabilization time after XT2 was disturbed by wind (Figure 14). Again, wind speed did not make a difference in XT2’s required warmup time. Considering the camera instability upon power-up (Figure 6, Figure 11 and Figure 16) and after UAV takeoff (Figure 14), as well as the associated vignetting pattern changes, supplying wind during thermal camera warmup, either by using a fan or hovering a UAV, seems to be not only necessary for accurate and stable camera measurements, but also advantageous because it shortens the required camera warmup time.

3.4. Field Experiments

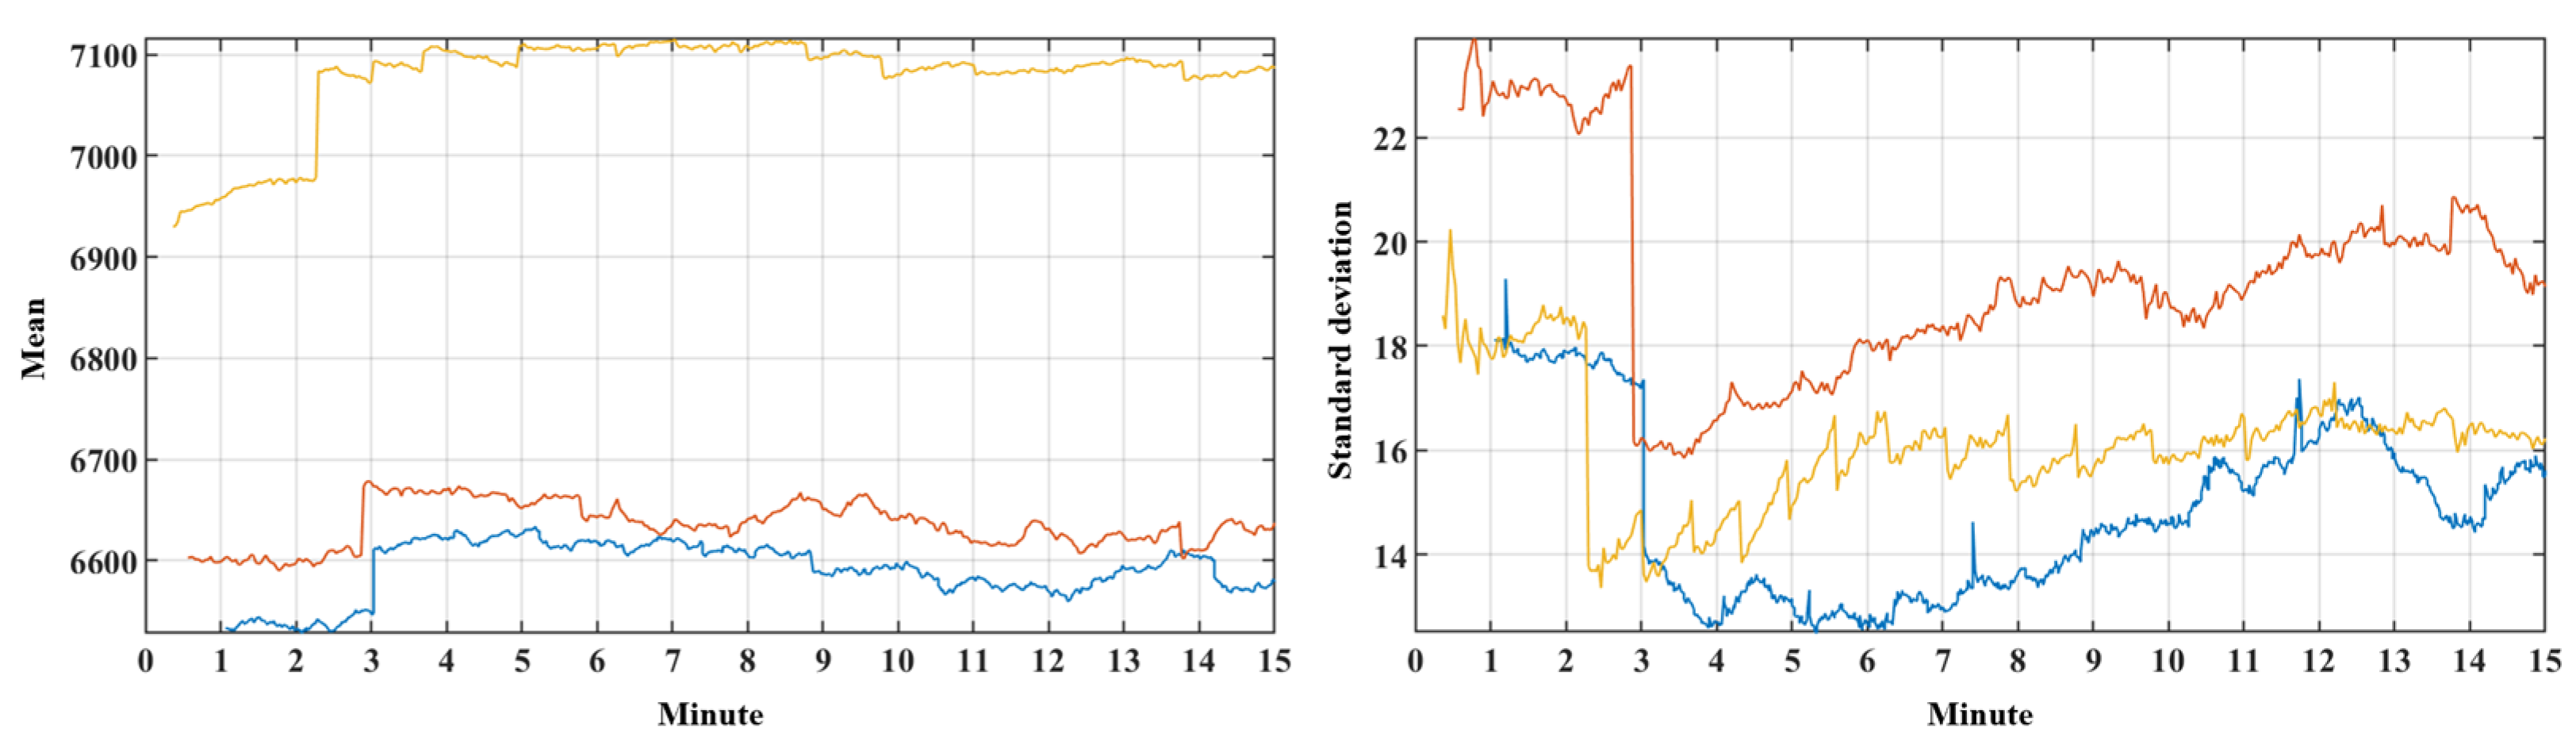
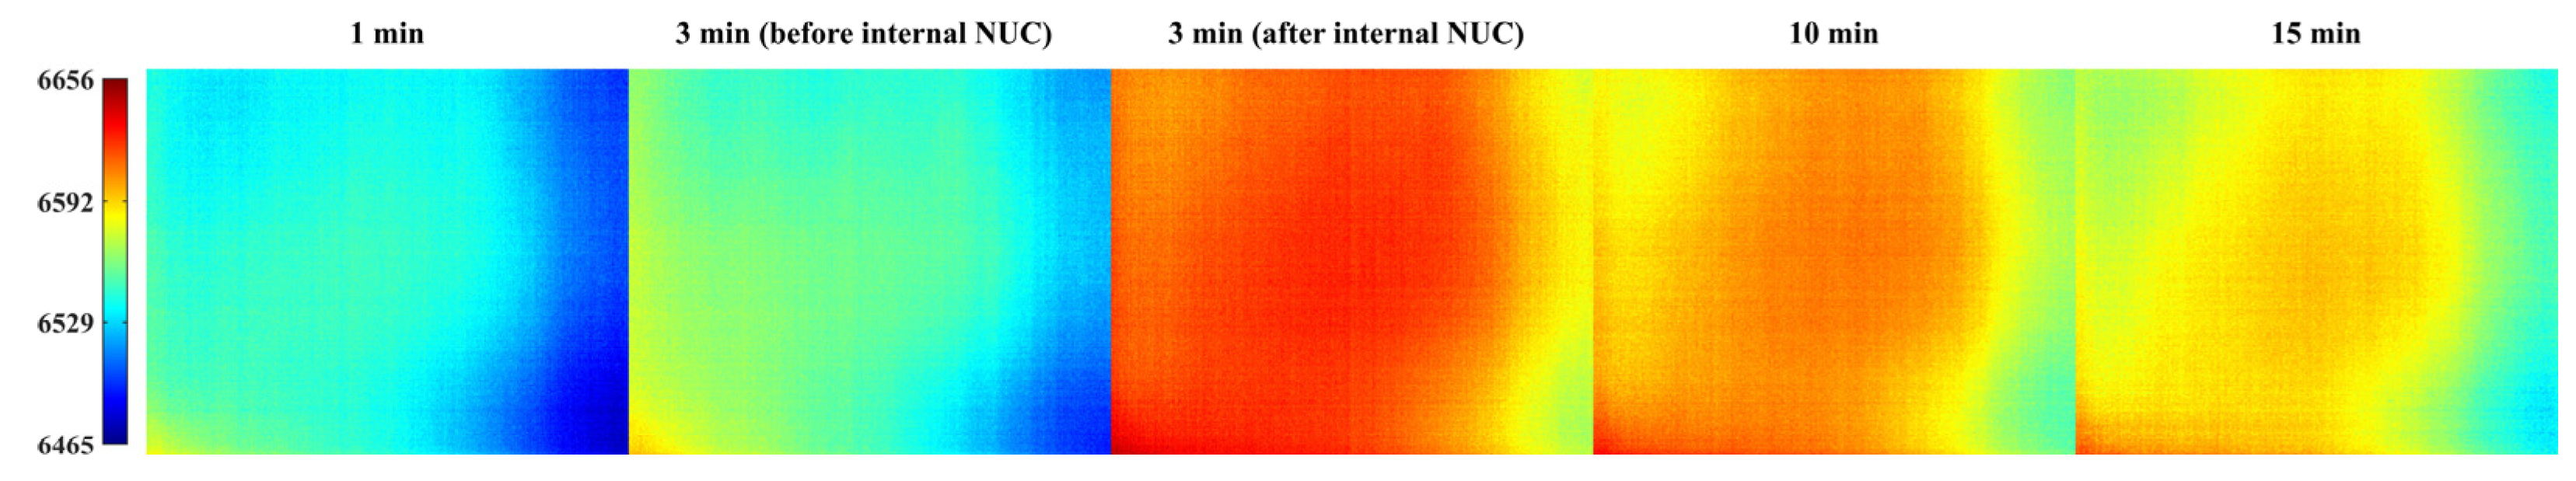
3.4.1. Time Window for Vignetting Correction Image Collection

As shown in Figure 17, for all three field tests, a sudden increase in IIMN and a decrease in IISD of the calibration target images in the first 2 to 3 min after UAV landing were observed. The sudden changes were likely due to XT2’s firmware, which might have made XT2 perform an NUC using its built-in shutter. This phenomenon can also be observed in Figure 14, where the decreases in IIMNs and increases in IISDs have stair-like shapes. For both IIMN and IISD, their fluctuations during the field experiments were larger and more irregular than the indoor experiments, indicating the changeable nature of outdoor environments.
While the internal NUC was able to reduce vignetting by a considerable amount, it unfortunately also changed XT2’s vignetting pattern (Figure 18), which, after the internal NUC, no longer resembled the vignetting pattern in the air. Moreover, even in the first 3 min after UAV landing, a minor vignetting pattern difference could be observed (Figure 18). Hence, vignetting correction images captured at a closer time point to UAV landing would be more effective for mitigating vignetting in images captured during a flight mission, whose collection time window is within 3 min after UAV landing in the case of XT2.

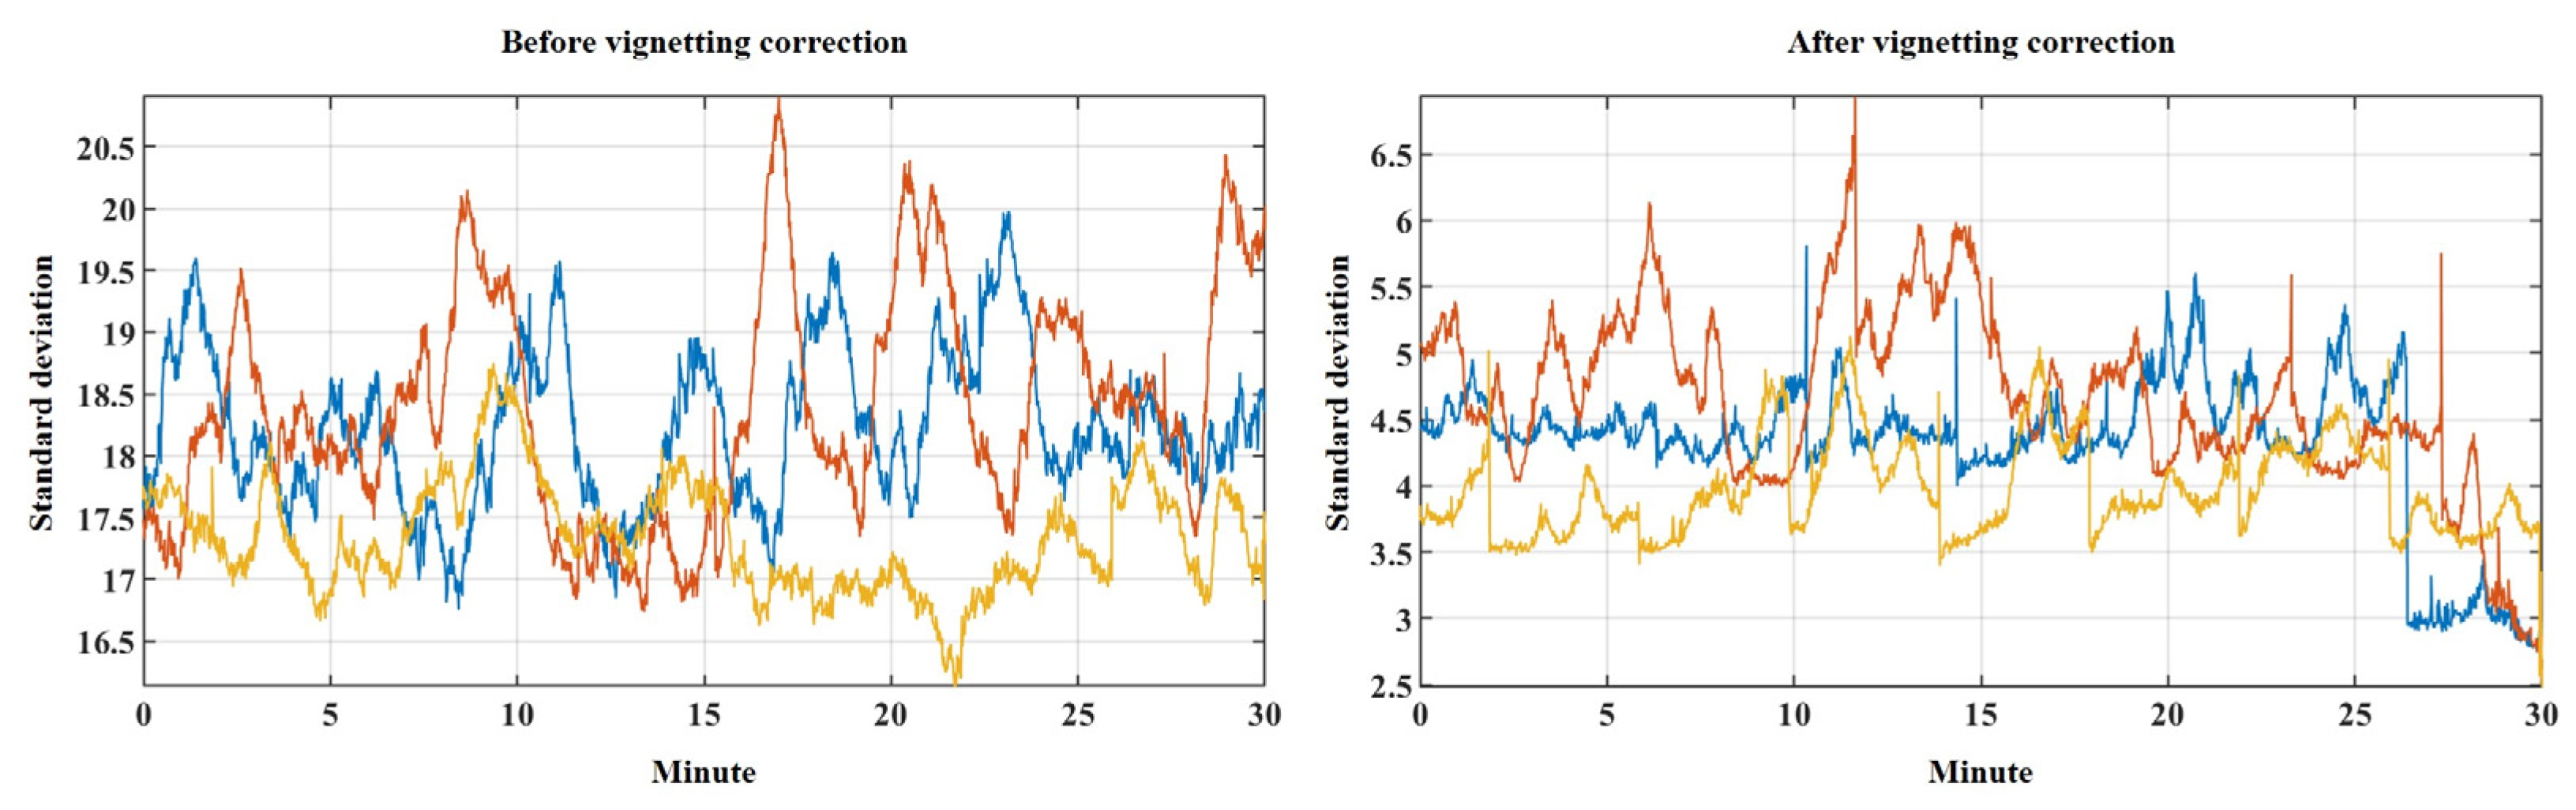
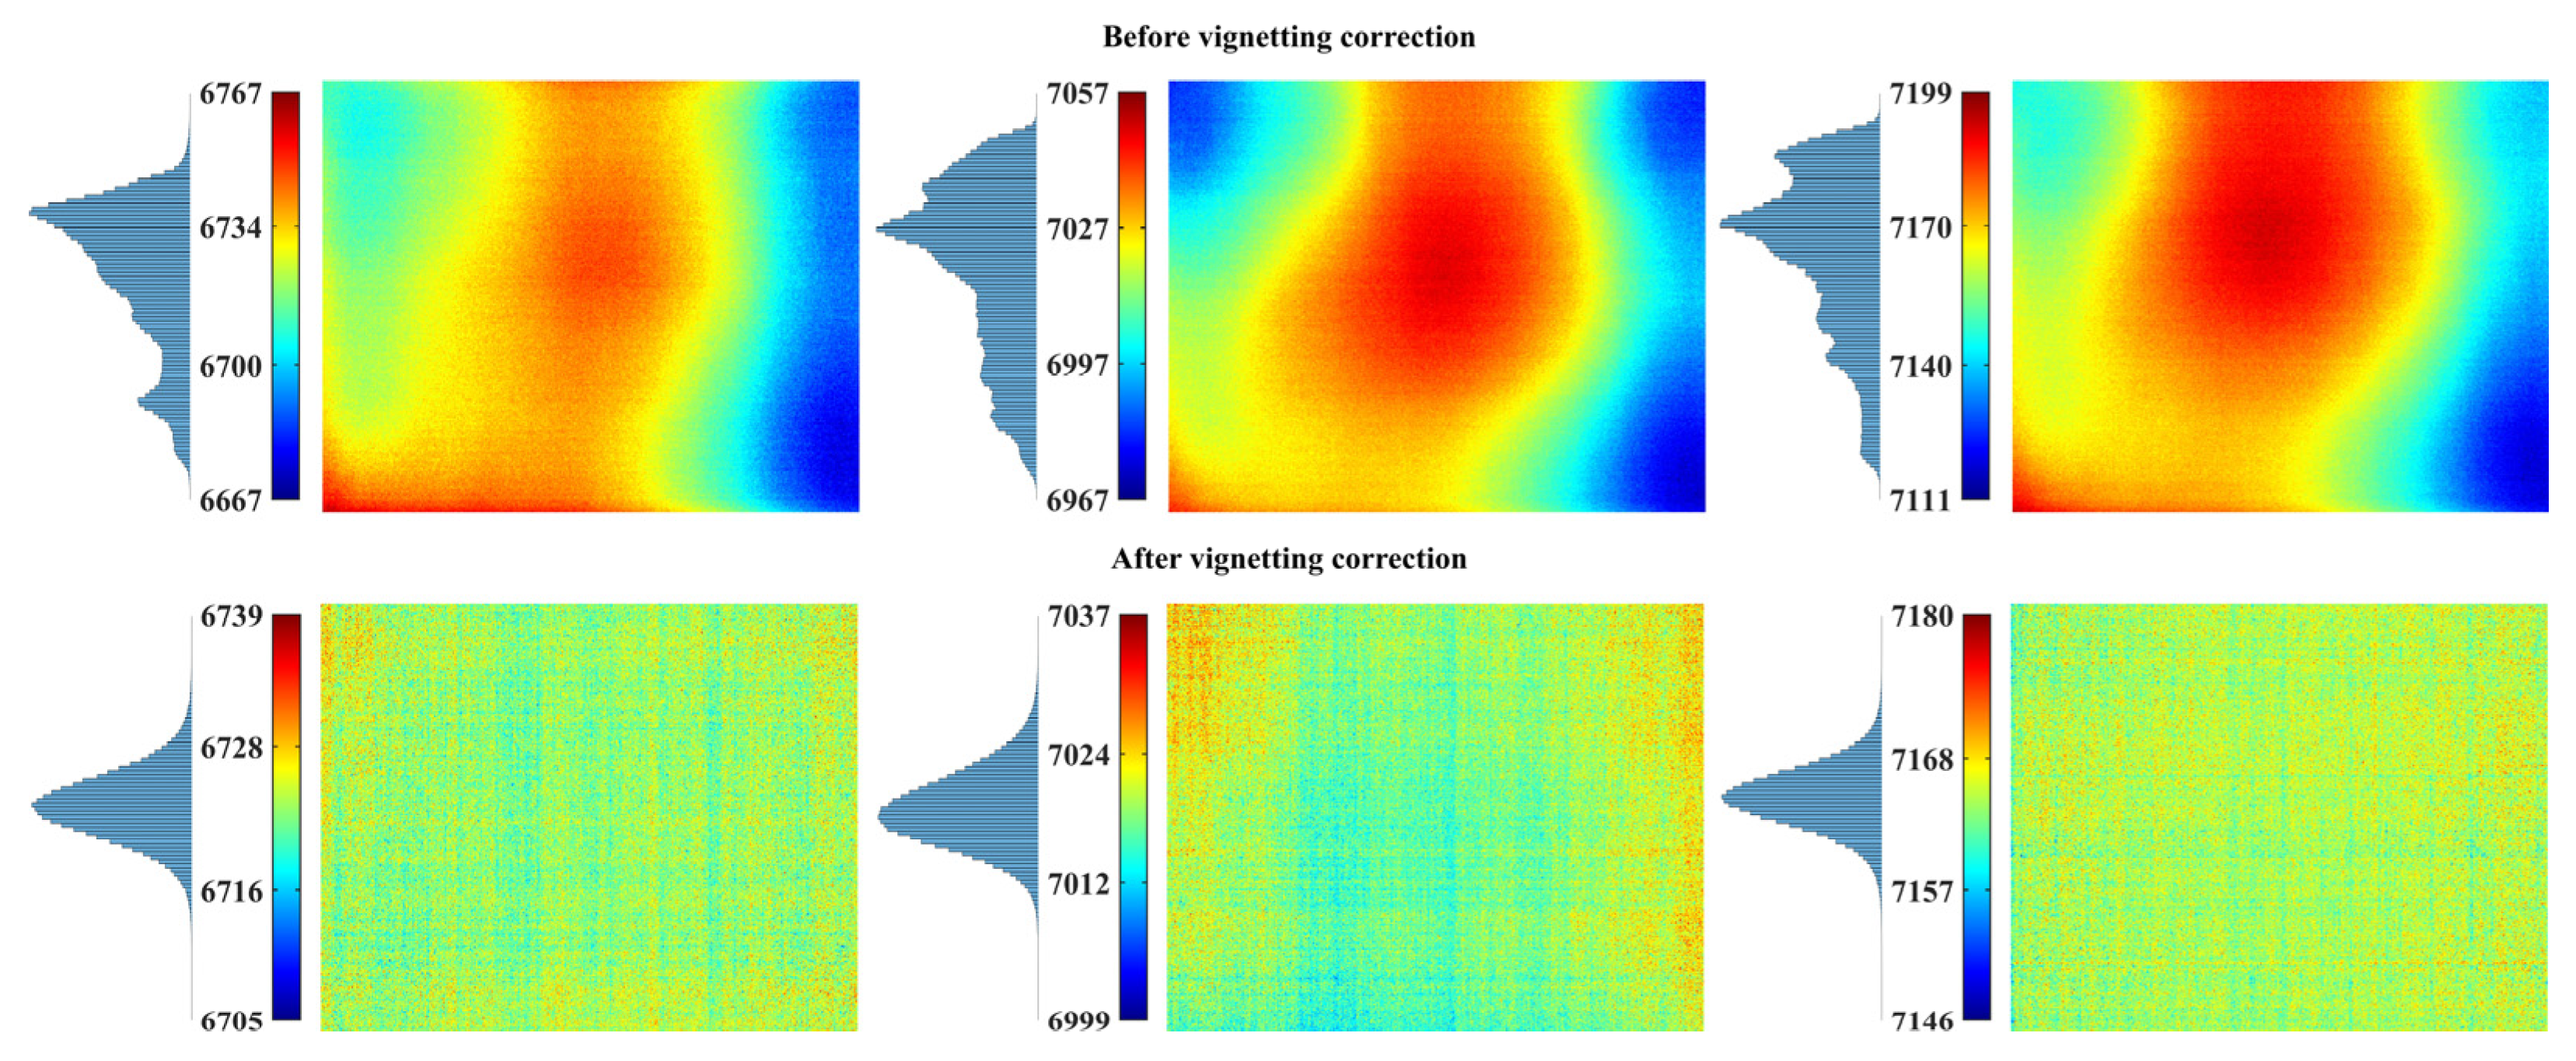
3.4.2. Vignetting Mitigation Results

Our proposed vignetting mitigation method was proven to be effective despite being simple. As shown in Figure 19, for all three experiments, the IISDs of the calibration target images captured by XT2 after warmup fluctuated mostly in the range of 17 and 20 before vignetting correction, which was reduced substantially to 3.5 to 5.5 after vignetting correction by approximately a 70% to 80% reduction. Note the IISD fluctuation range during the field experiments (Figure 19) was higher than the ones during the indoor experiments (Figure 9), indicating that field environments were constantly changing and affected XT2’s stability. We also observed that the efficacy of our vignetting mitigation method was the highest near the end of all three field experiments. For example, the IISDs after vignetting correction all dropped to about 2.5 at the 30 min time point of the experiments, which was the lowest IISD level during the experiments (Figure 19). This phenomenon shows that the vignetting pattern of XT2 was likely changing along with the environment during the field experiments; hence, the calibration target images captured at closer time points possessed more similar vignetting patterns. Ideally, vignetting correction should be performed as frequently as possible if it does not interfere with data collection. The working principle of periodically introduced shutter-based NUC in commercial uncooled thermal cameras also follows this notion. While equipping thermal cameras with customized external shutters and performing NUC periodically should theoretically achieve better vignetting correction results, it unfortunately will also be significantly more complicated than our proposed method in terms of hardware development and integration and require dedicated future studies.
A more direct visualization of our vignetting mitigation results is shown in Figure 20, where the PWMNs of the calibration target images before and after vignetting correction were calculated. Although the vignetting patterns of XT2 likely changed marginally and continuously throughout the half-hour field experiments due to environmental condition variation, individual pixel behaviors of XT2 relative to each other were still generally consistent (Figure 20). Similar to the indoor experiments (Figure 10), apparent vignetting pattern differences were also observed in between the three field experiments when ambient temperatures ranged approximately from 0 to 20 °C. Before vignetting correction, the PWMN difference between individual pixels mostly varied in a range of 80 or 3.44 °C, which sharply dropped to 20 or 0.86 °C after vignetting correction by a 75% reduction (Figure 20). Additionally, before vignetting correction, the PWMN distributions were irregular and skewed, and had large numbers of extreme values, while after vignetting correction, the PWMNs followed almost perfect normal distributions.
Vignetting mainly affects two aspects regarding thermal camera usage: temperature measurement accuracy and orthomosaic stitching. To ensure accurate temperature measurements, it is important to keep a consistent “standard” for both radiometric calibration and vignetting correction. For example, using centered vignetting correction images in the study allowed our radiometric calibrations to also be applicable for vignetting-corrected scene images, since IIMNs were our standard and subtracting centered vignetting correction images does not change scene image IIMNs. As we observed that hot pixels in PWMA, PWMM, or PWMI images generally have more stable performances than cold pixels (Figure 8 and Figure 13), using hot pixels in a vignetting correction image as the standard to correct for the rest of the pixels can be another approach. However, in that case, radiometric calibration should also be completed using only hot pixels, otherwise vignetting correction will lead to overestimated scene temperatures. Note that in the current literature, it is not uncommon for researchers to use only a section of thermal images for radiometric calibration [37,38,39,40,41].
For thermal images with low contrast or scene temperature variation, such as the ones captured at night or under cloudy conditions [41], vignetting can reduce image stitching accuracy and orthomosaic quality. In our experience, raw XT2 image quality often suffers in both indoor and outdoor environments due to vignetting whenever high scene temperature variation is absent, while our proposed vignetting mitigation method is able to greatly enhance thermal image contrast and improve intra-image pixel consistency under different environmental conditions (Figure 21). A critical assumption in this study was the linear microbolometer response to temperature; hence, for vignetting correction purposes, the calibration target temperature is irrelevant as long as the calibration target surface temperature is uniform and close to scene temperatures. However, for a large scene temperature range, the assumption will no longer hold true, as we discussed in Section 3.2.1.

3.5. Future Work

As demonstrated in the study, vignetting during initial uncooled thermal camera warmup varies significantly in terms of both severity and pattern; thus, long camera warmup periods imply delays to effective vignetting correction and usable camera measurements. Future studies might first focus on accelerating thermal camera warmup speeds to achieve faster camera internal thermal equilibrium. When large scene temperature variation is absent, camera temperature variation, as the fundamental driving factor for vignetting, can be a piece of valuable information for improving aerial thermal image quality. Future research might create vignetting correction images associated with specific camera temperature ranges in controlled indoor environments, and acquire camera temperature through either directly measuring onboard or indirectly estimating based on ambient temperature, humidity, and wind speed in outdoor environments. Such an approach would free researchers from constantly conducting vignetting calibration for different flight missions. As an extension of our proposed methodology, a miniature calibration target with thermal insulation can be integrated onto an uncooled thermal camera in the form of an external shutter; hence, NUC can be performed much more frequently even during UAV flights. Theoretically, the best vignetting correction results can be achieved by a dedicated NUC for every single captured thermal image. When large scene temperature variation is present, considering the nonlinear microbolometer response will be necessary for more accurate vignetting correction [33]. However, if extreme temperatures only need to be detected rather than measured, such as fire detection, pixels with extreme values in a scene image can be segmented out through thresholding and vignetting of the other pixels can still be corrected based on the linear microbolometer response assumption for better image contrast.

4. Conclusions

In current UAV-based uncooled thermal cameras, vignetting is a universal issue that can reduce temperature measurement accuracy and image quality substantially, despite the cameras performing shutter-based NUC automatically and periodically. Thermal camera vignetting severity and pattern are not static, but rather, change with camera temperature as well as factors that influence camera temperature such as camera warmup time, ambient temperature, and wind. Lower ambient temperature and wind presence were observed to associate with stronger vignetting, both of which would contribute to decreasing camera temperature. The study demonstrated that the influence of field condition variations during short periods on thermal camera vignetting could be minimal, and vignetting correction based on a single calibration target image was proven to be effective for datasets collected in half-hour durations. Based on the observations from XT2, to achieve a stable thermal camera performance practically, we recommend a 30 min camera warmup in the air using a spare set of UAV batteries. While it is desirable to capture a vignetting correction image as soon as a UAV lands, we advise vignetting correction images should be captured no later than 3 min after UAV landing to prevent the disturbance of thermal camera internal NUC on vignetting pattern and severity.

Author Contributions

Conceptualization, W.Y.; methodology, W.Y.; software, W.Y.; validation, W.Y.; formal analysis, W.Y.; investigation, W.Y. and W.H.; data curation, W.Y.; writing—original draft preparation, W.Y.; writing—review and editing, W.Y. and W.H.; visualization, W.Y. All authors have read and agreed to the published version of the manuscript.

Funding

This work was supported by the National Science Foundation and the USDA National Institute of Food and Agriculture under Accession #1018998 and Award #2019-67021-29224, and the USDA National Institute of Food and Agriculture Multistate Research under Project #PEN04653 and Accession #1016510.

Data Availability Statement

The data presented in this study are available on request from the corresponding author.

Acknowledgments

The authors would like to thank Maxfield T. Canto for assisting data collection.

Conflicts of Interest

The authors declare no conflict of interest.

References

  1. Gade, R.; Moeslund, T.B. Thermal cameras and applications: A survey. Mach. Vis. Appl. 2014, 25, 245–262. [Google Scholar] [CrossRef] [Green Version]
  2. Mesas-Carrascosa, F.-J.; Pérez-Porras, F.; de Larriva, J.E.M.; Frau, C.M.; Agüera-Vega, F.; Carvajal-Ramírez, F.; Martínez-Carricondo, P.; García-Ferrer, A. Drift correction of lightweight microbolometer thermal sensors on-board unmanned aerial vehicles. Remote Sens. 2018, 10, 65. [Google Scholar] [CrossRef] [Green Version]
  3. Messina, G.; Modica, G. Applications of UAV thermal imagery in precision agriculture: State of the art and future research outlook. Remote Sens. 2020, 12, 1491. [Google Scholar] [CrossRef]
  4. Rogalski, A. Progress in focal plane array technologies. Prog. Quantum Electron. 2012, 36, 342–473. [Google Scholar] [CrossRef]
  5. Olbrycht, R.; Więcek, B. New approach to thermal drift correction in microbolometer thermal cameras. Quant. Infrared Thermogr. J. 2015, 12, 184–195. [Google Scholar] [CrossRef]
  6. Michel, M.; Blaeser, S.; Zakizade, E.; Weyers, S.; Weiler, D. 6 µm Microbolometers for Uncooled Thermal Imaging. In Electro-Optical and Infrared Systems: Technology and Applications XVIII and Electro-Optical Remote Sensing XV; SPIE: Bellingham, WA, USA, 2021; Volume 1186605, pp. 1–5. [Google Scholar]
  7. Nascimento, V.M.; Silva, M.E.B.G.N.; Liu, S.; Manera, L.; Méchin, L.; Guillet, B. Optical and Electrical Characterizations of Uncooled Bolometers Based on LSMO Thin Films. Multidiscip. Digit. Publ. Inst. Proc. 2017, 1, 634. [Google Scholar]
  8. Olbrycht, R.; Wiecek, B.; De Mey, G. Thermal drift compensation method for microbolometer thermal cameras. Appl. Opt. 2012, 51, 1788–1794. [Google Scholar] [CrossRef]
  9. Çalik, R.C.; Tunali, E.; Ercan, B.; Oz, S. A study on Calibration Methods for Infrared Focal Plane Array Cameras. In Proceedings of the VISIGRAPP 2018—Proceedings of the 13th International Joint Conference on Computer Vision, Imaging and Computer Graphics Theory and Applications, Madeira, Portugal, 27–29 January 2018; Volume 4, pp. 219–226. [Google Scholar]
  10. Marcotte, F.; Tremblay, P.; Farley, V. Infrared Camera NUC and Calibration: Comparison of advanced methods. In Infrared Imaging Systems: Design, Analysis, Modeling, and Testing XXIV; SPIE: Bellingham, WA, USA, 2013; Volume 8706, pp. 17–26. [Google Scholar]
  11. Song, S.; Zhai, X. Research on non-uniformity correction based on blackbody calibration. In Proceedings of the 2020 IEEE 4th Information Technology, Networking, Electronic and Automation Control Conference (ITNEC), Chongqing, China, 12–14 June 2020; pp. 2146–2150. [Google Scholar]
  12. Zhou, H.-X.; Lai, R.; Liu, S.-Q.; Jiang, G. New improved nonuniformity correction for infrared focal plane arrays. Opt. Commun. 2005, 245, 49–53. [Google Scholar] [CrossRef]
  13. Kelly, J.; Kljun, N.; Olsson, P.-O.; Mihai, L.; Liljeblad, B.; Weslien, P.; Klemedtsson, L.; Eklundh, L. Challenges and best practices for deriving temperature data from an uncalibrated UAV thermal infrared camera. Remote Sens. 2019, 11, 567. [Google Scholar] [CrossRef] [Green Version]
  14. Cao, Y.; He, Z.; Yang, J.; Ye, X.; Cao, Y. A multi-scale non-uniformity correction method based on wavelet decomposition and guided filtering for uncooled long wave infrared camera. Signal Process. Image Commun. 2018, 60, 13–21. [Google Scholar] [CrossRef]
  15. Chang, S. Flat-field correction for high-throughput fluorescence microscopy. Opt. Eng. 2022, 61, 034107. [Google Scholar]
  16. Guan, J.; Lai, R.; Xiong, A.; Liu, Z.; Gu, L. Fixed pattern noise reduction for infrared images based on cascade residual attention CNN. Neurocomputing 2020, 377, 301–313. [Google Scholar] [CrossRef]
  17. Harris, J.G.; Chiang, Y.-M. Nonuniformity correction of infrared image sequences using the constant-statistics constraint. IEEE Trans. Image Process. 1999, 8, 1148–1151. [Google Scholar] [CrossRef] [PubMed] [Green Version]
  18. Chavez, A.J.; Vicencio, F.T. Acceleration algorithm for constant-statistics method applied to the nonuniformity correction of infrared sequences. Opto-Electron. Rev. 2015, 23, 118–121. [Google Scholar]
  19. Ratliff, B.M.; Hayat, M.M.; Hardie, R.C. An algebraic algorithm for nonuniformity correction in focal-plane arrays. J. Opt. Soc. Am. A 2002, 19, 1737–1747. [Google Scholar] [CrossRef]
  20. Torres, S.N.; Pezoa, J.E.; Hayat, M.M. Scene-based nonuniformity correction for focal plane arrays by the method of the inverse covariance form. Appl. Opt. 2003, 42, 5872–5881. [Google Scholar] [CrossRef] [Green Version]
  21. Qian, W.; Chen, Q.; Gu, G. Space low-pass and temporal high-pass nonuniformity correction algorithm. Opt. Rev. 2010, 17, 24–29. [Google Scholar] [CrossRef]
  22. Liang, Y.; Qin, H.; Wu, J.; Zeng, Q.; Zhou, H. Temporal high-pass filter non-uniformity correction based on guided bilateral filter for IRFPA. In Proceedings of the AOPC 2017, Optical Sensing and Imaging Technology and Applications, Beijing, China, 4–6 June 2017; p. 228. [Google Scholar]
  23. Zeng, J.; Sui, X.; Gao, H. Adaptive Image-Registration-Based Nonuniformity Correction Algorithm With Ghost Artifacts Eliminating for Infrared Focal Plane Arrays. IEEE Photonics J. 2015, 7, 6803016. [Google Scholar] [CrossRef]
  24. Scribner, D.A.; Sarkady, K.A.; Kruer, M.R.; Caulfield, J.T.; Hunt, J.D.; Colbert, M.; Descour, M. Adaptive Retina-Like Preprocessing for Imaging Detector Arrays. In Proceedings of the IEEE International Conference on Neural Networks, San Francisco, CA, USA, 28 March–1 April 1993; pp. 1955–1960. [Google Scholar]
  25. Chen, N.; Zhang, J.; Zhong, S.; Ji, Z.; Yao, L. Nonuniformity Correction for Variable-Integration-Time Infrared Camera. IEEE Photonics J. 2018, 10, 7801611. [Google Scholar] [CrossRef]
  26. He, Z.; Cao, Y.; Dong, Y.; Yang, J.; Cao, Y.; Tisse, C.-L. Single-image-based nonuniformity correction of uncooled long-wave infrared detectors: A deep-learning approach. Appl. Opt. 2018, 57, D155–D164. [Google Scholar] [CrossRef]
  27. Olbrycht, R.; Wiȩcek, B.; De Mey, G. New Approach to Thermal Drift and Gain Non-Uniformity Correction in Microbolometer Detectors. In Proceedings of the 17th International Workshop on Thermal Investigations of ICs and Systems (THERMINIC), Paris, France, 27–29 September 2011; pp. 27–30. [Google Scholar]
  28. Xu, R.; Li, C.; Bernardes, S. Development and testing of a uav-based multi-sensor system for plant phenotyping and precision agriculture. Remote Sens. 2021, 13, 3517. [Google Scholar] [CrossRef]
  29. Israel, M.; Reinhard, A. Detecting nests of lapwing birds with the aid of a small unmanned aerial vehicle with thermal camera. In Proceedings of the 2017 International Conference on Unmanned Aircraft Systems (ICUAS), Miami, FL, USA, 13–16 June 2017; pp. 1199–1207. [Google Scholar]
  30. Labbé, S.; Roux, B.; Bégué, A.; Lebourgeois, V.; Mallavan, B. An operational solution to acquire multispectral images with standard light cameras: Characterization and acquisition guidelines. In Proceedings of the ISPRS Work. Airborne Digit. Photogramm. Sens. Syst. 2007; pp. 1–6. [Google Scholar]
  31. Lin, D.; Maas, H.-G.; Westfeld, P.; Budzier, H.; Gerlach, G. An advanced radiometric calibration approach for uncooled thermal cameras. Photogramm. Rec. 2018, 33, 30–48. [Google Scholar] [CrossRef]
  32. Virtue, J.; Turner, D.; Williams, G.; Zeliadt, S.; McCabe, M.; Lucieer, A. Thermal sensor calibration for unmanned aerial systems using an external heated shutter. Drones 2021, 5, 119. [Google Scholar] [CrossRef]
  33. Aragon, B.; Johansen, K.; Parkes, S.; Malbeteau, Y.; Al-mashharawi, S.; Al-amoudi, T.; Andrade, C.F.; Turner, D.; Lucieer, A.; McCabe, M.F. A calibration procedure for field and uav-based uncooled thermal infrared instruments. Sensors 2020, 20, 3316. [Google Scholar] [CrossRef] [PubMed]
  34. Playà-Montmany, N.; Tattersall, G.J. Spot size, distance and emissivity errors in field applications of infrared thermography. Methods Ecol. Evol. 2021, 12, 828–840. [Google Scholar] [CrossRef]
  35. Emery, W.; Camps, A. Optical Imaging Systems; Elsevier: Amsterdam, The Netherlands, 2017; ISBN 9780128092545. [Google Scholar]
  36. Grgić, G.; Pušnik, I. Analysis of thermal imagers. Int. J. Thermophys. 2011, 32, 237–247. [Google Scholar] [CrossRef]
  37. Yang, Y.; Lee, X. Four-band thermal mosaicking: A new method to process infrared thermal imagery of urban landscapes from UAV flights. Remote Sens. 2019, 11, 1365. [Google Scholar] [CrossRef] [Green Version]
  38. Harvey, M.C.; Hare, D.K.; Hackman, A.; Davenport, G.; Haynes, A.B.; Helton, A.; Lane, J.J.W.; Briggs, M.A. Evaluation of stream and wetland restoration using UAS-based thermal infrared mapping. Water 2019, 11, 1568. [Google Scholar] [CrossRef] [Green Version]
  39. Byerlay, R.A.E.; Coates, C.; Aliabadi, A.A.; Kevan, P.G. In situ calibration of an uncooled thermal camera for the accurate quantification of flower and stem surface temperatures. Thermochim. Acta 2020, 693, 178779. [Google Scholar] [CrossRef]
  40. Han, Y.; Tarakey, B.A.; Hong, S.-J.; Kim, S.-Y.; Kim, E.; Lee, C.-H.; Kim, G. Calibration and Image Processing of Aerial Thermal Image for UAV Application in Crop Water Stress Estimation. J. Sens. 2021, 2021, 5537795. [Google Scholar] [CrossRef]
  41. Yuan, W.; Choi, D. UAV-Based Heating Requirement Determination for Frost Management in Apple Orchard. Remote Sens. 2021, 13, 273. [Google Scholar] [CrossRef]
Figure 1. The calibration target and thermometer inside the incubator used for DJI Zenmuse XT2 radiometric calibration.
Drones 06 00394 g001
Figure 2. The setup of warmup experiments for DJI Zenmuse XT2 (left) and FLIR Duo R (right) conducted in the 20 °C laboratory.
Drones 06 00394 g002
Figure 3. The setup of wind experiments for DJI Zenmuse XT2 using a small fan (left) and a large fan (right) conducted in the 20 °C laboratory.
Drones 06 00394 g003
Figure 4. Schematic diagram showing the vignetting mitigation procedure of a scene image.
Drones 06 00394 g004
Figure 5. Radiometric calibration results of DJI Zenmuse XT2 under different ambient temperature conditions.
Drones 06 00394 g005
Figure 6. Intra-image pixel means and standard deviations of the calibration target images captured by DJI Zenmuse XT2 in the first hour of the warmup experiments under different ambient temperature conditions.
Drones 06 00394 g006
Figure 7. Colorized sample calibration target images captured by DJI Zenmuse XT2 at different time points during one of the warmup experiments under different ambient temperature conditions.
Drones 06 00394 g007
Figure 8. Pixel-wise statistics of the calibration target images captured by DJI Zenmuse XT2 in the first hour of one of the warmup experiments under different ambient temperature conditions.
Drones 06 00394 g008
Figure 9. Centered intra-image pixel means and standard deviations of the calibration target images captured by DJI Zenmuse XT2 in the second hour of the warmup experiments under different ambient temperature conditions.
Drones 06 00394 g009
Figure 10. Pixel-wise means of the calibration target images captured by DJI Zenmuse XT2 in the second hour of the warmup experiments under different ambient temperature conditions.
Drones 06 00394 g010
Figure 11. Intra-image pixel means and standard deviations of the calibration target images captured by FLIR Duo R in the warmup experiment under 20 °C ambient temperature condition.
Drones 06 00394 g011
Figure 12. Colorized sample calibration target images captured by FLIR Duo R at different time points during the warmup experiment under 20 °C ambient temperature condition.
Drones 06 00394 g012
Figure 13. Pixel-wise statistics of the calibration target images captured by FLIR Duo R during the warmup experiment under 20 °C ambient temperature condition.
Drones 06 00394 g013
Figure 14. Intra-image pixel means and standard deviations of the calibration target images captured by DJI Zenmuse XT2 in the wind experiments under different wind speed conditions.
Drones 06 00394 g014
Figure 15. Pixel-wise means of the calibration target images captured in a 10 min window by DJI Zenmuse XT2 stabilized under different wind speed and direction conditions.
Drones 06 00394 g015
Figure 16. Intra-image pixel means and standard deviations of the calibration target images captured by DJI Zenmuse XT2 in the first hour of warmup under 20 °C ambient temperature and different wind speed conditions.
Drones 06 00394 g016
Figure 17. Intra-image pixel means and standard deviations of the calibration target images captured by DJI Zenmuse XT2 in the first 15 min after UAV landing during the field experiments.
Drones 06 00394 g017
Figure 18. Colorized sample calibration target images captured by DJI Zenmuse XT2 at different time points during a field experiment after UAV landing.
Drones 06 00394 g018
Figure 19. Intra-image pixel standard deviations of the raw and vignetting-corrected calibration target images captured by DJI Zenmuse XT2 in a 30 min window after camera warmup during the field experiments.
Drones 06 00394 g019
Figure 20. Pixel-wise means and pixel value histograms of the raw and vignetting-corrected calibration target images captured by DJI Zenmuse XT2 in a 30 min window after camera warmup during the field experiments.
Drones 06 00394 g020
Figure 21. Comparison of sample scene images before and after vignetting correction using our proposed method.
Drones 06 00394 g021
Table 1. Specifications of the two thermal cameras tested in the study.
AttributeDJI Zenmuse XT2FLIR Duo R
Size118.02 × 111.6 × 125.5 mm341 × 59 × 29.6 mm3
Weight588 g84 g
Thermal imagerUncooled VOx microbolometer
Resolution640 × 512160 × 120
Field of view (FOV)32° × 26°57° × 44°
Spectral band7.5–13.5 µm
Scene temperature rangeHigh gain −25–135 °C
low gain −40–550 °C
N/A
Accuracy±10 °C±5 °C
Operating temperature rangeN/A0–50 °C
Storage temperature rangeN/A−20–60 °C
Publisher’s Note: MDPI stays neutral with regard to jurisdictional claims in published maps and institutional affiliations.

