Article

ARSD: An Adaptive Region Selection Object Detection Framework for UAV Images

1
School of Information Engineering, Wuhan University of Technology, Wuhan 430070, China
2
Zmvision Technology, Wuhan 430070, China
3
College of Electronics and Information, South-Central Minzu University, Wuhan 430074, China
4
School of Mathematics & Statistics, South-Central Minzu University, Wuhan 430074, China
5
SAIC GM Wuling Automobile Co., Ltd., Liuzhou 545007, China
6
Department of Computer and Information Science, Northumbria University, Newcastle upon Tyne NE1 8ST, UK
7
Peng Cheng Laboratory, Shenzhen 518066, China
*
Author to whom correspondence should be addressed.
Drones 2022, 6(9), 228; https://doi.org/10.3390/drones6090228
Submission received: 30 July 2022 / Revised: 26 August 2022 / Accepted: 28 August 2022 / Published: 31 August 2022
(This article belongs to the Special Issue Advances in UAV Detection, Classification and Tracking)

Abstract

:
Due to the rapid development of deep learning, the performance of object detection has greatly improved. However, object detection in high-resolution Unmanned Aerial Vehicles images remains a challenging problem for three main reasons: (1) the objects in aerial images have different scales and are usually small; (2) the images are high-resolution but state-of-the-art object detection networks are of a fixed size; (3) the objects are not evenly distributed in aerial images. To this end, we propose a two-stage Adaptive Region Selection Detection framework in this paper. An Overall Region Detection Network is first applied to coarsely localize the object. A fixed points density-based targets clustering algorithm and an adaptive selection algorithm are then designed to select object-dense sub-regions. The object-dense sub-regions are sent to a Key Regions Detection Network where results are fused with the results at the first stage. Extensive experiments and comprehensive evaluations on the VisDrone2021-DET benchmark datasets demonstrate the effectiveness and adaptiveness of the proposed framework. Experimental results show that the proposed framework outperforms, in terms of mean average precision (mAP), the existing baseline methods by 2.1% without additional time consumption.

1. Introduction

Nowadays, as a fast-growing number of Unmanned Aerial Vehicles (UAVs) start carrying high-definition cameras, object detection technology in aerial images has been widely used in various practical applications, including agricultural planting [1,2], pedestrian tracking [3], urban security [4,5], inspecting buildings [6], search and rescue [7], and rare plant monitoring [8]. These applications all require accurate object detection in visible or infrared images taken by onboard cameras. However, detecting objects in UAV images is nontrivial. Varying purposes in different applications and the limited computing power of UAVs have brought challenges to this work. To solve these problems, object detection based on a Convolutional Neural Network (CNN) is gradually applied in UAV detection tasks.
The methods of object detection commonly used today are YOLO series [9,10,11,12] and Faster-RCNN [13]. They have achieved a good performance on large-scale datasets such as MS COCO [14], ImageNet [15], and VOC2007/2012 [16]. However, compared to these datasets, UAV images have the following features:
(1)
UAV image datasets often provide higher resolution images, but the objects in these images are always in low resolution. For example, the image size in general image datasets VOC2007/2012 and MS COCO is approximately 500 × 400 and 600 × 400, respectively. However, in the UAV image dataset VisDrone2021-DET [17], the image size is 2000 × 1500 while the object size is only about 50 × 50 pixels.
(2)
The size of the objects depends on the altitude at which the drone takes the image. The higher the drone is, the smaller the object is in the images [18].
(3)
The targets are not evenly distributed. Some regions in an image are plain backgrounds, while other regions are mostly occupied by objects.
To solve these issues, many researchers have attempted to change the structure of the object detection network. Extended from YOLOv5 [19], an improved network named YOLOv5-TPH [20] added a transformer model with attention mechanisms on the detection head of YOLOv5. It trained a 1536 × 1536 high-resolution network on VisDrone2021-DET and achieved 35.74% mAP. However, the high-resolution network and transformer model cost huge computing resources.
Another common solution is to partition a UAV image into several uniform sub-regions and then detect each of them. However, it cannot guarantee effective improvement by directly conducting uniform cropping or random cropping as this cannot locate key sub-regions. Based on the VisDrone2021-DET dataset, the system can achieve 43.5% mAP50 and 30.3% mAP when the sub-regions are obtained via sliding window search [21] and CNN-based clustered sub-network [22], respectively. However, they are either time consuming or training based. Although these detectors could achieve a better performance, they are inefficient at performing detection in every region. Because some regions only have large-scale objects, detecting these regions does not improve the overall accuracy and efficiency. The object-dense sub-regions need to be located first.
This paper proposes the Adaptive Region Selection Detection framework (ARSD), a novel two-stage detection model that combines the Region Detection Network and the Self-adaptive Intensive Region Selecting Algorithm. ARSD aims to significantly reduce computation resource consumption while maintaining high object detection accuracy. The first stage of ARSD uses an Overall Region Detection Network, which can coarsely locate where the target is. The model then applies a Self-adaptive Intensive Region Selecting Algorithm to generate object-dense sub-regions by cluster objects detected in the first stage and sends them to the next stage for further exquisite detection. The last stage is the Key Region Detection Network, which detects the object-dense sub-regions. Based on the first stage, this stage is extended with an additional small detection head based on the original detection heads.
To sum up, the novelty of this paper is as follows:
(1)
An effective and efficient object detection framework is proposed to adaptively crop high-resolution UAV images according to object density based on clustering algorithms. This can significantly reduce the training and processing time of the UAV images.
(2)
This paper proposes the Self-adaptive Intensive Region Selecting Algorithm to select the object-dense region in UAV images. It reduces the number of sub-regions for further object detection. This enables the framework to be more suitable for the limited UAV hardware computing power.
(3)
This paper also proposes that an additional detection head is added to deal with the varying object sizes in UAV images. This helps the framework detect small objects more easily and increases detection accuracy.
In this way, the proposed framework can gradually reduce the computational complexity while maintaining high object detection accuracy.
The rest of the paper is organized as follows: Section 2 provides a comprehensive overview of the components of ARSD. The specific experimental details are given in Section 3, which demonstrates the performance of the proposed ARSD in various aspects, as well as comparisons with other works. Section 4 summarizes the experimental results. Finally, Section 5 concludes the paper and lists a collection of ongoing research and future work directions.

2. Materials and Methods

This section first introduces the overall framework of the proposed ARSD framework and then describes each module in detail. As shown in Figure 1, the ARSD framework consists of three parts. The first part is the Overall Region Detection Network (ORDN), which is used to roughly locate the objects. The Self-adaptive Intensive Region Selecting Algorithm (SIRSA), which consists of the Fixed Points Density-based Clustering Algorithm (FPDCA) and Adaptive Sub-regions Selection Algorithm (ASSA), is then adopted to properly select the object-dense sub-regions. Finally, the Key Region Detection Network (KRDN) is responsible for detecting the objects in sub-regions selected by SIRSA. The detected objects are combined with the results of ORDN. This framework has better detection accuracy for small targets in UAV images and reduces computing resources due to the filter of the sub-regions.

2.1. Overall Region Detection Network (ORDN) and Key Region Detection Network (KRDN)

The ORDN module predicts object bounding boxes on the whole images, while KRDN predicts the object based on cropped object-dense sub-regions. After cropping sub-regions with SIRSA, KRDN can predict more accurate results in a high-resolution region. The results of ORDN and KRDN are merged by WBF and produce the final results.
It should be mentioned that although ORDN and KRDN are based on the same backbone structure, they differ in width and depth. Therefore, we can easily and inexpensively implement two detection networks with different precision and different time consumption. ORDN only needs to have an accurate recall rate, so it is designed to be more lightweight to save computing power. On the contrary, KRDN is wider and deeper than ORDN. This enables KRDN to have greater accuracy than ORDN without changing the network structure.
For an anchor-based object detection network, anchor size is an important factor affecting the accuracy. The targets in UAV images are on different scales and most are small-scale targets. An additional detection head is added to KRDN based on the original detection head in ORDN. Combined with the original detection head, KRDN can easily locate small objects and reduce the adverse influence caused by different object scales. The added detection head is generated from the low-level feature map of the backbone and the high-resolution feature map obtained by up-sampling in FPN [24]. Generally, feature information will be reduced as the size of the feature map decreases during the processing of CNN in the backbone. Since the image feature information does not decline gradually in the large-size feature map and more features of small targets are retained, this detection head can help to effectively detect small targets.
The object detection is performed by KRDN after object-dense sub-regions are clustered and selected by SIRSA. KRDN detects the object-dense region and obtains more details about the objects. This paper combines the results from two stages using WBF [23]. Bo and Bk represent the coordinates of the bounding boxes obtained by ORDN and KRDN, respectively. The final result of the bounding box B is calculated by (1). The final confidence C is obtained by (2), where Co and Ck represent the confidence values of the bounding boxes obtained by ORDN and KRDN, respectively.
B ( x , y ) = B o ( x , y ) C o + B k ( x , y ) C k 2
C = C o + C k 2

2.2. Self-Adaptive Intensive Region Selecting Algorithm (SIRSA)

SIRSA is composed of two parts: (1) the Fixed Points Density-based Clustering Algorithm (FPDCA) is used to cluster the center point of the object predicted in ORDN to obtain candidate sub-regions; (2) the adaptive region selection algorithm selects object-dense sub-regions.

2.2.1. Fixed Points Density-Based Clustering Algorithm (FPDCA)

This paper proposes a new clustering method named FPDCA, combining the advantages of two clustering algorithms: K-means [25] and Mean-Shift [26]. K-means is competent at generating fixed clustering centers, but it cannot use density information. Mean-Shift cannot confirm the number of clustering regions, which tends to generate a large number of small-size sub-regions or only one large sub-region. It consumes intensive computation power or cannot be applied to higher resolution images. However, Mean-Shift can perform region clustering based on object-dense information, which is neglected by K-means. Combining K-means and Mean-Shift can take both the density information and generating the fixed number of sub-regions into account.
As shown in Algorithm 1, the set of centers of the bounding box is denoted as Q, with a point q in Q randomly chosen as the initial cluster center. Point q is updated by calculating the motion vector based on the points in the surrounding circle of radius r. The algorithm moves to the next Point q and repeats the above step until all points in Q have been processed. If the number of cluster centers is greater than the required number of sub-regions N, K-Means is used to regroup these clusters into N clusters and then output the N final candidate sub-regions. If the number of clusters does not exceed N, these clusters are discarded and K-Means are used directly based on the original Q points to regroup to N clusters and the corresponding N final sub-regions.
Algorithm 1: Fixed Points Density-based Clustering Algorithm
Input:N: number of sub-regions,
     Q: the set of bounding box centers,
     r: distance of algorithm,
      ξ : threshold of the distance of vector.
Output: the set of sub-regions S
1: for q ( x , y )   i n   Q   b u t   n o t   i n   M
2:   M = M q ( x , y )
3:  for  q ( x i , y i )   i n   Q   b u t   n o t   i n   M
4:     S k ( q ) = { y : ( x x i ) 2 + ( y y i ) 2 < r 2 }
5:      M = M S k ( q )
6:      C i = C i S k ( q )
7:      V s h i f t = 1 k q S k ( q i q )
8:     q = q + V s h i f t
9:     if  V s h i f t n e w V s h i f t o l d < ξ
p u t   C i   i n   C
10:     break from line 3;
11:    end if
12:  end for
13: end for
14: if  l e n g t h ( C ) > N
15:   S = K m e a n s ( N , C )
16: else
17:   S = K m e a n s ( N , Q )   a s   r a n d o m   c e n t e r
18: end if

2.2.2. Adaptive Sub-Regions Selection Algorithm (ASSA)

A large number of candidate sub-regions are produced by FPDCA. To save computing resources on hardware platforms, this paper proposes the Adaptive Sub-regions Selection Algorithm (ASSA) to filter sub-regions that needed to be detected in KRDN. Sub-regions with higher ASSA scores will be selected for further detection by KRDN, while the other sub-regions will be discarded.
Four criteria are defined in ASSA to evaluate whether a candidate sub-region p requires further detection by KRDN, including regional target density, average confidence, the ratio of bounding boxes’ total areas to the sub-region area, and average area of all bounding boxes in the sub-region. Regional target density is considered in [27], as defined in (3), where L denotes the number of the predicted boxes in p and A is the area of p. However, this definition may not necessarily be accurate in that the size of the original image should also be considered. As shown in Figure 2, when reducing the image size from 200 × 200 (left image) to 100 × 100 (right image), the regional target density should remain the same. However, the result does not conform to this using (3). This paper extends (3) by considering the size of the original image S in (4).
D = L 2 A
D = L 2 S A
The second criterion is the average confidence M as defined in (5), where scorei represents the confidence of bounding box i. It is considered that the sub-region with low average confidence is due to the classification inaccuracy caused by the lightweight network of ORDN. It is believed that the smaller the value of M, the greater the accuracy gain.
M = i = 1 L s c o r e i L
ASSA then considers the ratio of the sum area of all bounding boxes to the sub-region area R as defined in (6). The larger the value of R, the less background in this sub-region and the larger the area that contains objects. In addition, it can also reflect the overlapping degree of the objects to a certain extent, e.g., R > 1 means that there are overlaps of the object’s bounding boxes in this sub-region. Larger R values indicate that the detected object is big or that many objects are detected within the sub-region.
R = i = 1 L a r e a i S
Finally, the ratio of the sum area of all bounding boxes to the number of bounding boxes is defined in (7). It reflects the average size of the objects in the sub-region.
E = i = 1 L a r e a i L
As defined in (8), a final score si is computed for each sub-region by adding the above four indicators, each with a corresponding weight calculated using information entropy; wj is the weight of each indicator and pij is the indicator j of sub-region i. The sub-regions with high scores are identified as object-dense sub-regions and sent to the KRDN stage.
s i = j = 1 m w j p i j
The weight of each indicator wj is calculated by information entropy ej as defined in (9); wj is then computed by (10) and (11).
e j = k i = 1 n p i j ln ( p i j ) ,   k = 1 / ln ( n ) > 0   e j 0
d j = 1 e j
w j = d j j = 1 m d j
Each final indicator j of sub-region i, denoted as pij, is calculated by (14) after normalizing the origin indicators using (12) and (13). The higher the regional target density, the more likely that it should be sent to KRDN and the higher the final score. These indicators are defined as extremely large indicators. On the contrary, the smaller the average confidence, the more likely it should be sent to KRDN. These indicators are defined as extremely small indicators. To standardize and normalize these indicators, extremely small indicators are converted by (12) to extremely large indicators and extremely large indicators are normalized by (13).
x i j = x i j min { x i j , , x n j } max { x i j , , x n j } min { x i j , , x n j }
x i j = max { x i j , , x n j } x i j max { x i j , , x n j } min { x i j , , x n j }
p i j = x i j i = 1 n x i j ,   i = 1 , , n , j = 1 , , m
The results of SIRSA are shown in Figure 3. A white rectangle indicates candidate sub-regions, while the transparency of sub-regions indicates their ASSA score. The clearer the sub-region, the higher its final ASSA score and the more it should be sent to KRDN.

3. Results

3.1. Datasets and Evaluation Metrics

Datasets. The proposed approach is evaluated on the VisDrone2021-DET dataset. The VisDrone dataset is collected by drones in 14 different cities of China, at different heights and in different weather/light conditions. It contains a total of 10,209 images, which consists of 6471 training images, 548 validation images, and 3190 testing images. The objects in this dataset are mostly small and often clustered together. However, the dataset provides a high image resolution of approximately 2000 × 1500 pixels. Images are annotated with bounding boxes, including 10 predefined categories (pedestrian, person, car, van, bus, truck, motor, bicycle, awning-tricycle, and tricycle).
Evaluation Metric. The proposed method is evaluated using the same evaluation protocol as described in MS-COCO, which has 12 evaluation indicators for object detection. AP, AP50, and AP75 are selected as the criteria for state-of-the-art comparison. AP is used to calculate the average index of all categories, and it generally defaulted to mAP. AP50 and AP75 represent indicators with threshold IOUs of 0.5 and 0.75, respectively. This paper also adopted the widely used precision–recall (PR) curves as our evaluation metric. The method of [28] is used to calculate the criteria proposed above.
Implementation Details. The proposed methods are implemented using PyTorch. The backbone is pretrained on MS COCO. The following training of the model is completed on a server with one NVIDIA GeForce GTX 3080Ti GPU. The experiment uses Adam [29] to train ORDN and KRDN for 150 epochs, with the learning rate starting at 0.001.

3.2. Model Scaling Scheme for Two-Stage Framework

YOLOv5 has five networks of different sizes, namely YOLOv5x, YOLOv5l, YOLOv5m, YOLOv5s, and up-to-date YOLOv5n. Since it is the most notable and convenient one-stage detector with a flexible structure, the experiment in this paper chooses YOLOv5 as the basic model for ORDN and KRDN.
We test YOLOv5n and YOLOv5m in different sizes in Section 3.5. The experiment demonstrates that the large-size YOLOv5n is more accurate than the small-size YOLOv5m within the same execution time. Because ORDN is required to locate the bounding box in time, we balance time consumption and accuracy, properly setting YOLOv5n as the basic model of ORDN. Considering the limited performance of the UAV hardware platform, YOLOv5X is unsuitable at this stage due to its high time consumption, despite having the highest performance. YOLOv5m is balanced in its performance and computational requirement, and is therefore adopted as the KRDN base model. Finally, the input size of ORDN is set to 736 × 736 and the sub-regions are resized to 384 × 384 before being fed into KRDN.

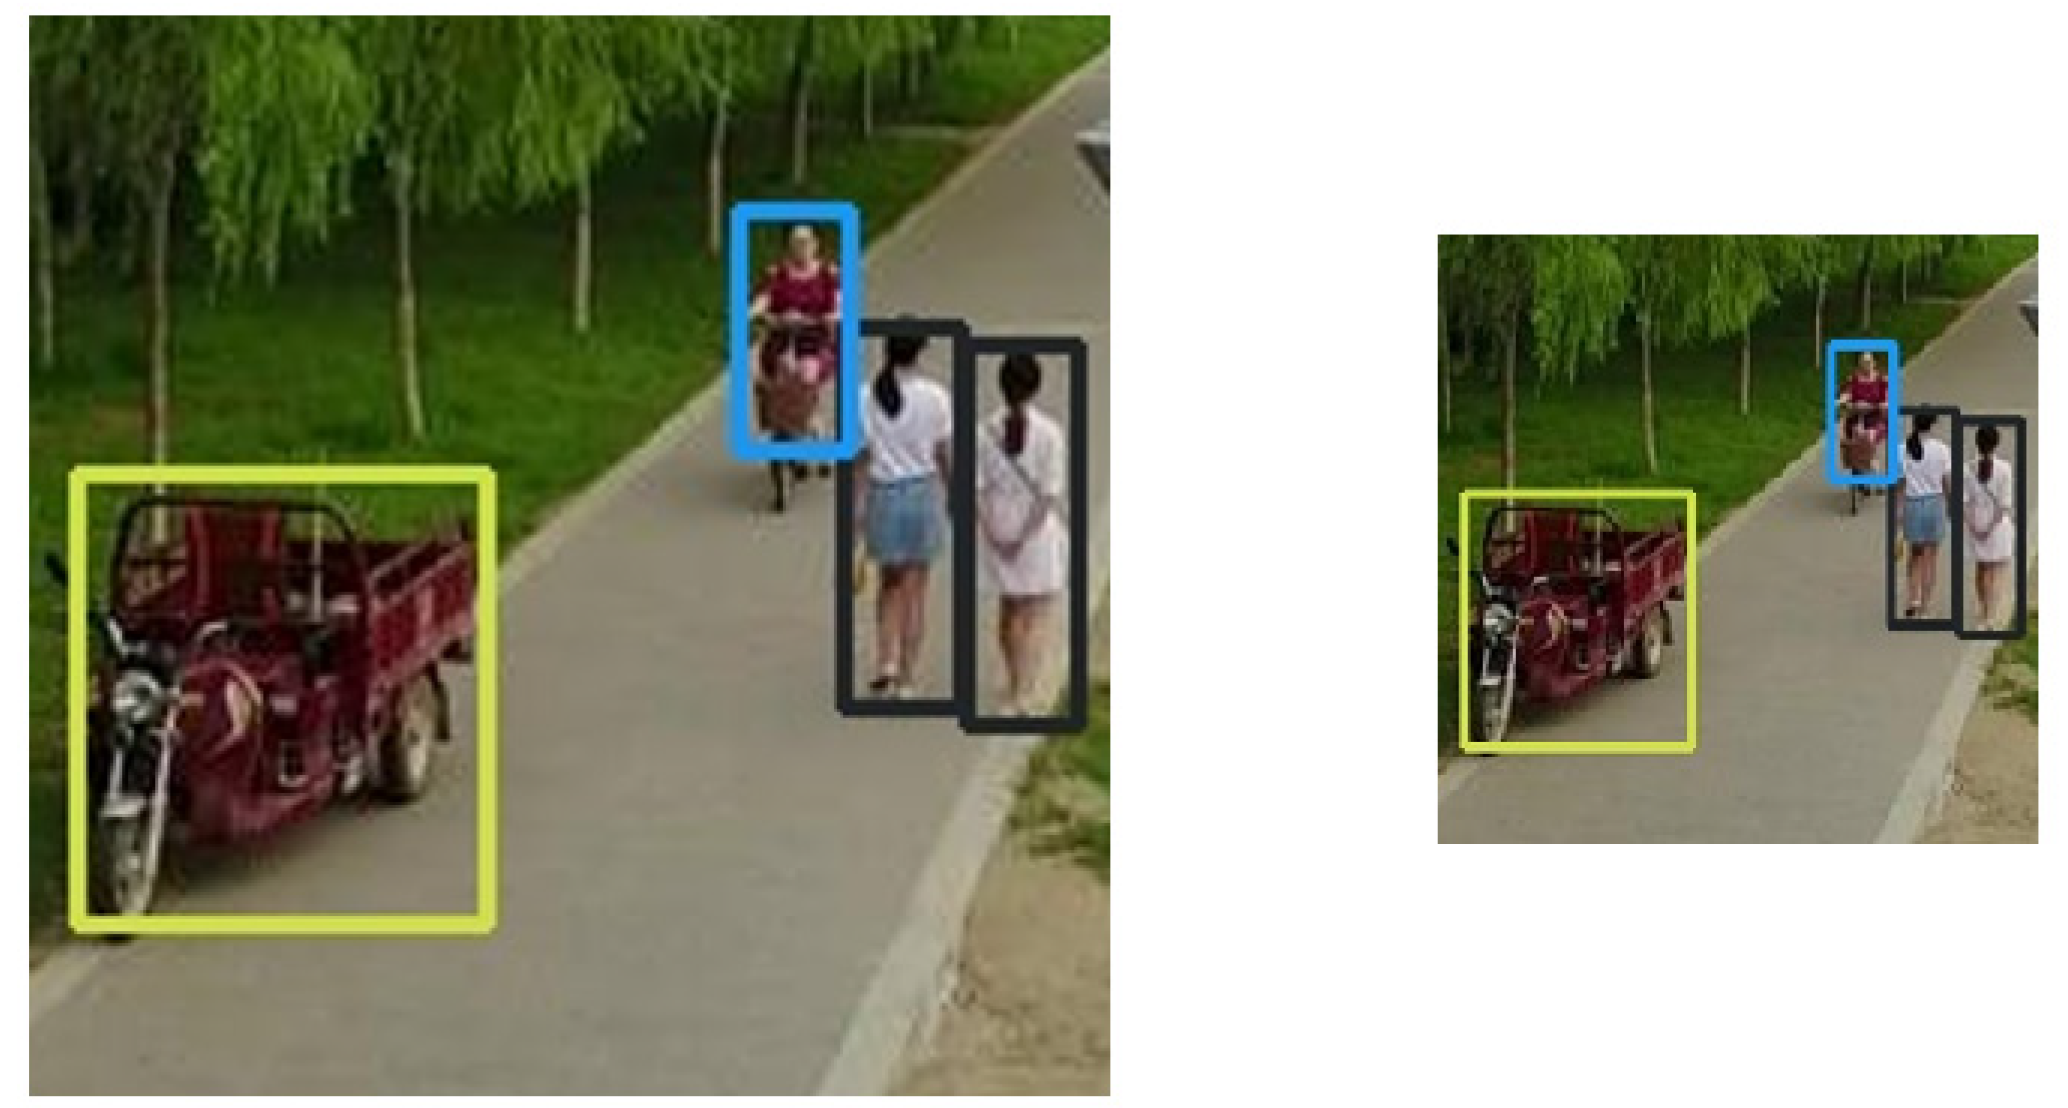
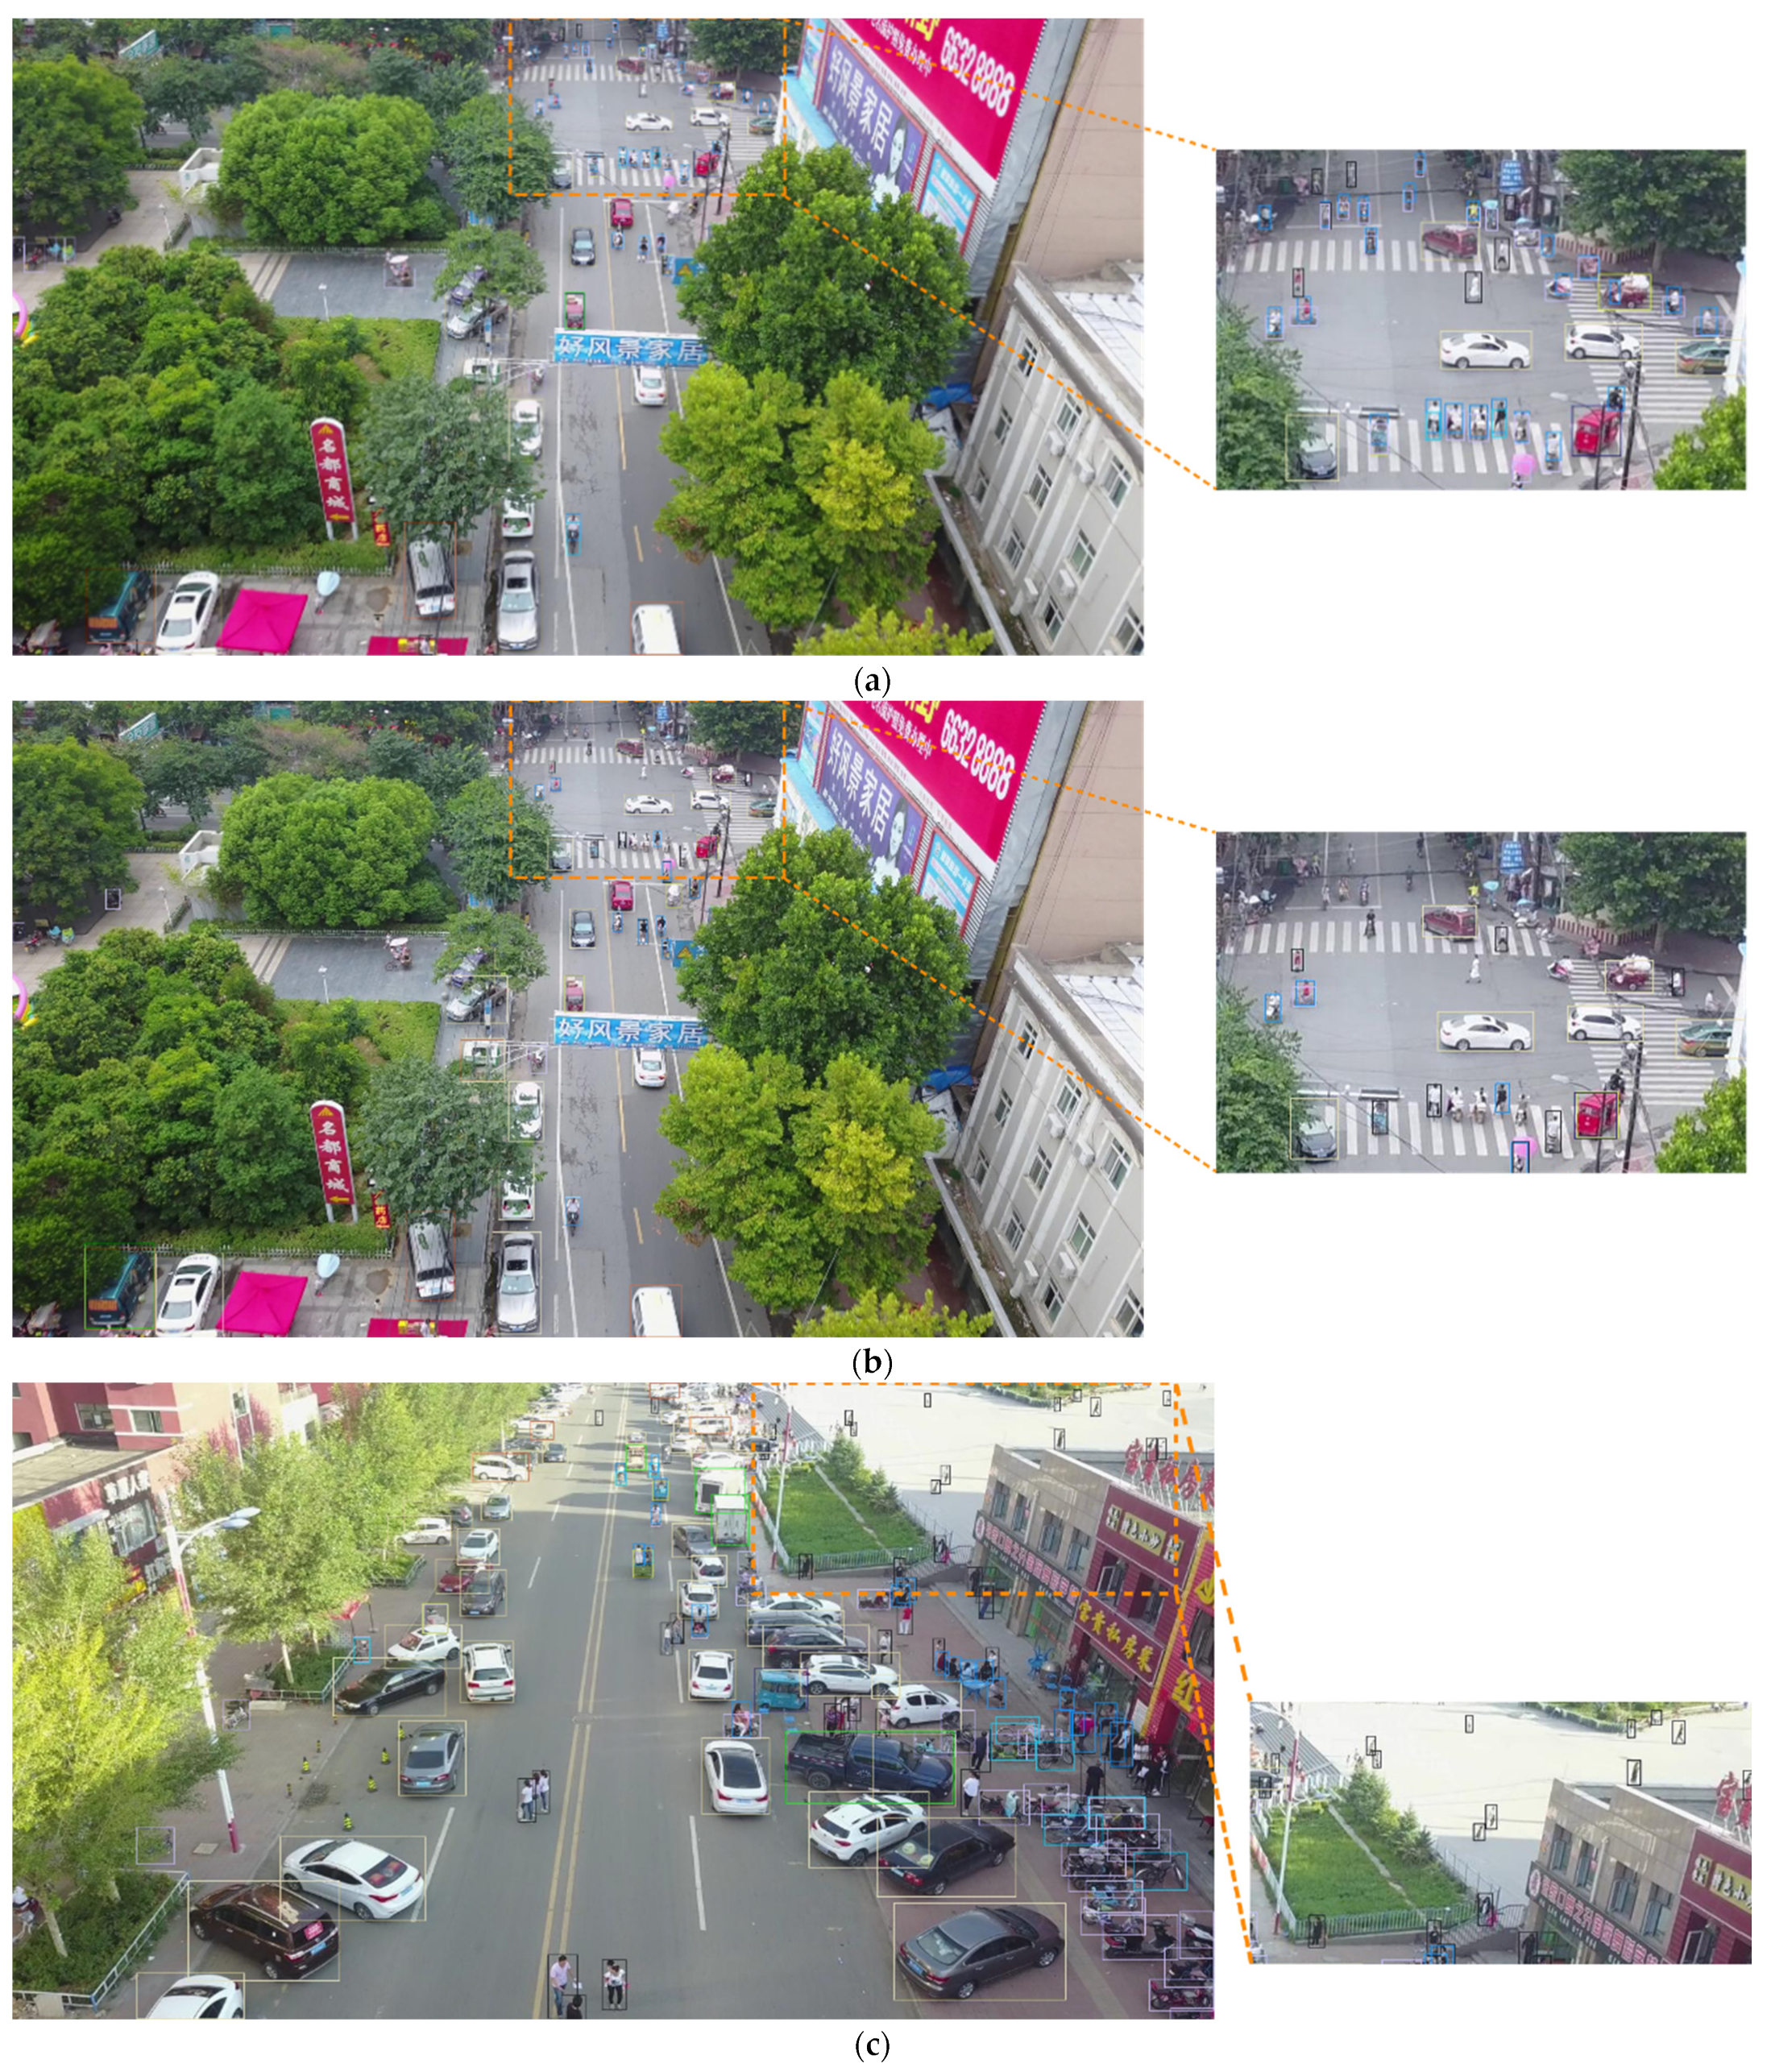
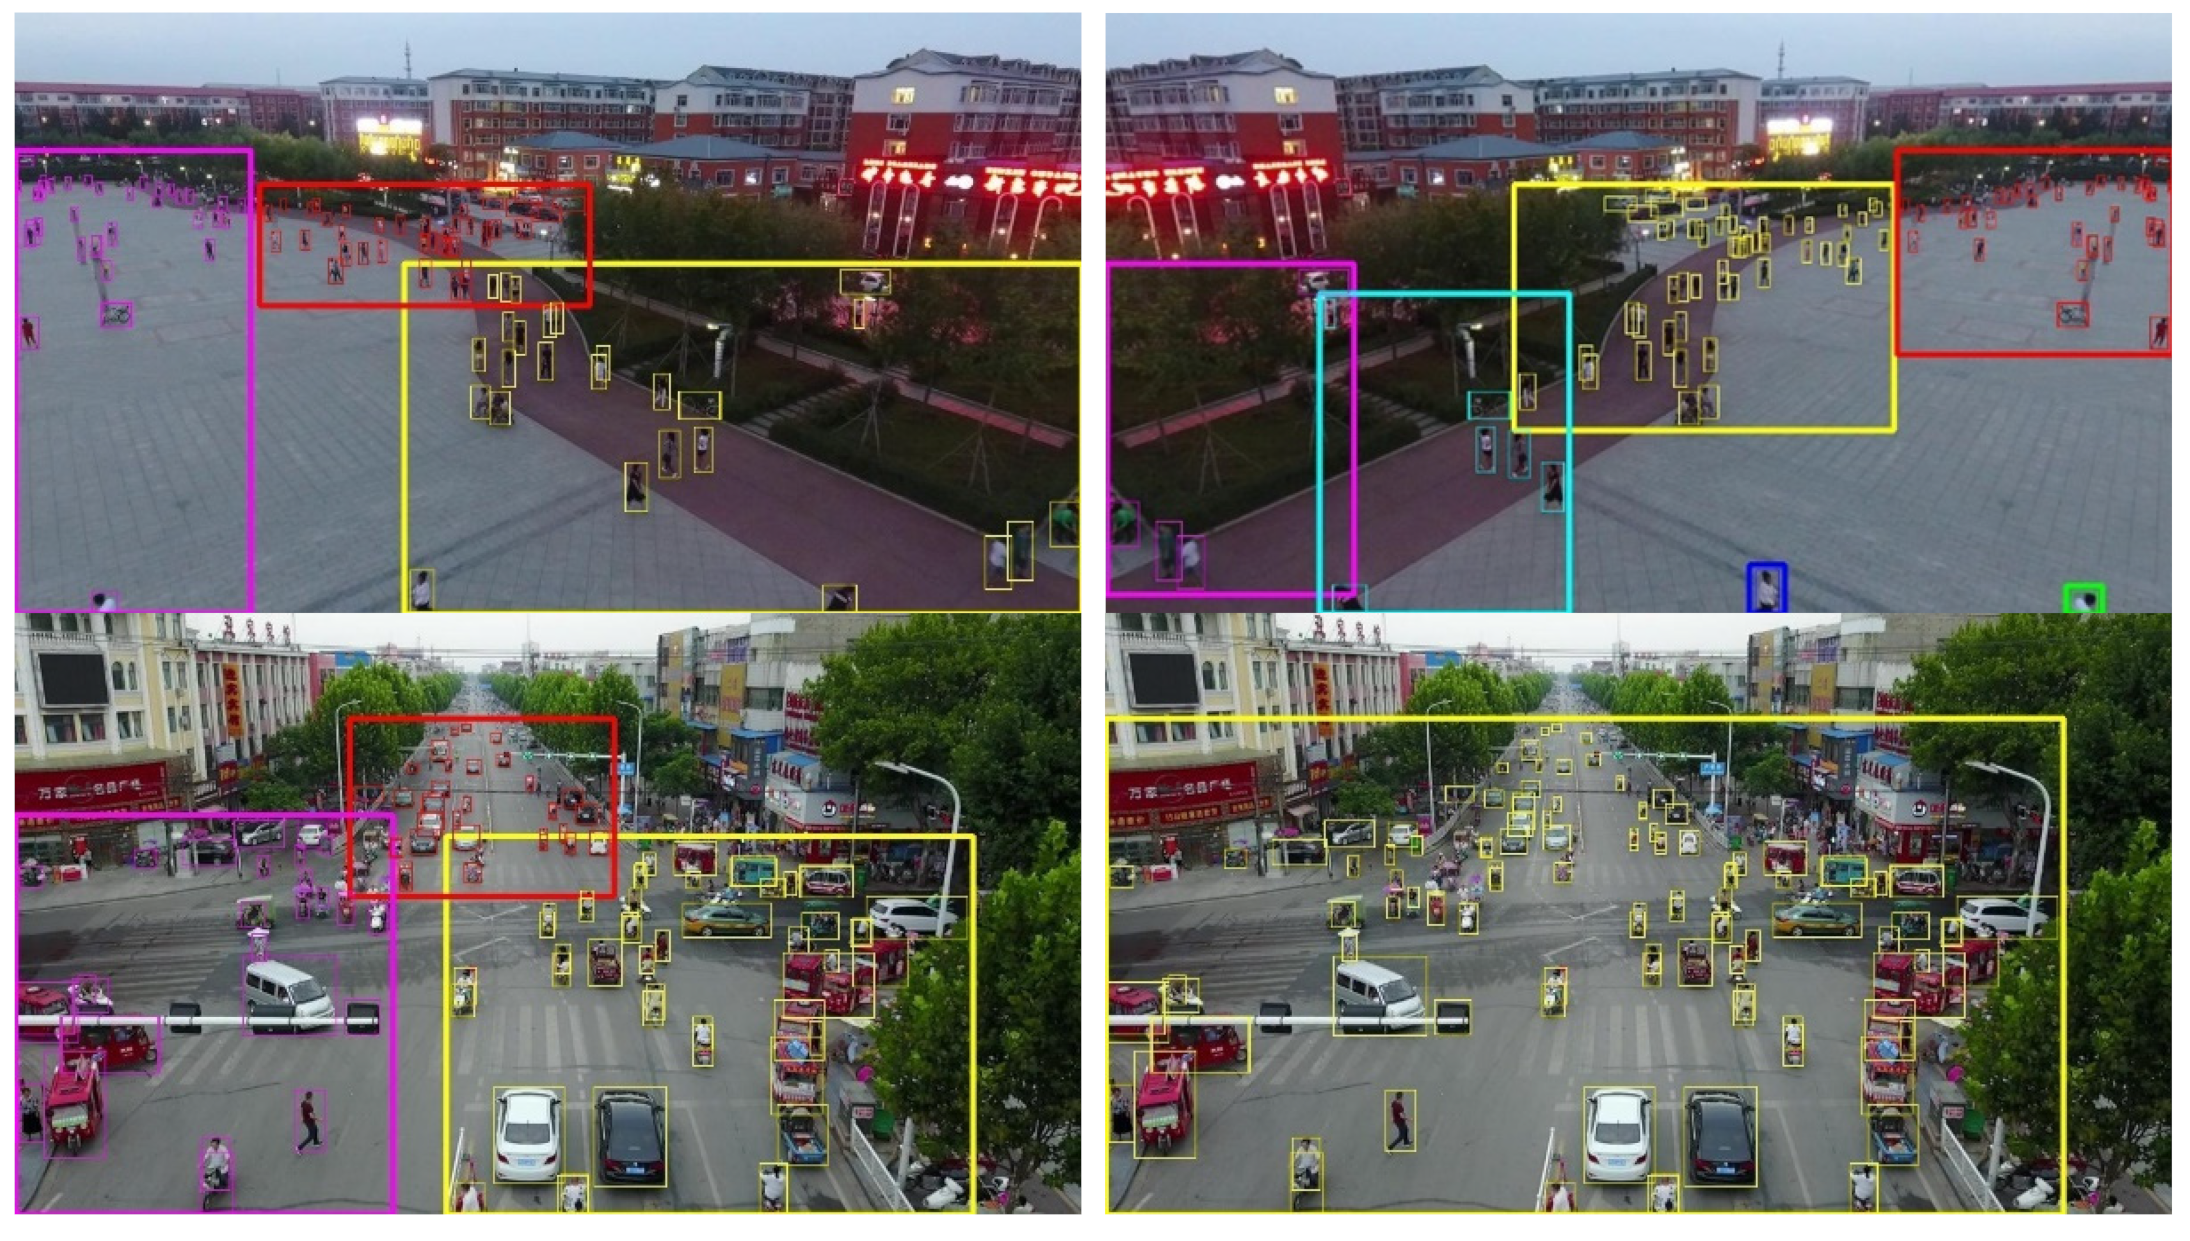
3.3. Qualitative Result

To demonstrate the effectiveness of the proposed model ARSD, extensive experiments have been conducted to compare its results with the baseline method (YOLOv5) on the VisDrone2021 dataset, as shown in Figure 4. It can be noted that ARSD performs better in small-scale object detection, especially in object-dense sub-regions. In contrast, YOLOv5 misses many small-scale objects in the object-dense region. According to the partially enlarged image, there is almost no missing small-scale objects such as pedestrians. This is mainly because the object-dense sub-regions are on a small scale and do not need to resize dramatically before being sent to KRDN; thus, more features remain for more accurate detection.
Figure 5 shows the cluster results of the proposed FPDCA and Mean-Shift. The clustering number of Mean-Shift is dynamic; sometimes it has only one cluster. If this one sub-region is sent to KRDN, it cannot achieve any improvement in accuracy. In addition, it sometimes has too many clusters which will result in cost-intensive computing resources.

3.4. Quantitative Evaluation

Since the traditional one-stage methods are easier to reproduce, we compare our method with them in each category; however, the comparison with state-of-the-art methods comes from their literature. Quantitative comparisons are conducted in two aspects using the VisDrone2021-DET dataset: (1) the detection accuracy of each category comparisons against different one-stage methods; (2) the detection accuracy and accuracy improvement comparisons against state-of-the-art two-stage framework methods.
Table 1 lists AP50 values for ARSD and other one-stage methods in the detection of 10 different categories of objects. The results of the first five methods are derived from [30], with the remaining results obtained from our conducted experiments. The proposed method, ARSD, consists of YOLOv5n + YOLOv5mAH and performs much better than the other methods in each category, especially in small-scale categories such as Pedestrian and People.
As shown in Table 2, AP↗, AP50↗, and AP75↗ highlight the outperformance of ARSD over other previous state-of-the-art detectors. Compared with GLASN and UCGNet, ARSD improves by 2.1% and 4.8% (AP50).

3.5. Ablation Study

To validate the effectiveness of the additional detection head, different cluster methods, and a different number of sub-regions in detection tasks, this paper conducted extensive experiments on VisDrone2021-DET test-dev.
(1)
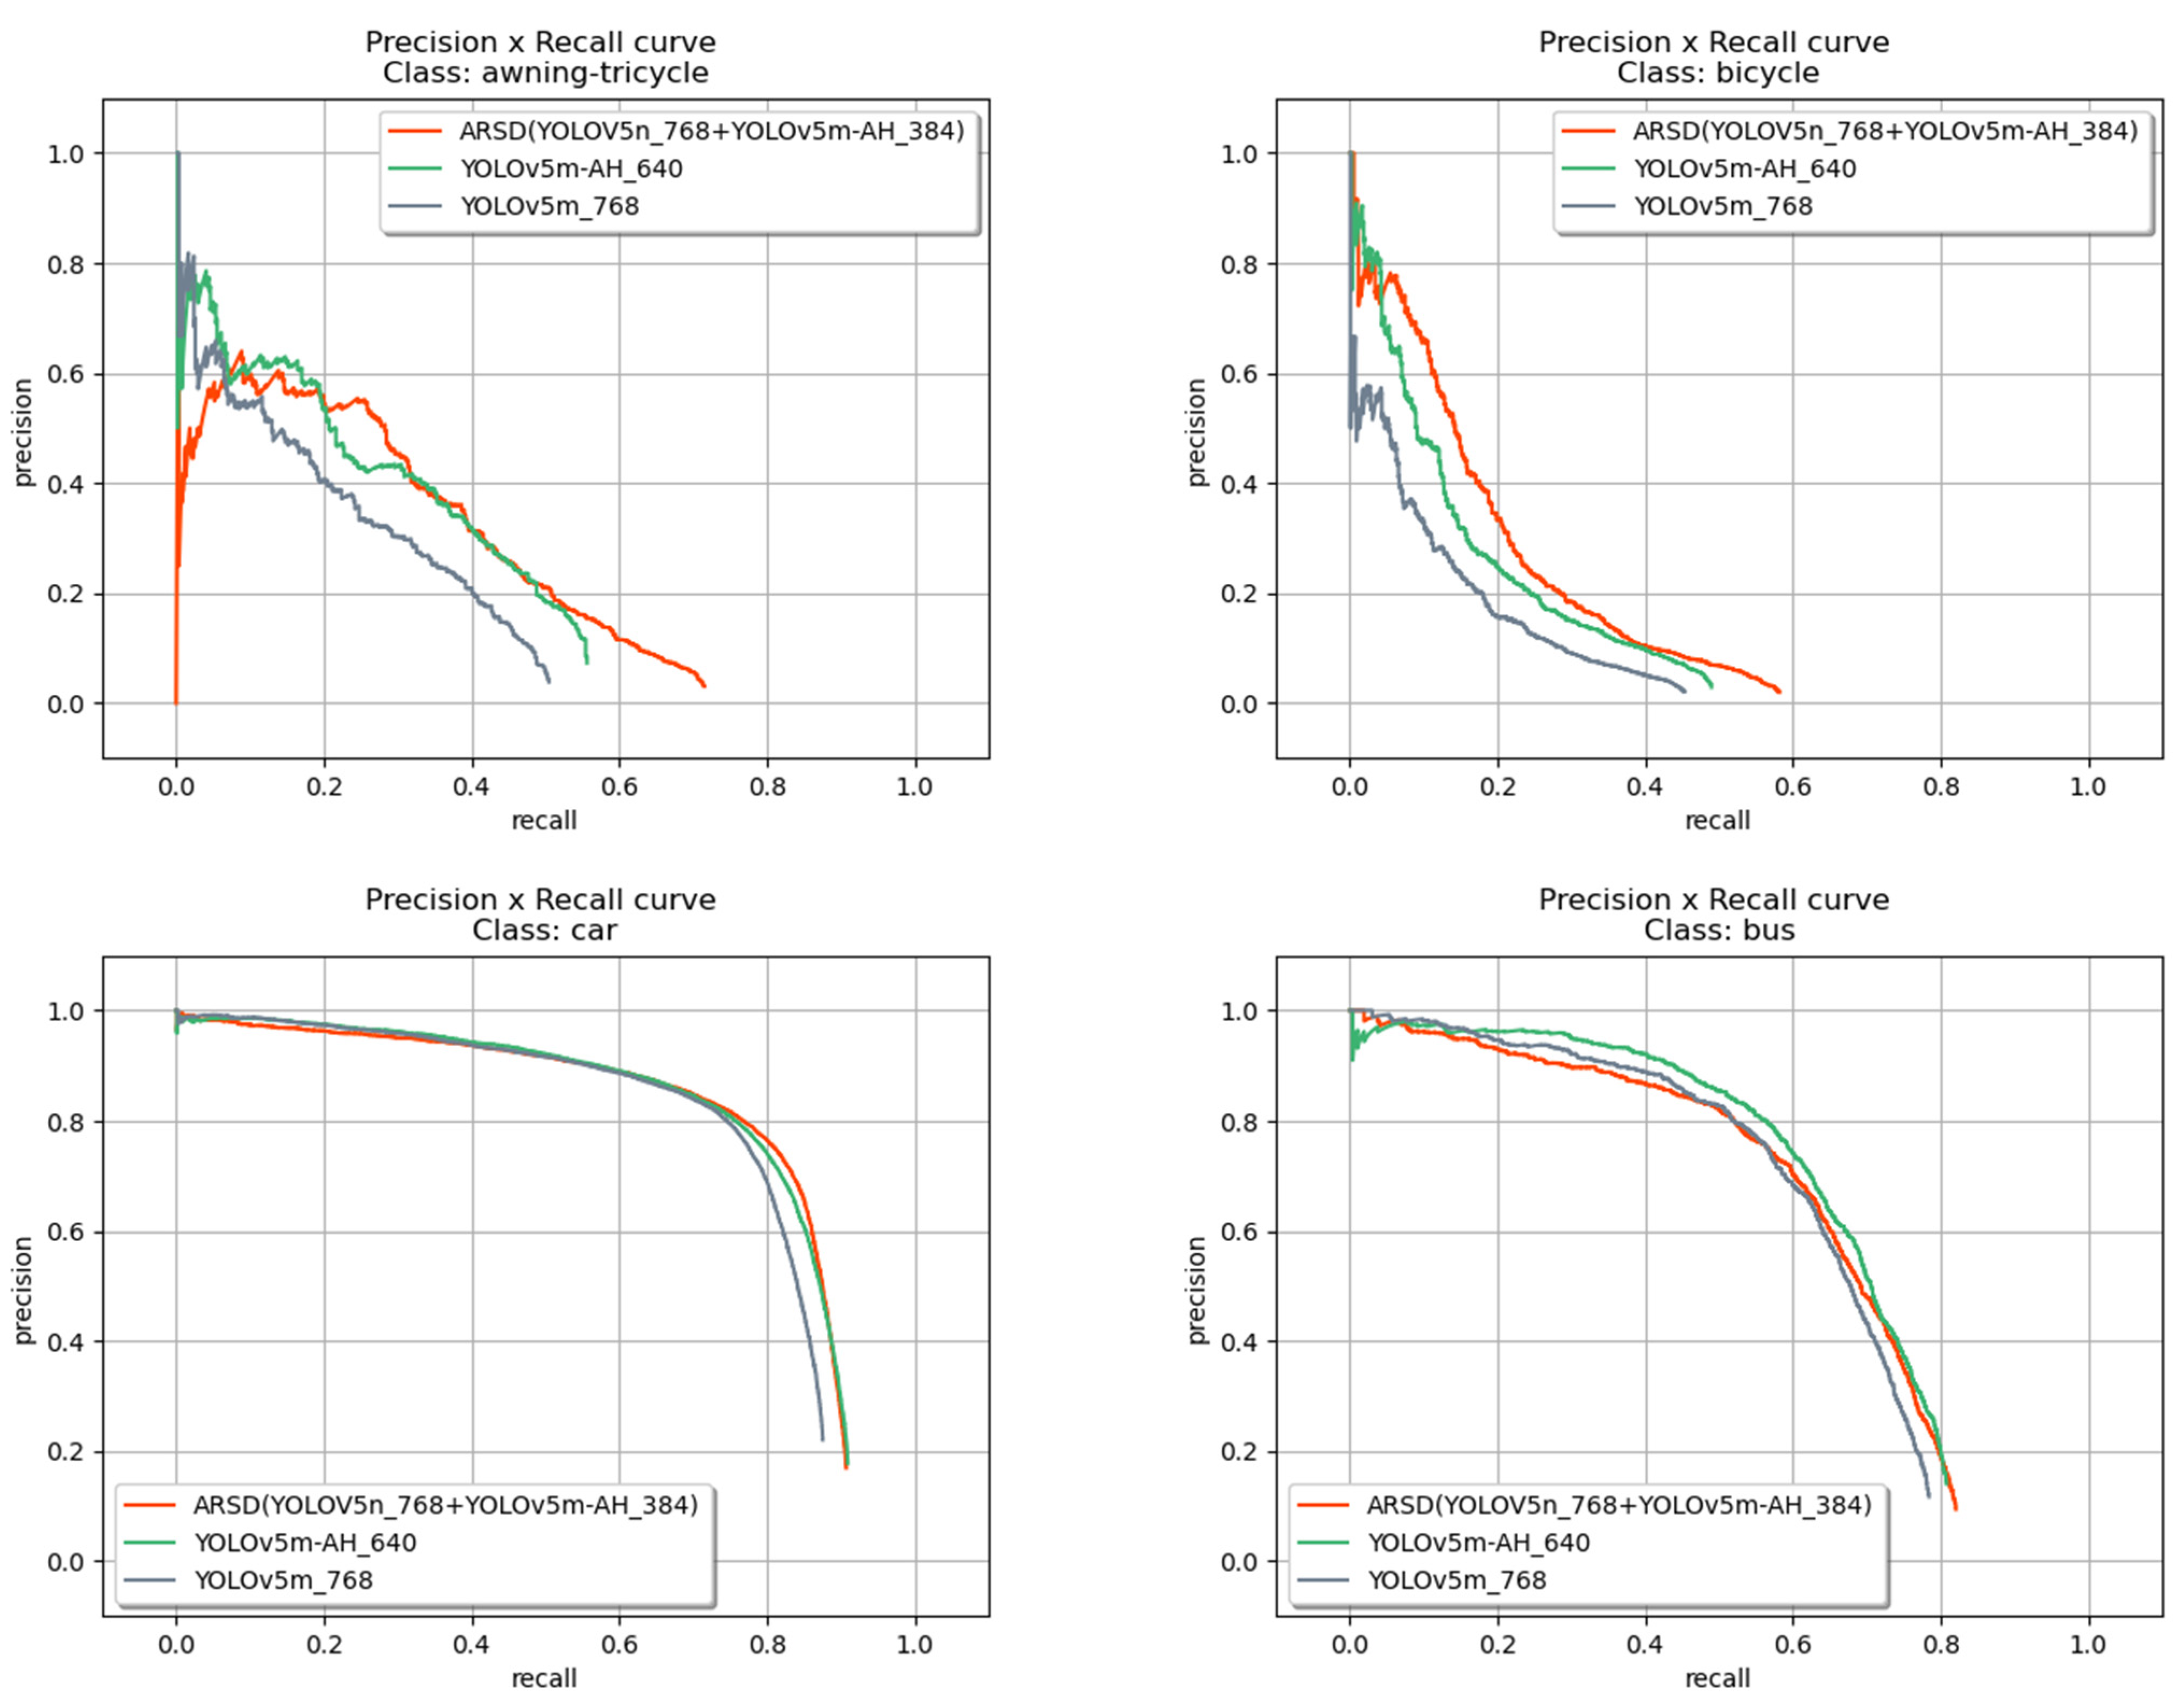
Effect of the large-scale and lightweight network. The results are from different scales YOLOv5n and YOLOv5m, trained on VisDrone2021-DET, as shown in Figure 6. Within the same computation time, YOLOv5n performs better than YOLOv5m. Therefore, we choose the large-scale YOLOv5n as the base model of ORDN.
(2)
Effect ofadditional prediction head. Though experiments show that adding a detection head for small-scale objects makes the GFLOPs increase from 48.1 to 59.1, the performance of an additional detection head is prominent. The experiment is to increase the size of the network to compare different accuracy under different time consumption. As shown in Figure 6, YOLOv5m-AH is YOLOv5m with an additional detection head. The mAP of the net with an additional detection head (blue line, YOLOv5m-AH) is 1.5% higher than without an additional head (green line, YOLOv5m) in the same processing time (3.0 ms). It not only saves the computing power of the hardware, but also improves the mAP considerably in each category.
(3)
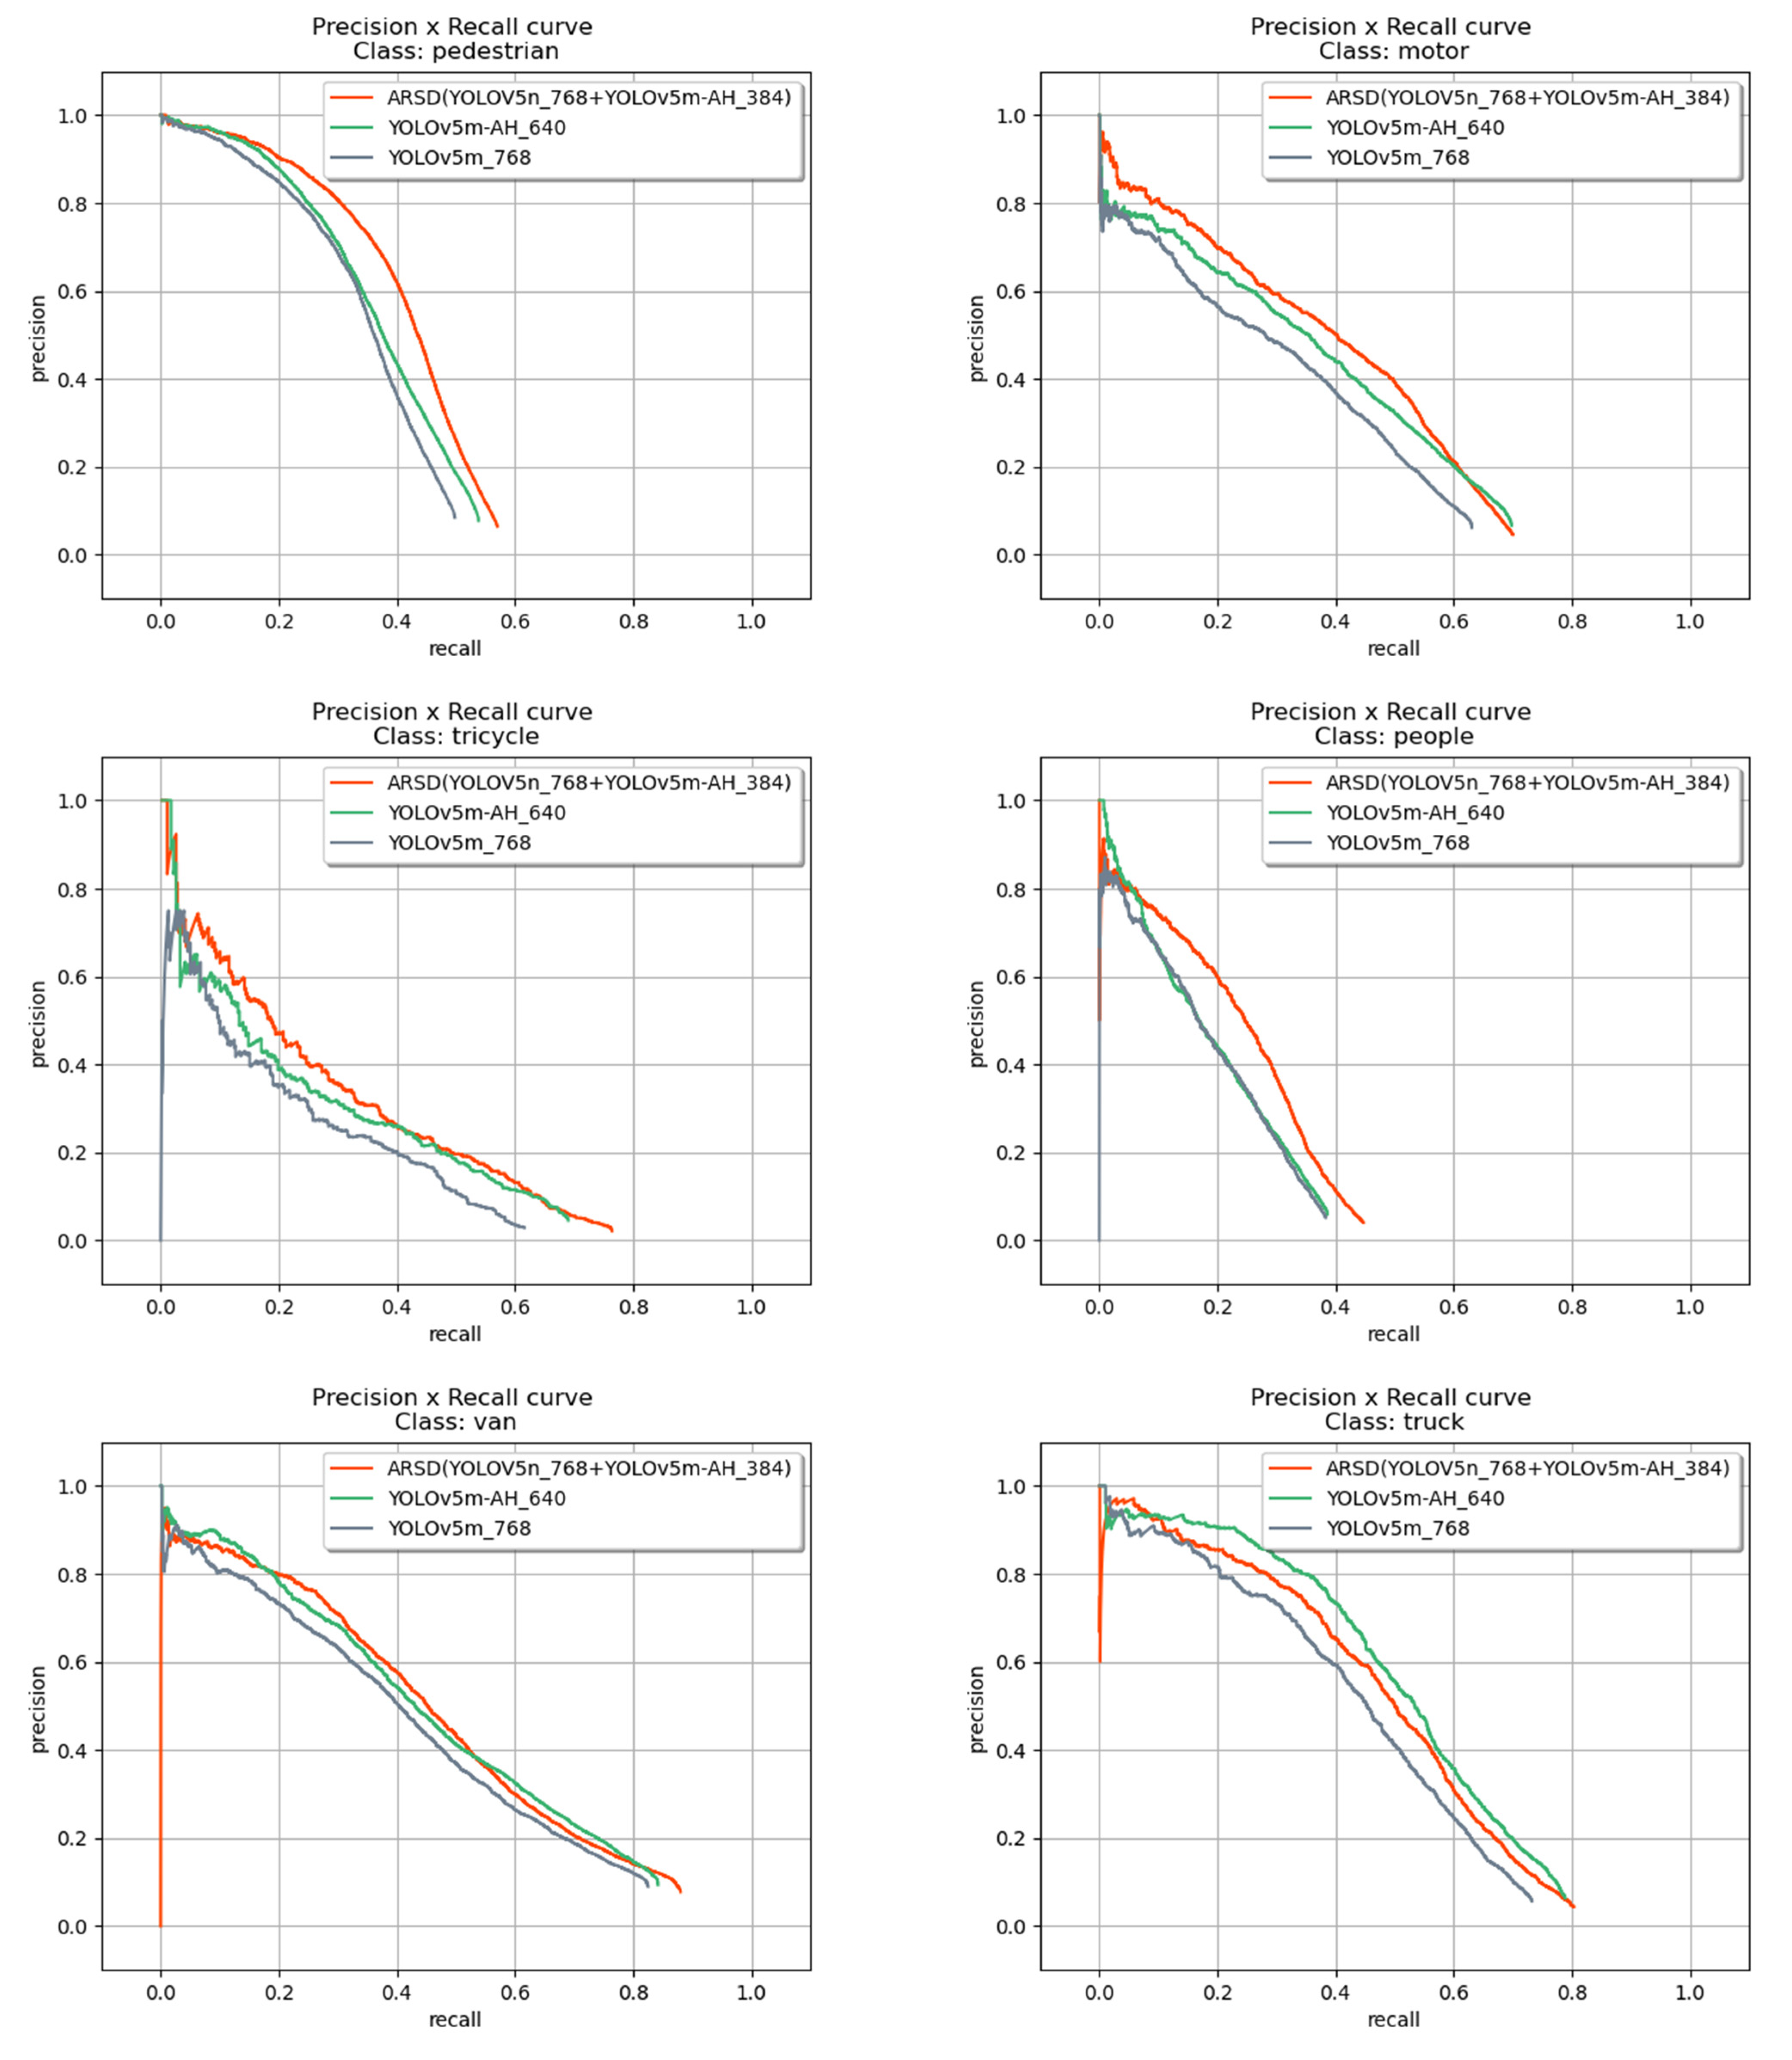
Effect of two-stage structure. To demonstrate the effect of an additional detection head and two-stage framework, this paper chooses three networks with the same computation time: 768 × 768 YOLOv5m, 640 × 640 YOLOv5m-AH, and our two-stage framework (768 × 768 YOLOv5n + 384 × 384 YOLOv5m-AH). Based on the results shown in Figure 7, our two-stage framework is more accurate in small-scale categories such as Pedestrian, People, and Bicycle. However, results in large-scale categories such as bus and truck are not as good as the one-stage structure. The reason for this phenomenon is that the increase is caused by the additional small object true positives predicted from sub-regions and the decrease is caused by the false positives predicted from sub-regions that match large ground truth boxes.
(4)
Effect of FPDCA. The proposed method performs well on clustering, as indicated by Figure 5. In addition, as shown by lines 1, 2, and 6 in Table 3, when using FPDCA as the SIRSA basic cluster method, the result outperforms K-means and Mean-Shift by 0.7% and 1.2%, respectively, in AP50. This shows that it is useful to consider density information when obtaining clusters. The object detection accuracy indicated by AP and AP50 increases as the number of clusters increases from 2 to 4. However, the gain is subtle while the computational complexity also increases. For example, lines 6 and 9 in Table 3 show that AP and AP50 only improves by 0.97% and 0.6%, respectively, when the number of clusters increases from 3 to 4.
To improve processing speed in terms of FPS (frames per second), ASSA is used to discard the sub-regions by 1/3, 1/2, and 0 from the original set of sub-regions. Considering the balance of computing resources and accuracy, ASSA chooses to discard 1/3 of the candidate sub-regions in the inference phase. The processing time is reduced by about a third after discarding 1/3 of sub-regions.

4. Discussion

The aim is to improve the object detection accuracy for UAV images in high resolution with a lot of small targets in the images. This paper proposes a two-stage object detection framework for UAV images, with extensive performance evaluations conducted. The qualitative results in Section 3.3 and quantitative evaluations in Section 3.4 directly show that the proposed framework performs better than the state-of-the-art detection methods. Compared with GLASN, it improves AP by 2.54% and AP50 by 2.1%. The ablation study includes four experiments. The first experiment performs tests on different network scales and the results demonstrate that YOLOv5n is the most suitable for ORDN. The second experiment shows that the network with an additional head performs better than others within the same processing time. The third experiment proves that this two-stage framework is more accurate in small-scale categories such as Pedestrians, People, and Bicycle. The final experiment analyses the influence of clustering algorithms and the number of clusters. The novelty mentioned in Section 1 has been verified by the above four experiments. The framework can improve the accuracy of object detection within the same processing time, especially in small-scale objects.
This method should balance the number of clusters and the ratio of the remaining sub-regions among all candidate sub-regions. If a higher number of clusters is set, the calculation time will undoubtedly increase, but the accuracy will also be improved. Our future work includes the study of selecting these parameters more precisely.

5. Conclusions

This paper proposes ARSD, an adaptive region selection detection framework, that is more efficient and more effective for UAV image object detection. The main idea is to locate object-dense sub-regions in high-resolution UAV images and feed these sub-regions into the second-stage detector. Finally, the results are merged by WBF. In addition, we developed an adaptive region selection algorithm which consists of the Fixed Points Density-based Clustering Algorithm and the Adaptive Sub-regions Selection Algorithm. FPDCA can generate a fixed number of sub-regions combined with density information, while ASSA can score each sub-region objectively. Additionally, a new detection head is added based on the original detection heads for better small object detection. The evaluations on VisDrone2021-DET datasets have demonstrated the effectiveness and adaptiveness of ARSD. We will extend this work to apply the proposed method to small-scale object detection in remote sensing and search and rescue.

Author Contributions

Conceptualization, Y.W., Y.H. (Yan Huang) and Y.H. (Yi Han); methodology, Y.W. and Y.Z.; software, Y.W., Y.H. (Yan Huang) and Q.Y.; validation, Y.W. and Y.H. (Yan Huang); formal analysis, Y.W., Y.Z. and Y.H. (Yan Huang); investigation, Y.W., Y.C., Z.L., Z.Y. and Q.L.; resources, Y.W. and Y.H. (Yan Huang); data curation, Y.W., Y.H. (Yi Han) and Z.L.; writing—original draft preparation, Y.W. and Y.H. (Yi Han); writing—review and editing, Y.W., Y.H. (Yi Han), Y.C., Z.L., Z.Y. and Q.L.; visualization, Y.W. and Q.Y.; supervision, Y.H. (Yi Han) and Z.Y.; project administration, Y.Z.; funding acquisition, Y.Z. All authors have read and agreed to the published version of the manuscript.

Funding

This work was supported by a grant from the National Natural Science Foundation of China (Grant No. 61801341). This work was also supported by the Research Project of Wuhan University of Technology Chongqing Research Institute (No. YF2021-06).

Institutional Review Board Statement

Not applicable.

Informed Consent Statement

Not applicable.

Data Availability Statement

The simulation data used to support the findings of this study are available from the corresponding author upon request. The video of the experimental work can be found at the following link: https://drive.google.com/drive/folders/1eYFxNSaYYEhY_M0tdM55oybCA6sMMgzG?usp=sharing (accessed on 25 August 2022).

Conflicts of Interest

The authors declare no conflict of interest.

References

  1. Hird, J.N.; Montaghi, A.; McDermid, G.J.; Kariyeva, J.; Moorman, B.J.; Nielsen, S.E.; McIntosh, A.C.S. Use of Unmanned Aerial Vehicles for Monitoring Recovery of Forest Vegetation on Petroleum Well Sites. Remote Sens. 2017, 9, 413. [Google Scholar] [CrossRef]
  2. Shao, Z.; Li, C.; Li, D.; Altan, O.; Zhang, L.; Ding, L. An Accurate Matching Method for Projecting Vector Data Into Surveillance Video To Monitor And Protect Cultivated Land. ISPRS Int. J. Geo-Inf. 2020, 9, 448. [Google Scholar] [CrossRef]
  3. Shen, Q.; Jiang, L.; Xiong, H. Person Tracking and Frontal Face Capture with UAV. In Proceedings of the IEEE 18th International Conference on Communication Technology (ICCT), Chongqing, China, 8–11 October 2018; pp. 1412–1416. [Google Scholar]
  4. Audebert, N.; Le Saux, B.; Lefèvre, S. Beyond Rgb: Very High Resolution Urban Remote Sensing with Multimodal Deep Networks. ISPRS J. Photogramm. Remote Sens. 2018, 140, 20–32. [Google Scholar] [CrossRef]
  5. Yuan, Z.; Jin, J.; Chen, J.; Sun, L.; Muntean, G.M. ComProSe: Shaping Future Public Safety Communities with ProSe-based UAVs. IEEE Commun. Mag. 2017, 55, 165–171. [Google Scholar] [CrossRef]
  6. Munawar, H.S.; Ullah, F.; Heravi, A.; Thaheem, M.J.; Maqsoom, A. Inspecting Buildings Using Drones and Computer Vision: A Machine Learning Approach to Detect Cracks and Damages. Drones 2021, 6, 5. [Google Scholar] [CrossRef]
  7. Kundid Vasić, M.; Papić, V. Improving the Model for Person Detection in Aerial Image Sequences Using the Displacement Vector: A Search and Rescue Scenario. Drones 2022, 6, 19. [Google Scholar] [CrossRef]
  8. Reckling, W.; Mitasova, H.; Wegmann, K.; Kauffman, G.; Reid, R. Efficient Drone-Based Rare Plant Monitoring Using a Species Distribution Model and AI-Based Object Detection. Drones 2021, 5, 110. [Google Scholar] [CrossRef]
  9. Redmon, J.; Divvala, S.; Girshick, R.; Farhadi, A. You Only Look Once: Unified, Real-Time Object Detection. In Proceedings of the IEEE Conference on Computer Vision and Pattern Recognition, Las Vegas, NV, USA, 27–30 June 2016; pp. 779–788. [Google Scholar]
  10. Redmon, J.; Farhadi, A. Yolo9000: Better, Faster, Stronger. In Proceedings of the IEEE Conference on Computer Vision and Pattern Recognition, Honolulu, HI, USA, 21–26 July 2017; pp. 7263–7271. [Google Scholar]
  11. Redmon, J.; Farhadi, A. Yolov3: An Incremental Improvement. arXiv 2018, arXiv:1804.02767. [Google Scholar]
  12. Bochkovskiy, A.; Wang, C.Y.; Liao, H.Y.M. Yolov4: Optimal Speed And Accuracy of Object Detection. arXiv 2020, arXiv:2004.10934. [Google Scholar]
  13. Ren, S.; He, K.; Girshick, R.; Sun, J. Faster R-Cnn: Towards Real-Time Object Detection with Region Proposal Networks. IEEE Trans. Pattern Anal. Mach. Intell. 2017, 39, 1137–1149. [Google Scholar] [CrossRef] [PubMed]
  14. Lin, T.Y.; Maire, M.; Belongie, S.; Hays, J.; Perona, P.; Ramanan, D.; Dollár, P.; Zitnick, C.L. Microsoft Coco: Common Objects in Context. In European Conference on Computer Vision; Springer: Cham, Switzerland, 2014; pp. 740–755. [Google Scholar]
  15. Deng, J.; Dong, W.; Socher, R.; Li, L.; Li, K.; Fei-Fei, L. Imagenet: A Large-Scale Hierarchical Image Database. In Proceedings of the IEEE Conference on Computer Vision And Pattern Recognition, Miami, FL, USA, 20–25 June 2009; pp. 248–255. [Google Scholar]
  16. Everingham, M.; Van Gool, L.; Williams, C.K.I.; Winn, J.; Zisserman, A. The Pascal Visual Object Classes (VOC) Challenge. Int. J. Comput. Vis. 2010, 88, 303–338. [Google Scholar] [CrossRef]
  17. Zhu, P.; Wen, L.; Bian, X.; Ling, H.; Hu, Q. Vision Meets Drones: A Challenge. arXiv 2018, arXiv:1804.07437. [Google Scholar]
  18. Kalra, I.; Singh, M.; Nagpal, S.; Singh, R.; Vatsa, M.; Sujit, P.B. Dronesurf: Benchmark Dataset for Drone-Based Face Recognition. In Proceedings of the 2019 14th IEEE International Conference on Automatic Face & Gesture Recognition (Fg 2019), Lille, France, 14–18 May 2019; pp. 1–7. [Google Scholar]
  19. Glenn, J. Yolov5 Release v6.1. 2022, 2, 7, 10. Available online: https://github.com/ultralytics/yolov5/releases/tag/v6.1 (accessed on 25 August 2022).
  20. Zhu, X.; Lyu, S.; Wang, X.; Zhao, Q. Tph-Yolov5: Improved Yolov5 Based on Transformer Prediction Head for Object Detection on Drone-Captured Scenarios. In Proceedings of the IEEE/CVF International Conference on Computer Vision, Montreal, BC, Canada, 11–17 October 2021; pp. 2778–2788. [Google Scholar]
  21. Akyon, F.C.; Altinuc, S.O.; Temizel, A. Slicing Aided Hyper Inference And Fine-Tuning for Small Object Detection. arXiv 2022, arXiv:2202.06934. [Google Scholar]
  22. Zhang, J.; Huang, J.; Chen, X.; Zhang, D. How To Fully Exploit the Abilities of Aerial Image Detectors. In Proceedings of the IEEE/CVF International Conference on Computer Vision Workshops, Seoul, Korea, 27–28 October 2019. [Google Scholar]
  23. Solovyev, R.; Wang, W.; Gabruseva, T. Weighted Boxes Fusion: Ensembling Boxes From Different Object Detection Models. Image Vis. Comput. 2021, 107, 104117. [Google Scholar] [CrossRef]
  24. Lin, T.Y.; Dollár, P.; Girshick, R.; He, K.; Hariharan, B.; Belongie, S. Feature Pyramid Networks for Object Detection. In Proceedings of the IEEE Conference on Computer Vision And Pattern Recognition, Honolulu, HI, USA, 21–26 July 2017; pp. 2117–2125. [Google Scholar]
  25. Hartigan, J.A.; Wong, M.A. Algorithm as 136: A k-Means Clustering Algorithm. J. R. Stat. Society. Ser. C (Appl. Stat.) 1979, 28, 100–108. [Google Scholar] [CrossRef]
  26. Comaniciu, D.; Meer, P. Mean Shift: A Robust Approach Toward Feature Space Analysis. IEEE Trans. Pattern Anal. Mach. Intell. 2002, 24, 603–619. [Google Scholar] [CrossRef]
  27. Wang, Y.; Yang, Y.; Zhao, X. Object Detection Using Clustering Algorithm Adaptive Searching Regions In Aerial Images. In European Conference on Computer Vision; Springer: Cham, Switzerland, 2020; pp. 651–664. [Google Scholar]
  28. Padilla, R.; Passos, W.L.; Dias, T.L.B.; Netto, S.L.; Da Silva, E.A.B. A Comparative Analysis of Object Detection Metrics with a Companion Open-Source Toolkit. Electronics 2021, 10, 279. [Google Scholar] [CrossRef]
  29. Kingma, D.P.; Ba, J. Adam: A Method for Stochastic Optimization. arXiv 2014, arXiv:1412.6980. [Google Scholar]
  30. Deng, S.; Li, S.; Xie, K.; Song, W.; Liao, X.; Hao, A.; Qin, H. A Global-Local Self-Adaptive Network for Drone-View Object Detection. IEEE Trans. Image Process. 2020, 30, 1556–1569. [Google Scholar] [CrossRef] [PubMed]
  31. Zhang, P.; Zhong, Y.; Li, X. Slimyolov3: Narrower, Faster and Better for Real-Time UAV Applications. In Proceedings of the IEEE/CVF International Conference on Computer Vision Workshops, Seoul, Korea, 27–28 October 2019. [Google Scholar]
  32. Yang, F.; Fan, H.; Chu, P.; Blasch, E.; Ling, H. Clustered Object Detection in Aerial Images. In Proceedings of the IEEE/CVF International Conference on Computer Vision, Seoul, Korea, 27–28 October 2019; pp. 8311–8320. [Google Scholar]
  33. Li, C.; Yang, T.; Zhu, S.; Chen, C.; Guan, S. Density Map Guided Object Detection in Aerial Images. In Proceedings of the IEEE/CVF Conference on Computer Vision and Pattern Recognition Workshops, Seattle, WA, USA, 14–19 June 2020; pp. 190–191. [Google Scholar]
  34. Liao, J.; Piao, Y.; Su, J.; Cai, G.; Huang, X.; Chen, L.; Huang, Z.; Wu, Y. Unsupervised Cluster Guided Object Detection in Aerial Images. IEEE J. Sel. Top. Appl. Earth Obs. Remote Sens. 2021, 14, 11204–11216. [Google Scholar] [CrossRef]
Figure 1. The pipeline of ARSD. The ORDN predicts overall bounding boxes from the original image, which is used for the subsequent region selection. FPDCA can cluster the center point of the overall bounding boxes to obtain candidate sub-regions. ASSA then filters sub-regions that needed to be detected in KRDN. The light blue box represents the additional head of KRDN. Finally, the small object bounding boxes obtained in KRDN are merged with the overall bounding boxes by Weighted Boxes Fusion (WBF) [23] and generate the final result.
Drones 06 00228 g001
Figure 2. The left and right images should have the same target density.
Drones 06 00228 g002
Figure 3. Points of the same color indicate the center of the bounding box which belongs to the same sub-region. The obscurer the sub-regions, the lower the ASSA score.
Drones 06 00228 g003
Figure 4. The qualitative comparisons among the detection results from baseline (b,d) and our method (a,c) on the validation set of the VisDrone2021-DET dataset.
Drones 06 00228 g004aDrones 06 00228 g004b
Figure 5. The qualitative comparisons among the clusters result from different cluster methods on the test set of the VisDrone2021-DET dataset. For each testing image, we show the cluster results of the proposed method (a) and Mean-Shift (b).
Drones 06 00228 g005aDrones 06 00228 g005b
Figure 6. The comparison between the mAP of YOLOv5n, YOLOv5m, and YOLOv5m-AH for the same time consumption.
Drones 06 00228 g006
Figure 7. The comparison of 768 × 768 YOLOv5m, 640 × 640 YOLOv5m-AH, and our method for each category.
Drones 06 00228 g007aDrones 06 00228 g007b
Table 1. AP50 comparison of each class among ARSD and other one-stage methods.
MethodPedestrianPeopleBicycleCarVanTruckTricycleAwning-TricycleBusMotorAverage
AP50
YOLOV318.19.9256.617.517.66.72.932.41717.1
SlimYOLOv3 [31]17.49.32.455.718.316.99.1326.91717.6
Faster-RCNN21.712.711.563.237.829.922.512.350.628.429.1
FPN3325.813.969.44034.327.413.449.137.635.6
YOLOv5m45.235.713.777.84137.920.710.850.930.136.8
YOLOv5l-TPH53.529.725.98755.361.534.931.273.550.650.3
ARSD68.856.840.6888.1761.5353.744926.1972.7861.357.9
Table 2. Comparison with state-of-the-art object detection methods in the VisDrone2021-DET validation set.
MethodAPAP50AP75AP↗AP50↗AP75↗
ClusDet [32]26.750.624.78.347.311.91
DMNet [33]28.247.628.96.8410.37.71
UCGNet [34]32.853.133.92.244.82.71
GLASN [31]32.555.8332.542.13.61
ARSD35.0457.936.61---
Table 3. Results with different cluster methods, clusters, and remaining sub-regions. Note: (x) indicates the ratio of sub-regions being discarded.
MethodsCluster MethodsNumber of ClustersCandidate Sub-RegionsRemaining Sub-RegionsAPAP50
1K-meansK-means34830483022.6440.6
2DNSCANMean-Shift-5559555922.3140.1
3ARSDFPDCA232203220 (0)20.5937.76
4ARSDFPDCA232202146 (1/3)19.1635.63
5ARSDFPDCA232201610 (1/2)18.3333.4
6ARSDFPDCA348304830 (0)22.9341.31
7ARSDFPDCA348303220 (1/3)21.639.6
8ARSDFPDCA348302415 (1/2)20.0537.1
9ARSDFPDCA464406440 (0)23.941.92
10ARSDFPDCA464404293 (1/3)22.3240.15
11ARSDFPDCA464403220 (1/2)21.1237.86
Publisher’s Note: MDPI stays neutral with regard to jurisdictional claims in published maps and institutional affiliations.

