Repurposing Existing Infrastructure for Urban Air Mobility: A Scenario Analysis in Southern California
Abstract
:1. Introduction
2. Literature Review
2.1. Demand-Side Factors Associated with UAM or GAV Adoption
2.2. Supply-Side Factors Related to UAM Adoption
3. Data and Analysis
3.1. Study Area
3.2. Data
3.3. Scenario Design
4. Results
5. Conclusions and Discussion
Funding
Data Availability Statement
Conflicts of Interest
Appendix A. Summary Statistics of UAM Scenario Analysis
| ID | Scenarios (3 × 3 × 3 = 27) | Helipads | Parking Structures | Total | % Base |
|---|---|---|---|---|---|
| 1 | A1*S1*N1 (the best) | 262 | 236 | 498 | 61.9% |
| 2 | A1*S1*N2 | 261 | 234 | 495 | 61.6% |
| 3 | A1*S1*N3 | 250 | 227 | 477 | 59.3% |
| 4 | A1*S2*N1 | 222 | 163 | 385 | 47.9% |
| 5 | A1*S2*N2 | 221 | 162 | 383 | 47.6% |
| 6 | A1*S2*N3 | 214 | 159 | 373 | 46.4% |
| 7 | A1*S3*N1 | 170 | 66 | 236 | 29.4% |
| 8 | A1*S3*N2 | 169 | 66 | 235 | 29.2% |
| 9 | A1*S3*N3 | 167 | 65 | 232 | 28.9% |
| 10 | A2*S1*N1 | 251 | 210 | 461 | 57.3% |
| 11 | A2*S1*N2 | 250 | 208 | 458 | 57.0% |
| 12 | A2*S1*N3 | 243 | 202 | 445 | 55.3% |
| 13 | A2*S2*N1 | 218 | 149 | 367 | 45.6% |
| 14 | A2*S2*N2 (the median) | 217 | 148 | 365 | 45.4% |
| 15 | A2*S2*N3 | 210 | 145 | 355 | 44.2% |
| 16 | A2*S3*N1 | 169 | 60 | 229 | 28.5% |
| 17 | A2*S3*N2 | 168 | 60 | 228 | 28.4% |
| 18 | A2*S3*N3 | 154 | 56 | 210 | 26.1% |
| 19 | A3*S1*N1 | 233 | 192 | 425 | 52.9% |
| 20 | A3*S1*N2 | 232 | 190 | 422 | 52.5% |
| 21 | A3*S1*N3 | 227 | 184 | 411 | 51.1% |
| 22 | A3*S2*N1 | 201 | 135 | 336 | 41.8% |
| 23 | A3*S2*N2 | 200 | 134 | 334 | 41.5% |
| 24 | A3*S2*N3 | 195 | 131 | 326 | 40.5% |
| 25 | A3*S3*N1 | 157 | 57 | 214 | 26.6% |
| 26 | A3*S3*N2 | 156 | 57 | 213 | 26.5% |
| 27 | A3*S3*N3 (the strictest) | 154 | 56 | 210 | 26.1% |
| Supply-A1*S1*N1 (Best) | Home Access Only | Workplace Access Only | Both Home and Workplace Access | Home Access/Workplace Access Ratio |
|---|---|---|---|---|
| ≤3 min walking distance | 0.48% | 8.35% | 0.03% | 5.72% |
| ≤5 min walking distance | 1.00% | 11.66% | 0.11% | 8.58% |
| ≤10 min walking distance | 2.81% | 17.43% | 0.57% | 16.14% |
| ≤3 min driving distance | 6.57% | 23.09% | 2.24% | 28.45% |
| ≤5 min driving distance | 15.10% | 30.69% | 11.68% | 49.20% |
| ≤10 min driving distance | 10.93% | 18.34% | 64.02% | 59.59% |
| Supply-A2*S2*N2 (Median) | Home Access Only | Workplace Access Only | Both Home and Workplace Access | Home Access/Workplace Access Ratio |
| ≤3 min walking distance | 0.30% | 6.47% | 0.01% | 4.70% |
| ≤5 min walking distance | 0.64% | 8.99% | 0.05% | 7.12% |
| ≤10 min walking distance | 1.79% | 13.12% | 0.23% | 13.64% |
| ≤3 min driving distance | 4.70% | 18.02% | 1.03% | 26.05% |
| ≤5 min driving distance | 12.57% | 27.16% | 6.41% | 46.27% |
| ≤10 min driving distance | 16.57% | 24.38% | 47.61% | 67.94% |
| Supply-A3*S3*N3 (Strictest) | Home Access Only | Workplace Access Only | Both Home and Workplace Access | Home Access/Workplace Access Ratio |
| ≤3 min walking distance | 0.09% | 1.64% | 0.00% | 5.26% |
| ≤5 min walking distance | 0.22% | 2.73% | 0.01% | 7.92% |
| ≤10 min walking distance | 0.66% | 6.04% | 0.04% | 10.90% |
| ≤3 min driving distance | 2.17% | 9.85% | 0.23% | 22.01% |
| ≤5 min driving distance | 7.86% | 18.74% | 2.07% | 41.94% |
| ≤10 min driving distance | 22.12% | 27.39% | 24.87% | 80.76% |
| Supply-A1*S1*N1 (Best) | Home Access Only | Workplace Access Only | Both Home and Workplace Access | Home Access/Workplace Access Ratio |
|---|---|---|---|---|
| ≤3 min walking distance | 0.40% | 7.85% | 0.02% | 5.05% |
| ≤5 min walking distance | 0.84% | 10.92% | 0.08% | 7.71% |
| ≤10 min walking distance | 2.43% | 16.64% | 0.42% | 14.61% |
| ≤3 min driving distance | 6.00% | 22.36% | 1.92% | 26.85% |
| ≤5 min driving distance | 14.45% | 30.88% | 10.65% | 46.79% |
| ≤10 min driving distance | 11.85% | 21.42% | 60.93% | 55.31% |
| Supply-A2*S2*N2 (Median) | Home Access Only | Workplace Access Only | Both Home and Workplace Access | Home Access/Workplace Access Ratio |
| ≤3 min walking distance | 0.26% | 6.17% | 0.01% | 4.13% |
| ≤5 min walking distance | 0.54% | 8.52% | 0.04% | 6.39% |
| ≤10 min walking distance | 1.54% | 12.57% | 0.21% | 12.28% |
| ≤3 min driving distance | 4.24% | 17.44% | 1.02% | 24.33% |
| ≤5 min driving distance | 11.85% | 26.78% | 6.28% | 44.26% |
| ≤10 min driving distance | 16.48% | 25.71% | 46.34% | 64.10% |
| Supply-A3*S3*N3 (Strictest) | Home Access Only | Workplace Access Only | Both Home and Workplace Access | Home Access/Workplace Access Ratio |
| ≤3 min walking distance | 0.09% | 1.67% | 0.00% | 5.26% |
| ≤5 min walking distance | 0.21% | 2.77% | 0.01% | 7.65% |
| ≤10 min walking distance | 0.62% | 6.06% | 0.04% | 10.22% |
| ≤3 min driving distance | 2.12% | 9.88% | 0.26% | 21.47% |
| ≤5 min driving distance | 7.92% | 18.67% | 2.19% | 42.43% |
| ≤10 min driving distance | 21.68% | 27.21% | 25.72% | 79.68% |
| Supply-A1*S1*N1 (Best) | Home Access Only | Workplace Access Only | Both Home and Workplace Access | Home Access/Workplace Access Ratio |
|---|---|---|---|---|
| ≤3 min walking distance | 0.37% | 7.29% | 0.02% | 5.08% |
| ≤5 min walking distance | 0.81% | 10.10% | 0.06% | 8.00% |
| ≤10 min walking distance | 2.38% | 15.54% | 0.33% | 15.33% |
| ≤3 min driving distance | 6.02% | 21.37% | 1.59% | 28.16% |
| ≤5 min driving distance | 14.80% | 30.50% | 9.55% | 48.52% |
| ≤10 min driving distance | 12.66% | 23.28% | 58.29% | 54.39% |
| Supply-A2*S2*N2 (Median) | Home Access Only | Workplace Access Only | Both Home and Workplace Access | Home Access/Workplace Access Ratio |
| ≤3 min walking distance | 0.24% | 5.78% | 0.01% | 4.11% |
| ≤5 min walking distance | 0.52% | 7.91% | 0.03% | 6.62% |
| ≤10 min walking distance | 1.50% | 11.75% | 0.15% | 12.78% |
| ≤3 min driving distance | 4.21% | 16.69% | 0.80% | 25.24% |
| ≤5 min driving distance | 12.03% | 26.37% | 5.37% | 45.64% |
| ≤10 min driving distance | 17.32% | 27.35% | 43.49% | 63.33% |
| Supply-A3*S3*N3 (Strictest) | Home Access Only | Workplace Access Only | Both Home and Workplace Access | Home Access/Workplace Access Ratio |
| ≤3 min walking distance | 0.09% | 1.59% | 0.00% | 5.38% |
| ≤5 min walking distance | 0.21% | 2.60% | 0.00% | 8.12% |
| ≤10 min walking distance | 0.59% | 5.68% | 0.03% | 10.39% |
| ≤3 min driving distance | 2.04% | 9.41% | 0.21% | 21.66% |
| ≤5 min driving distance | 7.85% | 18.04% | 1.92% | 43.54% |
| ≤10 min driving distance | 22.10% | 27.91% | 23.75% | 79.18% |
References
- Robert, W. The History of New York Airways’ Helicopter Operations. Metropolitan Airport News, 11 November 2021. Available online: https://metroairportnews.com/the-history-of-new-york-airways-helicopter-operations(accessed on 2 March 2022).
- Cohen, A.P.; Shaheen, S.A.; Farrar, E.M. Urban air mobility: History, ecosystem, market potential, and challenges. IEEE Trans. Intell. Transp. Syst. 2021, 22, 6074–6087. [Google Scholar] [CrossRef]
- McFadden, R.M. Five Killed as GOPTER on Pan Am Building Throws Rotor Blade. Available online: https://www.nytimes.com/1977/05/17/archives/5-killed-as-copter-on-pan-am-building-throws-rotor-blade-one-victim.html (accessed on 10 January 2022).
- Thipphavong, D.P.; Apaza, R.; Barmore, B.; Battiste, V.; Burian, B.; Dao, Q.; Feary, M.; Go, S.; Goodrich, K.H.; Homola, J.; et al. Urban Air Mobility Airspace Integration Concepts and Considerations. In Proceedings of the 2018 Aviation Technology, Integration, and Operations Conference, Atlanta, GA, USA, 25–29 June 2018; American Institute of Aeronautics and Astronautics: Reston, VA, USA, 2018. [Google Scholar] [CrossRef] [Green Version]
- Antcliff, K.R.; Moore, M.D.; Goodrich, K.H. Silicon Valley as an Early Adopter for on-Demand Civil VTOL Operations. In Proceedings of the 16th AIAA Aviation Technology, Integration, and Operations Conference, Washington, DC, USA, 13–17 June 2016; American Institute of Aeronautics and Astronautics: Reston, VA, USA, 2016. [Google Scholar] [CrossRef] [Green Version]
- Kasliwal, A.; Furbush, N.J.; Gawron, J.H.; McBride, J.R.; Wallington, T.J.; De Kleine, R.D.; Kim, H.C.; Keoleian, G.A. Role of Flying Cars in Sustainable Mobility. Nat. Commun. 2019, 10, 1555. [Google Scholar] [CrossRef] [PubMed] [Green Version]
- Reiche, C.; Goyal, R.; Cohen, A.; Serrao, J.; Kimmel, S.; Fernando, C.; Shaheen, S. Urban Air Mobility Market Study; National Aeronautics and Space Administration (NASA): Berkeley, CA, USA, 2018. [CrossRef]
- Wayne, J.; Christopher, S. Observations from Exploration of VTOL Urban Air Mobility Designs-NASA Technical Reports Server (NTRS). NASA Technical Reports Server (NTRS); 30 October 2018. Available online: https://ntrs.nasa.gov/search.jsp?R=20180007847 (accessed on 11 January 2022).
- Pradeep, P.; Wei, P. Energy Efficient Arrival with RTA Constraint for Urban eVTOL Operations. In Proceedings of the 2018 AIAA Aerospace Sciences Meeting, Kissimmee, FL, USA, 8–12 January 2018; American Institute of Aeronautics and Astronautics: Reston, VA, USA, 2018. [Google Scholar] [CrossRef] [Green Version]
- Rajendran, S.; Zack, J. Insights on Strategic Air Taxi Network Infrastructure Locations Using an Iterative Constrained Clustering Approach. Transp. Res. Part E Logist. Transp. Rev. 2019, 128, 470–505. [Google Scholar] [CrossRef]
- Goyal, R.; Reiche, C.; Fernando, C.; Cohen, A. Advanced air mobility: Demand analysis and market potential of the airport shuttle and air taxi markets. Sustainability 2021, 13, 7421. [Google Scholar] [CrossRef]
- US Census Bureau. Longitudinal Employer-Household Dynamics. 7 November 2020. Available online: https://lehd.ces.census.gov/data/ (accessed on 2 January 2022).
- Vascik, P.D.; Hansman, R.J.; Dunn, N.S. Analysis of urban air mobility operational constraints. J. Air Transp. 2018, 26, 133–146. [Google Scholar] [CrossRef]
- Bansal, P.; Kockelman, K.M.; Singh, A. Assessing Public Opinions of and Interest in New Vehicle Technologies: An Austin Perspective. Transp. Res. Part C Emerg. Technol. 2016, 67, 1–14. [Google Scholar] [CrossRef]
- Hohenberger, C.; Spörrle, M.; Welpe, I.M. How and Why Do Men and Women Differ in Their Willingness to Use Automated Cars? The Influence of Emotions Across Different Age Groups. Transp. Res. Part A Policy Pract. 2016, 94, 374–385. [Google Scholar] [CrossRef]
- Kyriakidis, M.; Happee, R.; de Winter, J.C.F. Public Opinion on Automated Driving: Results of an International Questionnaire Among 5000 Respondents. Transp. Res. Part F Traffic Psychol. Behav. 2015, 32, 127–140. [Google Scholar] [CrossRef]
- Zhang, T.; Tao, D.; Qu, X.; Zhang, X.; Lin, R.; Zhang, W. The Roles of Initial Trust and Perceived Risk in Public’s Acceptance of Automated Vehicles. Transp. Res. Part C Emerg. Technol. 2019, 98, 207–220. [Google Scholar] [CrossRef]
- Moody, J.; Bailey, N.; Zhao, J. Public Perceptions of Autonomous Vehicle Safety: An International Comparison. Saf. Sci. 2020, 121, 634–650. [Google Scholar] [CrossRef]
- Al Haddad, C.; Chaniotakis, E.; Straubinger, A.; Plötner, K.; Antoniou, C. Factors Affecting the Adoption and Use of Urban Air Mobility. Transp. Res. Part A Policy Pract. 2020, 132, 696–712. [Google Scholar] [CrossRef]
- Fu, M.; Rothfeld, R.; Antoniou, C. Exploring Preferences for Transportation Modes in an Urban Air Mobility Environment: Munich Case Study. Transp. Res. Rec. J. Transp. Res. Board 2019, 2673, 427–442. [Google Scholar] [CrossRef] [Green Version]
- Roy, S.; Kotwicz Herniczek, M.; German, B.; Garrow, L.A. User base estimation methodology for an evtol business airport shuttle air taxi service. In AIAA Aviation 2020 Forum; American Institute of Aeronautics and Astronautics: Reston, VA, USA, 2020. [Google Scholar] [CrossRef]
- Robin, L.; Aijaz, H. Urban Air Mobility Consumer Perceptions. Deloitte United States, October 2019. Available online: https://www2.deloitte.com/us/en/pages/energy-and-resources/articles/consumer-perception-urban-air-mobility.html (accessed on 5 April 2022).
- Lidynia, C.; Philipsen, R.; Ziefle, M. Droning on About Drones—Acceptance of and Perceived Barriers to Drones in Civil Usage Contexts. In Advances in Intelligent Systems and Computing; Springer International Publishing: Cham, Switzerland, 2016; pp. 317–329. [Google Scholar] [CrossRef]
- Peeta, S.; Paz, A.; DeLaurentis, D. Stated Preference Analysis of a New Very Light Jet Based on-Demand Air Service. Transp. Res. Part A Policy Pract. 2008, 42, 629–645. [Google Scholar] [CrossRef] [Green Version]
- Rimjha, M.; Hotle, S.; Trani, A.A.; Hinze, N.; Smith, J.C. Urban Air Mobility Demand Estimation for Airport Access: A Los Angeles International Airport Case Study. In Proceedings of the 2021 Integrated Communications Navigation and Surveillance Conference (ICNS), Dulles, VA, USA, 19–23 April 2021. [Google Scholar] [CrossRef]
- Vascik, P.D.; Hansman, R.J. Scaling Constraints for Urban Air Mobility Operations: Air Traffic Control, Ground Infrastructure, and Noise. In Proceedings of the 2018 Aviation Technology, Integration, and Operations Conference, Atlanta, GA, USA, 25–29 June 2018; American Institute of Aeronautics and Astronautics: Reston, VA, USA, 2018. [Google Scholar] [CrossRef]
- Fadhil, D.N.; Moeckel, R.; Rothfeld, R. GIS-based Infrastructure Requirement Analysis for an Electric Vertical Take-Off and Landing Vehicle-Based Transportation System. Transp. Res. Procedia 2019, 41, 101–103. [Google Scholar] [CrossRef]
- Rath, S.; Chow, J.Y.J. Air Taxi Skyport Location Problem with Single-Allocation Choice-Constrained Elastic Demand for Airport Access. J. Air Transp. Manag. 2022, 105, 102294. [Google Scholar] [CrossRef]
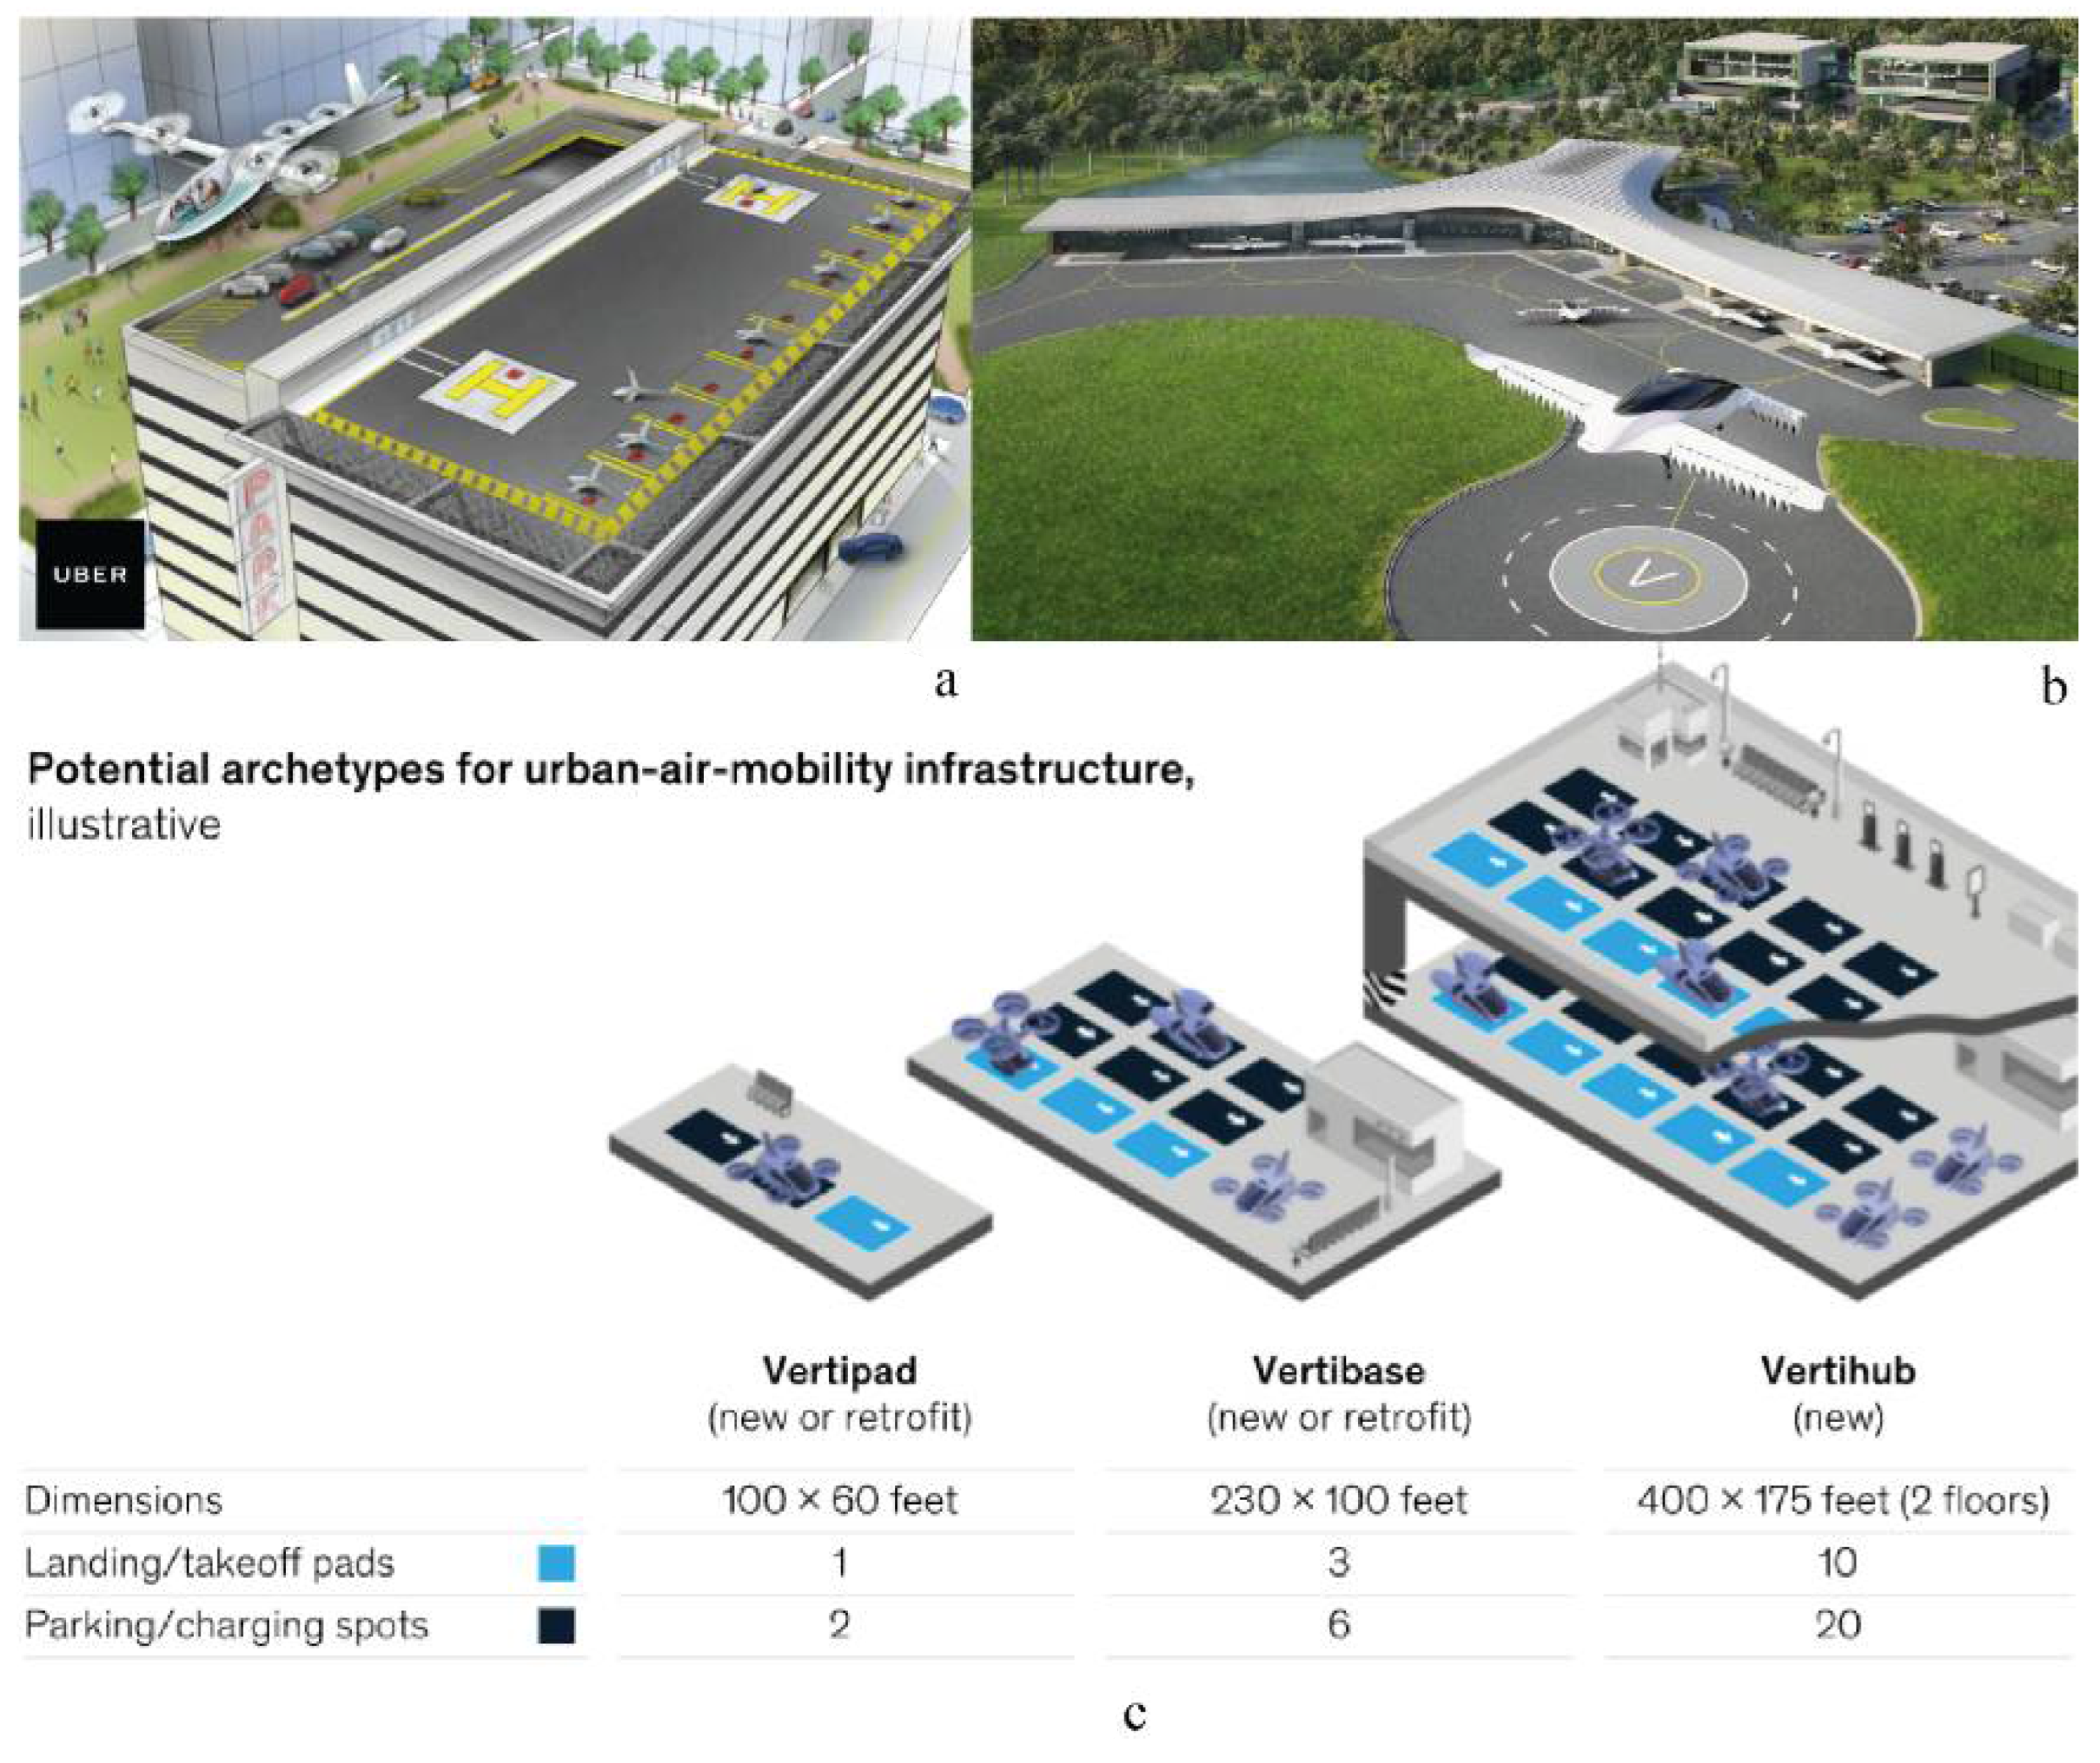
- Jeff, H.; Nikhil, G. Fast-Forwarding to a Future of on-Demand Urban Air Transportation. Uber, 27 October 2016. Available online: https://evtol.news/__media/PDFs/UberElevateWhitePaperOct2016.pdf(accessed on 9 March 2022).
- Tavistock Development Company. Lilium Lake Nona Vertiport. 11 November 2020. Available online: https://tavistockdevelopment.com/project/lilium-lake-nona-vertiport/ (accessed on 10 May 2022).
- Johnston, T.; Riedel, R.; Sahdev, S. To Take Off, Flying Vehicles First Need Places to Land. McKinsey & Company: 31 August 2020. Available online: https://www.mckinsey.com/industries/automotive-and-assembly/our-insights/to-take-off-flying-vehicles-first-need-places-to-land (accessed on 8 March 2022).
- Yedavalli, P.; Cohen, A. Planning land use constrained networks of urban air mobility infrastructure in the San Francisco bay area. Transp. Res. Rec. J. Transp. Res. Board 2022, 2676, 106–116. [Google Scholar] [CrossRef]
- City of Los Angeles. Mayor Garcetti Announces First-in-the-Nation Urban Air Mobility Partnership. Office of Los Angeles Mayor: 16 December 2020. Available online: https://www.lamayor.org/mayor-garcetti-announces-first-nation-urban-air-mobility-partnership (accessed on 4 April 2022).
- United States Census Bureau. 2014-2018 ACS 5-Year Estimates. Census.gov; 2018. Available online: https://www.census.gov/programs-surveys/acs/technical-documentation/table-and-geography-changes/2018/5-year.html (accessed on 24 December 2022).
- Federal Aviation Administration. Airport Data and Information Portal. 6 January 2020. Available online: https://adip.faa.gov/agis/public/#/public (accessed on 21 February 2022).
- Federal Aviation Administration. UAS Facility Maps. 27 May 2022. Available online: https://www.faa.gov/uas/commercial_operators/uas_facility_maps (accessed on 10 August 2022).
- Jeff, V.; Stanford Prevention Research Center. California Schools Map. March 2021. Available online: https://www.californiaschoolcampusdatabase.org/ (accessed on 2 March 2022).
- National Center for Environmental Health. What Noises Cause Hearing Loss? Centers for Disease Control and Prevention: 7 October 2019. Available online: https://www.cdc.gov/nceh/hearing_loss/what_noises_cause_hearing_loss.html (accessed on 16 February 2022).
- Schweiger, K.; Preis, L. Urban Air Mobility: Systematic Review of Scientific Publications and Regulations for Vertiport Design and Operations. Drones 2022, 6, 179. [Google Scholar] [CrossRef]
- Li, X.; Kim, J.H. Managing Disruptive Technologies: Exploring the Patterns of Local Drone Policy Adoption in California. Cities 2022, 126, 103736. [Google Scholar] [CrossRef]
- Çetin, E.; Cano, A.; Deransy, R.; Tres, S.; Barrado, C. Implementing Mitigations for Improving Societal Acceptance of Urban Air Mobility. Drones 2022, 6, 28. [Google Scholar] [CrossRef]
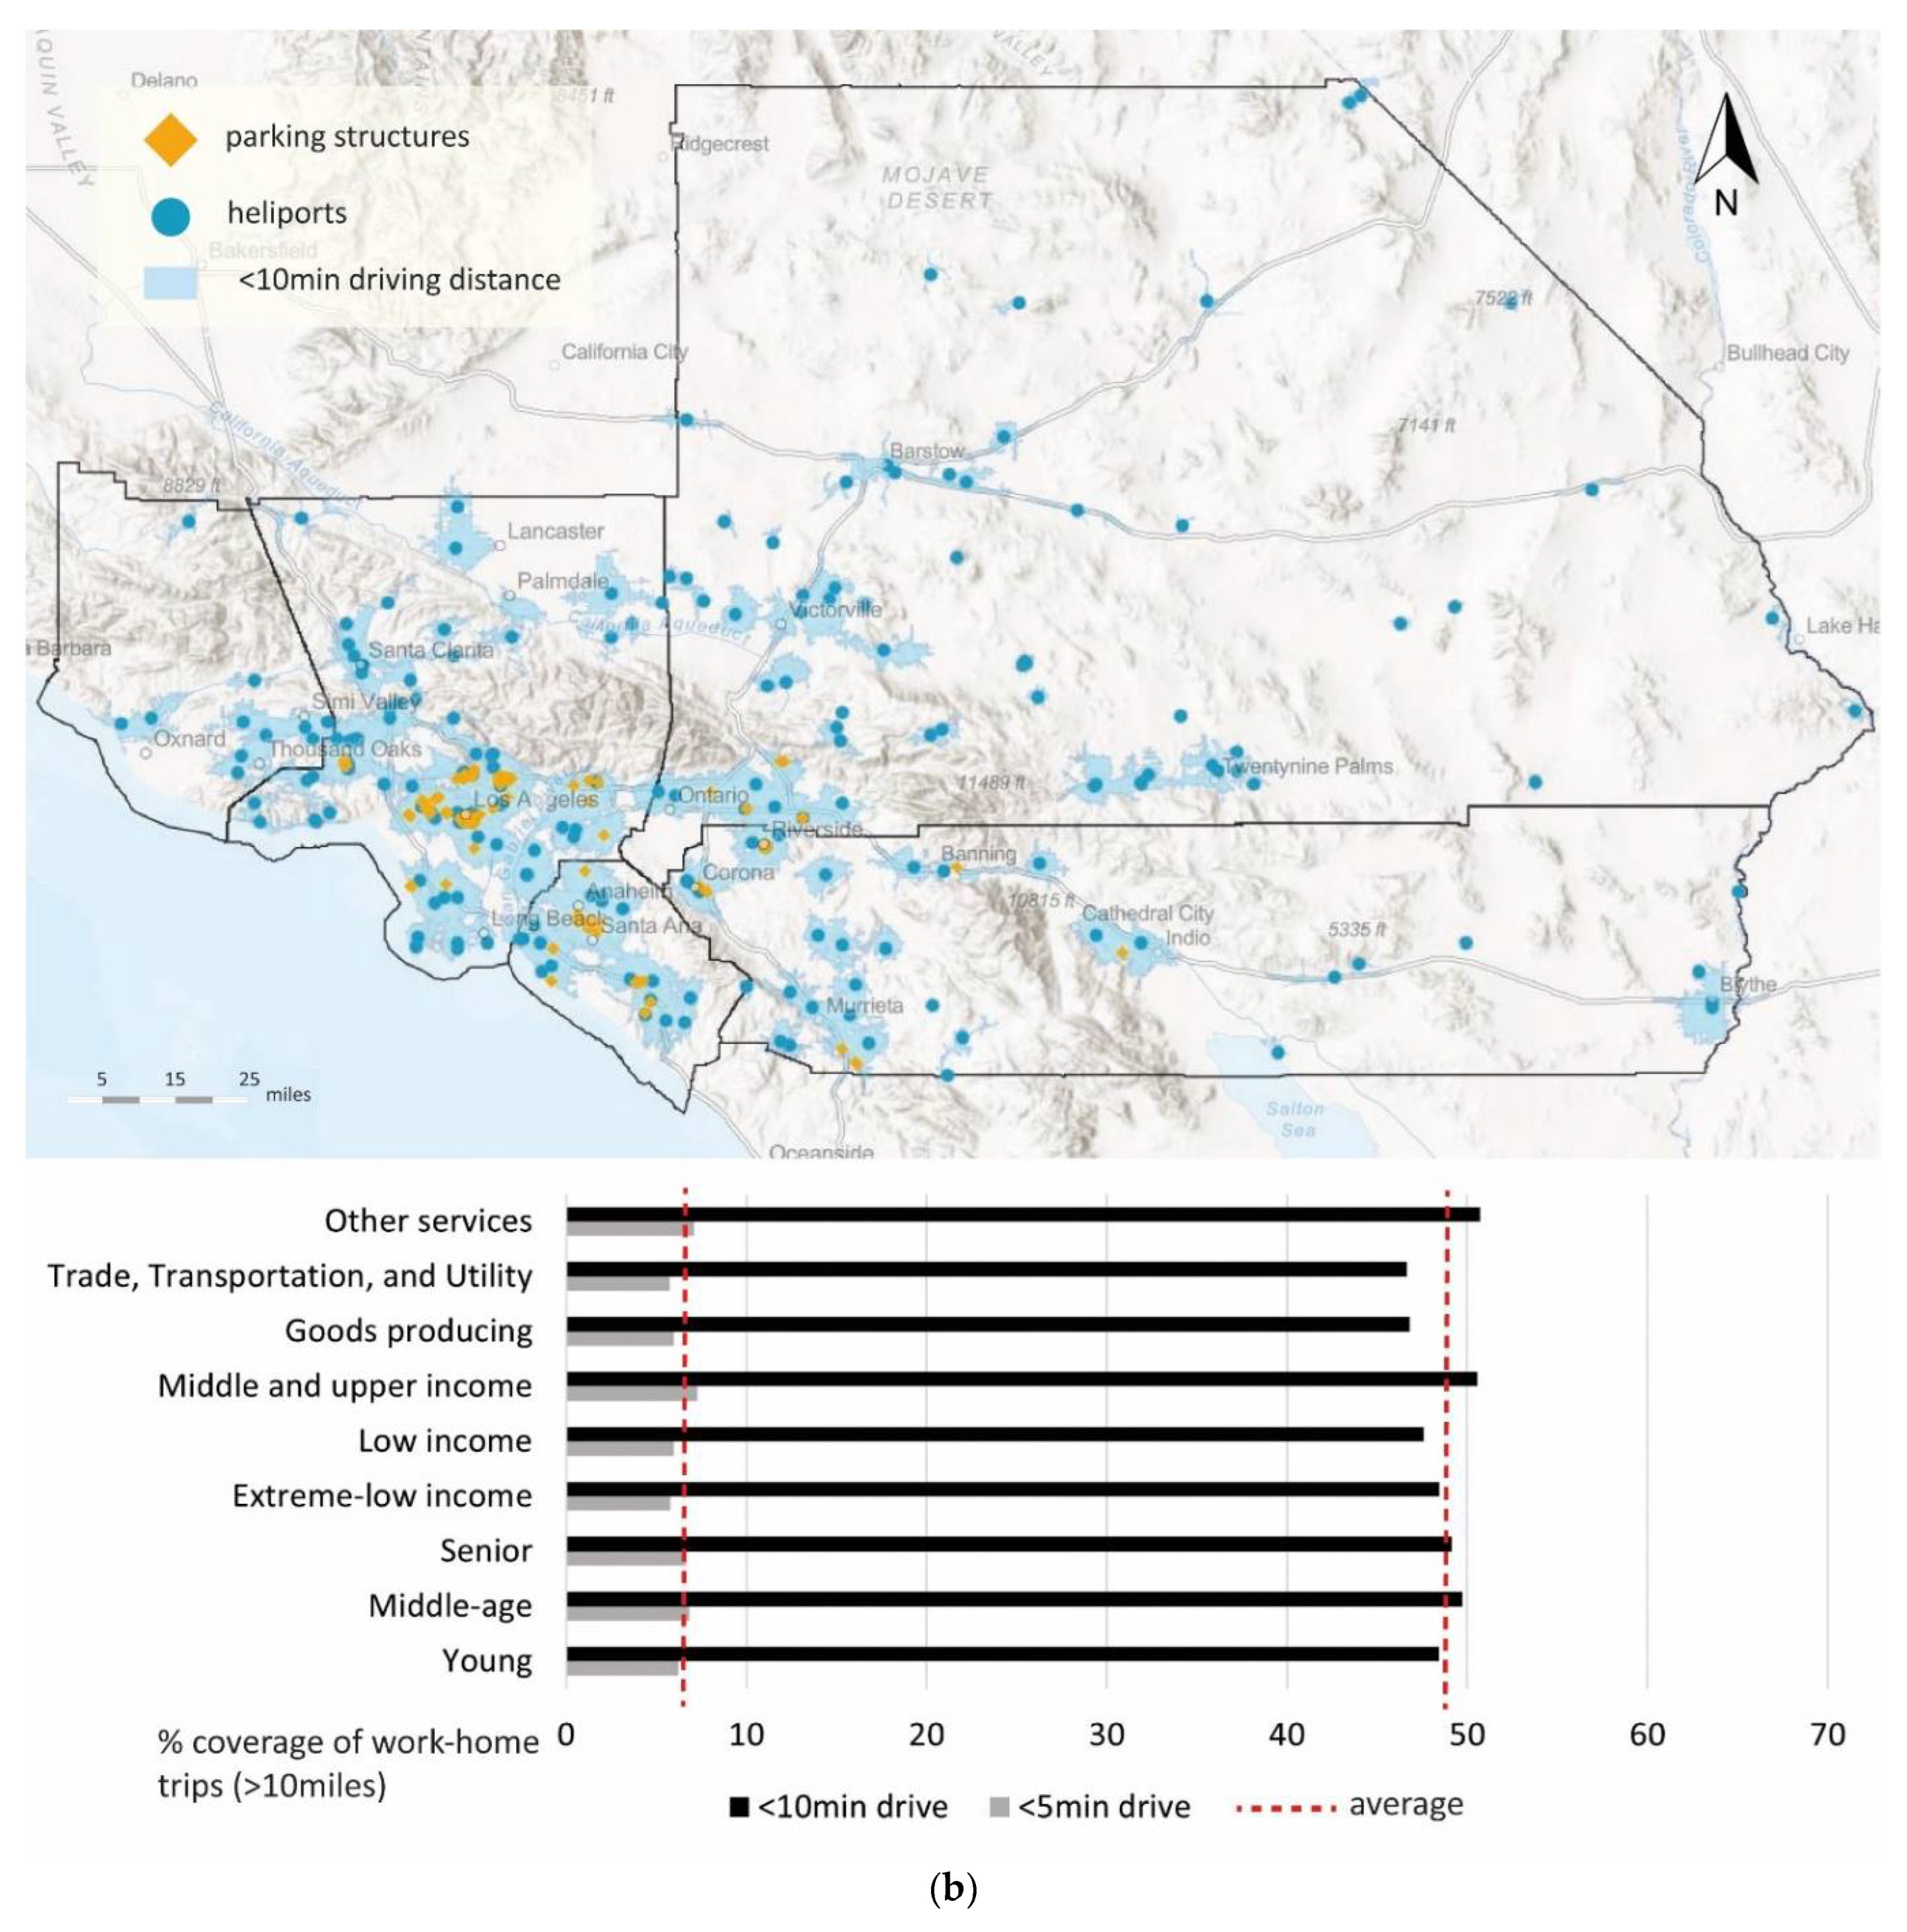
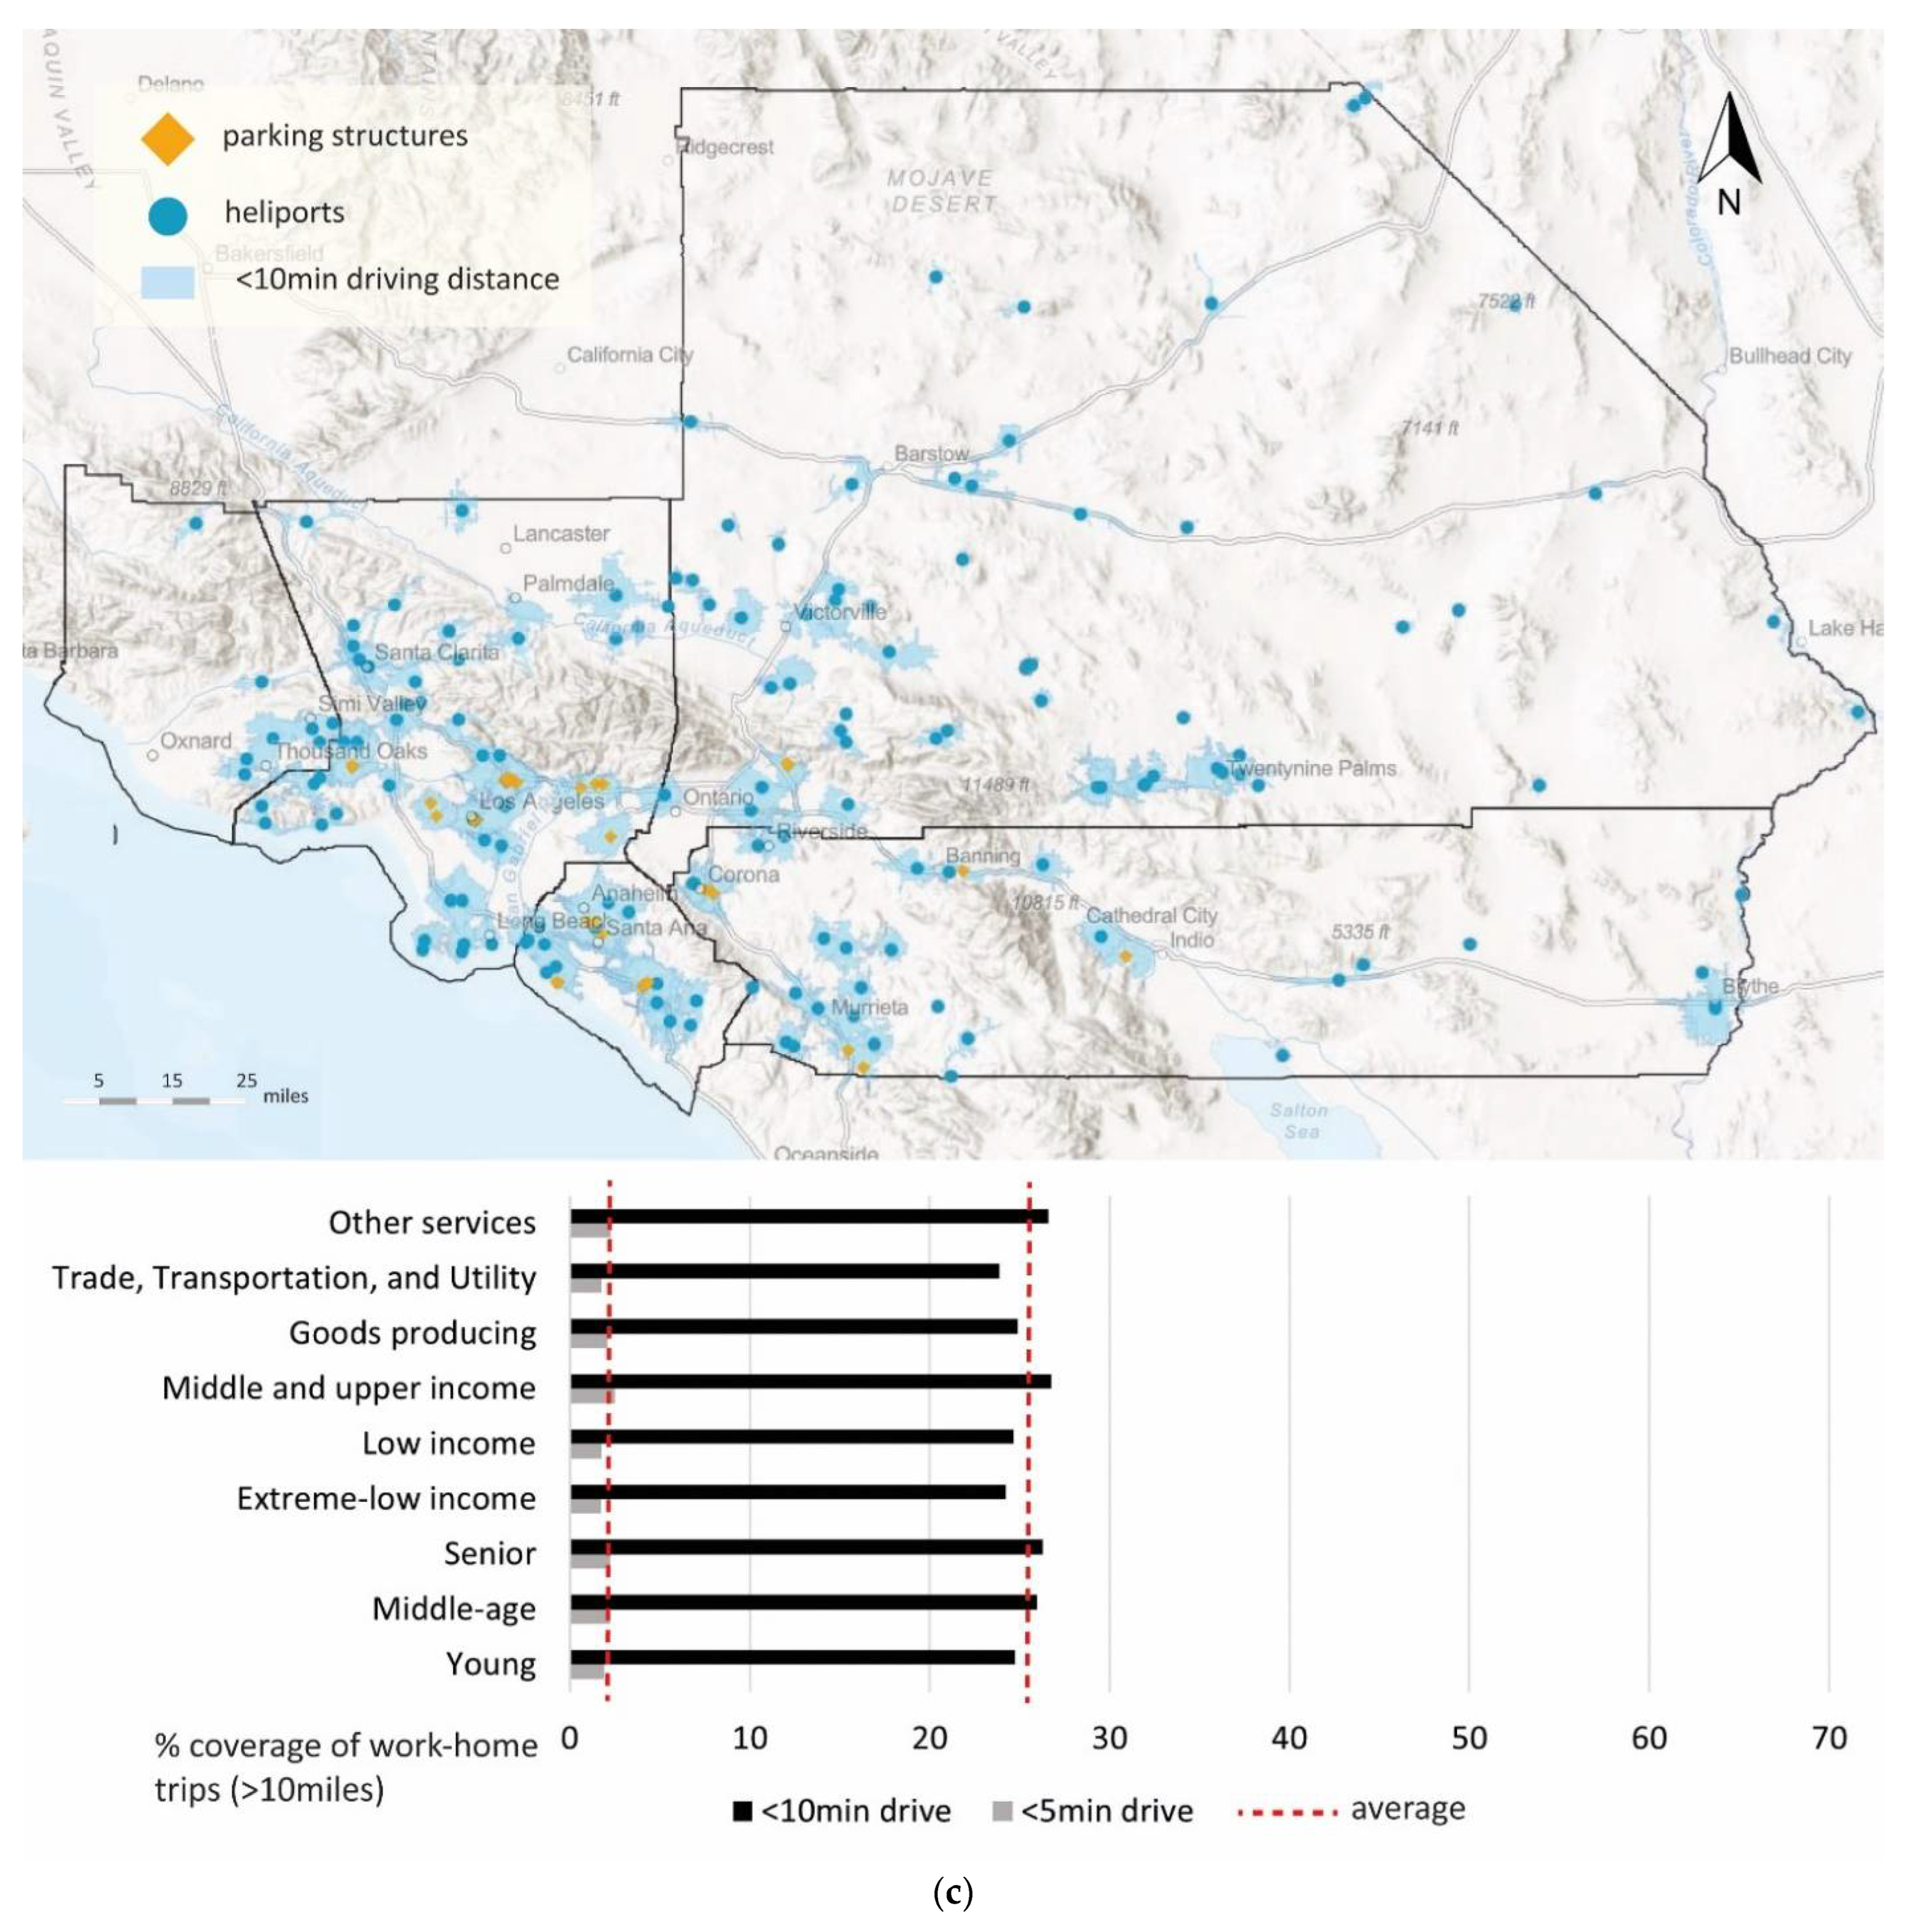
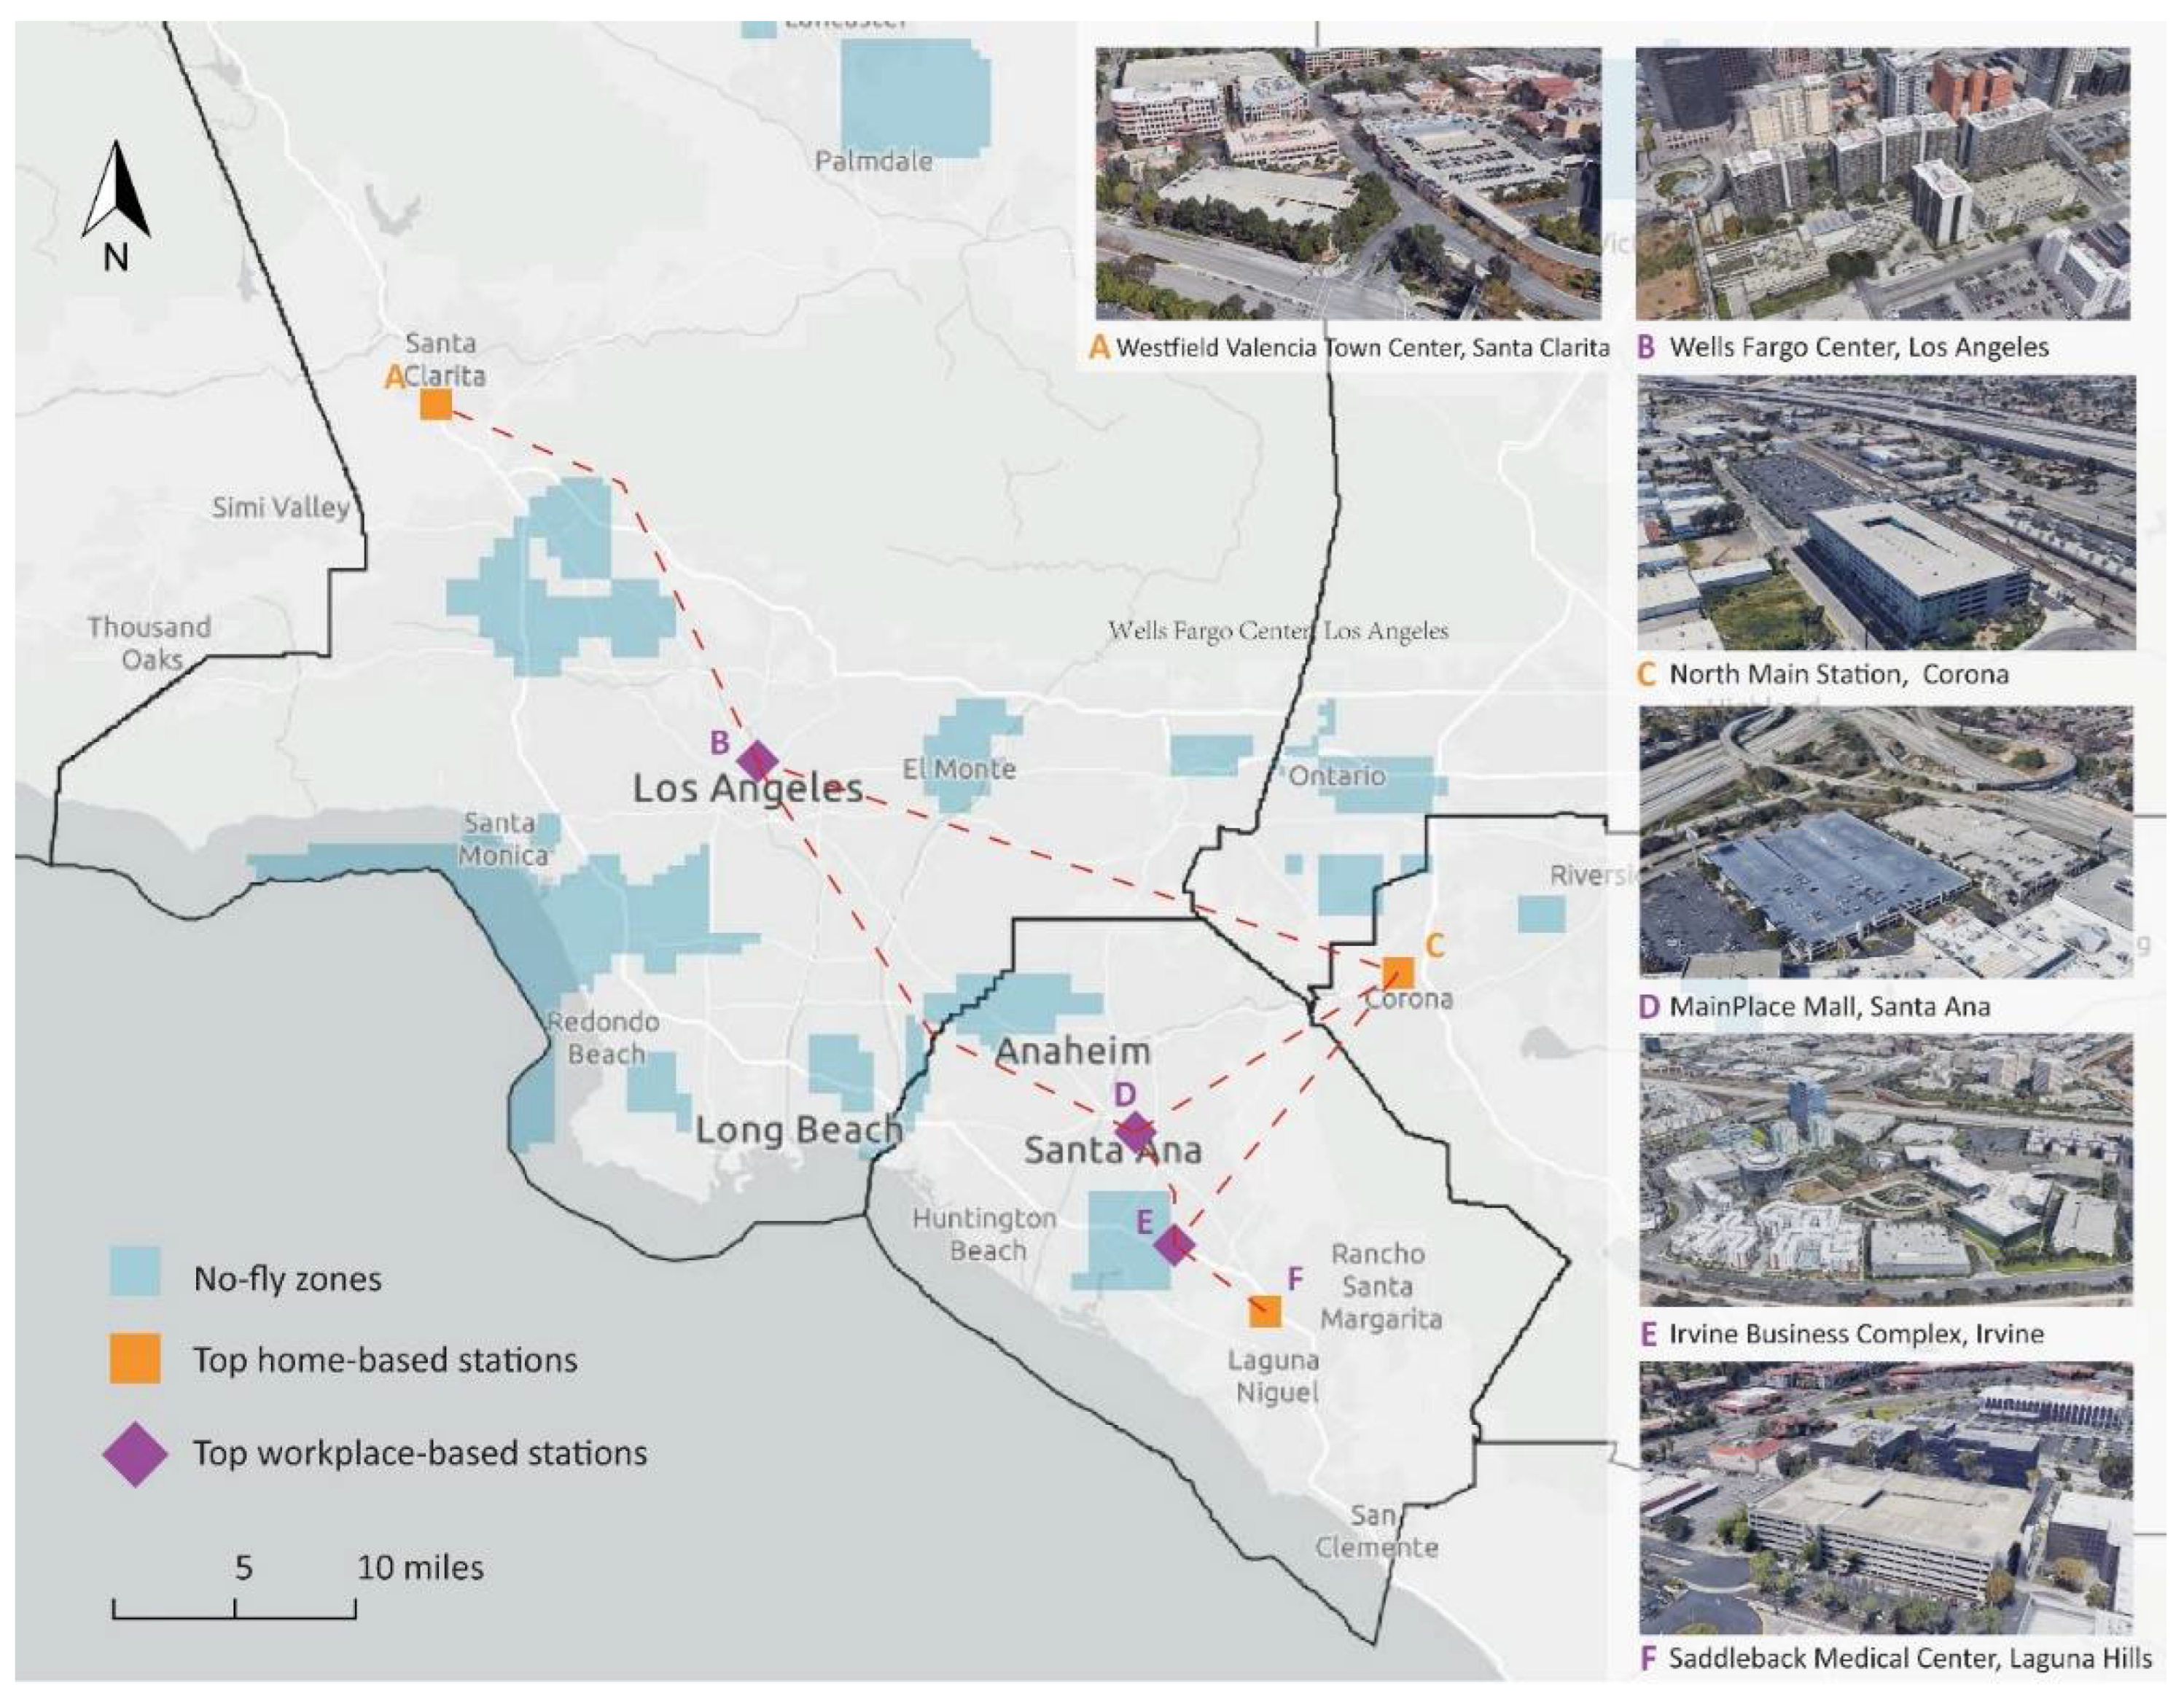
| Authors | Year of Publication | Area of Research | Study Area | Key Findings |
|---|---|---|---|---|
| Al Haddad et al. | 2020 | UAM | Germany | (1) Safety and trust, affinity to automation, data concerns, social attitude, and sociodemographics are important issues for UAM adoption; (2) skeptical respondents had behavior similar to late and nonadopters [19]. |
| Bansal et al. | 2016 | GAV | Austin, Texas | (1) Higher-income, technology-savvy males who live in urban areas and those who have experienced more crashes have a greater interest in and higher willingness to pay for AV; (2) user choice is dependent on friends’ and neighbors’ adoption rates [14]. |
| Fu et al. | 2019 | UAM | Munich, Germany | (1) Travel cost and safety may be critical determinants in UAM adoption; (2) younger individuals as well as older individuals with high household income are more likely to adopt UAM; 3) during the market entry stage, potential travelers may favor UAM particularly for performing noncommuting (recreational flying) trips [20]. |
| Roy et al. | 2019 | UAM | U.S. (CSAs) | (1) Near-term eVTOL aircrafts may be able to dramatically increase the expected user base compared to present-day helicopters flying the same mission; (2) assumptions including vehicle design range, payload, and cruising speed can change the results significantly [21]. |
| Hohenberger et al. | 2016 | GAV | Germany | (1) The anxiety level has a significant gender-related difference towards AV adoption; (2) differential effect of sex on anxiety was more pronounced among relatively young respondents and decreased with participants’ age [15]. |
| Kyriakidis et al. | 2015 | GAV | 109 countries | (1) Most people think manual driving is still the most enjoyable mode of travel; (2) respondents were found to be most concerned about software hacking/misuse and were also concerned about legal issues and safety; (3) respondents from more developed countries were less comfortable with their vehicle transmitting data [16]. |
| Lidynia et al. | 2016 | Drones | Aachen University, Germany | (1) Laypeople feared the violation of their privacy whereas active drone pilots saw more of a risk of possible accidents; (2) participants had clear expectations regarding the routes drones should and should not be allowed to use [23]. |
| Deloitte | 2019 | UAM | 20 countries | (1) Despite the substantial progress made in terms of vehicle design and technology, consumers continue to doubt the safety of UAM; (2) regional and generational differences play a critical role in the perceived UAM safety; (3) 49% of respondents in the United States were unconvinced about UAM safety while only 39% are skeptical about safety in China; (4) younger consumers surveyed (Gen Y and Gen Z) agree that UAM provides for an efficient alternative mode of urban transportation but are more apprehensive about its safety [22]. |
| Peeta et al. | 2008 | On-demand air service (ODAS) | Indiana, Illinois, and Florida | (1) Travel distance, service fare, and the ODAS location are key factors influencing user switching decisions (from traditional air service to ODAS); (2) ODAS landing location is a key determinant of its operational viability and has significant implications for policymakers, regional/city planners, operators, and businesses; (3) while ODAS proximity to work is an attractive attribute for users, environmental concerns can arise if close to residential areas [24]. |
| Airbus | 2019 | UAM | Los Angeles, Mexico City, New Zealand, and Switzerland | (1) Communities are most concerned about safety followed by the type of sound generated from the aircraft and then the volume of sound from the aircraft; (2) other concerns include the time of day at which aircrafts are flown and the altitude at which aircraft fly; (3) 44.5% of all respondents’ initial reactions to UAM is in support or strong support while 41.4% of all respondents believe UAM is either safe or very safe [21]. |
| Zhang et al. | 2019 | GAV | China | (1) Trust was the most critical factor in promoting AV acceptance; (2) perceived ease of use (PEOU) and perceived usefulness (PU) were significant factors; (3) the effects of PEOU and PU were weaker compared to trust [17]. |
| Categories | Factors | Data Sources | Unit of Observation | Year of Collection |
|---|---|---|---|---|
| Demand side | Age groups | Census Origin–Destination Employment Statistics | Census block | 2019 |
| Occupation groups | Census Origin–Destination Employment Statistics | Census block | 2019 | |
| Income groups | Census Origin–Destination Employment Statistics | Census block | 2019 | |
| Home–workplace trips | Census Origin–Destination Employment Statistics | Census block | 2019 | |
| Home–workplace distance | Calculated from the centroids of census blocks | Census block | 2019 | |
| Supply side | Helipads | The Federal Aviation Administration | Site | 2019 |
| Parking structure | Google Earth satellite image/Google Map API | Site | 2021 | |
| UAS airspace and facility map | The Federal Aviation Administration | Zone | 2020 | |
| Schools | California School Campus Database | Land Parcel | 2018 | |
| Noise levels | The United States Department of Transportation | - | 2018 |
| Categories | Rules | Description |
|---|---|---|
| Demand side | s000 | Total number of home–workplace commuters |
| sa01 | Home–workplace commuters aged 29 or younger | |
| sa02 | Home–workplace commuters aged 30 to 54 | |
| sa03 | Home–workplace commuters aged 55 or older | |
| se01 | Home–workplace commuters with earnings of $1250/month or less | |
| se02 | Home–workplace commuters with earnings of $1251/month to $3333/month | |
| se03 | Home–workplace commuters with earnings greater than $3333/month | |
| si01 | Home–workplace commuters in goods producing industry sectors | |
| si02 | Home–workplace commuters in trade, transportation, and utility industry sectors | |
| si03 | Home–workplace commuters in all other services industry sectors | |
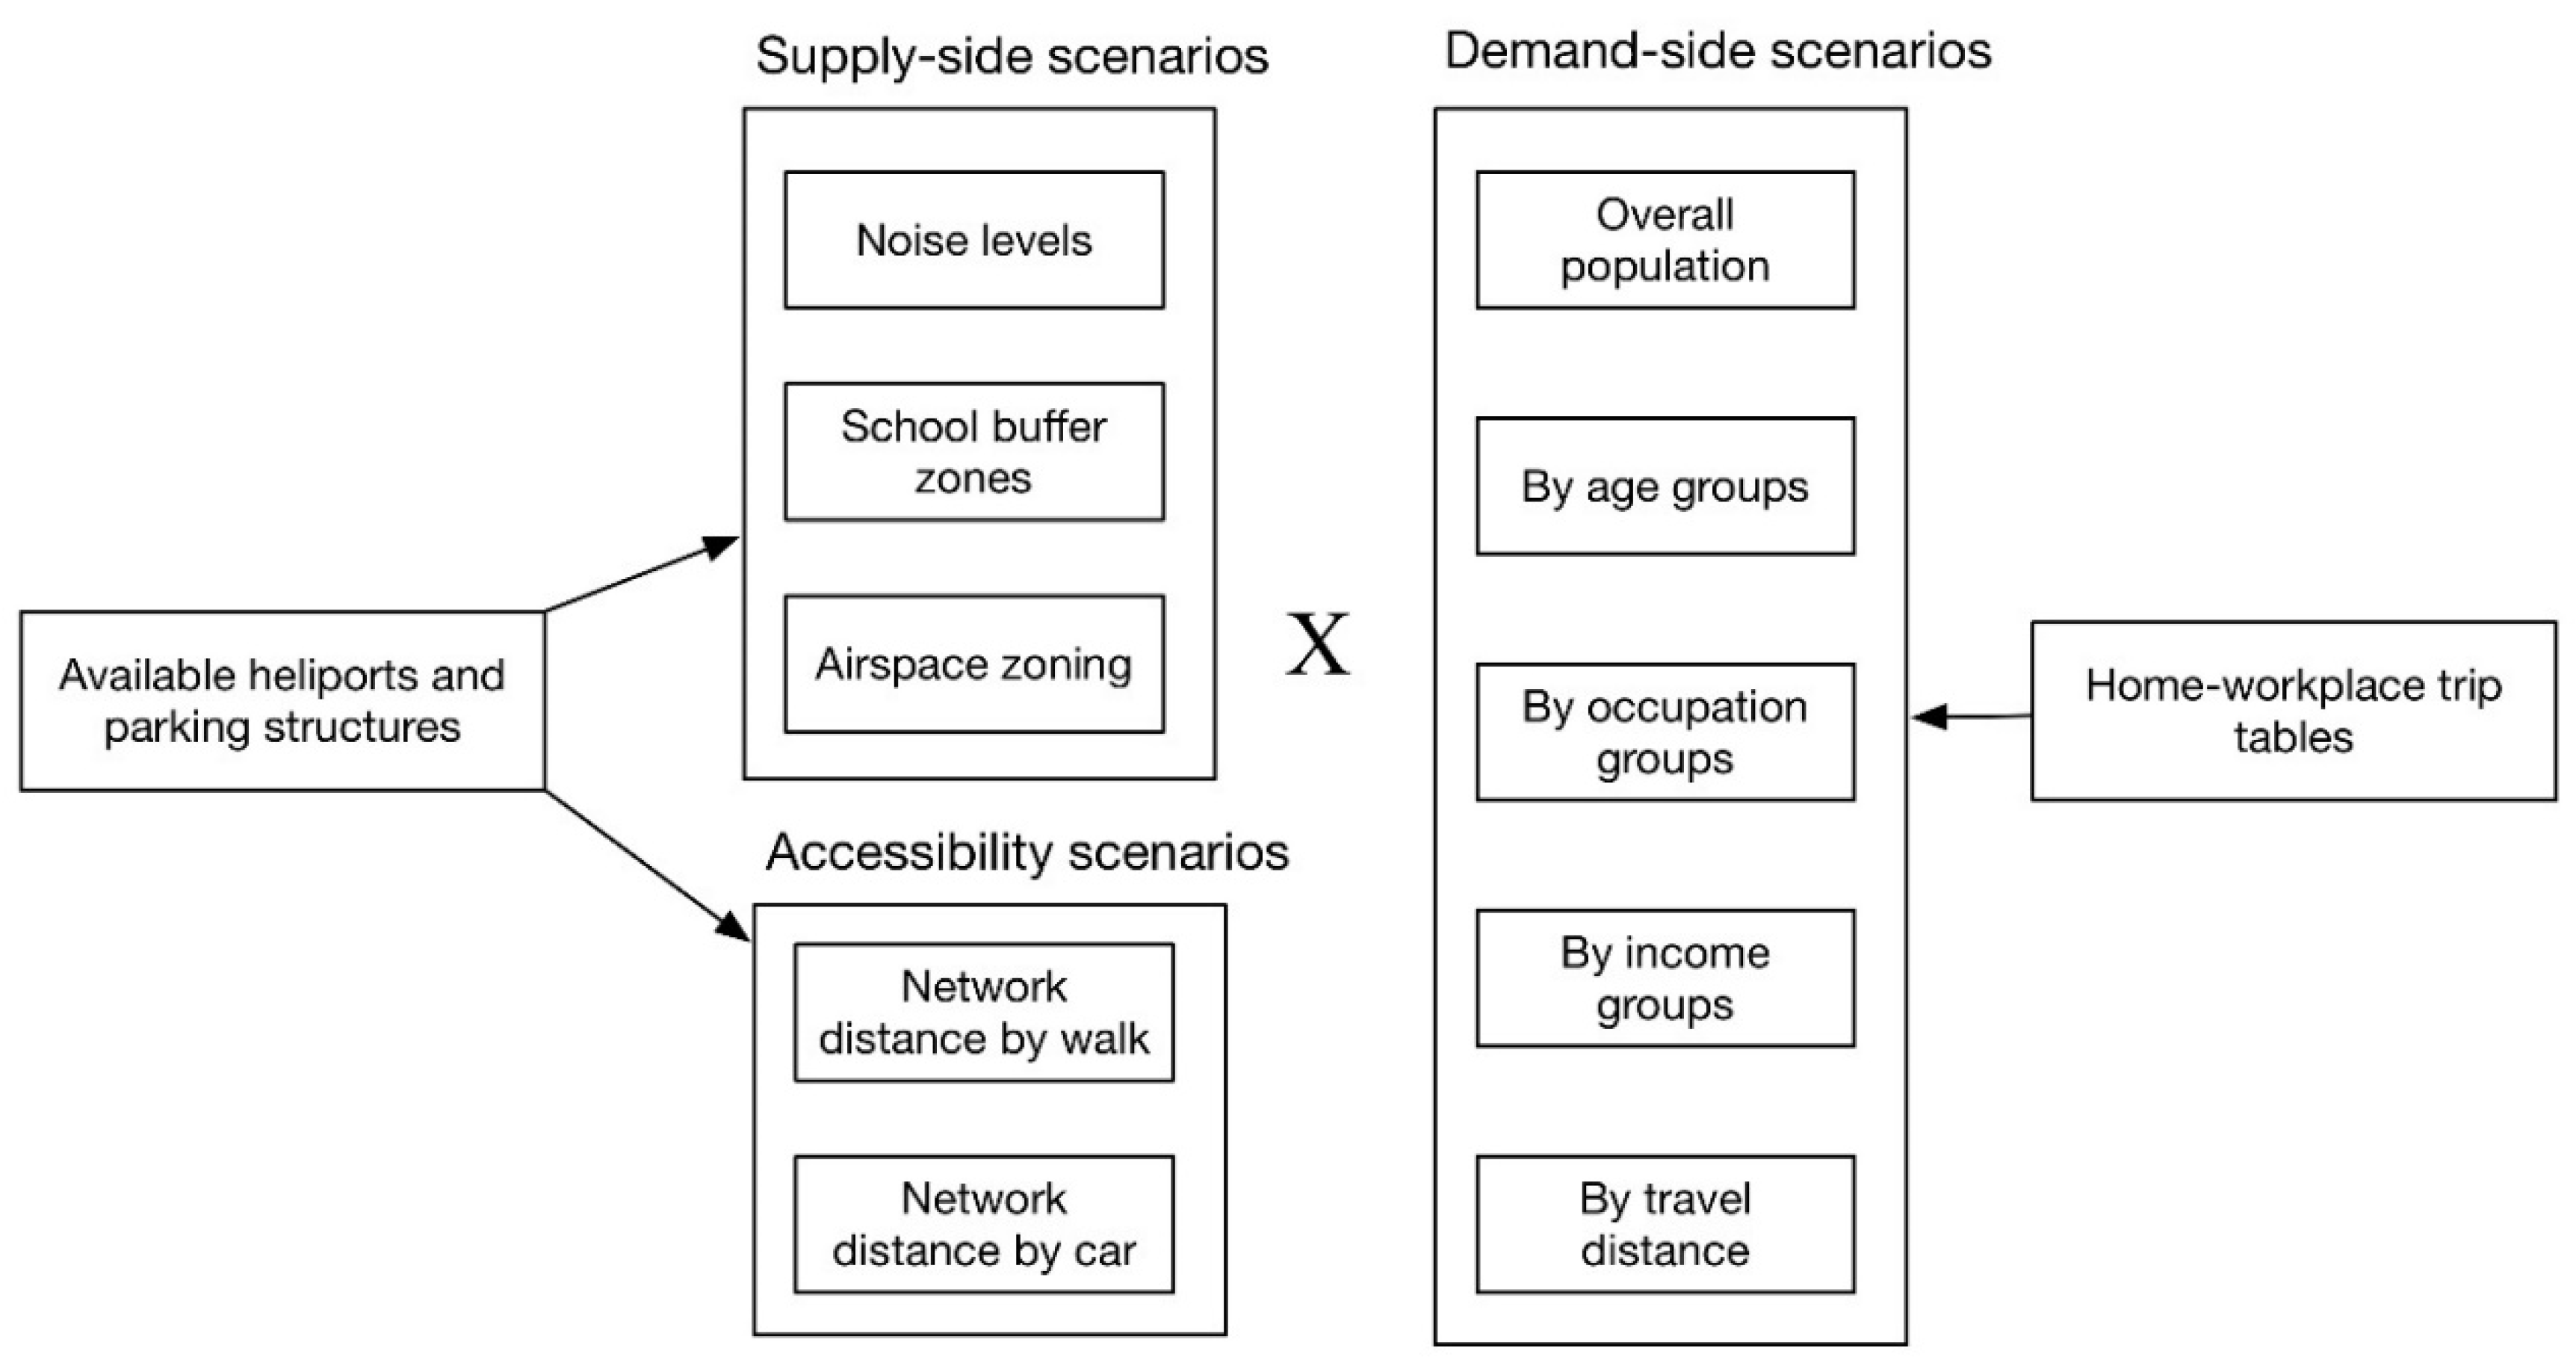
| Supply side | A1 | ≤200 ft preapproved UAS fly altitude |
| A2 | ≤300 ft preapproved UAS fly altitude | |
| A3 | ≤400 ft preapproved UAS fly altitude | |
| S1 | ≥0.1 miles school buffer | |
| S2 | ≥0.25 miles school buffer | |
| S3 | ≥0.5 miles school buffer | |
| N1 | ≥85 dB noise level | |
| N2 | ≥70 dB noise level | |
| N3 | ≥60 dB noise level | |
| Accessibility | D1 | ≤3 min walking by network distance |
| D2 | ≤5 min walking by network distance | |
| D3 | ≤10 min walking by network distance | |
| D4 | ≤3 min driving by network distance | |
| D5 | ≤5 min driving by network distance | |
| D6 | ≤10 min driving by network distance | |
| Demand coverage | J1 | Home–workplace commuters w/only home block access |
| J2 | Home–workplace commuters w/only workplace block access | |
| J3 | Home–workplace commuters w/both home and workplace access | |
| Block distance | s000_10 | Block centroid distance ≥10 miles |
| s000_20 | Block centroid distance ≥20 miles | |
| s000_30 | Block centroid distance ≥30 miles |
| Rules | Description | Helipads | Parking Structures | Total | % Base |
|---|---|---|---|---|---|
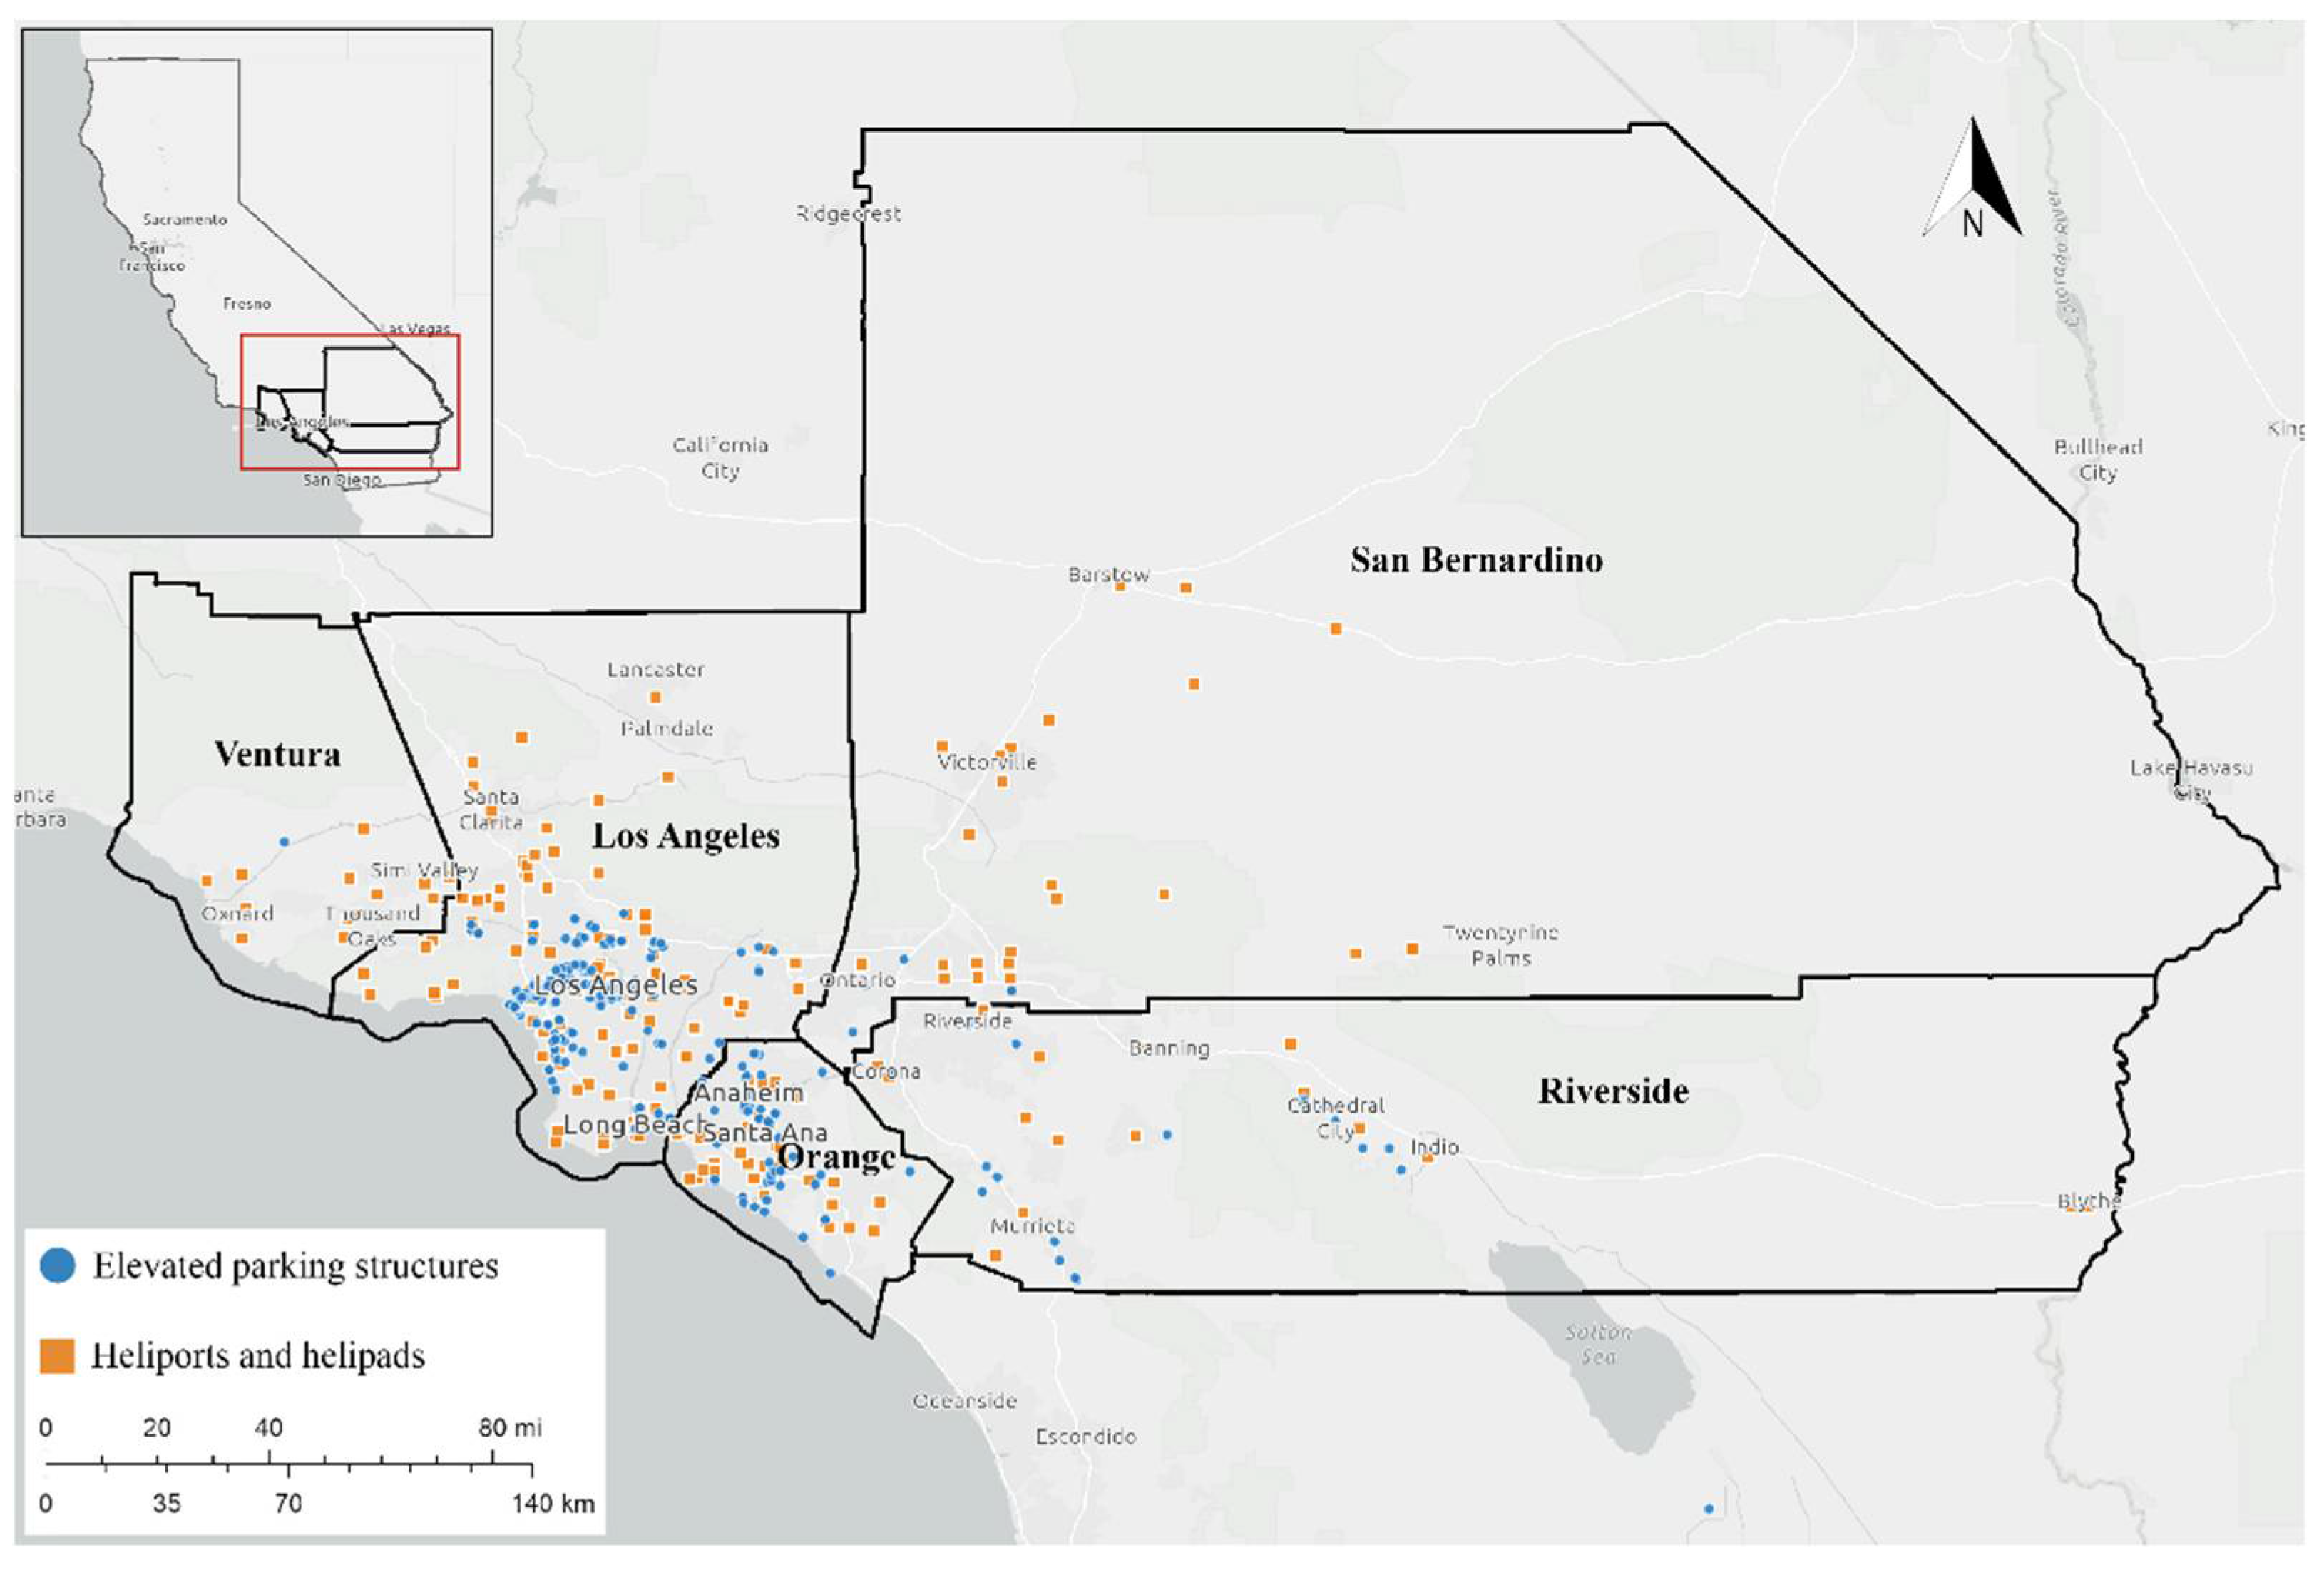
| No constraints | All available sites | 360 | 444 | 804 | 100.0% |
| A1 | ≤200 ft airspace zoning | 271 | 269 | 540 | 67.2% |
| A2 | ≤300 ft airspace zoning | 260 | 242 | 502 | 62.4% |
| A3 | ≤400 ft airspace zoning | 242 | 223 | 465 | 57.8% |
| S1 | >0.1 mile school buffer | 348 | 402 | 750 | 93.3% |
| S2 | >0.25 mile school buffer | 294 | 305 | 599 | 74.5% |
| S3 | >0.5 mile school buffer | 219 | 138 | 357 | 44.4% |
| N1 | ≥85 dB noise | 360 | 444 | 804 | 100.0% |
| N2 | ≥70 dB noise | 347 | 441 | 788 | 98.0% |
| N3 | ≥60 dB noise | 325 | 418 | 743 | 92.4% |
| A1 × S1 × N1 | The best mixed scenario | 262 | 236 | 498 | 61.9% |
| A2 × S2 × N2 | The median mixed scenario | 217 | 148 | 365 | 45.4% |
| A3 × S3 × N3 | The strictest mixed scenario | 154 | 56 | 210 | 26.1% |
| Rules | Description | A1 × S1 × N1 (Best) | A2 × S2 × N2 (Median) | A3 × S3 × N3 (Strictest) |
|---|---|---|---|---|
| D1 | ≤3 min walking distance | 0.13% | 0.06% | 0.00% |
| D2 | ≤5 min walking distance | 0.37% | 0.16% | 0.01% |
| D3 | ≤10 min walking distance | 1.50% | 0.63% | 0.08% |
| D4 | ≤3min driving distance | 4.11% | 1.88% | 0.36% |
| D5 | ≤5 min driving distance | 15.80% | 8.30% | 2.58% |
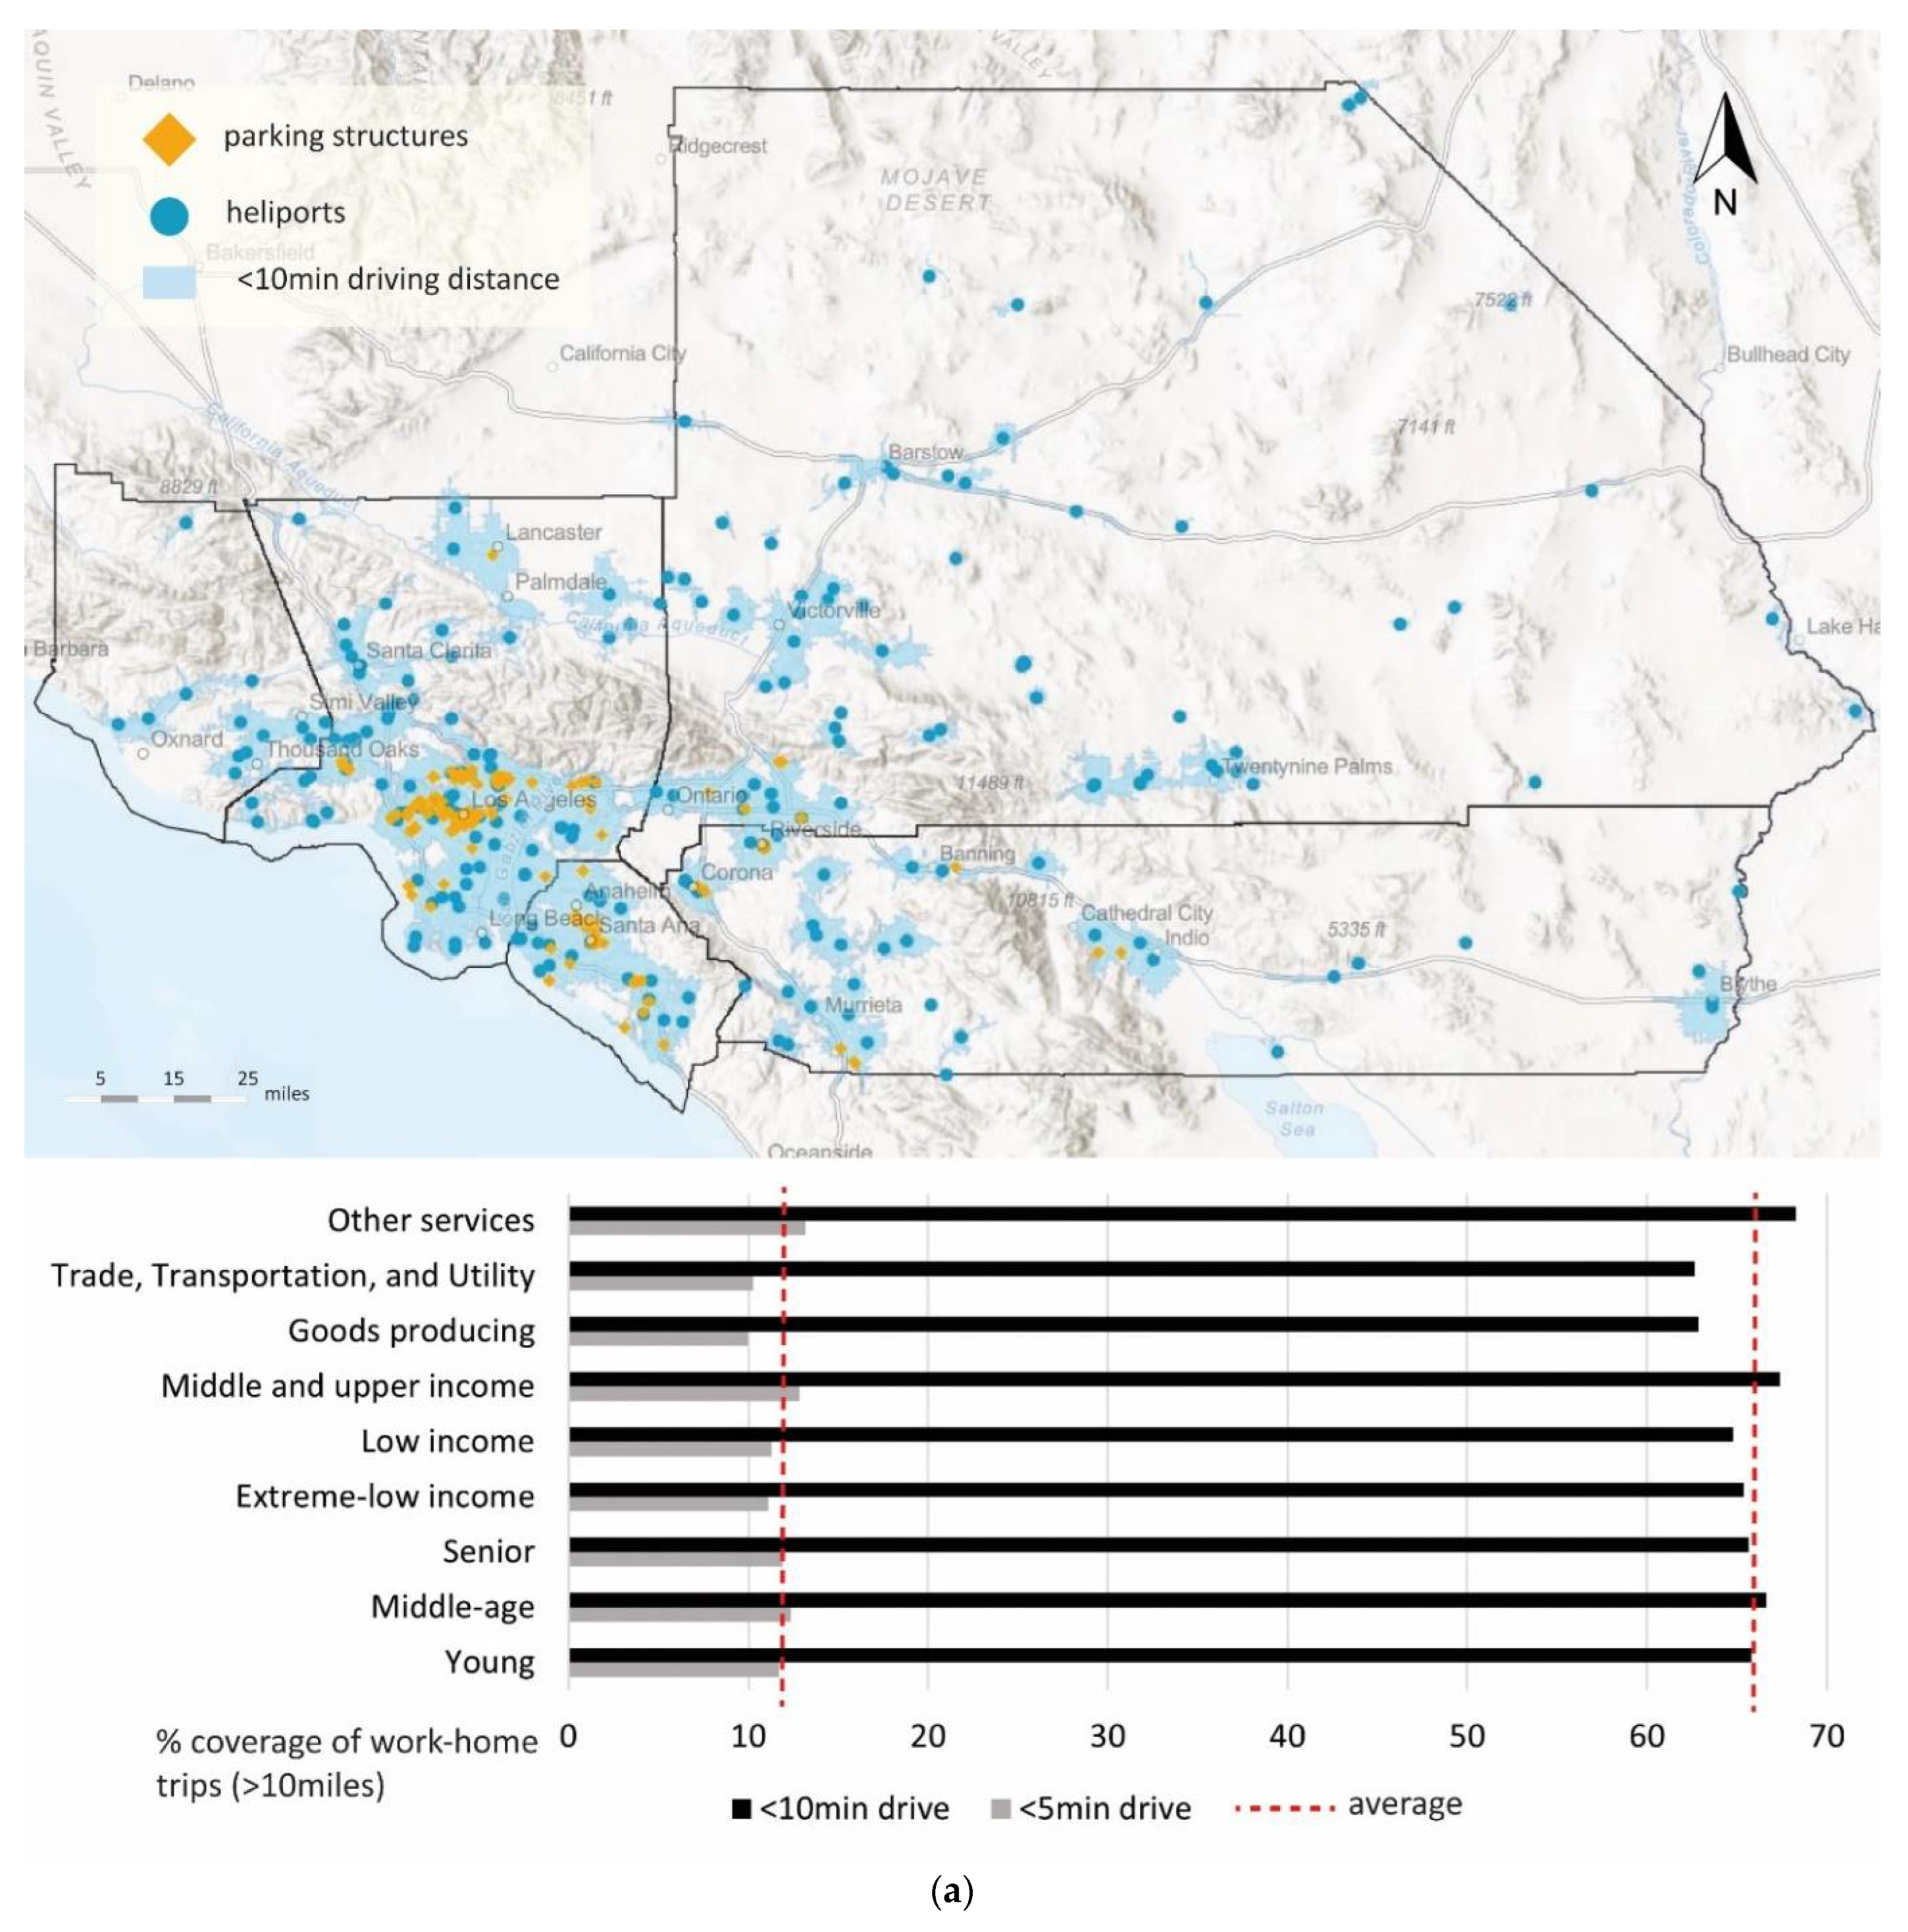
| D6 | ≤10 min driving distance | 70.73% | 49.48% | 27.49% |
Disclaimer/Publisher’s Note: The statements, opinions and data contained in all publications are solely those of the individual author(s) and contributor(s) and not of MDPI and/or the editor(s). MDPI and/or the editor(s) disclaim responsibility for any injury to people or property resulting from any ideas, methods, instructions or products referred to in the content. |
© 2023 by the author. Licensee MDPI, Basel, Switzerland. This article is an open access article distributed under the terms and conditions of the Creative Commons Attribution (CC BY) license (https://creativecommons.org/licenses/by/4.0/).
Share and Cite
Li, X. Repurposing Existing Infrastructure for Urban Air Mobility: A Scenario Analysis in Southern California. Drones 2023, 7, 37. https://doi.org/10.3390/drones7010037
Li X. Repurposing Existing Infrastructure for Urban Air Mobility: A Scenario Analysis in Southern California. Drones. 2023; 7(1):37. https://doi.org/10.3390/drones7010037
Chicago/Turabian StyleLi, Xiangyu. 2023. "Repurposing Existing Infrastructure for Urban Air Mobility: A Scenario Analysis in Southern California" Drones 7, no. 1: 37. https://doi.org/10.3390/drones7010037


