Article

Establishment of a Landscape Information Model (LIM) and AI Convergence Plan through the 3D Digital Transformation of Railway Surroundings

1
Railroad Test & Certification Division, Korea Railroad Research Institute (KRRI), Cheoldo Bangmulgwan-ro, Uiwang-si 16105, Gyeonggi-do, Republic of Korea
2
Transportation Environmental Research Division, Korea Railroad Research Institute (KRRI), Cheoldo Bangmulgwan-ro, Uiwang-si 16105, Gyeonggi-do, Republic of Korea
3
Railroad Accident Research Department, Korea Railroad Research Institute (KRRI), Cheoldo Bangmulgwan-ro, Uiwang-si 16105, Gyeonggi-do, Republic of Korea
4
Huron Network Co., Ltd., 505, 5, Gunpocheomdansaneop2-ro 22beon-gil, Gunpo-si 10285, Gyeonggi-do, Republic of Korea
*
Author to whom correspondence should be addressed.
Drones 2023, 7(3), 167; https://doi.org/10.3390/drones7030167
Submission received: 25 January 2023 / Revised: 20 February 2023 / Accepted: 24 February 2023 / Published: 27 February 2023

Abstract

:
Digital transformation projects have been undertaken in the land transportation and railway industries, including the introduction of various smart construction technologies. With the expansion of policies to increase the share of railway transportation as an environmentally sustainable means of transportation that meets the needs of the carbon-neutral era, 3D digital information is required throughout the entire chain of railway construction, route selection, status analysis, design, construction, and maintenance. The need for scientific and rational decision making is increasing. In this study, based on point cloud data acquired by an unmanned aerial vehicle (UAV) and a handheld mobile device, the landscape infrastructure around a railway was digitally converted, and a railway Landscape Information Model (LIM) process that modeled various types of landscape information was derived. Additionally, through the voxelization of 3D data, information regarding a railway’s surrounding environment, analyzed as a 3D volume concept and a convergence plan with deep-learning-based artificial intelligence (AI) technology, was presented through object recognition using a clustering algorithm. A railway LIM dataset could be created from a total of seven major categories, and massive data processing through AI convergence will be a future possibility through optimization of the point cloud data clustering algorithm. The future of the railway industry requires the establishment of a railway LIM for the integrated management of a railway’s surrounding environment and building information modeling (BIM) of structures such as tunnels. The railway LIM process has potential for use in various fields, such as environmental management and safety improvement for disaster prevention.

1. Introduction

The Ministry of Land, Infrastructure, and Transport presented the ‘Railway BIM 2030 Roadmap’ to promote the introduction and spread of building information modeling (BIM) in the railway facility sector. A mid- to long-term strategy from a procedural and technical perspective was proposed [1]. Additionally, the Korea Rail Network Authority has fully implemented a BIM system that comprehensively manages all information necessary for design, construction, and maintenance based on 3D models. Various digital conversion activities are currently underway in the rail transport sector, including the establishment of plans to introduce BIM to all areas of the railway industry [2,3,4]. The development of the digital twin can be divided into five steps, which are the points where 3D modeling production and simulations can be implemented, although the technology is at an early stage. The first step is to represent the existing space with 3D modeling, and the second step is to control the site in the future based on modeling. The third step is to support decision-making processes, such as maintenance and optimization design, by analyzing and simulating in the mirror world using the established modeling information. In step four, the autonomous response of artificial intelligence (AI) to the current situation that is presented as step five can be used. In the present study, by acquiring and generating 3D digital data using unmanned aerial vehicles (UAVs) and LiDAR in the railway field, the basis for information collection was prepared, and information regarding a railway’s surrounding environment and various landscape infrastructures that could be incorporated within a railway BIM was automatically acquired [5,6]. In the future, if a system is prepared to analyze this information, the railway industry will be able to lead the entire construction field. Recently, various fields of research on numerical models and simulations have been conducted [7,8,9], and this study is an attempt to build a railway environmental impact model.
The United States is actively introducing BIM in both the public and private sectors, with a strong tendency to introduce BIM led by the private sector. Singapore’s Building and Construction Authority (BCA) has been supporting industrial facilities since 2010, and is mandating the application of BIM to improve construction productivity by 25% within one year. To improve and advance construction productivity in its construction industry, which accounts for about 7% of GDP, the British government made BIM application mandatory for public construction projects in 2011. In April 2016, it became mandatory to apply BIM Level 2 in the UK. China is actively using UAVs in railway monitoring programs, and in India, railway track extraction is carried out through the enhancement and analysis of UAV images, with operators directly monitoring railway track conditions. A new framework was developed through a survey analysis using UAVs rather than traditional methods [5]. According to the digital twin implementation Level 3 standard proposed by Gartner (2016) [10,11,12], the digital twin level of the domestic railway system can be seen as a step from Level 1 to Level 2 and the 3D digital transformation of the surrounding environment and landscape infrastructure. For its long-term development, the railway industry must quickly establish a digital-twin-based decision-making platform.
When reviewing domestic and international trends, BIM is actively progressing, and based on this, it is necessary to review data collection and convergence measures at the same level as LIM for the environment field. However, the digital twin of the current landscape infrastructure is so basic that no data generation procedure has been established [13,14,15,16,17,18,19]. Because the information regarding the surrounding landscape infrastructure, such as the environmental factors affecting the railway, constitutes 2D data, it is difficult to converge landscape information efficiently with the railway BIM information, which is 3D data. Despite policies to increase the share of railway transportation as an environmentally sustainable means of transportation that meets the needs of the carbon-neutral era, railway construction projects are often delayed due to backlashes from residents and environmental groups. At the selection stage, rational scientific decisions need to be made using 3D digital information. The goals of this study are, first, to establish a method for constructing 3D spatial information based on railway LIM that digitizes the components of the railway surrounding environment by type and digitization in 3D, and second, to generate 3D point cloud data and generate voxels by reviewing the AI convergence plan through integration. Regarding the second goal, we tried to build an integrated railroad BIM. In this study, to strengthen the capacity of the data, network, and AI ecosystems, i.e., the future innovation growth engine of the Korean Digital New Deal era, the components of the railway environment and landscape infrastructure were derived by the type and use of 3D point cloud data. The information was digitally integrated with landscape information modeling (LIM). A 3D dataset was established to build a railway LIM that could be used efficiently throughout the entire railway industry. In addition, environmental information was analyzed as a 3D volume concept through the voxelization of 3D data.
Through this, the database constructed in this study helps in decision making related to the installation of railway lines with natural and ecologically important factors in the field of the railway construction environment. In addition, it is a study that examines ways to process massive data through clustering algorithm optimization and AI convergence and is the first study to introduce the concept of LIM in the railroad environment field.

2. Materials and Methods

2.1. Research Site

The Korea Railway Research Institute has been operating a test track of about 13 km in Osong-eup, Cheongju-si, Chungcheongbuk-do since March 2019. The test track has a total of six tunnels and eight bridges. For this study, a section with a length of 1 km and width of 400 m was selected between test tunnels 4 and 5 of the railway comprehensive test track located in Nojang-ri, Jeondong-myeon, Sejong Special Self-governing City (Figure 1).
The test site contains a mixture of various land uses, including forests, rivers, farmland, agricultural industrial complexes, and residential complexes. These land uses are representative components of the landscape infrastructure and the environment surrounding the railway and are areas where UAV flights and 3D mapping are possible.

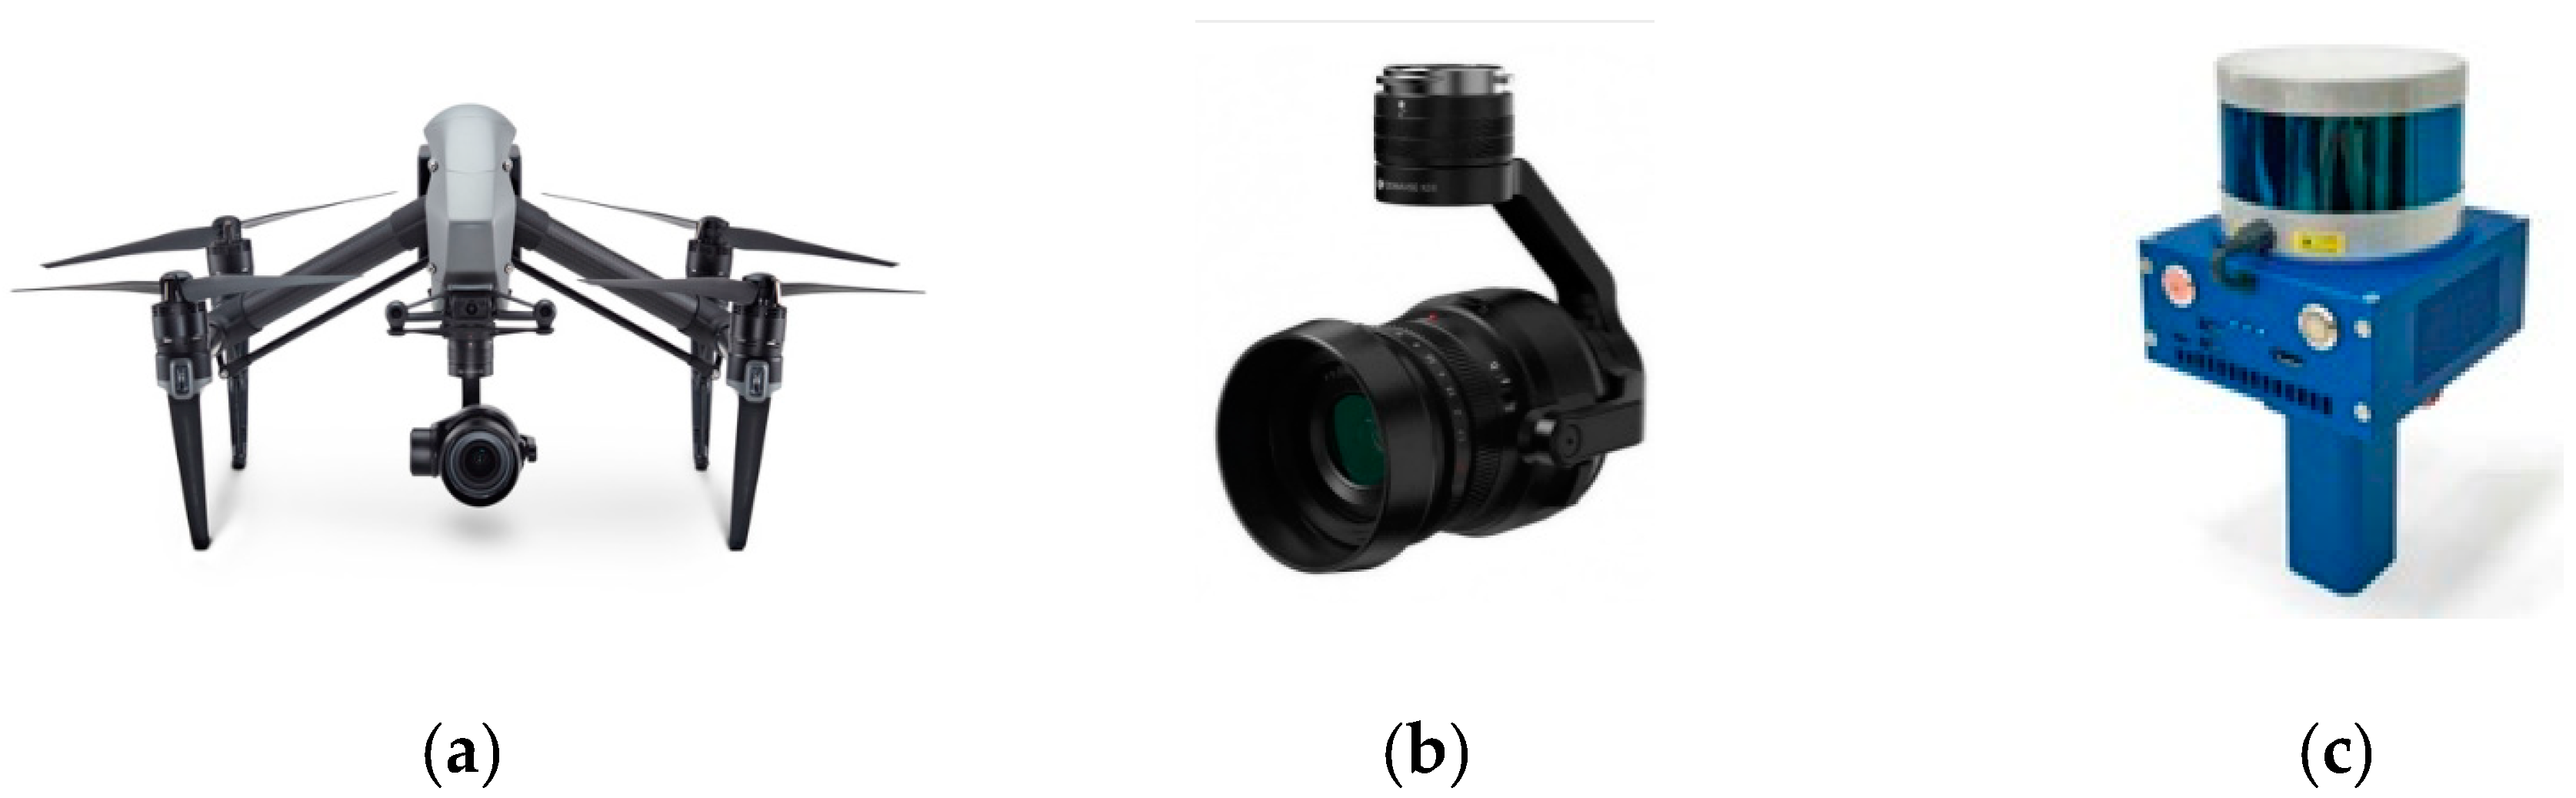
2.2. Experimental Equipment

2.2.1. The Global Navigation Satellite System (GNSS) and Ground Control Point Settings

The GNSS (Trimble R4s GNSS Receiver) was used for a precise survey of the test site. Six ground control points (GCP) and five inspection points (CP, BM) were established and observed using a real-time kinematic (RTK) network (Table 1 and Table 2).

2.2.2. Acquiring Point Cloud Data

Both UAVs and a handheld mobile device were used to acquire point cloud data at the test site (Figure 2). Inspire2 (DJI Innovation Company Inc., Shenzhen, China), Phantom4pro (DJI), and Mavic2pro (DJI) were the UAVs used in the study, and a Map-Torch (Huron Network co., Ltd., Gunpo-si, Korea), which can be attached to and detached from a UAV, was used as the mobile handheld device. The handheld device used the simultaneous localization and mapping (SLAM) method to locate itself in places where GPS reception was unavailable, and 3D scanning was possible anywhere that people and UAVs could access. The LiDAR sensor on the handheld device was a Puck Lite16 (Velodyne Lidar, San Jose, CA, USA).

2.3. Experimental Methods

2.3.1. Research Flowchart

This study was conducted in the following order (Table 3). First, type classification and framework for 3D digital conversion of the railway surrounding environment were derived. Then, object recognition datasets were created through 3D point cloud data and voxelization of the railway surrounding environment, and a railway LIM library was constructed. Finally deep learning was used for segmentation of the 3D data.

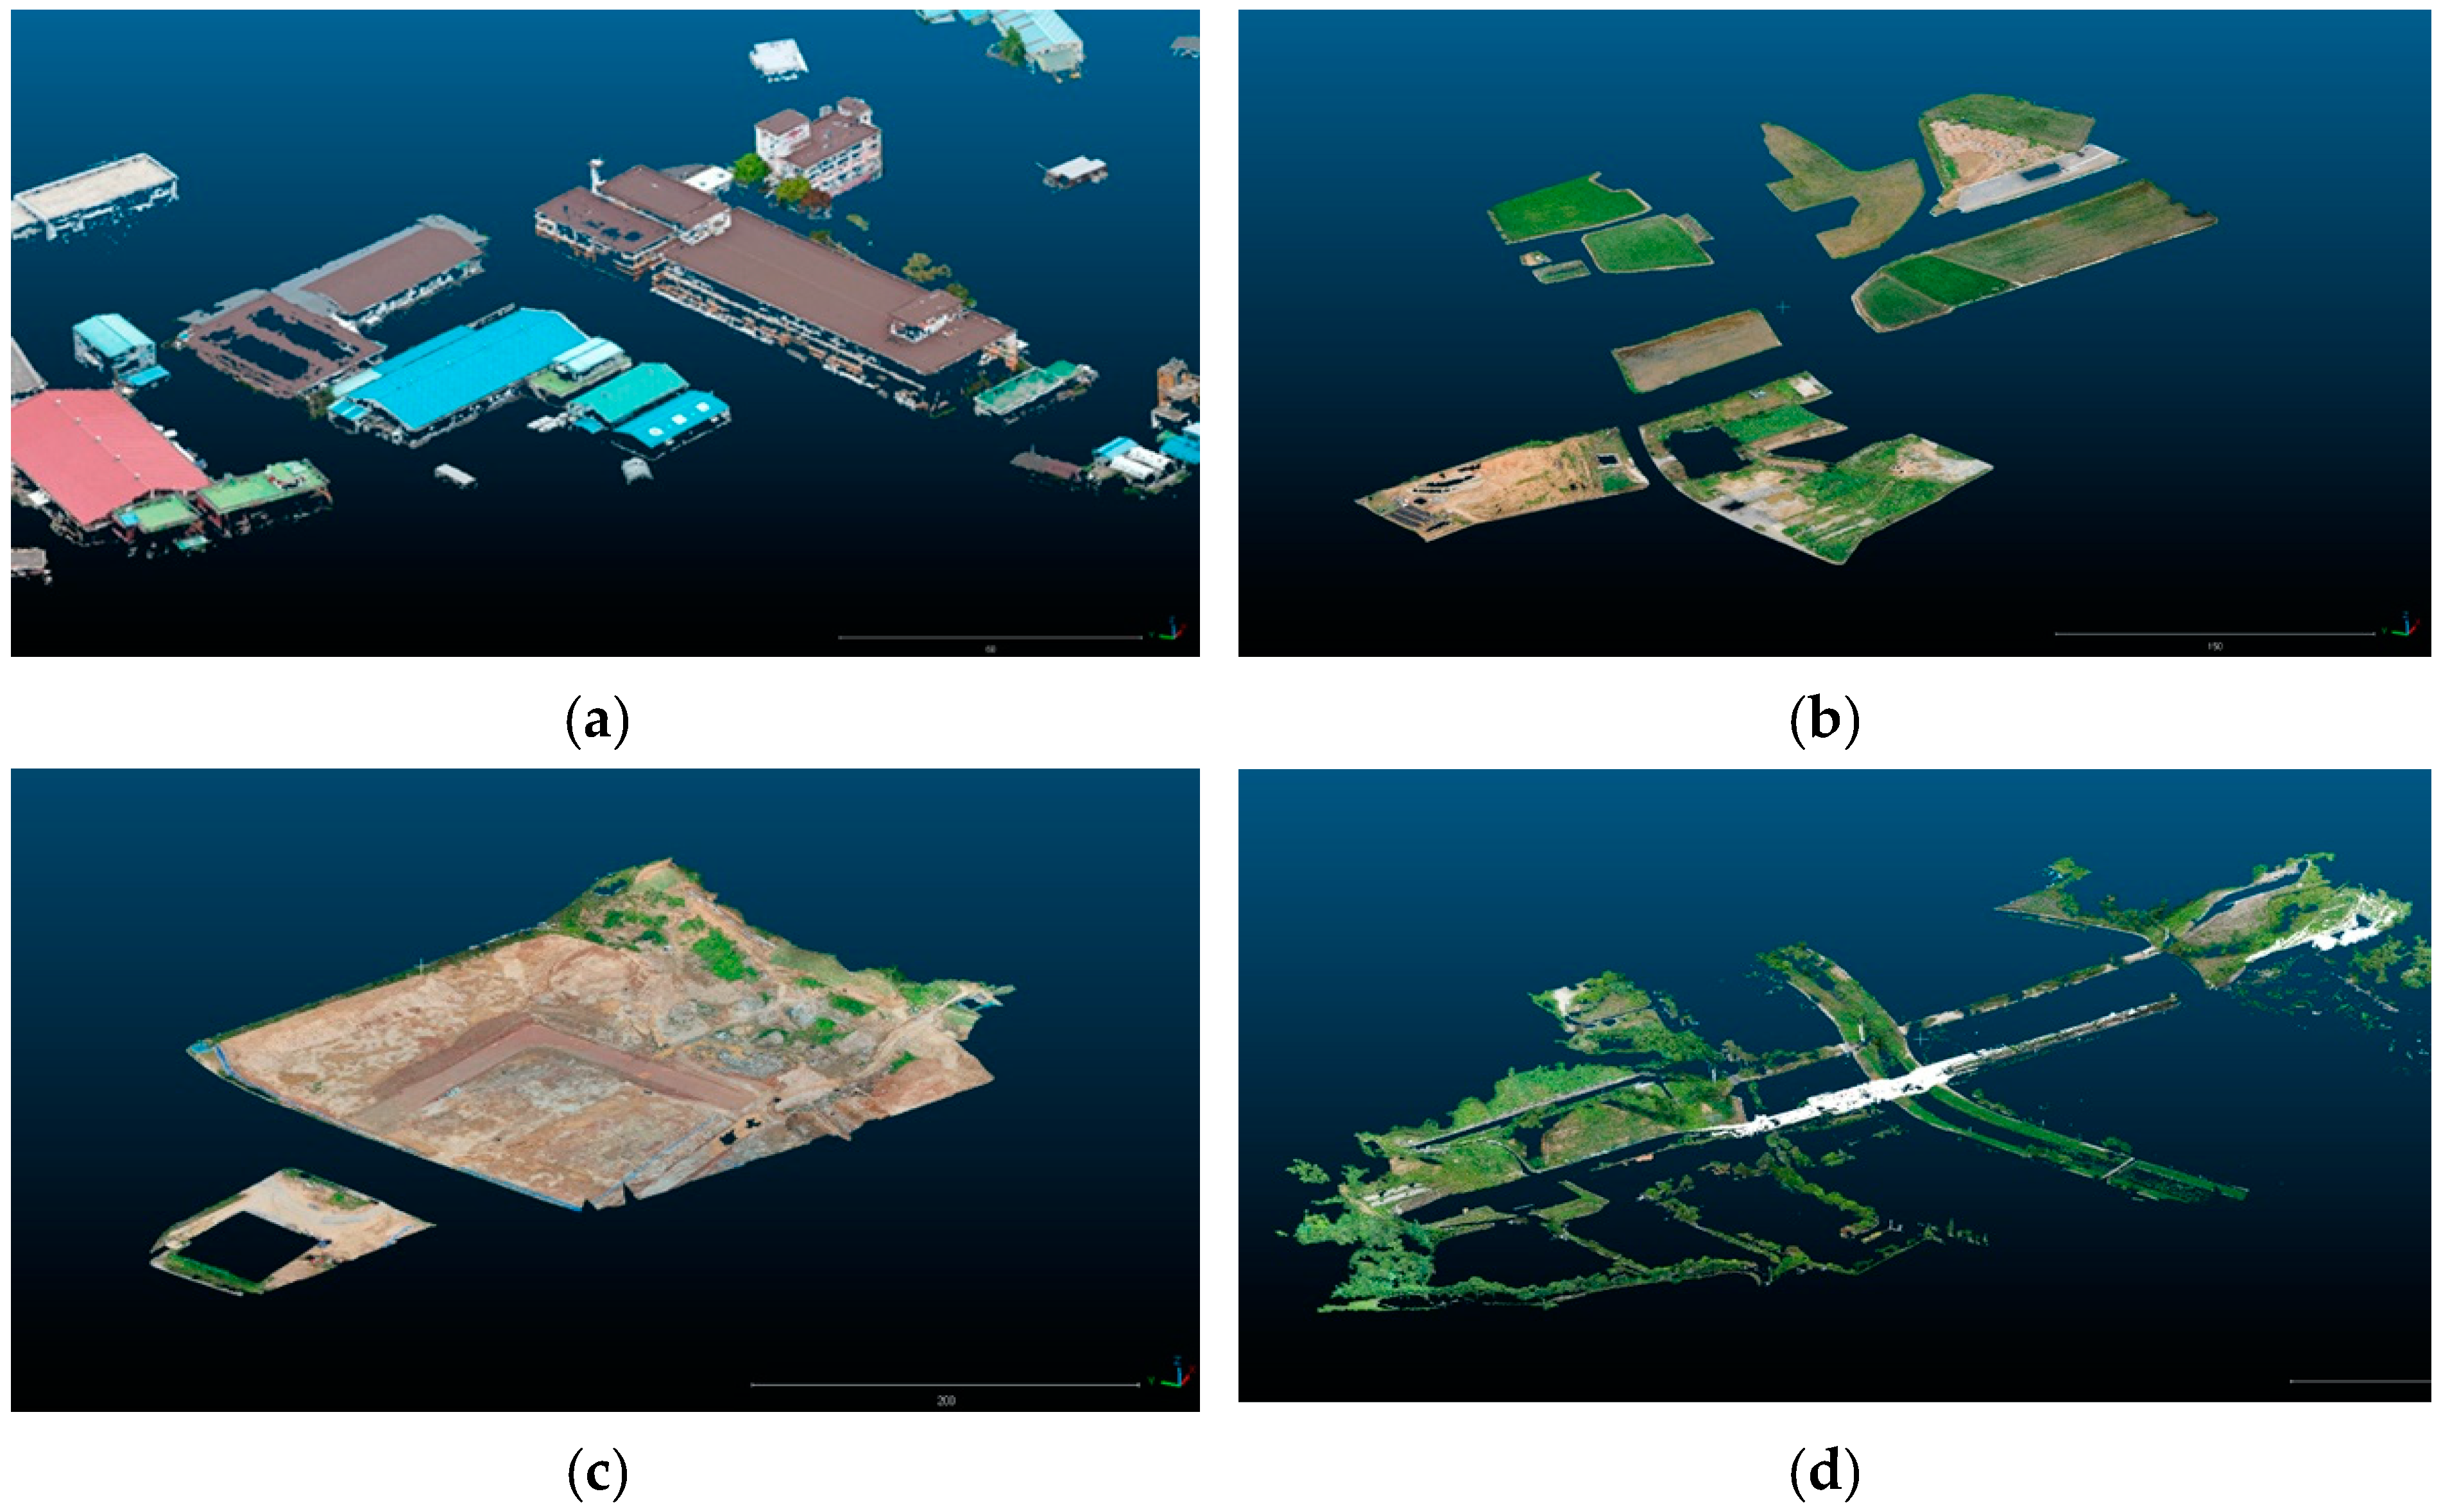
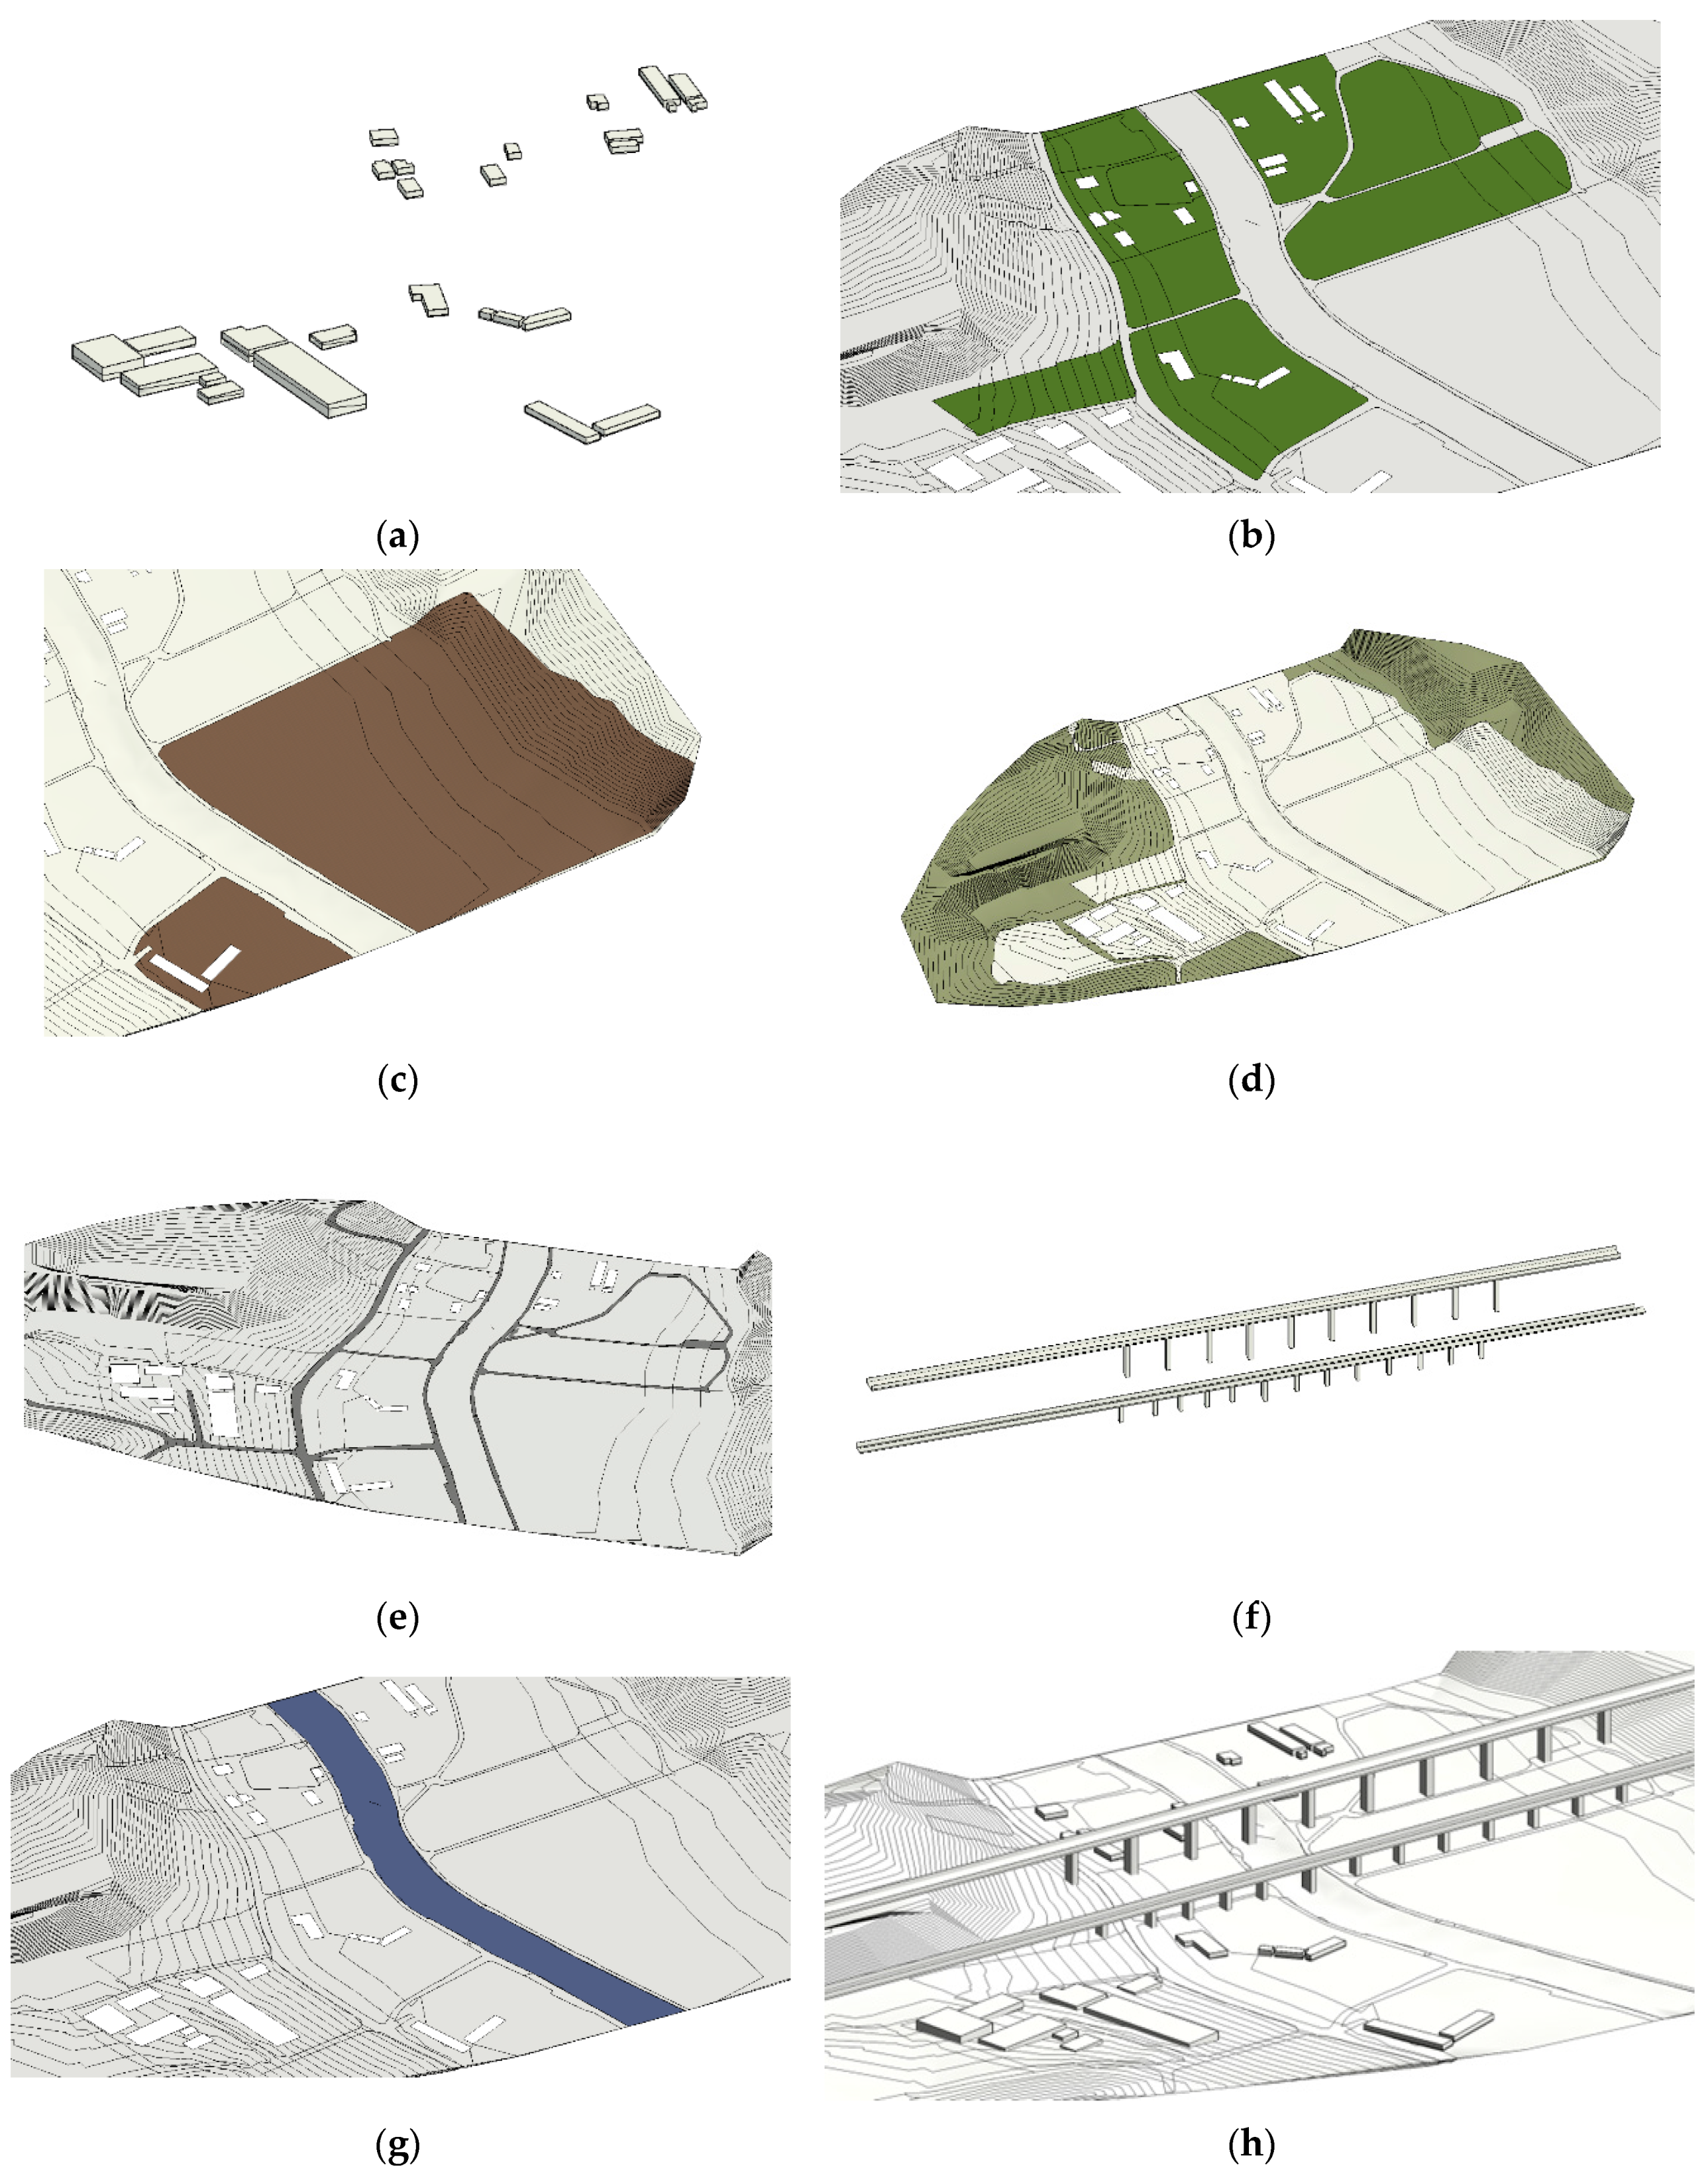
2.3.2. Derivation of Components by Type

This study was conducted from 27 June 2022 to 30 November 2022 and was preceded by a literature review of railway BIM and railway LIM. The landscape ecology classification system was used to describe the components of each type of environment and landscape infrastructure around the railway, and seven major classification items were obtained by dividing them into patch, corridor, and object (Table 4). Components by type may be added or deleted depending on the situation around the railway in the future.

2.3.3. 3D Point Cloud Data Acquisition and Voxelization

The Pix4D Mapper (Pix4D, Switzerland), Cloud Compare v2.12 alpha (open-source software), and Revit (Autodesk, San Rafael, Unites States) software were used for 3D point cloud data acquisition and voxelization. For the digital conversion of the landscape infrastructure around the railway, UAV 3D mapping was used to acquire orthographic images and point cloud data for the entire site. Point cloud data using handheld radar were acquired in some of the easily accessible sections. The UAV and LiDAR data were then merged. To remove unnecessary point cloud data, a noise removal procedure was performed three to four times for each merging process, and the final point cloud data were constructed for the segmentation of individual objects and the generation of voxel and LIM datasets. The volume of the seven major categories was calculated using the voxel function of Cloud Compare, and the volume values were decomposed into a grid.

2.3.4. LIM Construction and AI Convergence

The spatial information that was digitally converted into point cloud data was divided into spatial types by object using the density-based spatial clustering of applications with noise (DBSCAN) clustering algorithm, and a railway LIM-based dataset was constructed using the Revit program. To separate and divide the point cloud data by component, pre-processing for noise was performed, a digital terrain model (DTM) and digital surface model (DSM) were constructed, and large-scale data were classified using a segmentation algorithm. Small or detailed and redundant data that were not classified using the algorithm were manually denoised. Cloud Compare was used to separate and divide point cloud data, and work was conducted in a way that could improve the storage and convenience of data and the accuracy of results by considering the volume, accuracy, and time required during the separation and division process.

3. Results and Discussion

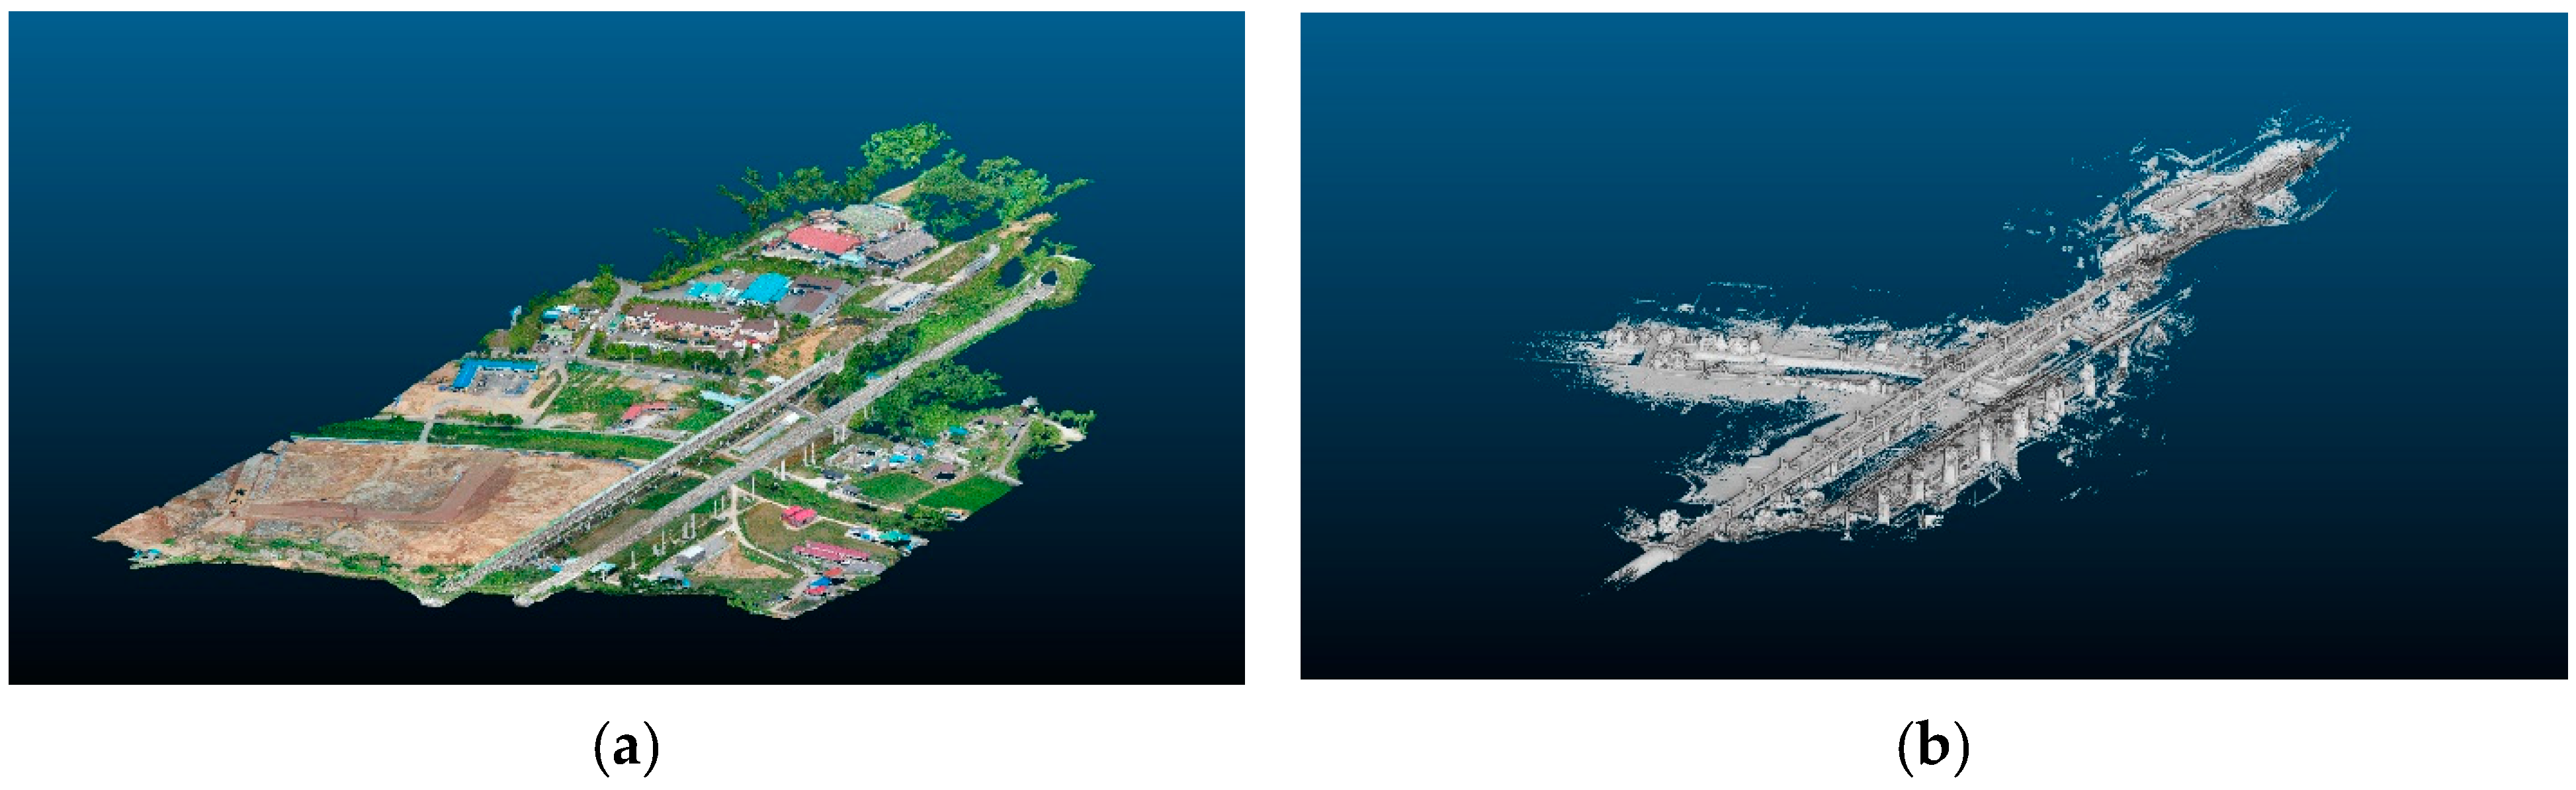
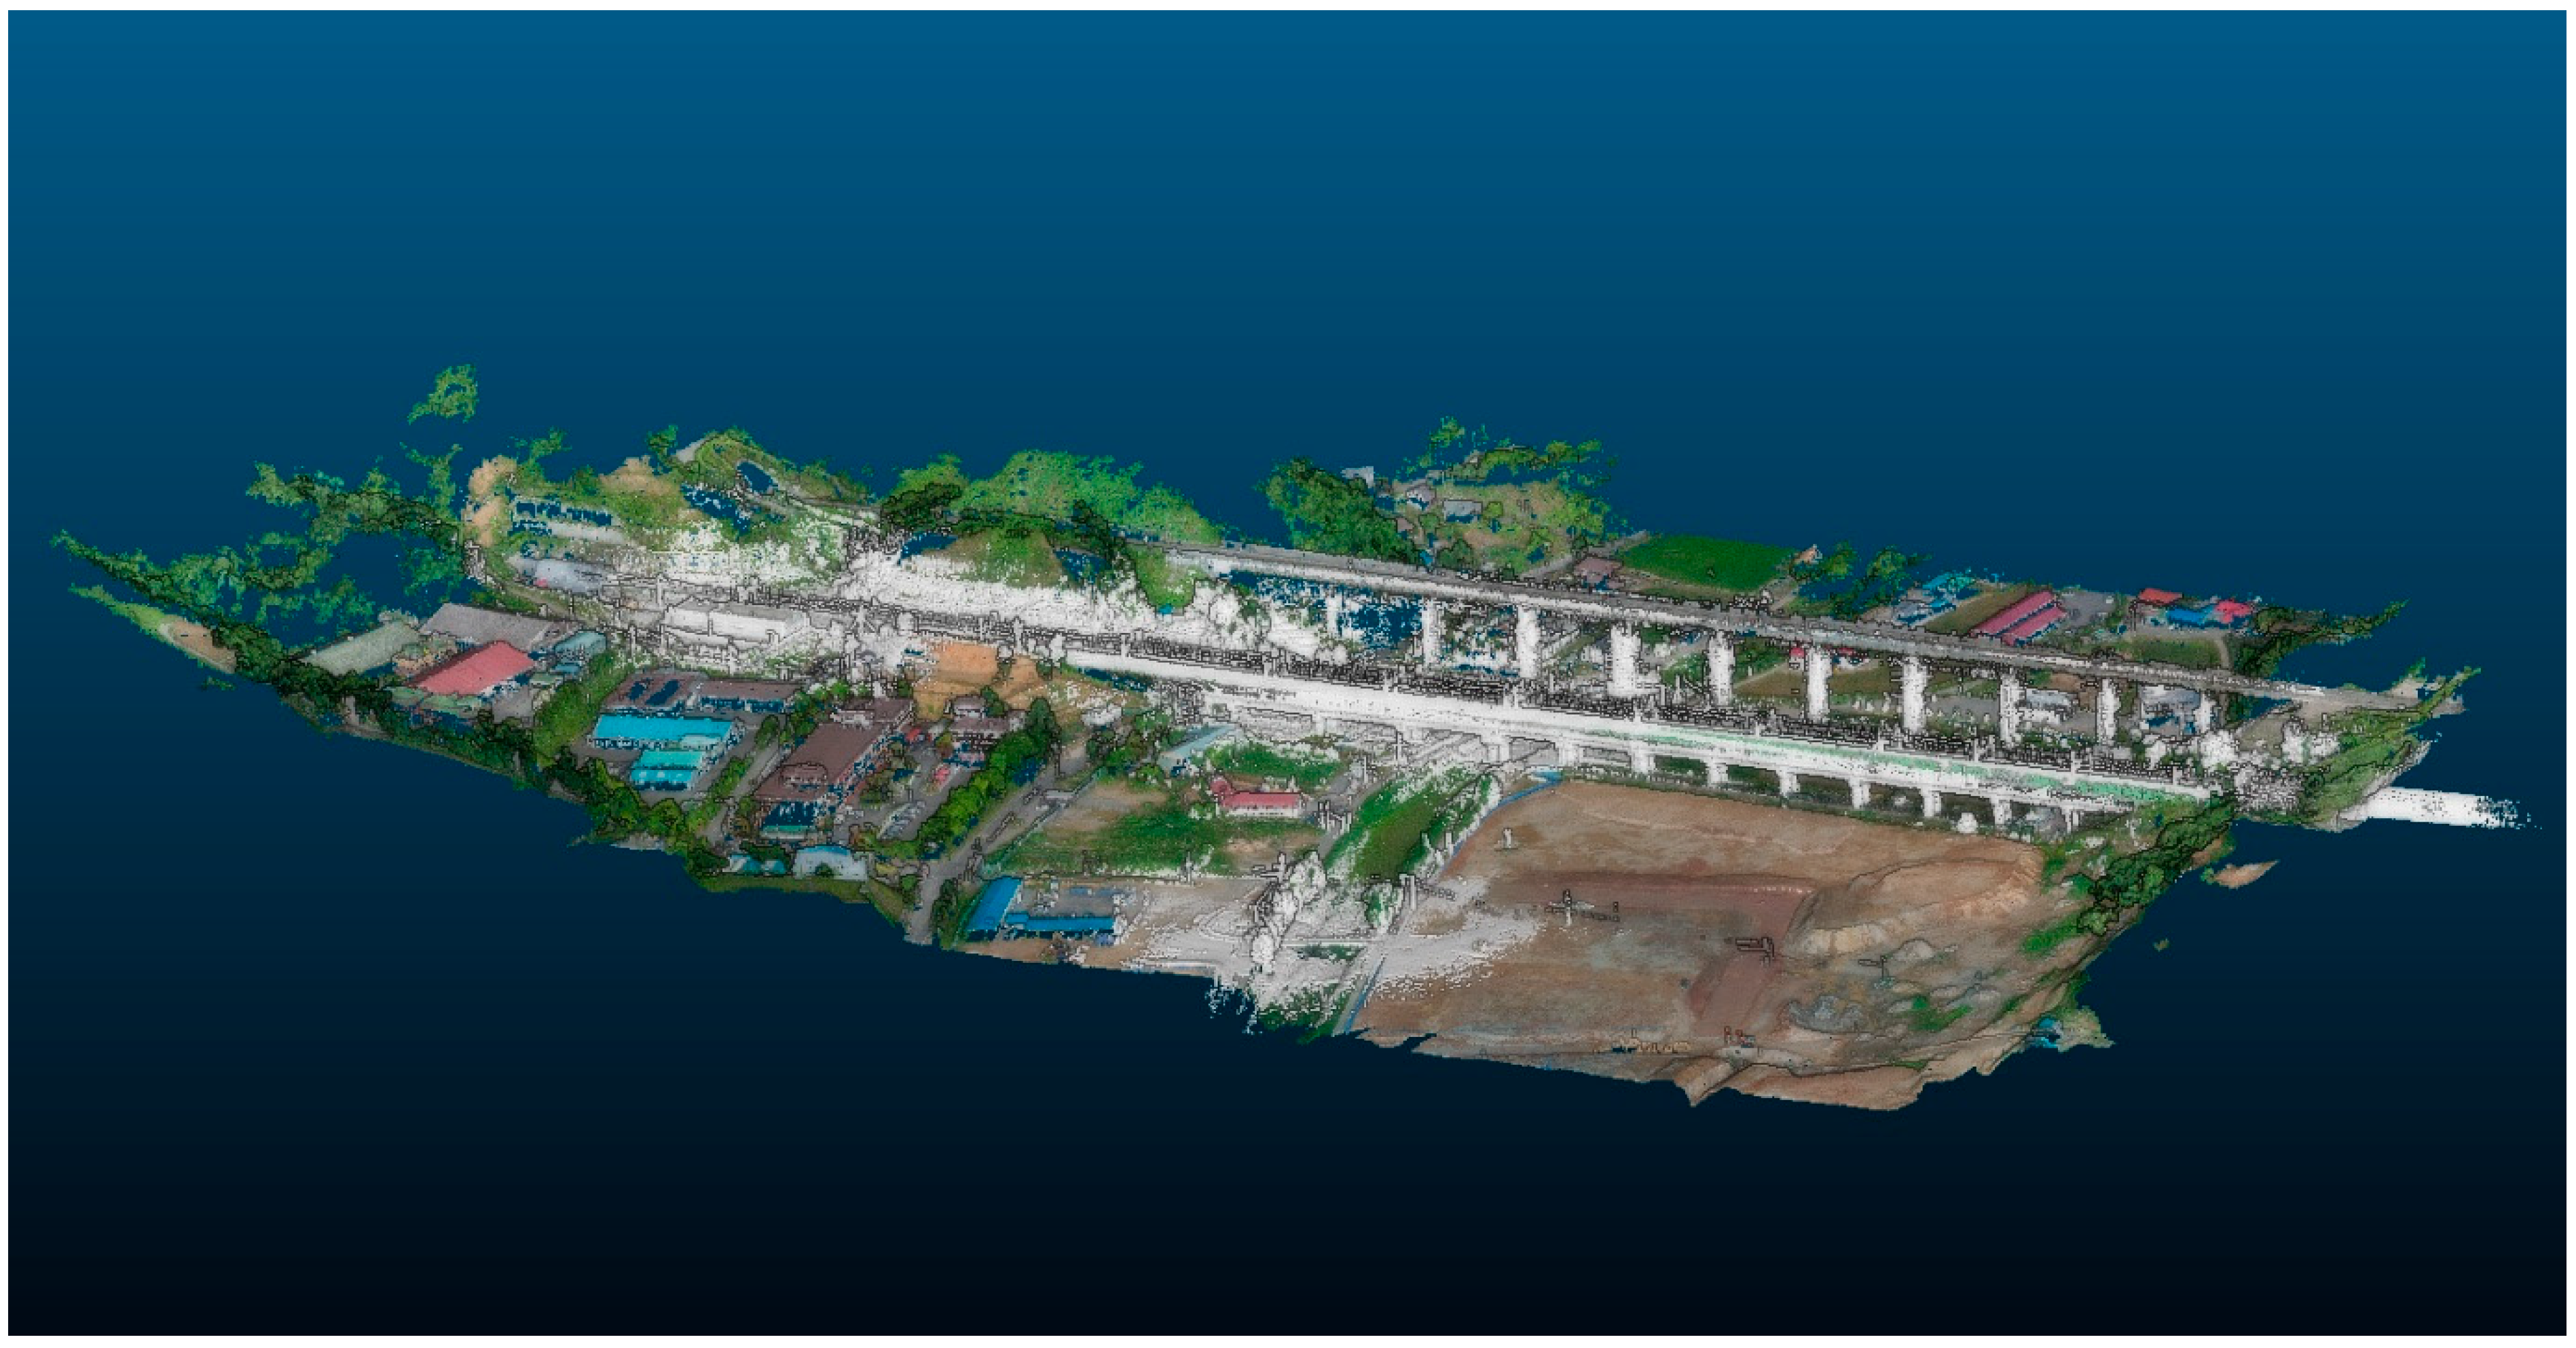
3.1. The 3D Digital Transformation

A 3D digital conversion was performed for the landscape infrastructure around the railway by merging the UAV 3D mapping and point cloud data acquired by the Map-Torch device. The 3D digital conversion result was merged with the RGB (Red, Green, Blue) image to include color information for the target area, which was found to be composed of seven major categories: natural green areas, rivers, farmland, bare land, buildings, roads, and railway facilities around the railway (Figure 3 and Figure 4). The point cloud data acquired by the Map-Torch device was obtained by an investigator carrying the instrument. Many spaces were difficult to access due to the lack of sidewalks or the presence of private land that was difficult to access; therefore, the spaces where the investigator could enter were limited. Due to the characteristics of the Map-Torch device, a 30° irradiation angle in total (15° upward and 15° downward) was formed; therefore, the spaces within the range of the irradiation angle at a horizontal distance of about a 50 m radius could be scanned with a high point density. At greater distances, the point density dropped significantly. Therefore, handheld scanning was performed by dividing the space where the investigator could enter into several sections, which were later merged using Cloud Compare.
After merging the point cloud data acquired by the UAV and the Map-Torch device, 7025 MB of data for 211,604,465 points were acquired. When merging the UAV and Map-Torch data, a scalar field value could be assigned through which colors could be distinguished by classification. In the process of merging the point cloud data acquired from the UAV and the Map-Torch device, the data were generally well-segmented, except for the roof of the building or top of the railway track. As a result, if there were no point cloud data connected to the lower part of the track or if the point density was insufficient, the algorithm recognized it as another ground surface from which the layers were separated. It was therefore concluded that segmentation was difficult. Where such errors occurred frequently, it was necessary to edit in parallel with the use of both algorithms and manual measurements.

3.2. Voxelization of Landscape Infrastructure and Construction of the LIM

Following the voxelization of the landscape infrastructure around the railway, the volume calculated using Cloud Compare for the entire point cloud data was 16,708,831 m3 and the surface area was 269,284 m2. The results of examining each of the seven items are as follows (Table 5).
The total size of the building data was 395 MB, the number of points was 15,557,253, the volume was 1,628,847 m3, and the surface area was 23,750 m2. The voxel ratio of buildings was approximately 9.75% of the total volume (Figure 5a). For farmland, the UAV and the Map-Torch data were easily merged, and the total size of farmland data amounted to 972 MB, the number of points was 29,275,501, the volume was 2,784,370 m3, and the surface area was 50,284 m2. It accounted for 16.66% of the total volume (Figure 5b). The UAV and the Map-Torch data could also be easily merged for bare land, and the total size of bare land data amounted to 1041 MB, the number of points was 41,010,314, the volume was 4,393,398 m3, and the surface area was 83,764 m2. It accounted for 26.29% of the total volume (Figure 5c). The natural green area was mainly determined using point cloud data acquired by UAVs, and the total size of the data amounted to 2099 MB, the number of points was 63,236,852, the volume was 5,815,540 m3, and the surface area was 80,014 m2 (Figure 5d). It accounted for 34.81% of the total volume. The total size of the road data amounted to 216 MB, the number of points was 8,516,645, and the surface area was 15,527 m2 (Figure 5e). For a road with a large traffic flow, it was considered more efficient to use the mobile mapping system (MMS) method than the SLAM method. For railway facilities, it was confirmed that the data for bridges and lower parts of the track were missing due to the limited inspection angle of the Map-Torch device and the limitations of the UAV, for which it was difficult to obtain elevation information. For other land uses, the point cloud data acquired from UAVs and the Map-Torch device were combined. The total size of railway data amounted to 1276 MB, the number of points was 50,289,783, the volume was 1,544,851 m3, and the surface area was 20,685 m2. It accounted for 9.25% of the total volume (Figure 5f). For river data, because the water surface was not assessed as a point cloud, the area was classified based on the river embankments. The volume value for rivers was therefore the volume of waterside vegetation rather than the volume of the river. The total size of river data amounted to 94.4 MB, the number of points was 3,718,117, and the surface area was 6823 m2 (Figure 5g).
The characteristics of the quantified 3D landscape infrastructure can help to understand the environment around the railway in three dimensions through comparison with various components, such as railway facilities, the natural environment, and air quality. Object characteristics, such as area, volume, distance, and vertical structure of the landscape infrastructure, constituting the site can be identified through classification, segmentation, and voxelization by object and can be used as basic data for creating a dataset using Revit. Railways are based on linear routes and have a geographical form that is the basis of the network and are therefore optimized for information collection related to local environment changes (e.g., climate change) and ecological status (e.g., vegetation zones and river basins, natural green areas, and artificially created plant communities). The resources that are affected in connection with the installation of railway lines are important factors, and an environmental resource database would assist decision making in the field of railway construction.
For convergence with the existing railway BIM, eight stages of railway LIM dataset creation were conducted in this study using digital data for the landscape infrastructure around the railway (Table 6). The point cloud data acquired by UAV and the Map-Torch data were converted into files that were usable in Revit, and the possible digital conversion of landscape resources was reviewed by creating a dataset at the level of detail 1 (LOD 1) (Figure 6). The future LOD was analyzed step-by-step. A process was established to enable improvement. The railway LIM commenced with the digital transformation of landscape infrastructure around railways into point cloud data by utilizing core technologies of the Fourth Industrial Revolution (4IR), such as UAVs and a LiDAR sensor. It was confirmed that it was possible to create a railway LIM dataset through the classification and segmentation of data and a clustering and segmentation process using an AI algorithm. The construction of a railway LIM can be used to establish railway route plans in response to environmental changes when the ecological attributes of the surrounding environment and landscape infrastructure are established, and the relationships with climate and surrounding conditions are selected as functions.
Therefore, in the future, the BIM target objects that can assess the physical status of the railway surroundings should be combined with environmental data, including meteorological information. The environmental information for a specific location used in BIM should be expanded to include natural items (e.g., forests and rivers) as well as formal structures, such as railway facilities. In addition, if the items among the functional and physical attributes are added as variables along with their 3D shape, the quality of the railway’s surrounding environment can be more clearly evaluated based on the quantitative information in the railway LIM. The railway LIM does not limit the scope of the existing BIM regarding railway facilities but applies it to the landscape infrastructure surrounding railway facilities, providing an efficient decision-making tool for predicting, preparing, responding to, and restoring the impact of railway developments on the surrounding environment. In addition, by establishing a railway LIM, it is possible to derive more efficient results than existing business procedures can provide throughout the entire process of analysis, design, construction, and maintenance of the railway surrounding landscape infrastructure. The BIM concept facilitates connectivity between design and construction, interference checks, process simulation, and quantity calculations through 3D modeling, thereby increasing productivity and increasing collaboration among participants in various construction industries. It is therefore likely that similar useful outcomes could be derived from a railway LIM. Railway LIM models could be developed for environmental impact assessments, energy simulations, air quality predictions, environmentally sustainable maintenance, systematic environmental management, and safety enhancement for disaster prevention in the future. The LIM approach could also be extended for use in other fields.

3.3. Interpolation of Point Cloud Data

Interpolation refers to the process of estimating a mid-value located between the known values of surrounding points and is a method of arbitrarily filling in missing or lost data with a specific reference point. For example, as an interpolation method for an object with a known shape but no level value, it is preferable to proceed with a method of separating object data, such as a building, and converting data points one by one. The analysis steps for point cloud data proceed in the order of point–interpolation–mesh–analysis. Figure 7 shows the test results using the meshing method while interpolating points. In the test, data interpolation was possible by increasing the number of points obtained through the meshing step. Figure 8 is the result of partially merging additionally photographed data with existing test line data. By adding existing data to locations where there were almost no data on the bridge and lower part of the track, the data were effectively supplemented. The existing data were marked white, and each additional piece of photographed data was marked with a random color, enabling them to be checked separately.

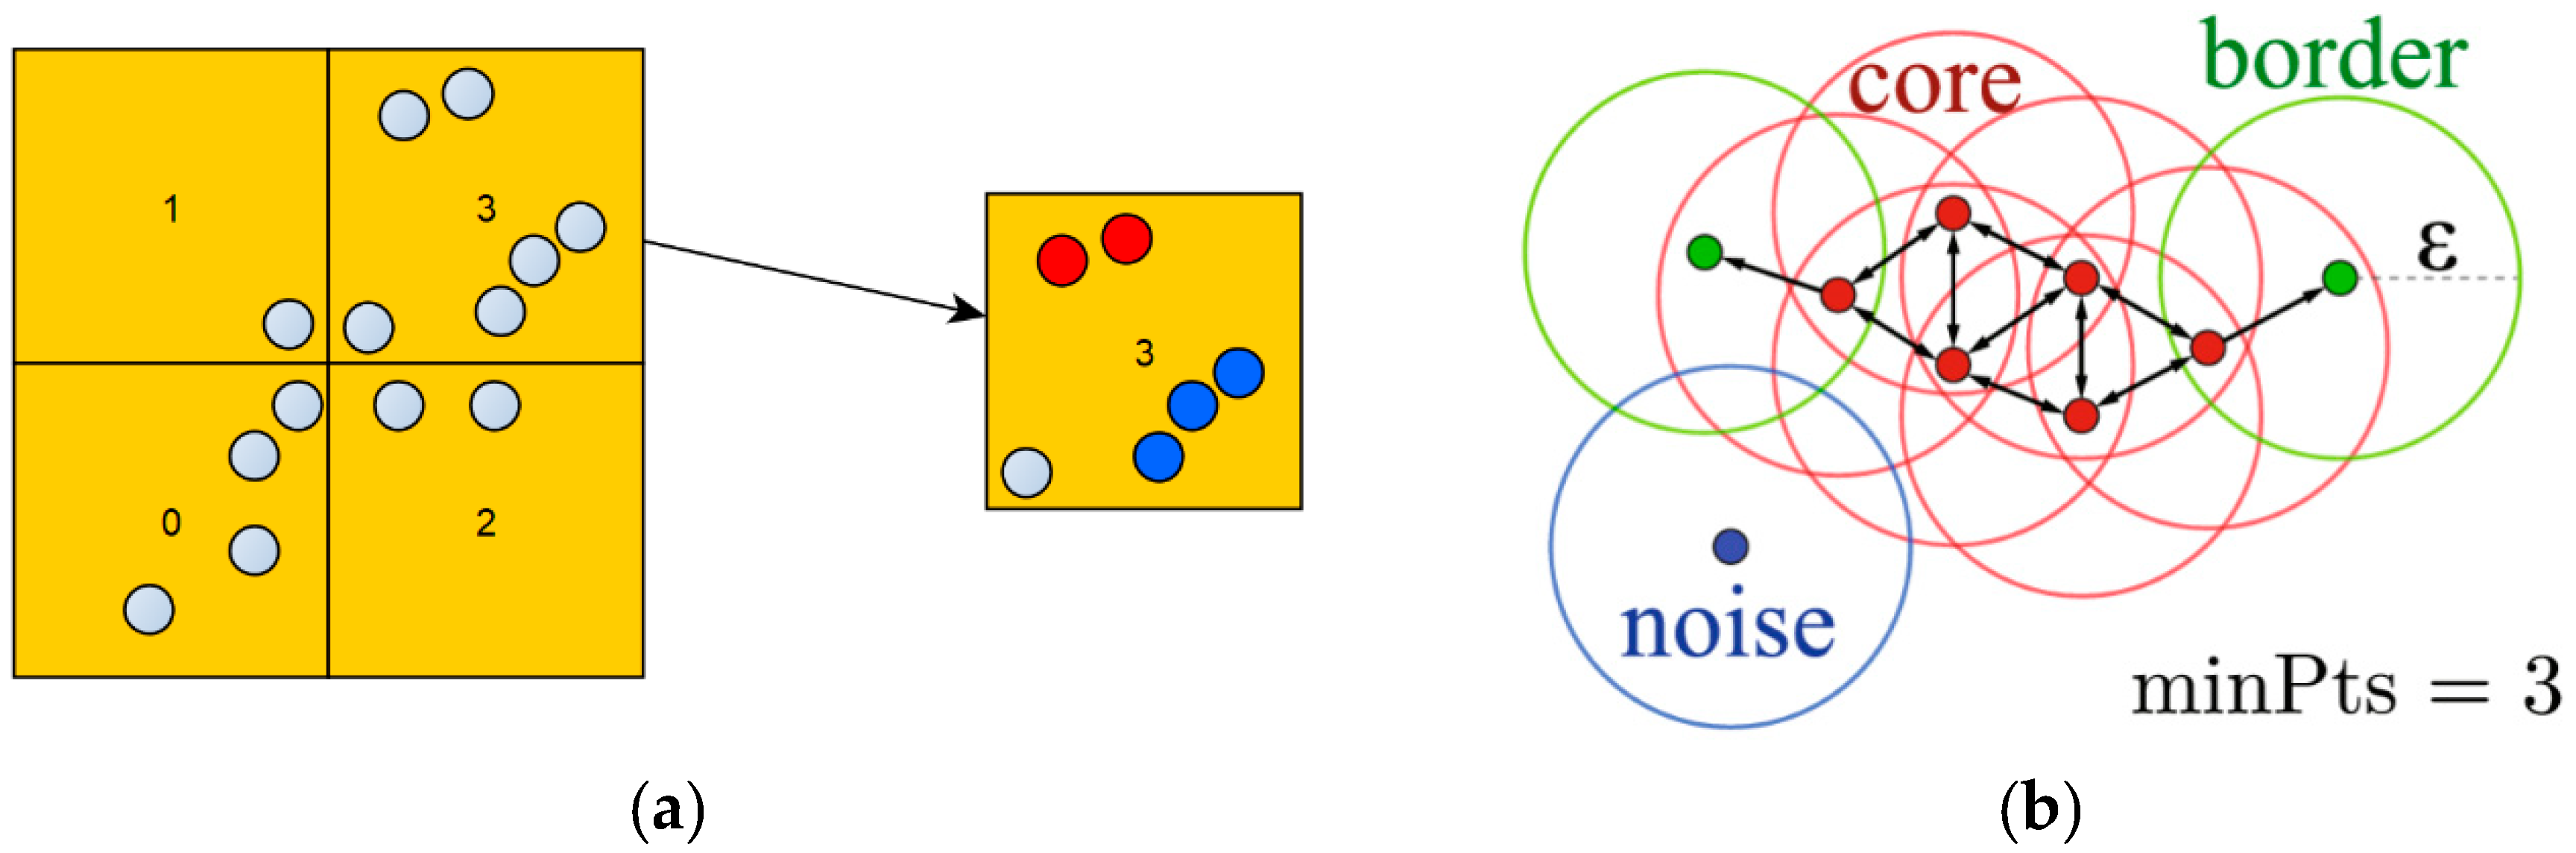
3.4. Clustering for AI Convergence

To separate and extract point cloud data by an object unit, the classification of data by object is an essential first step. A clustering algorithm is generally used to achieve this. This is a technique for defining similarity between individual data points and then clustering data that have a high degree of similarity. Available clustering algorithms include random sample consensus (RANSAC), k-means, and DBSCAN. Depending on the characteristics of the point cloud dataset and the requested results for each case, each clustering algorithm can be applied individually or in combination. In this study, the DBSCAN algorithm was applied because it was considered suitable for clustering in a wide and complex space. Before applying DBSCAN, the entire dataset was divided into grid units and indexed (Figure 9a). This was because it is more effective to read data by dividing them into grid units rather than loading the entire point cloud dataset at once. There are two main reasons for this. The first is to provide a standardized dataset for deep learning. Although DBSCAN is an algorithm that can be effectively applied to a wide range of datasets, it is not easy to cluster all objects with the same parameter conditions. This is because each object may have different characteristics, such as density. Therefore, it was necessary to divide the dataset into small units in advance and derive characteristics, such as position, size, and rotational information of the cluster after the analysis. After standardizing the dataset by obtaining controlled cluster information, the quality of the learning results was improved when deep learning was performed. The second reason is that computation work can be made more efficient. The DBSCAN algorithm measures the distance between each point, and it therefore requires a calculation between all points. The results vary according to the order of execution. Loading the entire dataset at once would take a very long time because the number of calculation targets increases exponentially and the probability of interference between points increases.
Grid space division and indexing were used to extract clusters by dividing virtual space into grid units and then applying a clustering algorithm to each space. After completing the clustering within the lattice unit, a separate search logic for the relationship between adjacent lattices was applied.
The DBSCAN algorithm used in this study is a point cloud separation operation method using a density-based data clustering algorithm (Figure 9b). Density-based clustering is a method of classifying high-density areas where data are concentrated in detail, and it assumes that data with similar characteristics are concentrated within a short distance. The DBSCAN algorithm classifies data into core, boundary, and noise points and clusters them based on key elements. The clustering speed is slightly slower than the k-means algorithm, but unlike the k-means algorithm, which requires the number of clusters to be specified in advance, clusters are automatically classified through DBSCAN’s internal algorithm. Due to these characteristics, DBSCAN can be applied to relatively large datasets and can be used for complex shapes.
In this study, the DBSCAN algorithm was applied with subsequent deep learning to extract objects from point cloud datasets. First, the point cloud dataset was used for the segmentation of standardized railway structures, with the aim of separating only railway structures and excluding other objects from the dataset.

3.4.1. Grid Unit DBSCAN Application and Parameter Adjustment

The DBSCAN algorithm was applied to railway structures after dividing the entire dataset into grids. After clustering the railway structures composed of main bodies, columns, and floors, it was confirmed that the shape of the clusters clearly differed depending on the Epsilon (Eps) value. When the Eps value was high, all points were expressed as one cluster, but when the Eps value was low, the boundary between the floor surface and column surface was separated and divided into individual clusters. In DBSCAN, the size and shape of the clusters vary according to the Eps and minimum point values. Figure 10 shows a clustering result obtained when the values of the two parameters were changed in the same dataset. In both cases, it was confirmed that the larger the value of Eps under the same minimum points condition, the larger the size of the cluster. When the minimum points value was adjusted with the same Eps, the cluster size did not simply expand. To create conditions that could accurately recognize and separate objects, it was confirmed that the application of a methodology that can quickly explore the optimal values of the two parameters is essential.

3.4.2. The Clustering Follow-Up

Objects clustered through the DBSCAN algorithm are unable to recognize and separate attributes by themselves. The clustering result obtained with DBSCAN is simply an object expressed by visually clustering point cloud data in a 3D space. It is difficult to recognize a corresponding cluster with only the clustered result. Therefore, an object detection process through AI learning needs to be applied. In this study, the process proceeded through learning by inputting information on clusters and objects together. Standardized cluster information was required as the input data for learning, and the detailed parameters were cluster position, size, and rotation information. Object labeling data were also required and used as a parameter. Figure 11 shows the results obtained when performing the post-processing work of the method described above for clustering with DBSCAN. The clustering aggregate was recognized as one object. Figure 12a shows the clustering result for railway structures, and Figure 12b shows the results of the semantic segmentation of the railway’s surrounding environment and landscape infrastructure derived from a combination of clustering by DBSCAN and manual interpretation.

4. Conclusions

In this study, seven landscape types were classified to describe the landscape infrastructure around the railway, and a railway LIM dataset was created using digitally converted 3D data. By creating a LIM dataset using point cloud data acquired by UAV and Map-Torch data, it was confirmed that digital transformation of the landscape infrastructure around the railway was possible, and a process was established to increase the LOD step-by-step in the future.
In addition, it was possible to construct the current status of the 3D volume concept through a voxel calculation, and a method for convergence with an AI algorithm was derived by clustering point cloud data using DBSCAN. In the future, it is likely that massive data processing will be possible through optimization of the point cloud data and AI convergence process; additional learning data are needed to develop various algorithms based on machine learning.
The future of the railway industry requires the establishment of a railway LIM for the integrated management of environmental information in areas surrounding railways, which can be applied together with the BIM of structures, such as railways and tunnels. The railway LIM model developed here also has application potential in other fields, including environmental management and safety improvement for disaster prevention.
The railway LIM creates and analyzes continuous 3D digital information throughout the entire life cycle of railways, which encompasses their surroundings and landscape infrastructure. The information can be used to preserve environmental resources and scenic values and can be used in connection with national digital projects. The results will assist with the efficient operation of the future railway system by reducing civil complaints and reducing social costs through data-driven rational decision making and strengthening the effect of the social safety net.
In the future, research to increase the LOD level of LIM is needed, and it is planned to be upgraded to a study that examines the social, economic, and technological benefits by linking the railway environment LIM with the railway facility BIM.

Author Contributions

M.-k.K. planned the study and contributed the main ideas; M.-k.K. was principally responsible for writing the manuscript; K.-J.C. handled the software and resources; D.P. and S.Y. and W.-H.P. and D.L. and J.-D.C. revised the manuscript. All authors have read and agreed to the published version of the manuscript.

Funding

This study was conducted with funding from the National Research Council of Science and Technology (Drone-LiDAR-based Railway Project Environmental Impact Assessment Digitization Convergence Cluster, RP22138B) and conducted with funding the AI-Based Development of Technology to Reduce Exposure of Subway Users to Particulate Matter program(RS-2019-KA152306) and Internationalization of the Conformity Assessment System and Establishment of the Safety Monitoring system for the Smart Railway system on the Test Line (PK2304C1).

Data Availability Statement

MDPI Research Data Policies.

Conflicts of Interest

The authors declare no conflict of interest.

References

  1. Korea Railway Research Institute. Railway BIM 2030 Roadmap. 2018. Available online: http://big.yonsei.ac.kr/railbim/ (accessed on 25 January 2023).
  2. Construction Industry BIM Basic Guidelines; Ministry of Land, Infrastructure and Transport: Sejong Special Self-Governing City, Republic of Korea, 2020. (In Korean)
  3. The Korean Version of the New Deal 2.0, the Core of the Hyper-Connected New Industry; Digital Twin Enablement Strategy; Information and Communication Strategy Committee: Sejong Special Self-Governing City, Republic of Korea, 2021. (In Korean)
  4. Government; Korean New Deal 2.0 Promotion Plan; Government: Sejong Special Self-Governing City, Republic of Korea, 2021. (In Korean)
  5. Kim, M.K. A study on the post-environmental impact assessment and derivation of optimal techniques for comprehensive railway test track using UAV. J. Korean Soc. Railway. 2021, 23, 625–636. (In Korean) [Google Scholar] [CrossRef]
  6. Kim, M.K. A basic study on the construction of railroad LIM and AI convergence using 3d digital transformation of comprehensive railway test track surrounding areas. 2022. (In Korean) [Google Scholar]
  7. Mahdy, A.M.S. A numerical method for solving the nonlinear equations of Emden-Fowler models. J. Ocean. Eng. Sci. 2022. [Google Scholar] [CrossRef]
  8. Mahdy, A.M.S.; Lotfy, K.; Lotfy, A.A. Use of optimal control in studying the dynamical behaviors of fractional financial awareness models. Soft Comput. 2022, 26, 3401–3409. [Google Scholar] [CrossRef]
  9. Mahdy, A.M.S.; Higazy, M. Numerical different methods for solving the nonlinear biochemical reaction model. Int. J. Appl. Comput. Math. 2019, 5, 1–17. [Google Scholar] [CrossRef]
  10. Gartner. Use the IoT Platform Reference Model to Plan Your IoT Business Solution. Gartner, Inc. in United States. 2016. Available online: https://www.gartner.com/en/documents/3447218 (accessed on 25 January 2023).
  11. Gartner Glossary, Digital Twin. Available online: www.gartner.com (accessed on 25 January 2023).
  12. Gartner. Top Strategic Technology Trends for 2021. Gartner, Inc. in United States. 2020. Available online: https://www.tom.travel/wp-content/uploads/2021/01/top-tech-trends-gartner-2021-1.pdf (accessed on 25 January 2023).
  13. Kim, B.Y. Trends in landscaping field related to BIM and LIM vitalization plan. J. Korean Soc. Landsc. Archit. 2014, 42, 50–63. (In Korean) [Google Scholar] [CrossRef] [Green Version]
  14. Ahmad, A.M.; Aliyu, A.A. The need for Landscape Information Modelling (LIM) in landscape architecture. Proc. DLA Conf. 2012, 531–540, ISBN 978-3-87907-519-5. [Google Scholar]
  15. Davis, B. Landscape and instruments. Landsc. J. 2013, 32, 293–308. [Google Scholar] [CrossRef]
  16. Sipes, J.L. Building information modeling technology is the future for landscape architecture. Landsc. Archit. 2007, 97, 88–91. [Google Scholar]
  17. Landscape Institute. Available online: http://www.landscapeinstitute.org (accessed on 25 January 2023).
  18. Norske Landskapsarkitekters Forening NLA. Available online: www.landskapsarkitektur.no (accessed on 25 January 2023).
  19. Ministry of Land, Infrastructure and Transport. Smart Construction Challenge 2022-BIM Contest for Designing SOC Fields such as Railways #13: Advancement of Design Quality through Application of BIM for High-Speed Railway Honam Scrap Rail Phase 2 Section 2 Construction BIM Design Case. Available online: http://smartconstchallenge.com/modules/board/bd_view.html?no=47&id=movie&ca=4&mc_code=3014&p=1&or=bd_order&al=asc (accessed on 25 January 2023). (In Korean).
Figure 1. Location and current status of the study site.
Drones 07 00167 g001
Figure 2. UAV and handheld LiDAR equipment: (a) UAV (Inspire2); (b) Camera (Zenmuse X5S); (c) Map-Torch.
Drones 07 00167 g002
Figure 3. Point cloud data acquired by a UAV and handheld LiDAR sensor: (a) point cloud data acquired from a UAV; (b) point cloud data acquired from a handheld LiDAR sensor.
Drones 07 00167 g003
Figure 4. Merging of point cloud data acquired by a UAV and handheld LiDAR sensor.
Drones 07 00167 g004
Figure 5. Classification and voxel calculation of point cloud data: (a) buildings (1,628,847 m3); (b) farmland (2,784,370 m3); (c) bare land (4,393,398 m3); (d) natural green land (5,815,540 m3); (e) roads; (f) railway facilities (1,544,851 m3); (g) rivers; (h) total (16,708,831 m3).
Drones 07 00167 g005aDrones 07 00167 g005b
Figure 6. Generation of an LOD1 railway LIM dataset using point cloud data: (a) buildings; (b) farmland; (c) bare land; (d) natural green land; (e) roads; (f) railway facilities; (g) rivers; (h) total.
Drones 07 00167 g006
Figure 7. Interpolation and meshing of points: (a) before interpolation; (b) after interpolation.
Drones 07 00167 g007
Figure 8. Interpolation of railway facilities.
Drones 07 00167 g008
Figure 9. Grid-wise indexing and the DBSCAN algorithm: (a) lattice tessellation and indexing; (b) lattice tessellation and indexing.
Drones 07 00167 g009
Figure 10. Clustering results according to the Eps and minimum point values: (a) Eps = 0.5, minimum points = 5; (b) Eps = 0.8, minimum points = 5; (c) Eps = 1, minimum points = 5; (d) Eps = 1, minimum points = 3.
Drones 07 00167 g010
Figure 11. The results of applying follow-up work after DBSCAN clustering: (a) before post-processing; (b) after post-processing; (c) before applying DBSCAN; (d) after the application of DBSCAN and post-processing of some grids. We moved the subfigure explanations into the figure caption. Please confirm.
Drones 07 00167 g011
Figure 12. The railway LIM object segmentation results: (a) railway structure object split results; (b) the object segmentation results for a railway’s surrounding environment.
Drones 07 00167 g012
Table 1. The GCP coordinates.
GCP IDEastingNorthingElevation
1451,429.2324224157.270750.4667
2451,671.4710224,371.610052.0550
3451,577.9242223,962.79966.0829
4451,539.4485224,542.318150.2407
5451,356.8614224,325.989048.3972
6451,274.3041224,438.037647.7556
Table 2. The checkpoint (CP, BM) coordinates.
GCP IDEastingNorthingElevation
CP1451,657.8871224,067.50464.6463
CP2451,386.8250224,517.56649.1150
BM1451,537.2968224,218.736850.1259
BM2451,533.3192224,215.110650.0665
BM3451,430.9190224,161.775950.4725
Table 3. Research flowchart.
StepResearch Goals and ContentsResearch Method
Level 1Literature review and test site selectionliterature review
Level 2Classification of landscape infrastructure around railways by type and derivation of components by categoryliterature review, field investigation
Level 3Point cloud data generation and object recognition for landscape infrastructure around railroadfield investigation, analyze
Level 4Establishment of railway LIM dataset and review of artificial intelligence convergence possibilityanalyze
Level 5Derivation of railway LIM construction plan that can be converged with railway BIManalyze
Table 4. Derivation of the components in each classification system.
Main CategoryMiddle CategorySubdivision
PatchNatural greeneryForest green belt, urban green belt, artificial green beltTree forests (coniferous, broad-leaved, mixed forests), shrub forests, grasslands, etc.
FarmlandFields, paddy fields, orchards, livestock land, horticultural landSubdivision according to tree species and cultivated species, ranch land, etc.
Bare landUnused land, construction sites, mineral springs, salted landSubdivision according to land structure, subdivision according to construction purpose
CorridorRailwayRailways, tunnels, and railway facilitiesRailways, tunnel facilities, railway auxiliary facilities
RoadVehicle roadways, pedestrian pathsExpressways, national roads, cities and towns, archipelagos, old towns, hiking trails, etc.
RiverEmbankments, high waterways, low waterways, load diagramsThe top of the embankment, access stairs, trails, sand bar deposits, etc.
ObjectBuildingResidential areas, factories, schools, parking areas, warehouses, physical educationDetailed facilities within the building structure
Table 5. Voxelization of landscape infrastructure and construction.
ItemsThe Total Size of the Building DataThe Number of PointsThe VolumeThe Surface AreaThe Voxel Ratio of Buildings
Buildings395 MB15,557,2531,628,847 m323,750 m29.75%
Farmland972 MB29,275,5012,784,370 m350,284 m216.66%
Bare land1041 MB41,010,3144,393,398 m383,764 m226.29%
Natural green land2099 MB63,236,8525,815,540 m380,014 m234.81%
Roads216 MB8,516,645-15,527 m2-
Railway facilities1276 MB50,289,7831,544,851 m320,685 m29.25%
Rivers94.4 MB3,718,117-6823 m2-
Table 6. The process adopted for establishing a railway LIM.
Step-by-Step ProcessDetailsNotes
1Merging and editing point clouds
  • Data acquired by drones and a LiDAR sensor are merged.
  • Unnecessary data are removed (i.e., data other than the destination from the merged data).
The merging process and editing are performed in Cloud Compare.
2Change settings (such as the location value of the point)
  • The coordinates of LiDAR data are designated according to the coordinates of the drone.
  • In the process of merging, the process is centered on drone data.
Location information is saved in the form of .las, .ply, etc.
3Separation of the DTM and DSM
  • Ground and non-ground are classified.
  • An automatic classification is conducted using the CFS filters within Cloud Compare.
Adjustment of the setting values is required for high-quality results.
4Noise removal
  • The noise from classified files is removed using the SOR filter.
  • The parts that cannot be removed by the filter are manually removed.
The SOR filter proceeds with the default settings.
The upper part of the tree is excluded when applying the filter.
5Segmentation
  • Data division proceeds according to the classification system.
6File conversion
  • The file is converted so that it can be activated in Revit.
The Recap program is used.
7File conversion
  • A model in Revit is created based on the activated point cloud data.
Processes such as family creation, terrain creation, and contour line creation are employed.
8Visualization
  • A 3D view of the created model is established.
Disclaimer/Publisher’s Note: The statements, opinions and data contained in all publications are solely those of the individual author(s) and contributor(s) and not of MDPI and/or the editor(s). MDPI and/or the editor(s) disclaim responsibility for any injury to people or property resulting from any ideas, methods, instructions or products referred to in the content.

