Abstract
Precision agriculture technology has advanced rapidly in the 21st century. Despite this, the vast majority of US farmers do not employ any form of precision agriculture. Reasons for this include the high initial cost, lack of internet connectivity in rural areas, and complex setup and operation. The basis of this project was to create a low-cost, energy-efficient data collection system using an unmanned aerial vehicle (UAV) as a mobile sink node in a local wireless system. This was accomplished through the design and manufacture of custom sensor nodes and a custom drone-mounted wireless receiver node. The sensor node and drone node enclosures were 3D printed and assembled using low-cost materials and internal components. The system was successfully tested in a field where it collected soil data, including soil moisture, soil temperature, and electrical conductivity. The cost and scalability of the system are discussed, as well as potential improvements and comparisons with existing technologies. The system was concluded to have many potential applications in its current state but with room to expand and improve its operation and features.
1. Introduction
According to the 2020 World Population Data Sheet, the global population is estimated to increase from about 7.8 billion in 2020 to nearly 10 billion by the year 2050 [1]. Such growth necessitates a simultaneous effort to produce greater amounts of food and other resources to meet the ever-growing demand. A key factor in this expansion is the role of irrigated agriculture.
Today, although only 7.5 percent of cropland and pastureland in the US is irrigated, it provides nearly 55 percent of the total value of crop sales, suggesting an important role in overall agriculture productivity [2]. Water is a critical resource for sustainable crop production systems in the US and worldwide, and limited soil water availability reduces crop growth more than all other environmental factors combined [3]. Irrigated croplands require large amounts of water to achieve and maintain maximum crop yields. Improving irrigation management is therefore necessary to maximize water-use efficiency and crop productivity. One of the ways that irrigation management can be improved is with the timely monitoring of croplands, which makes agricultural activities more effective and sustainable [4]. This can be achieved with precision agriculture.
Precision agriculture refers to the use of digital technologies to monitor important attributes of a field or the plants within. These technologies can be enormously beneficial to farm managers as they provide accurate, up-to-date information concerning the status of soil moisture, canopy temperature, or other attributes. However, most farms in the United States do not use any form of precision agriculture [5]. The main reasons cited for this are that they exist in rural areas with little or no cell phone coverage or internet access and have large plots of land that would require large, expensive systems to cover. In addition, farmers cite the difficulty of deploying such systems and the challenge of deciphering the (often large) datasets obtained. Therefore, it is necessary to invest in low-cost technologies that aid in the monitoring of large rural areas with little or no cellular or internet connectivity.
There are many factors to consider in irrigation management. One of the most important factors is soil moisture, as it is a vital component of crop health. Traditional methods of collecting soil data involve manual sampling, which is a time-consuming process. However, the advent of digital instrumentation and networking has opened many possibilities for automation in agriculture. Agricultural remote sensing is considered one of the backbone technologies of precision agriculture and takes into account within-field variability for site-specific management rather than uniform management as in traditional agriculture [6]. Wireless sensor networks (WSNs) have proved to be an important and useful tool for collecting data across various industries, including in agriculture. A WSN consists of individual sensor nodes that record data and then communicate them to some form of central location. This approach employing individual devices within a larger network is referred to by some as the Internet of Things (IoT). The IoT is often cited as a paradigm shift in the advancement of the smart agriculture field [7].
Many types of research are ongoing in relation to IoT devices. A primary focus of the research has involved maximization of efficiency and improvement of the longevity of such devices. For example, many portable devices experience a reduction in power over time, and energy-harvesting techniques have been seen as a way to overcome this limitation and significantly extend the operational life of those devices [8,9].
A related emerging technology is the use of UAVs in smart agriculture. This has been referred to by some as a new type of transformation in the agricultural industry [10]. Compared to other types of remote data collection, UAVs offer a wider range of versatility and flexibility. They do not require scheduling to be planned as far in advance as other aircraft or satellites and can fly reliably at low altitudes and low speeds with the ability to acquire spatial and temporal data [11]. A previous survey of the literature stated that UAVs will not only play an important role in the Internet of Things (IoT) vision but may even become the main key enabler of that vision. Drones are particularly useful for data collection, not just in agriculture but also across broader areas such as vegetation science, environmental monitoring, forestry, remote sensing, and water area detection [12]. Other uses of drones in precision farming and the agricultural supply chain include farm analysis, integration with cameras, and GIS mapping [13]. In addition, drones can even be used to deploy a wide range of resources to a field, such as water, fertilizers, and pesticide [14]. In most cases, sensors are deployed at difficult-to-reach locations. Sometimes, these locations include hilly areas and large farms where nature hurdles, such as trees, small mountains, or unexpected slopes, cause signal distortion. In such cases, it is difficult to gather data. However, the use of UAVs in such areas can reduce the cost and increase the efficiency of data collection [15,16].
When compared to traditional aircraft, drones are highly cost-efficient and easy to set up and maintain. However, the real-life proliferation and use of UAVs in smart farming has not so far been as robust as expected, mainly due to the challenges involving the selecting and deploying of the relevant technology [17]. The overall literature has grown rapidly and attracted much attention over the past decade or so, demonstrating exponential growth in the number of articles published since 2012. A review of the methodologies of relevant studies observed that most of the research has centered on system design and conceptual or review-based studies and that there appears to be a lack of empirical, qualitative, and case-study-based methods that investigate specific applications of agricultural drones [18]. In cases where drones are used in an agricultural study, the most common applications involve the use of drone-mounted sensing equipment, such as cameras, rather than any mobile collection applications [19].
While the implementation of UAVs as mobile data collectors for deployed sensor nodes has been suggested, most of the relevant literature has been focused on their theoretical application. In recent months, there has been growing interest in the use of AI algorithms for the improvement of UAVs in agriculture. A recent study examined the use of deep learning and related algorithms to help with environmental perception, processing of data, and enabling of higher-level autonomy in a system [20]. A report in 2022 used data from 30 separate studies employing UAVs in various ways, such as crop spraying, to determine the theoretical efficacy of a UAV-WSN system in which a UAV would be used to collect data from ground-based sensors. The study focused on the path planning and efficiency of the proposed system and concluded by emphasizing the need for future work on this topic [21]. The use of drones in agriculture is thus a field with many possibilities. However, there is a clear need for hands-on applications that satisfy the needs of farmers for low-cost alternatives to traditional methods.
In this research, the aim was to develop an efficient, low-cost solution for soil monitoring using a UAV as a mobile data collector. The authors hypothesized that the use of efficient microcontrollers, low-cost components, and efficient power management techniques in the custom data collection system would result in lower input costs and energy savings compared to alternative precision agriculture technologies. To test this, the authors compared the resulting costs and benefits of the designed system with existing technologies. Field deployment and flight tests were also conducted to verify that the technology worked as intended and to test the effective communication range. This paper is structured as follows: Section 1 provides an overview of the proposed system. In Section 2, we look at the materials and methods, including a list of components used in the design of the sensor nodes. In Section 3, we discuss the results. In Section 4, we include a comparison with existing precision agriculture technologies in terms of cost, as well as a summary of the advantages and limitations of each. In Section 5, we summarize the system and discuss potential areas of improvement for the future.
2. Materials and Methods
2.1. System Overview
The method proposed in this research is a system that employs a low-altitude drone with a local wireless connection to retrieve data from sensor nodes spread throughout a field as seen in Figure 1. The sensor nodes collect data with an attached sensor and store that data until they detect a signal from a receiver node on the drone flying by in proximity. At that point, they communicate with that receiver and upload their collected data to it. After the drone has collected all data from the sensor nodes, it returns to its home destination, where the data can be retrieved from local storage or uploaded to the cloud if there is connectivity.
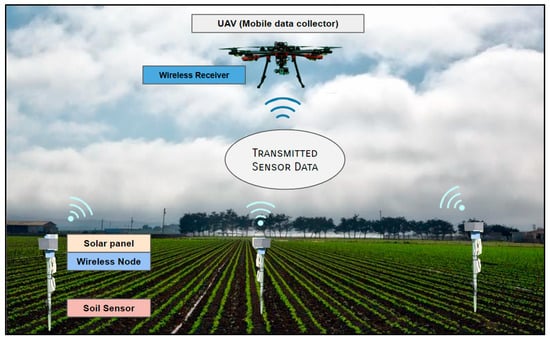
Figure 1.
System conceptual diagram.
The proposed system has two major components: the drone node receiver and one or more sensor nodes. Each was constructed with custom-designed, 3D-printed enclosures. For our trials, a hexacopter drone was used to mount the drone node and retrieve data from the field sensors. However, the receiver node could be mounted on a wide range of aerial drones, meaning it is not restricted to a hexacopter, multirotor, or any specific drone type. The sensor nodes are similar in design to the drone node but with additional components to support independent operation and long-term deployment. Figure 2 provides an overview of the key elements.
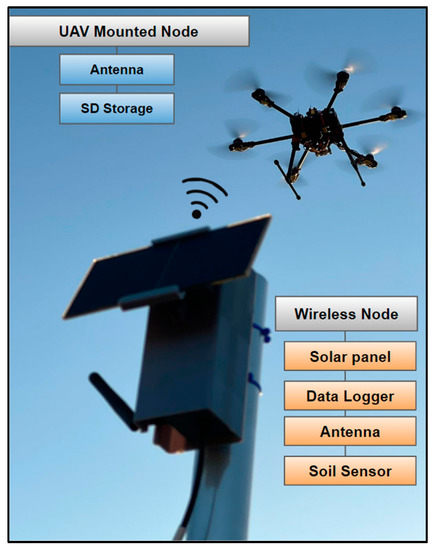
Figure 2.
System element overview.
The drone node is powered by the drone’s battery, has an antenna, and acts as a sink node to collect data from the deployed sensors once within range. The data are stored in an SD storage unit and then uploaded to a cloud once the drone is retrieved and Wi-Fi is established. The sensor node includes components not present in the drone node, such as a battery, datalogger, and solar panels. Both systems operate using an ESP-32 microcontroller and a custom PCB. The sensor nodes operate on a schedule based on an internal clock, gathering data every 15 min. Overnight, they enter a low-power mode, waking intermittently to record data before resuming hibernation.
The following section expands on the specifics of the sensor node design, drone receiver design, overall system logic, and field operations.
2.2. Sensor Node Design
The sensor nodes used in this research went through several successive iterations, with each improving on the last. The latest version was referred to as V4, and it is the one referred to in this article. The V4 sensor node enclosure is a vertical, 3D-printed housing. It is composed of three main parts: the base, the cover, and the attached solar panel mount. Figure 3 presents the base section of the enclosure (left) and outer cover with the solar panel mount attached (right). The solar panel mount is a simple, clamp-like part that the two solar panels slide into side by side.
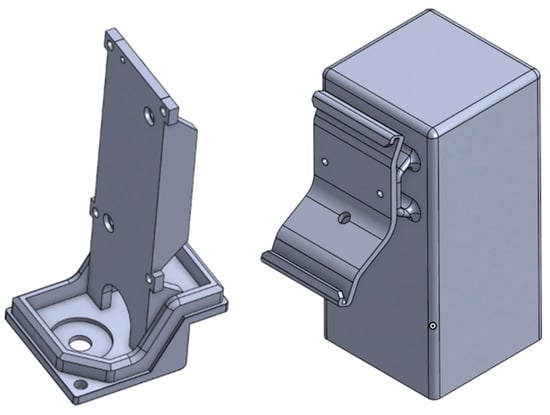
Figure 3.
Sensor node V4 enclosure base and cover CAD models.
At the bottom of the enclosure base, there is a small opening so that the power and ground wires can be fed from the electronics assembly to the inside. On the back of the housing, there is a bracket piece that is used to tie the device to a pole to elevate the position of the sensor above ground. This is to make sure that the sensor node is not only secure but also has increased communication range to make connecting with the drone node easier. There is also a notch on the left side of the housing that lines up with a hole on the side of the base that allows for the antenna to fit through.
The base of the enclosure is where the electronics are primarily located. This part was made to be easily removable from the housing for researchers to have fast access to the electronics. There is a 0.5 mm gap on the inside of the housing, and the outside edges of the base were made as small as functionally possible in order to protect the electronics from moisture caused by rain or humidity. The base is held in place by two M3 × 12 socket head screws.
The enclosure assembly was manufactured using two different materials for the components. The exterior housing and solar panel mount were manufactured with the same material using an SLA 3D printer. This printer utilizes a UV-curable resin that is available in a variety of colors. The SLA printer and UV-curable resin were chosen because they could produce water-tight parts that were more likely to withstand the elements. However, to reduce the cost of 3D printing for the project, the base was 3D printed using an Ender 3 FDM printer. Since the base would not be exposed to the elements, it was decided that these parts did not need to be printed using the same watertight material as the enclosing cover. PolyTerraTM PLA was chosen as the printing material for the base components due to its interlayer adhesion and strength.
The sensor node uses solar panels to charge the battery and thus extend the lifetime of the device. Two identical solar panels were mounted on the enclosure, replacing a single solar panel in earlier versions. The dual solar panels combine to achieve the necessary current required to charge the battery. Figure 4 (right) shows the assembled cover and solar panel mount with solar panels in place.
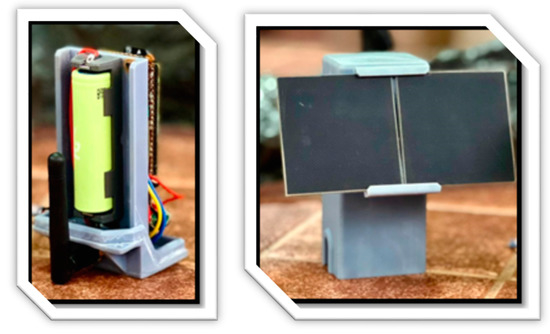
Figure 4.
Assembled sensor node V4 parts with solar panels.
The electronic assembly was designed to facilitate easy maintenance and adjustment of all parts. As mentioned, the base of the enclosures can be unscrewed to allow quick physical access to internal components if needed. Figure 4 (left) shows the base of the sensor node with the battery, antenna, and other electronics in position. The electric wires and male and female pin heads were soldered into the connection holes on the circuit board to provide proper conductivity between components.
2.3. Drone Node Design
The drone node case is made up of two separate parts. The first part is the base on which the electronics are mounted, and the second is the outer casing that protects the node’s circuitry. The base part houses various components, such as the microcontroller board and a Wi-Fi module, with an opening for the antenna. The CAD drawings in Figure 5 show the base with electronics and the upper casing.
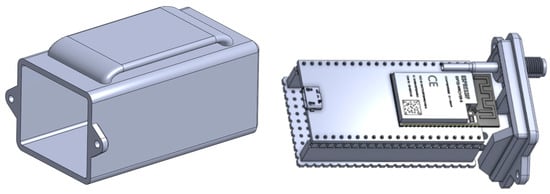
Figure 5.
Sensor node V4 electronics assembly CAD models.
The drone node enclosure was 3D printed using PLA and the circuit board with electronics placed inside. The base was then attached to the cover using two screws. The completed drone node was mounted on a UAV and connected to its power source. Figure 6 shows the completed drone node with the outer casing in place.
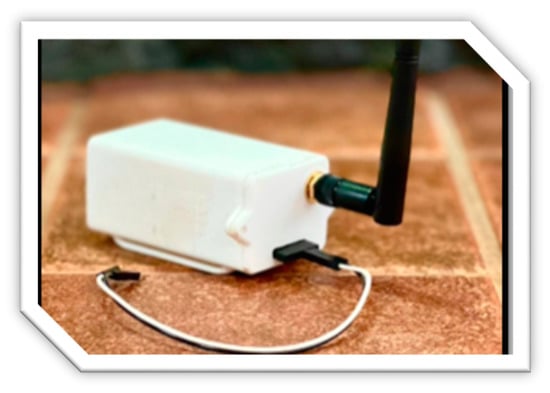
Figure 6.
Drone node with 3D-printed enclosure.
2.4. Design of Internal Components
The electronics assembly consists of multiple electronic components that work alongside each other to create a system that effectively collects and transmits sensor data. When the sensor nodes detect the drone in their proximity, they begin the process of transmitting data to the drone node, which is ready to receive and store the data. Figure 7 shows a diagram of both the drone node (top) and sensor node (bottom) electronic components and their relation to one another.
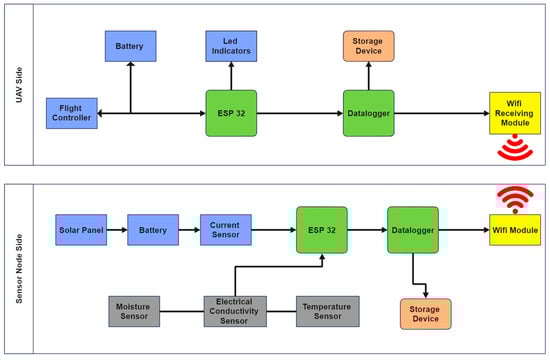
Figure 7.
System components diagram.
The following is a list of the primary components found within each sensor node:
- Microcontroller;
- Battery;
- Solar panels;
- Datalogger;
- External antenna;
- TEROS soil sensor.
- Microcontroller: An ESP32 acts as the controller for the entire system. This component was chosen due to its low-cost, low-power operation and versatility. It is often described as a “system on a chip” because of the integration of all or most components that can be found in a computer or other electronic system. The device comes integrated with Wi-Fi and Bluetooth modes. The microcontroller capabilities include an inbuilt uFL connector to allow signal processing in tandem with the external antenna. The I/O pins of the microcontroller are positioned to be broken out to the pin headers on both sides of the component. This allows for easy interfacing between the pin headers and the wire connections. The microcontroller capabilities also include the use of different “sleep modes”, which are power-saving modes that can be initiated and stopped with some simple coding. When in these sleep modes, all power that is unnecessary is cut. All information is stored in RAM, which continues to receive enough power to operate properly. The ESP32 communicates using an IEEE 802.11 b/g/n-compliant wireless communication protocol and transmits at a frequency of 2.4 GHz. The output power from the Wi-Fi module is 100 mW, which means no specific regulations due to the power output of the transmission being so low;
- Battery: The battery is the primary power source for the microcontroller component. It is a 3.7 V lithium-ion 2.6 Ah rechargeable battery that is wired to solar panels that act as an environmentally powered charging station in the event that the battery’s power levels become too low to run the microcontroller alone. This battery was chosen for its robust chemistry and its relatively high temperature tolerance. A battery charging circuit was added to the electronics assembly to simplify the charging of the sensor node battery and to power the rest of the electronic system. The battery charger takes 5 volts from the voltage regulator connected to the solar panels to power itself. It has two separate pins for output voltage and ground. One pair of pins is specifically for battery charging. The other two can be used for powering other components or left alone. The electronics assembly uses these pins to power the microcontroller and, by extension, the sensor node system;
- Solar panels: Solar panels were included in the design as a way to recharge the battery and extend the lifespan of the system. It was decided to use two monocrystalline solar-cell panels connected in parallel to increase the overall amperage output, thus supplying the necessary current to charge the battery. Doing so increased the value by a factor of four in comparison to a singular solar panel. Together, the two panels generate 12 V at up to 0.1 amps, providing a total of 1.2 watts. This allows a charge to be supplied to the battery, while the battery acts as a buffer to the power requirements. A voltage regulator is used to take the voltage generated by the two solar panels and drop it down to half so that the power can be safely carried to the battery charger. However, the voltage regulator by itself cannot produce the necessary voltage downstream. Therefore, a DC/DC step-up converter is also used to guarantee the necessary voltage is delivered to downstream components. This addition proved to be an excellent decision as the lithium ions have better capacity in relation to weight but less current-producing ability. This results in more battery storage for the sensor node to utilize;
- Datalogger: This contains a coin cell battery for its power requirements and an SD card for automatic data storage. The datalogger collects data from all sensors in the sensor cable and stores them until the data are ready to be transmitted to the drone. The inner clock of the datalogger is powered by a lithium cell battery;
- External antenna: The external antenna is directly connected to the circuit board of the microcontroller. This component is used to increase the range of the datalogger so that the data can be transferred to the drone over longer distances. The antenna has excellent performance records for dual-band and omni-direction broadcasting and receiving. The component is capable of being tilted or swiveled for enhanced signal connections;
- TEROS 12 sensor: This sensor is capable of taking measurements of the soil’s moisture level, temperature, dielectric measurement frequency, and electrical conductivity. The TEROS 12 sensor has a large volume of influence for its sensor size and is less susceptible to soil variability errors compared to other sensors on the market. Its volume of influence is rated at one liter, while the sensor is only 9.4 cm long. It is designed to be rugged, dustproof, corrosion-resistant, and waterproof. The TEROS 12′s sensor prongs allow it to be easily deployed in the field. Its low power consumption, high data resolution, and factory-guarantee calibration provide increased quality and precision of data over a longer period. The sensor components of the sensor node V4 are wired directly to the datalogger. The sensor cable is programmed to wait for the system queue to start transferring data to the system’s storage component (the datalogger).
2.5. Field Operations
To test the system, the hexacopter was fitted with a simple 3D-printed pilot indicator with LEDs that can be used to notify the pilot of the drone node’s current connection status. A flashing light indicates a connection is in progress, while a solid light indicates that the connection was successful as seen in Figure 8. A red light is used to indicate that an error has occurred in the case of an unsuccessful connection.
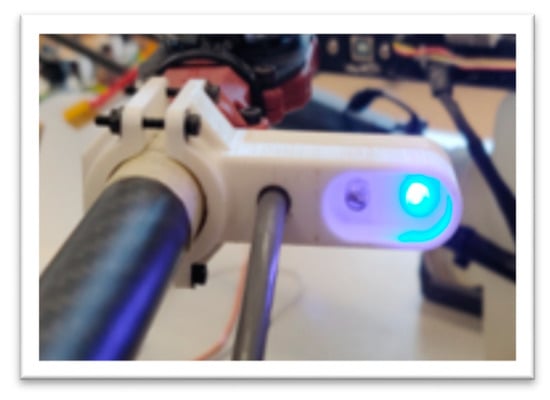
Figure 8.
Drone node connection indicator.
Figure 9 details the internal logical process followed by the drone node software in attempting to connect to the sensor on the ground. The code was implemented using the Arduino IDE, but a generalized representation is shown here. The system attempts to connect the sensor nodes and then stores the data and uploads them via Google Sheets integration.
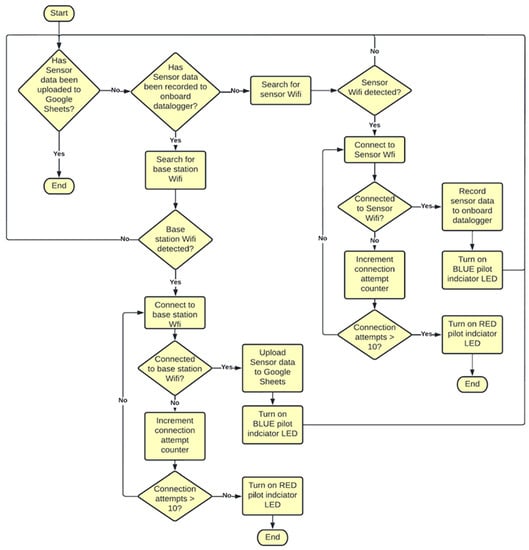
Figure 9.
Drone node internal logic.
In the case of a successful connection with the sensor node, a blue LED is turned on to alert the pilot that a link has been established. On the other hand, if the system attempts to make a connection and fails, it will attempt to connect a total of ten times before displaying a red LED to indicate a failed connection. This process is mirrored when the drone attempts to connect to the base station to pass on the data obtained.
3. Results
3.1. Power Consumption
The sensor node consumes 1.6 × 10⁻⁵ watts when in hibernation mode and approximately 1.0 watts when it is fully active. As the power usage during the deep sleep periods is extremely low, this allows the sensor node to conserve its battery life for long periods of time. Figure 10 shows the power usage over time across a typical hour of the deep sleep cycle.
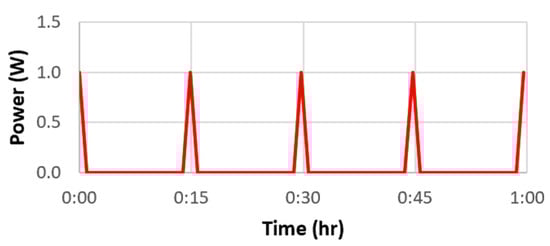
Figure 10.
Hourly power usage profile.
The sensor node was configured to record data from its sensors every 15 minutes. The sensor nodes remain active (ready to communicate) during daylight hours from 9 a.m. to 5 p.m. Overnight (7 p.m. to 7 a.m.), the node was programmed to enter a deep sleep mode, which helps to conserve the battery’s power. However, even in sleep mode, the system will wake up intermittently after 14 min of inactivity (for 1 min) to record sensor data before going back into hibernation. The recorded data are logged and stored on the microcontroller so they can be transferred to the drone node at a later time.
Note that the power consumption is never exactly zero, just very low (1.6 × 10⁻⁵ W). If one were to assume no solar charging whatsoever and a relatively linear discharge rate, the waking/sleeping cycle of the sensor node would, in theory, allow the device to continue collecting data for about 42 h, declining slowly and then steeply once every 15 min due to the stress of the active state. This behavior is demonstrated in Figure 11.
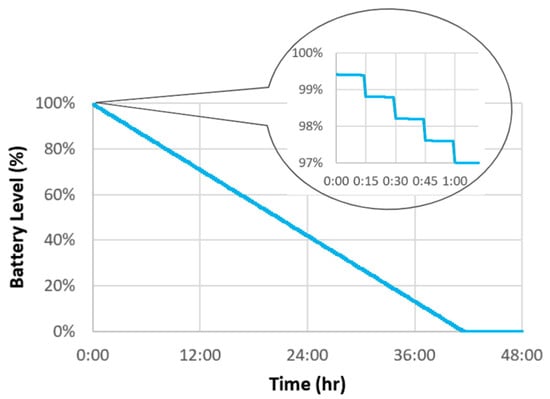
Figure 11.
Battery level without solar recharging.
However, the solar panels continuously absorb as much sunlight as they can throughout the day and night. The voltage they produce is filtered through the power converter first and then into the battery, which recharges the system, thus prolonging its battery life. The panels together produce 1.2 W, which is greater than the 1.0 W consumed during the sensor’s active state. Therefore, the battery will quickly charge to maximum capacity, then plateau at 100% of its maximum allowed charge. Figure 12 highlights this behavior using calculations based on the known specifications.
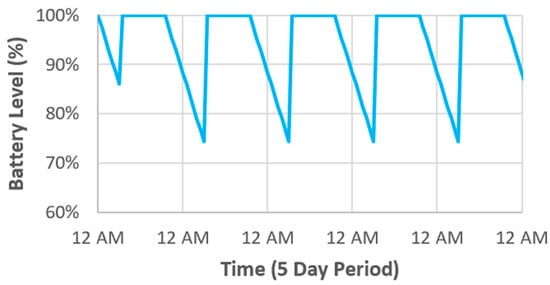
Figure 12.
Battery level with solar recharging.
With regard to the UAV battery, the hexacopter drone used in the research operated at 14.4 v (4 s) using a Lipo battery with a total capacity of 10,000 mAh, which gave 144 Wh of power to use. The UAV pulled 345.6 W of power, which provided ~20 m of flight time. Given that the drone node drew only about ~1 watt, we could theoretically power the drone node for up to 144 h. This was a miniscule amount of power when compared to the power requirements of the UAV itself, which means the effect on the flight time was minimal.
3.2. Communication Testing
After the sensor node was deployed, a successful flight test was carried out wherein a connection between the sensor node and drone node was established. In the test flight recording, the hexacopter was shown to hover near the node and collect the data from the single sensor node successfully. An LED light indicator served as a visual indicator of the successful connection, as seen in Figure 13.
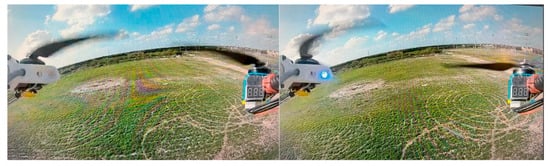
Figure 13.
Hexacopter UAV receiving data from node.
The node had sensor data that was transmitted via Wi-Fi to the UAV. Once the data had been acquired, the hexacopter returned to land. The data transmitted from the node were stored on the Arduino Datalogger Shield SD card and later retrieved via W-Fi. Similar tests were conducted on separate occasions as system software was updated. The tests demonstrated the potential of using a UAV for remote data acquisition.
After testing, the effective communication range of the drone was determined to be about 90 m (~300 ft). This was determined by comparing the location of the drone during the test flight to the known location of the sensor node. Figure 14 visualizes this distance over the testing area, which was only 60 m × 180 m (200 ft × 600 ft) in size. This means that the connection between the drone and sensor node was near instantaneous upon the drone’s arrival.
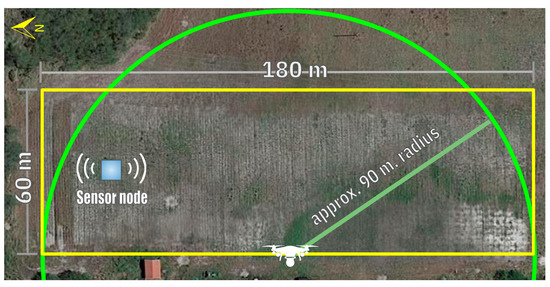
Figure 14.
Satellite image of farm with range diagram.
The speed of the data upload was estimated using the largest expected file size for the recorded data as a basis. Assuming data were collected every 15 min, a week’s worth of data would be about 30,240 bytes. Given that the ESP32 uploads data at a rate of 20 mbps, the maximum upload time was calculated as 30 kb/2441.4 kbps = 0.0123 s or approximately 1/80th of a second. While the execution of the code may take slightly longer, the overall communication time between the drone and a single sensor node was estimated to still be within a fraction of a second.
In terms of weather effects, the deployed sensor node was largely weather-resistant due to its housing design, which dissuades water from entering, and could operate in temperatures ranging from 5 °C and 45 °C. The primary limitation of weather is in terms of the UAV itself. Drones vary in terms of robustness in different weather types, but the drone used here was able to operate in daylight or light mist and withstand up to 23 mph gusty winds or up to 26 mph stable winds. Most smaller drones are not recommended to be used in stormy weather in the midst of rainfall, so suitable flight conditions should be taken into account when planning data retrieval missions.
3.3. Data Collection
On multiple occasions, the sensor node was deployed in a farm field to record soil data over a number of days; then, the data were retrieved. The types of values recorded included soil moisture (volumetric water content), soil temperature (in Celsius), and electrical conductivity (EC). The graphs in Figure 15 shows examples of each of the kinds of data recorded over the time period in a given deployment. These types of data are representative of information that is valuable to farmers making irrigation management decisions.
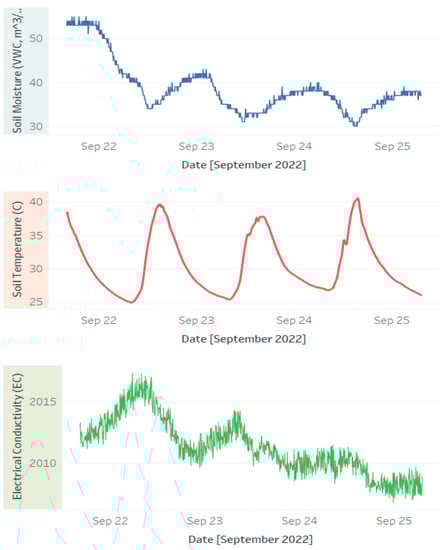
Figure 15.
Sensor data recovered from the field.
The soil moisture values tended to dip during the hottest parts of the day and peak when the sun was lowest below the horizon at around midnight. The values for the soil temperature clearly showed a rise and fall during the hottest and coldest hours of the day, as expected for a typical day/night cycle. The soil moisture dropped over those days due to warm days and an absence of local rainfall, thus causing the accumulated moisture to dry gradually. Note also that the lowest points for the moisture coincided with the highest points for soil temperature. Electrical conductivity followed a similar trend as soil moisture. It is affected by various factors, most notably retained soil moisture, but also other factors, such as the mineral composition of the soil. The recorded data were logged and stored on the datalogger SD so they could be transferred to the drone node later.
By tracking these kinds of data, crop managers can make informed decisions regarding irrigation; for example, scheduling an irrigation event when the soil moisture is low or holding back on irrigation when the moisture levels are high. By monitoring these values, farmers can stay within the optimal zones that produce maximum crop yields for their specific crop types.
4. Discussion
4.1. System Performance
It was determined that the deep sleep programming used between collection periods significantly reduced the total power consumption of the sensor node. However, it is possible that the overall lifetime of the battery may be reduced due to being overcharged. Moving forward, the electronic assembly of the node may need to include preventative measures to reduce the probability of this occurring.
In addition, the 15 min cycle of hibernation/activity could be lengthened overnight to diminish battery usage. In theory, the power usage of the hibernation state is so low that a fully hibernating sensor node could potentially last 17,333 h or roughly 19.8 years. Therefore, a more spread out data collection routine, especially overnight, could lengthen the life of the system significantly during periods of reduced sunlight.
4.2. Comparison with Existing Methods
This section seeks to evaluate the proposed system in comparison to some existing techniques for precision agriculture. The most common form of data acquisition with drones is using imaging technology, such as multispectral devices, hyperspectral cameras, and other forms of crop imaging. Another common form of precision agriculture growing in popularity is static data collection. In this section, we briefly cover each method, providing an example of each and describing how the proposed system compares in terms of energy efficiency, advantages, limitations, and cost.
Ximea is a company with a range of hyperspectral cameras. These are specialized imaging devices designed to capture data across a wide range of wavelengths, allowing for detailed spectral analysis of the captured scenes. They are commonly used in various fields, including precision agriculture. When mounted on a drone for precision agriculture applications, hyperspectral cameras enable farmers and researchers to obtain valuable insights about crops and soil conditions through analysis of spectral bands. For instance, they can be used to measure changes in vegetation reflectance, identifying stress indicators, nutrient deficiencies, and more [22].
The OptRx crop sensor system is a tool used in precision agriculture to measure and record crop health in real time using the reflectance of light shined on the crop. The sensors can be mounted on a drone, making the system suitable for a wide range of applications, including precision agriculture, search-and-rescue operations, and surveillance systems. The system is relatively compact, low-power, and versatile [23].
The HOBOnet system by Onset is a static data collection system that uses a mesh network to relay recorded data to centralized dataloggers. The system requires a constant internet connection with a cellular data plan purchased from Onset but allows data to be viewed online in near-real time. Unlike the other systems mentioned so far, this precision agriculture solution does not employ any drones but is included for the sake of thoroughness regarding the available options.
Our system has several key advantages and disadvantages in comparison to these systems. We briefly discuss some of these aspects and conclude with a summary comparison.
One key difference is in the path planning of the drone-based systems. In typical drone imaging systems, including both hyperspectral and multispectral imaging devices, the UAV must fly in a systematic, back-and-forth pattern over the field at a designated height in order to cover the full area of the chosen field. In a rectangular field, that flight pattern often resembles something similar to the pattern in Figure 16.
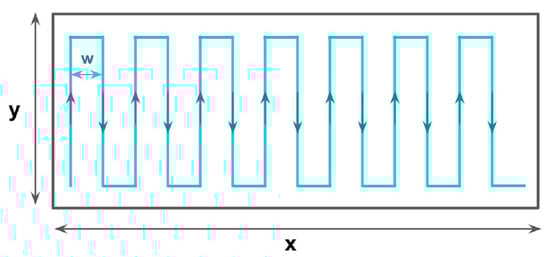
Figure 16.
Typical flight path of UAV equipped with imaging technology (y is width, x is length, and w is horizontal length). Arrows show the direction of the flight.
The length of the path of this pattern can be quantified geometrically utilizing the following formula:
where D is the total distance, a and b are the width and length, and h is the horizontal width of the grid, which varies depending on various factors related to the equipment used, such as the field of view and resolution. Based on previous work, in the case of the OptRx sensor, a suitable width is 10 m, whereas for the Ximea camera, it is 18 m [23]. Therefore, we can calculate the total distance that would need to be traveled for a field of our size (60 m × 180 m):
D = (x/w) × y + x + y
| OptRx: D = (180/10) × 60 + 180 + 60 D = 1320 m | Ximes: D = (180/18) × 60 + 180 + 60 D = 840 m |
We can then estimate the total flight time, considering the maximum recommended flight speed for the devices, which is only 5 m/s, in order to allow them to be able to capture clear and sharp images:
| OptRx: 1320 m/(5 m/s) = 264 s = 4.4 min | Ximes: 840 m/(5 m/s) = 168 s = 2.8 min |
If we compare this with the speed and communication range of the drone used in this research, we see a clear advantage in the proposed system. The hexacopter drone can travel up to speeds of at least 15 m/s, and its quick connection speed allows for near-instantaneous data retrieval once in range. Even assuming the longest path possible from one corner of the field to the other, the time it would take for the drone’s range to cover all parts of the field would only be a maximum of 12.7 s. Figure 17 shows a visual representation.
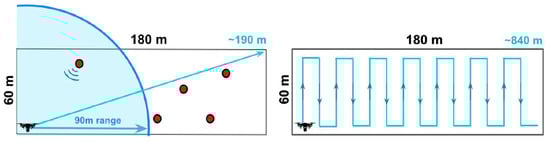
Figure 17.
UAV flight paths compared (red dots indicate sensors).
The above figure shows a field of the size used in the testing of the proposed system with sensors arranged in a placement based on the five known soil management zones of the field. This hypothetical arrangement will serve as an example of the system’s capabilities and as a comparison with the efficiency of existing imaging methods.
While imaging technologies require a drone to scan systematically—and, in many cases, even overlap previous territory—the drone-as-mobile-sink approach used in the proposed system allows for much more efficient flight paths. Therefore, the proposed system has a clear advantage in terms of the estimated flight time of missions and, by extension, significant energy savings. The following Table 1 combines the resulting power usage outcomes.

Table 1.
UAV energy efficiency comparison.
While the power consumption of the devices does vary slightly, the actual drone requires 345.6 W of power, which makes the device difference mostly negligible in terms of the overall power usage. The main difference in efficiency is a result of the reduction in flight time, which leads to significant energy savings.
However, it should be noted that imaging systems such as hyperspectral cameras do offer the advantage of a much more detailed, higher-resolution view of every part of the field rather than a handful of data values from specific points in the farm. At first glance, this seems like a very important advantage. However, in actual usage, it depends on the specific application. In some cases, the datasets gathered by such methods are difficult to interpret and unnecessary detailed and can have extremely large file sizes. They are also usually very indirect, involving complex algorithms and calibration procedures. In comparison, gathering data from deployed sensors allows for traditional sensors to be used, obtaining data through direct contact with the soil rather than through indirect imaging methods.
There are many other ways in which the proposed system differs from existing methods. The below Table 2 shows an overall summary underlining some of the most relevant differences, including the estimated costs of each system. The OptRx and Ximea systems are included as comparative drone-mounted methods of precision agriculture, while the HOBOnet system represents a typical static data collection system. While none of the systems allow a direct comparison, they are included for the sake of a comprehensive overview of state-of-the-art precision agriculture techniques with a similar general purpose.
Table 2.
System comparison summary.
The retail cost for all components of the proposed custom system was estimated at a total of USD 55 for the receiver node. The sensor node components add up to approximately USD 80 per sensor node, not including the relatively minor cost of the 3D-printed enclosures. However, the majority of the cost of each node (USD 350) comes from the TEROS 12 sensor, resulting in a total of USD 430 per sensor node. The overall cost of the proposed system depends heavily on the types of sensors employed, as well as the quantity of the sensor nodes. For instance, a set of five sensor nodes using TEROS 12 sensors would cost approximately USD 2150 (USD 430 × 5) plus USD 55 for the receiver, resulting in a total of USD 2200, which is still lower than a single drone-mounted OptRx crop sensor. Note that the above costs are for the drone-compatible systems and do not include the costs of the drone itself. For the sake of argument, we can assume the same drone costs are equivalent in the first three cases. The HOBOnet system is the only one that does not require a drone but does require a yearly data plan, which ranges from USD 200 to 350 annually.
5. Conclusions
5.1. Limitations and Future Work
Although the system has merit as a low-cost solution, there exist some limitations to its use. Perhaps the clearest limitation is that the system has only been tested with one sensor node rather than multiple nodes. Due to logistical factors, it was easier to improve and maintain a single sensor node than multiple nodes at this stage. However, future endeavors should include multiple sensors communicating at once to allow the UAV to be tested when connecting to multiple sources at once.
Related to this is the scalability of the system. In theory, since the drone nodes do not communicate with each other but rather with the UAV directly, there are no limitations on the distance between nodes other than the flight time and speed of the UAV used. However, because the system only handles one connection at a time, it is not optimized for condensed clusters of sensor nodes. To remedy this, the software could be modified in the future to allow for asynchronous connections, thus allowing simultaneous connections to be implemented rather than connecting to each node in sequence as it is currently programmed to do. Another issue with scalability is the cost of the TEROS 12 sensor. However, the intention behind the design of this system was to allow it to be flexible and compatible with any I2C sensor, so more budget-friendly sensors could be employed to reduce the costs of a scaled system employing many nodes.
In addition, the current pilot indicator only indicates whether or not the UAV has achieved a successful connection with the single sensor node. In the future, this device should be replaced with a more sophisticated solution in order to track how many of the nodes the system has been able to connect to and other details. The current system is visible to the pilot through the FPV camera but is not digitally present. Future work could include integration with the FPV video feed so that information is displayed on screen for the pilot in the clearest way possible and with the necessary amount of detail.
Another important limitation is the weather and the UAV itself. As with any outdoor UAV application, flights are subject to the effects of weather and may have to be delayed during adverse periods. The system was limited by the range of the multirotor that was used in this research. All things being equal, multirotor drones inherently consume significantly more power during flight than fixed-wing drones. This is because they generate lift through the active rotation of their propellers, whereas fixed-wing drones can passively use their wings to generate lift. Therefore, a fixed-wing drone can fly for several hours, unlike multirotor drones, which need to recharge much sooner; as such, the former makes for a better candidate for an energy-efficient system.
It should also be noted that, although the drone used in this research was capable of autonomous flight navigation, that feature was not explored during these tests. The system could benefit in the future from automated flight scheduling and path planning. Many fixed-wing craft support this option, so the next evolution of this system will likely employ a fixed-wing UAV with these capabilities in conjunction with multiple sensor nodes deployed across a wider region.
Another observation noted for the design was that the drone receiver node currently relies on a connected, compatible power source, which limits the versatility of the system. In the future, the receiver node would benefit from having its own power source so that it could, in theory, be attached to any mobile vehicle without needing a direct electrical connection to its battery. In addition, it could even be carried by hand if necessary or on a surface vehicle if a UAV is not available.
There are potential data transfer protocols available that can significantly enhance our range capabilities. While the current scenario represented the worst case, as we utilized a DSSS protocol that prioritizes data transfer speed over range, we can explore alternative options to expand our radius. One promising solution could involve transitioning to LoRa modulation. By implementing this protocol, we could potentially achieve an expanded range while maintaining efficient data transfer capabilities:
- -
- Long-range (LoRa) modulation offers advantages over frequency-hopping spread spectrum (DSSS) protocols in terms of range;
- -
- Receiver sensitivity: LoRa receivers are highly sensitive and capable of detecting and decoding weak signals, improving range capabilities;
- -
- Power efficiency: LoRa devices operate at lower power levels, allowing for extended battery life and making them suitable for low-power, long-range communication;
- -
- Signal penetration: LoRa signals have excellent penetration capabilities, passing through obstacles such as buildings and vegetation, maintaining connectivity over greater distances.
DSSS protocols prioritize data transfer speed but often sacrifice range, while LoRa protocols are optimized for range and power efficiency.
5.2. Final Summary
Field data were successfully collected and retrieved with the sensor node, thus proving its successful operation. In addition, the battery life of the system was a major component of the design, and it was found that the solar panels, on average, supplied more than enough power to keep the system operational for a long span of time. The system charged so well, in fact, that overcharging was identified as a potential issue that may affect the long-term usability of the system. Another key aspect that was identified as a future improvement was the addition of a power source to the drone node, as this would give the system much more versatility across different applications.
Although previous studies have focused on the theoretical benefits of UAV-to-ground-sensor systems, this study employed a custom, hands-on approach to prove the real-world viability of such a system. The system functions at a relatively low cost compared to other high-end techniques and is a promising technology that could provide many benefits to stakeholders and the agricultural sphere in general. Future work should include streamlining the system to make it easier for farmers to schedule flights and further automate the process, as well as experimenting with larger-scale networks employing optimized path planning.
Author Contributions
Conceptualization, S.O., J.R. and I.O.; methodology, S.O., J.R. and I.O.; software, I.O.; validation, S.O.; formal analysis, S.O.; investigation, J.R., I.O. and A.B.-V.; resources, S.O., I.O. and J.R.; data curation, A.B.-V.; writing—original draft preparation, A.B.-V. and K.B.; writing—review and editing, A.B.-V., K.B. and G.C.; visualization, I.O. and A.B.-V.; supervision, S.O.; project administration, S.O.; funding acquisition, S.O. All authors have read and agreed to the published version of the manuscript.
Funding
This research was supported by the National Science Foundation under the grant CREST 1914745 [24].
Data Availability Statement
No new data were created or analyzed in this study. Data sharing is not applicable to this article.
Conflicts of Interest
The authors declare no conflict of interest. The funders had no role in the design of the study; in the collection, analyses, or interpretation of data; in the writing of the manuscript; or in the decision to publish the results.
References
- Population Reference Bureau. 2020 World Population Data Sheet. Available online: https://www.prb.org/wp-content/uploads/2020/07/letter-booklet-2020-world-population.pdf (accessed on 1 January 2023).
- USDA. Irrigation and Water Use: Background. Online Report Based on 2007 US Agricultural Census Data. 2013. Available online: https://www.ers.usda.gov/topics/farm-practices-management/irrigation-water-use/ (accessed on 6 March 2023).
- Ford, A. Modeling the Environment, 1st ed.; Island Press: Washington, DC, USA, 1999. [Google Scholar]
- Huang, J.; Gómez-Dans, J.L.; Huang, H.; Ma, H.; Wu, Q.; Lewis, P.E.; Liang, S.; Chen, Z.; Xue, J.-H.; Wu, Y.; et al. Assimilation of remote sensing into crop growth models: Current status and perspectives. Agric. For. Meteorol. 2019, 276–277, 107609. [Google Scholar] [CrossRef]
- United States Department of Agriculture—National Agricultural Statistics Service. (August, 2021). Farm Computer Usage and Ownership. Available online: https://www.nass.usda.gov/Publications/Methodology_and_Data_Quality/Computer_Usage/index.php (accessed on 3 March 2023).
- Huang, Y.; Chen, Z.X.; Tao, Y.U.; Huang, X.Z.; Gu, X.F. Agricultural remote sensing big data: Management and applications. J. Integr. Agric. 2018, 17, 1915–1931. [Google Scholar] [CrossRef]
- Elijah, O.; Rahman, T.A.; Orikumhi, I.; Leow, C.Y.; Hindia, M.N. An Overview of Internet of Things (IoT) and Data Analytics in Agriculture: Benefits and Challenges. IEEE Internet Things J. 2018, 5, 3758–3773. [Google Scholar] [CrossRef]
- Wan, B.-F.; Zhou, Z.-W.; Xu, Y.; Zhang, H.-F. A Theoretical Proposal for a Refractive Index and Angle Sensor Based on One-Dimensional Photonic Crystals. IEEE Sens. J. 2021, 21, 331–338. [Google Scholar] [CrossRef]
- Citroni, R.; Di Paolo, F.; Livreri, P. Evaluation of an Optical Energy Harvester for SHM Applications. AEU—Int. J. Electron. Commun. 2019, 111, 152918. [Google Scholar] [CrossRef]
- Boursianis, A.D.; Papadopoulou, M.S.; Diamantoulakis, P.; Liopa-Tsakalidi, A.; Barouchas, P.; Salahas, G.; Karagiannidis, G.; Wan, S.; Goudos, S.K. Internet of Things (IoT) and Agricultural Unmanned Aerial Vehicles (UAVs) in smart farming: A comprehensive review. Internet Things 2022, 18, 100187. [Google Scholar] [CrossRef]
- Negash, L.; Kim, H.-Y.; Choi, H.-L. Emerging UAV Applications in Agriculture. In Proceedings of the 2019 7th International Conference on Robot Intelligence Technology and Applications (RiTA), Daejeon, Republic of Korea, 1–3 November 2019; pp. 254–257. [Google Scholar] [CrossRef]
- Motlagh, N.H.; Taleb, T.; Arouk, O. Low-Altitude Unmanned Aerial Vehicles-Based Internet of Things Services: Comprehensive Survey and Future Perspectives. IEEE Internet Things J. 2016, 3, 899–922. [Google Scholar] [CrossRef]
- Puri, V.; Nayyar, A. Agriculture drones: A modern breakthrough in precision agriculture. J. Stat. Manag. Syst. 2017, 20, 507–518. [Google Scholar] [CrossRef]
- Ayed, R.B.; Hanana, M. Artificial Intelligence to Improve the Food and Agriculture Sector. J. Food Qual. 2021, 2021, 5584754. [Google Scholar] [CrossRef]
- Qayyum, T.; Trabelsi, Z.; Malik, A.; Hayawi, K. Trajectory Design for UAV-Based Data Collection Using Clustering Model in Smart Farming. Sensors 2022, 22, 37. [Google Scholar] [CrossRef] [PubMed]
- Liang, H.; Gao, W.; Nguyen, J.H.; Orpilla, M.F.; Yu, W. Internet of Things Data Collection Using Unmanned Aerial Vehicles in Infrastructure Free Environments. IEEE Access 2020, 8, 3932–3944. [Google Scholar] [CrossRef]
- Tsouros, D.C.; Bibi, S.; Sarigiannidis, P.G. A Review on UAV-Based Applications for Precision Agriculture. Information 2019, 10, 349. [Google Scholar] [CrossRef]
- Rejeb, A.; Abdollahi, A.; Rejeb, K.; Treiblmaier, H. Drones in agriculture: A review and bibliometric analysis. Comput. Electron. Agric. 2022, 198, 107017. [Google Scholar] [CrossRef]
- van der Merwe, D.; Burchfield, D.R.; Witt, T.D.; Price, K.P.; Sharda, A. Chapter One—Drones in agriculture. In Advances in Agronomy; Sparks, D.L., Ed.; Academic Press: Cambridge, MA, USA, 2020; Volume 162, pp. 1–30. ISSN 0065-2113. ISBN 9780128207673. [Google Scholar] [CrossRef]
- Su, J.; Zhu, X.; Li, S.; Chen, W.-H. AI meets UAVs: A survey on AI empowered UAV perception systems for precision agriculture. Neurocomputing 2023, 518, 242–270. [Google Scholar] [CrossRef]
- Singh, P.K.; Sharma, A. An intelligent WSN-UAV-based IoT framework for precision agriculture application. Comput. Electr. Eng. 2022, 100, 107912. [Google Scholar] [CrossRef]
- Ximea. (n.d.). Hyperspectral Cameras with USB3. XIMEA. Available online: https://www.ximea.com/en/usb3-vision-camera/hyperspectral-usb3-cameras-mini (accessed on 13 May 2023).
- Ristorto, G.; Mazzetto, F.; Guglieri, G.; Quagliotti, F. Monitoring performances and cost estimation of multirotor Unmanned Aerial Systems in precision farming. In Proceedings of the 2015 International Conference on Unmanned Aircraft Systems, Denver, CO, USA, 9–12 June 2015; pp. 502–509. [Google Scholar] [CrossRef]
- CREST Center for Sustainable Water Use (CREST-SWU). Award Abstract # 1914745. Available online: https://www.nsf.gov/awardsearch/showAward?AWD_ID=1914745 (accessed on 1 January 2023).


Disclaimer/Publisher’s Note: The statements, opinions and data contained in all publications are solely those of the individual author(s) and contributor(s) and not of MDPI and/or the editor(s). MDPI and/or the editor(s) disclaim responsibility for any injury to people or property resulting from any ideas, methods, instructions or products referred to in the content. |
© 2023 by the authors. Licensee MDPI, Basel, Switzerland. This article is an open access article distributed under the terms and conditions of the Creative Commons Attribution (CC BY) license (https://creativecommons.org/licenses/by/4.0/).