Abstract
Unmanned aerial vehicles (UAVs) are promising in large-area data collection due to their flexibility and easy maintenance. In this work, we study a UAV-enabled wireless sensor network (WSN), where K UAVs are dispatched to collect a certain amount of data from each node on the ground. Most existing works assume that the flight energy is either distance-related or duration-related, which may not suit the practical scenario. Given the practical speed-related flight energy model, we focus on deriving the optimal energy and delay tradeoff for the K UAVs such that each node can successfully upload a certain amount of data to one of the K UAVs. Intuitively, the higher flight speed of the UAV results in the shorter completion time of the data collection task, which may however cause the higher flight energy consumption of UAVs during the task. Specifically, we first model the total energy consumption of the UAV during the flight for collecting data within the WSN and then design the flight speed as well as the flight trajectory of each UAV for achieving different Pareto-optimal tradeoffs between the maximum single-UAV energy consumption among all UAVs and the task completion time. To achieve this goal, we propose a novel multi-objective ant colony optimization framework based on the adaptive coordinate method (MOACO-ACM). Firstly, the adaptive coordinate method is developed to decide the nodes visited by each of the K UAVs, respectively. Secondly, the ant colony algorithm is incorporated to optimize the visiting order of nodes for each UAV. Finally, we discuss the impact of UAVs’ speeds scheduling on the tradeoff between the task completion time and the maximum single-UAV energy consumption among all UAVs. Extensive simulations validate the effectiveness of our designed algorithm and further highlight the importance of UAVs’ flight speeds in achieving both energy-efficient and time-efficient data collection.
1. Introduction
Unmanned aerial vehicles (UAVs) can provide scalable and barrier-free communication paradigms for terrestrial wireless sensor networks (WSNs) due to their rapid deployment, ubiquitous connectivity and high flexibility [1]. UAVs also have the advantage in achieving high probability line-of-sight wireless communication link with ground nodes [2,3,4]. Ref. [3] studied the UAV-assisted non-orthogonal multiple access multi-way relaying network. Multiple terrestrial users exchange their mutual information via an amplify-and-forward UAV relay. Ref. [4] conducted an in-depth analysis of the throughput of the uplink/downlink NOMA system assisted by UAV relays in a delay-limited transmission mode. Therefore, with the improvement of UAV endurance and the rapid development of miniaturization of communication equipment and other aspects, people highly expect that the UAV-based communication mode will receive more and more attention in future applications based on wireless sensor networks, such as natural disaster monitoring, border monitoring, emergency assistance and security communication [5,6,7,8]. Since most rotor-wing UAVs cannot be loaded with high-storage batteries due to the size and weight constraints [9], the UAV’s onboard energy is usually limited [10]. Thus, the energy consumption issue should always be carefully addressed when designing the UAV-based communication system [11].
For the internet of things [12] and data collection equipment supporting UAVs, UAVs can fly close to each ground node to shorten the corresponding communication link distance, thus achieving more energy-efficient data collection [13,14]. For such applications, the system performance highly depends on the designed UAV trajectories [15,16].
In recent years, many research works on UAV-based WSNs focus on the minimization of either the overall flight energy consumption or the flight time [17,18,19,20,21]. However, in most practical scenarios, it is more significant to consider the performance optimization across multiple UAVs, especially when nodes are distributed unevenly within the network and each node has a different data-uploading demand. Since each UAV may have different onboard energy and corresponding endurance capabilities, if some UAVs drain their batteries in advance, the whole task could fail. Thus, balancing the energy consumption across multiple UAVs for a particular task is crucial.
Based on the practical speed-related flight energy model [22], when each UAV flies among multiple data-collection locations within the network with the maximum flight speed, the total time (task completion time) until each node successfully uploads its data is reduced; this, however, may increase the overall flight energy consumption of UAVs. On the contrary, to reduce the overall flight energy consumption of UAVs, we may decrease the flight speed of each UAV, which however may result in the longer time until each node successfully uploads its data. Since each UAV may visit different ground nodes to collect data from them, the speed control and the trajectory design of each UAV jointly determine the flight energy consumption as well as the task completion time. Besides the flight energy consumption used when flying among different data collection locations, we should also consider the hovering energy consumption when the UAV hovers above each node for data collection and the communication energy consumption incurred during the data transmission period. Thus, the goal of this work is to jointly consider the energy minimization and the task completion time minimization in a multi-UAV-enabled WSN. Generally speaking, choosing the appropriate flight speed as well as the flight trajectory for each UAV can both balance the energy consumption across UAVs and minimize the task completion time. In particular, the energy consumption of a single UAV includes the flight energy consumption, the hovering energy consumption and the communication energy consumption during the task. We also use the maximum single-UAV energy consumption among all UAVs to evaluate the balance level of energy consumption across all UAVs. We define the maximum single-UAV flight time as the task completion time.
At the same time, the quantity, placement and sequence of nodes accessed by UAVs exert a notable influence on energy consumption and time. Considering the varying data volumes of nodes, when there is a substantial number of nodes accessed by UAVs, it is desirable to minimize the data collection requirements for these nodes. Conversely, excessive data volume for nodes accessed by UAVs will inevitably escalate the time and energy consumption of the UAVs. Therefore, achieving a balance in the number of nodes accessed by each UAV is crucial. Additionally, if the nodes accessed by UAVs are widely dispersed or the sequence of UAV access increases the distance traveled, it will invariably amplify the time and energy consumption during flight. Hence, it is essential to consider the spatial distribution and order of node access by UAVs.
Given the distinct preferences of decision-makers stemming from their respective domains, wherein time or energy consumption may be prioritized, this study formulates the UAV flight time and energy consumption as a multi-objective optimization problem. We devise a joint design of flight trajectories and speeds for each UAV to minimize the maximum energy consumption and maximum flight time across all UAVs, catering to the diverse requirements of decision-makers.
To solve the above problem, we propose a novel multi-objective ant colony optimization framework based on the adaptive coordinate method (MOACO-ACM). Firstly, we develop the adaptive coordinate method to decide the nodes visited by each UAV, which effectively balances the number of nodes and their locations visited by each UAV. Then, the ant colony optimization algorithm is incorporated to plan the visiting order of nodes decided in the first step for each UAV, which balances the maximum single-UAV energy consumption among all UAVs and the task completion time. Finally, we investigate the impact of UAVs’ different speed scheduling on the tradeoff between the task completion time and the maximum single-UAV energy consumption among all UAVs. The main contributions of this work is summarized as follows:
- We propose the optimization framework called MOACO-ACM for designing the flight speed as well as the flight trajectory of each UAV, which achieves different Pareto-optimal tradeoffs between the maximum single-UAV energy consumption among all UAVs and the task completion time.
- We validate the effectiveness of the proposed algorithm through extensive simulations. We also reveal the impact of UAV’s different flight speed scheduling on the tradeoff between the task completion time and the energy consumption across UAVs.
Most research to date has focused on studying the impact of UAV flight paths on UAV time and energy consumption. However, this study stands out by introducing an algorithm that addresses the challenge of collecting information using multiple UAVs. The algorithm considers the number of task nodes, UAVs and tasks to optimize energy consumption and time efficiency for the UAVs. Furthermore, the study examines the influence of speed on this matter through experimental analysis.
The rest of this work is organized as follows. Section 2 introduces some related works and the motivation. Section 3 presents the system model and problem formulation. In Section 4, we illustrate the multi-UAV trajectory design and speed control algorithm in detail. Section 5 presents the comparison algorithm design and the simulation setting. Section 6 shows the simulation results and the corresponding analysis. We finally conclude this work in Section 7.
2. Related Works and Motivation
Due to the limited onboard energy of each UAV and in order to ensure the freshness of collected data, sending UAVs to execute data collection tasks should simultaneously maximize energy efficiency and minimize task completion time. In the following section, we will introduce some related works to better motivate this study.
For energy efficiency problems in UAV-enabled WSNs, Ref. [11] tried to find the optimal strategy for UAV deployment to maximize the total charged energy received by all ground sensors in a wireless rechargeable sensor network (WRSN). Ref. [23] aimed at reducing the total energy consumption of a data collection system, where a node’s wake-up scheduling and the UAV trajectory design was jointly designed to minimize the weighted energy consumption of nodes and the UAV. Ref. [24] considered a UAV-enabled communication system where rotary-wing UAVs act as aerial base stations for providing ground nodes wireless communication services. The maximum energy efficiency was achieved through the joint optimization of user scheduling and UAV trajectory design. Ref. [25] studied a UAV-enabled data collection system where a UAV is dispatched to collect a given amount of data from a ground terminal at the fixed location, taking into account the energy tradeoff between the UAV and the ground terminal. Ref. [26] explored the energy efficiency of UAVs under a given trajectory and conducted experimental research with both Line of Sight (LOS) and Non-Line of Sight (NLOS) communication models. In Ref. [27], the energy consumption and data throughput, the delay of machine-type communication devices (MTCDs) tasks and the data acquisition and computing efficiency with different priorities were jointly optimized. Ref. [28] studied the secure energy efficiency maximization problem in UAV-enabled communication systems. By jointly optimizing the transmission scheduling, the power allocation and UAV trajectories over a certain period of time, the energy consumption required for secure communication is minimized. Ref. [29] proposed a new UAV-assisted data acquisition scheme by designing the fixed-wing UAVs’ 3D trajectories and data acquisition plan for saving energy of both UAVs and sensor nodes. Ref. [30] explored the use of mobile-edge computing (MEC) system for IoT computation offloading and proposes a similar alternating optimization algorithm to investigate the balance between UAV time and energy consumption. Ref. [31] introduced an iterative algorithm that provides charging and task offloading for ground IoT devices. The proposed approach is validated in terms of energy consumption through comparisons with Monte Carlo simulations and other benchmark schemes.
For the flight time minimization problem, Ref. [19] proposed a UAV trajectory optimization method to minimize the completion time of the wireless charging task where a UAV is dispatched to charge a certain amount of energy to each of the ground nodes. Ref. [32] studied the task completion time minimization problem for content delivery in cache-enabled UAV networks. Ref. [33] investigated UAV-to-UAV communications with a turning angle constraint, in which the data transmission time is minimized by joint UAV flight trajectory planning and transmit power control. Ref. [34] jointly optimized the trajectory of UAVs, the wake-up time allocation and the transmit power of ground nodes for minimizing task completion time. Ref. [35] solved the flight time minimization problem for accomplishing the data collection task in a one-dimensional sensor network. Ref. [36] derived the minimum task completion time by jointly optimizing the UAV trajectory and resource allocation at each sensor node. Ref. [37] presented a linear programming algorithm that jointly optimizes two types of services, achieving a trade-off between efficiency and transmission latency, thereby reducing task completion time.
Some researchers believe that minimizing the flight path of a UAV in data collection can save time and energy consumption. As a result, optimizing the UAV’s trajectory has been proposed by some researchers. Ref. [38] introduced an ant colony optimization-based method for solving the UAV trajectory, called ACO-NODE. This method utilizes the probabilistic and spatial characteristics of the problem to quickly obtain high-quality UAV trajectories. Ref. [39] presented a multi-UAV (UAV)-assisted Mobile Edge Computing (MEC) system called GTPA-VP. By optimizing the flight trajectory of the UAVs, the sum of hovering and flying energy consumption of the UAVs is minimized. Ref. [40] integrated reinforcement learning into the grey wolf optimizer algorithm and proposed a new algorithm called RLGWO for UAV path planning.
All the above works provide very valuable insights into the energy efficiency and the delay analysis in UAV-enabled WSNs. Different from those existing works, we focus on investigating the optimal energy and delay tradeoff in a multi-UAV-enabled WSN; in practice, UAV flight energy consumption and task completion time are coupled due to the practical speed-related flight energy model of UAVs. Thus, the results obtained in this work may initiate the first step towards the both energy-efficient and time-efficient design in UAV-enabled data collection systems.
3. System Model and Problem Formulation
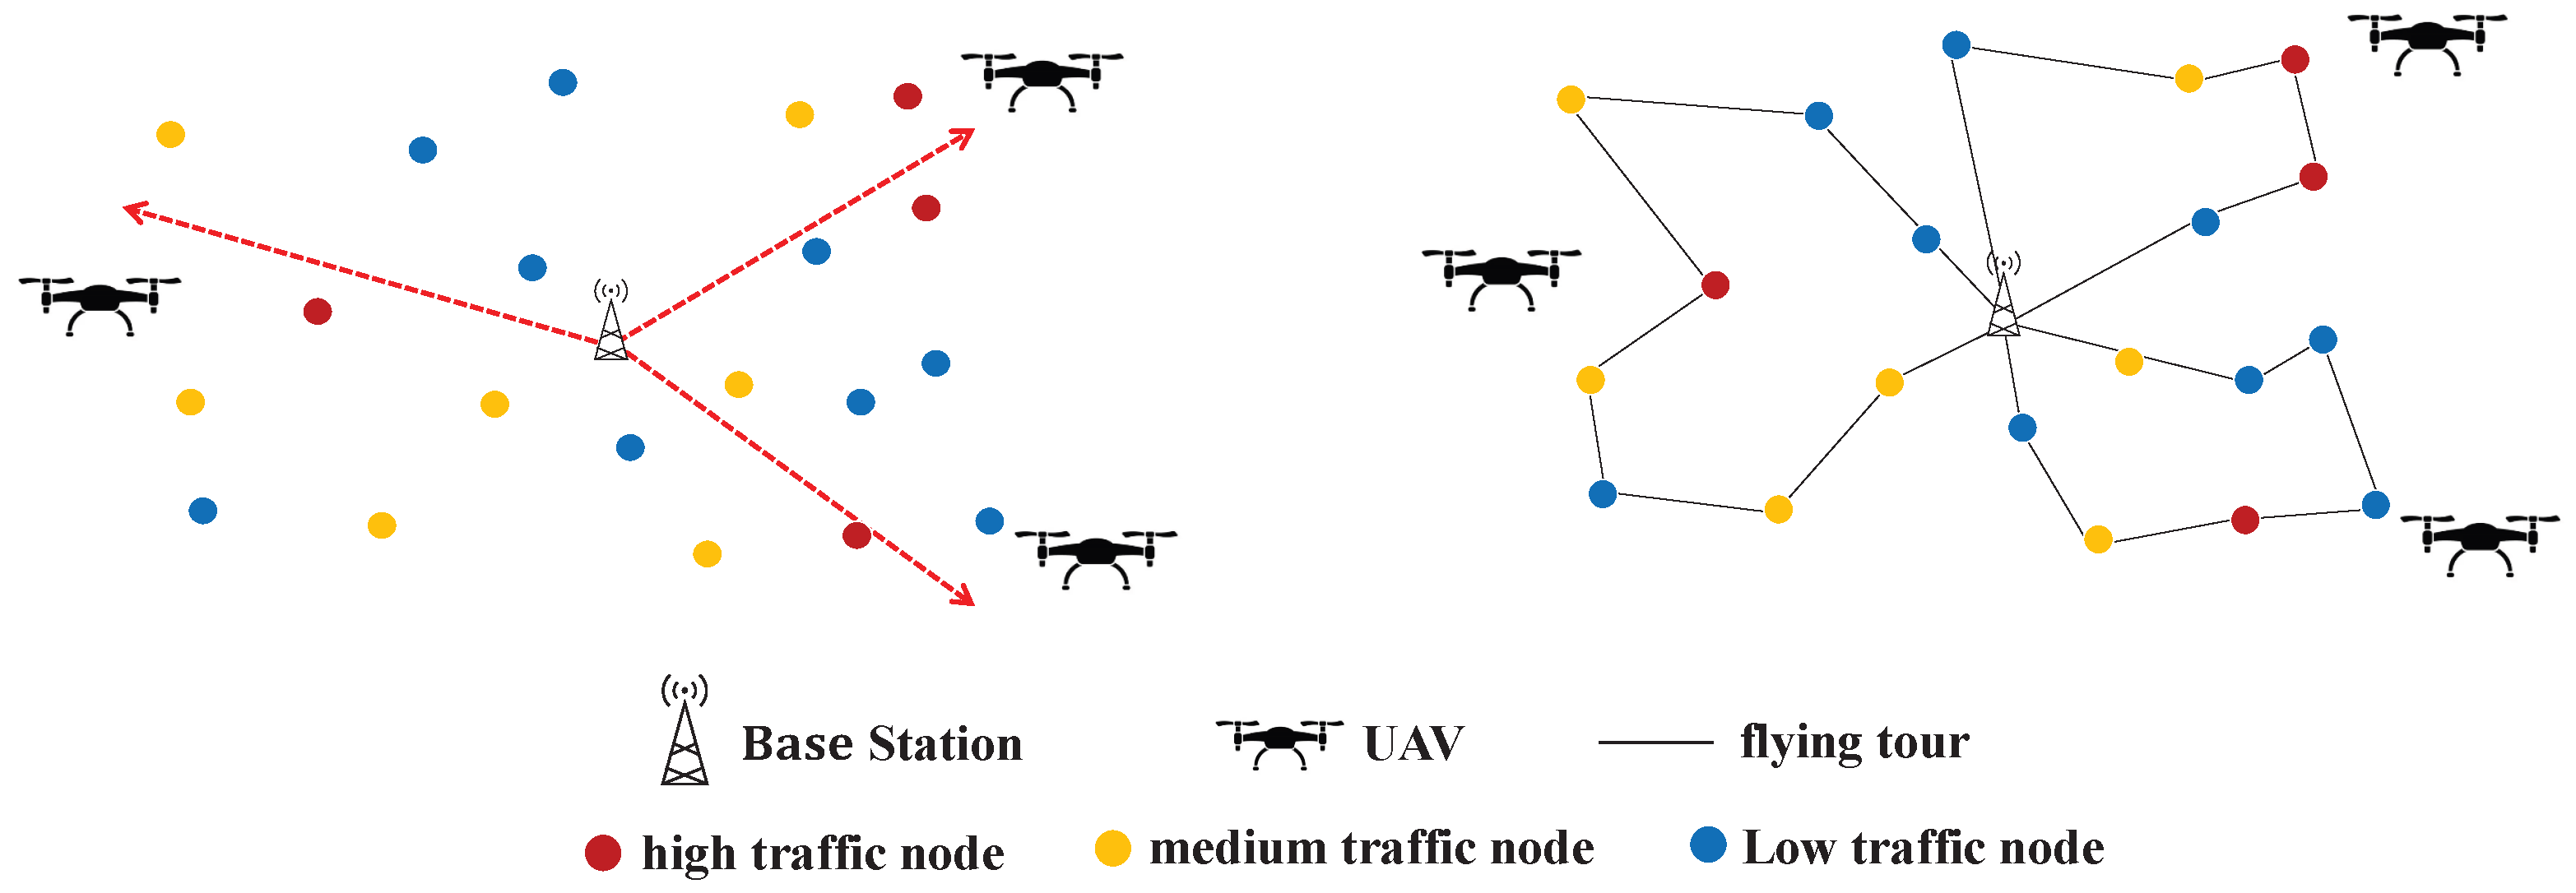
We assume that there are N ground sensor nodes randomly distributed within a two-dimensional WSN. There are K UAVs in total which are dispatched to perform data collection tasks within the network. During the task execution process, the energy consumption of each UAV mainly includes the flight energy consumption, the hovering energy consumption and the communication energy consumption. Figure 1 shows the system model.
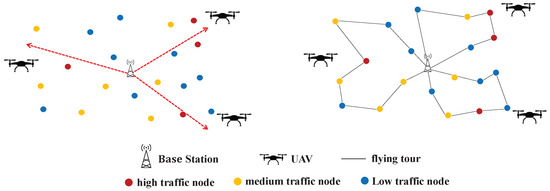
Figure 1.
System model.
3.1. The Relationship between the Flight Power Consumption and Flight Speed
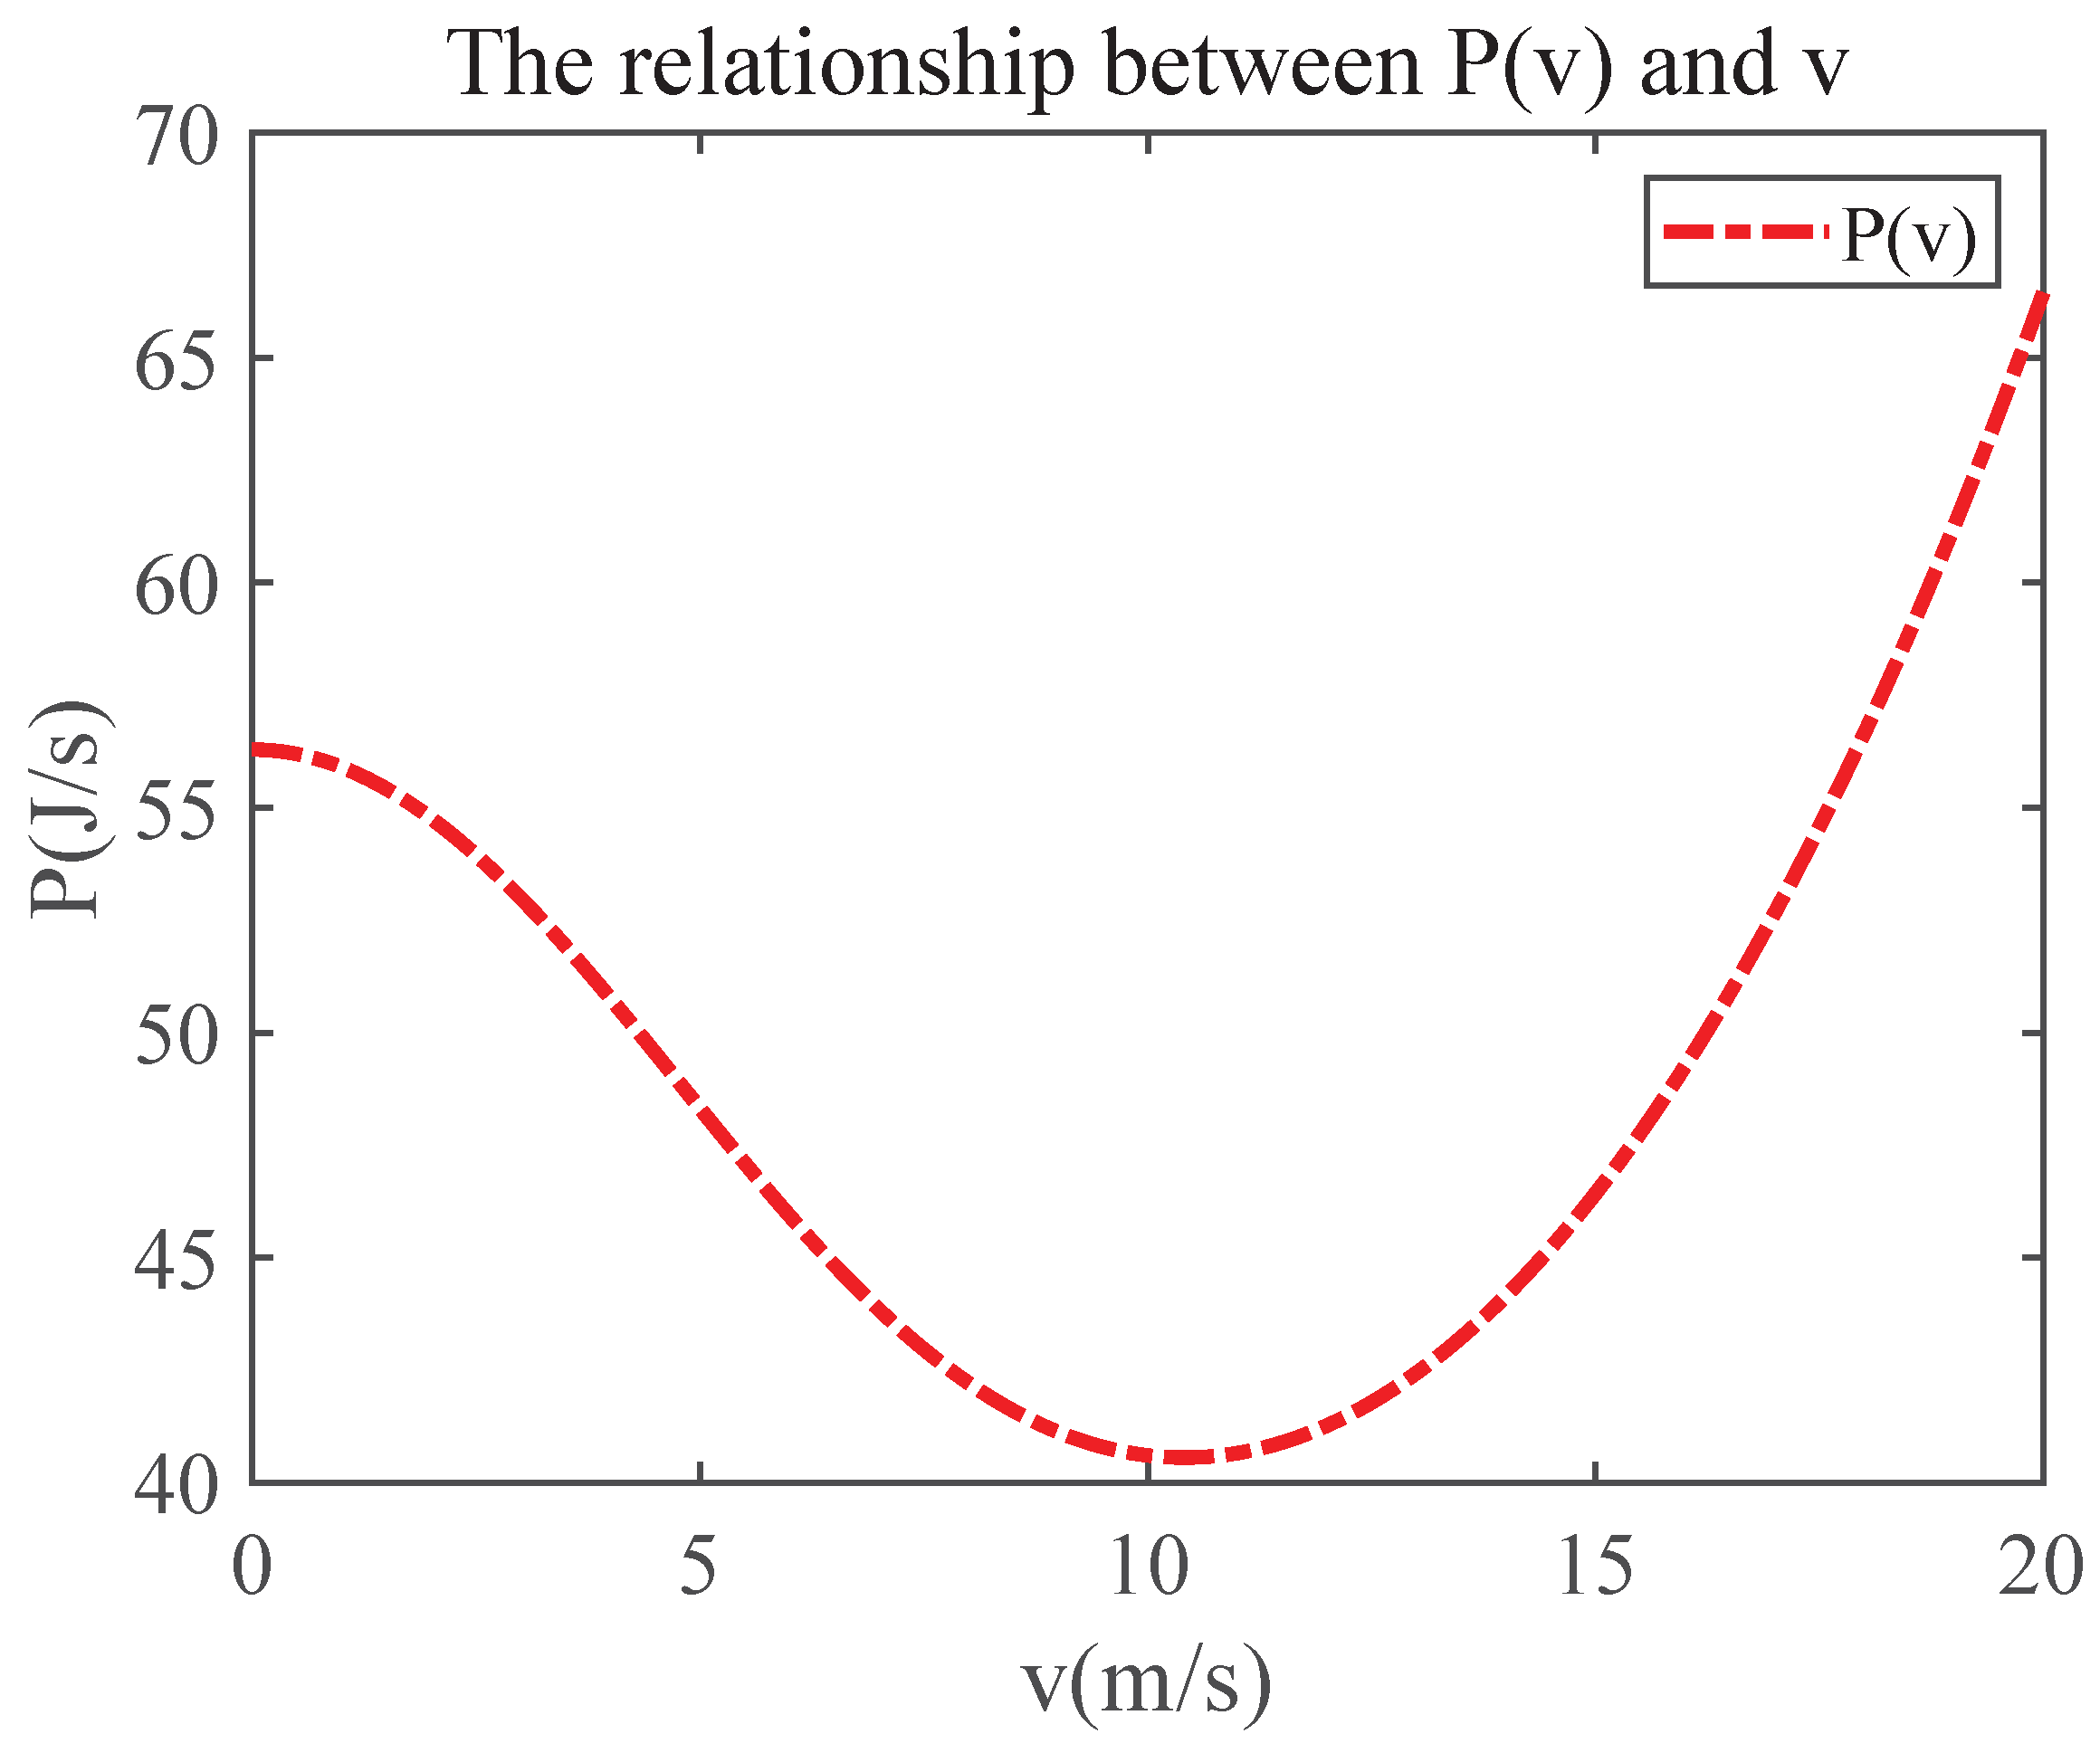
Normally, the flight power increases with the flight speed, since UAVs need to consume more energy to overcome air resistance and gravity. In fact, the relationship between flight power and flight speed can be modeled as the shape shown in Figure 2. In particular, flight power first decreases with flight speed until reaching the minimum value, and then, it increases with flight speed. When the travelling distance is fixed, it is not always feasible to decrease the flight energy by reducing the flight time (increasing the flight speed). Therefore, it is necessary to carefully control the UAV’s flight speed for balancing the flight energy consumption and the flight time.
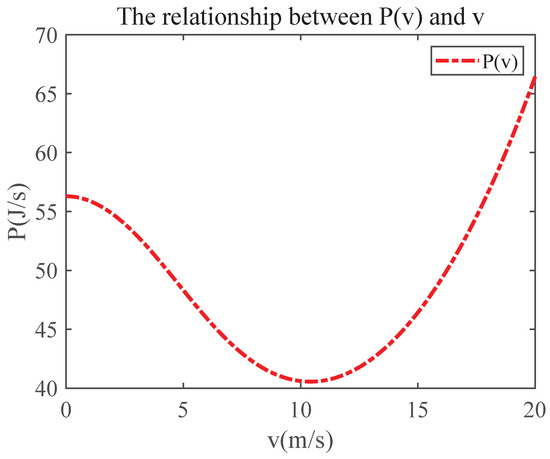
Figure 2.
The relationship between the flight power and the flight speed.
In the following, we first introduce some energy consumption models of the UAV including the flight energy consumption model, the hovering energy consumption model and the communication energy consumption model.
3.2. Flight Energy Consumption Model
According to the work [11], the energy consumption of the UAV during the flight is mainly determined by its flight distance and flight speed. When the UAV flies with a constant speed, the flight energy consumption increases linearly with the flight distance. We denote as the Euclidean distance between two target nodes i and j, which is represented as
where and represent the locations of nodes i and j. In Ref. [41], the author studied the trade-off between the power consumption and flight performance of fixed-wing UAVs. In this work, we mainly focus on the flight power consumption model of rotary-wing UAVs developed in Ref. [17], where the relationship between flight power and flight speed v is represented by
where is the blade power, v is the horizontal flight speed, is the blade tip speed of the rotating blade, is the induced power, is the average rotor induced speed during hovering of the UAV, is the fuselage resistance ratio, is the air density, S is the rotor robustness and A is the rotor disk area.
For linear acceleration or deceleration, the relationship between the flight speed and the flight time can be modeled as , where is the initial speed, a is the acceleration and t represents the flight time. During the flight between any two nodes i and j, the UAV first accelerates from to a certain speed v, then flies with uniform speed v towards node j, and finally decelerating from v to 0 when it hovers just above node j. For any target node, the UAV spends some time hovering above this node for data collection.
If the UAV flies between two target nodes i and j with constant speed , the corresponding flight energy consumption can be represented as
where represents the UAV’s flight power during the flight with speed , and represents the total flight distance of acceleration and deceleration. represents the UAV’s flight energy consumption during the acceleration process, while represents the UAV’s flight energy consumption during a different phase. The UAV’s flight energy consumption during the acceleration process can be represented by , where is derived from by replacing v with . Since the flight energy consumed during deceleration is the same as that during the acceleration, we have .
Due to the short period of both acceleration and deceleration processes during the flight between any two target nodes, we ignore both the acceleration and deceleration processes for simplicity. Therefore, the UAV’s flight energy consumption during the flight between any two target nodes is reformulated as
We use the decision variable to indicate whether the UAV passes through , which is specified as
Then, the total flight trajectory length of UAV k for visiting N target nodes is represented by
where N is the number of nodes, K is the number of UAVs, is calculated by Equation (5), and is the Euclidean distance between two target nodes i and j.
The total flight energy consumption of UAV k for visiting N target nodes is represented by
3.3. Hovering Energy Consumption Model
The UAV needs to hover above each target node to collect data. The hovering energy consumption of the UAV is mainly determined by its hovering power and hovering time. According to the literature reference [11], if the speed in Equation (2) is set to 0, then represents the hovering power of the UAV. The hovering time of the UAV above each target node depends on the amount of data to be uploaded by the node. Thus, the corresponding hovering energy consumption of the UAV called above node i is represented by
where is the hovering power. The hovering power of the UAV can be obtained from Equation (2) by substituting , and thus, we have . Assuming that node i needs to upload bits data to the UAV and the data-uploading rate is b, the hovering time of the UAV above node i is .
The hovering energy consumption of UAV k for visiting N target nodes called is represented by
where N is the number of nodes and K is the number of UAVs.
3.4. Communication Energy Consumption Model
The communication energy consumption of the UAV is determined by the communication power and communication duration. Since UAVs only communicate when hovering above a node and collecting data from that node, the time used to communicate with a node equals the hovering time above that node. According to reference [11], assuming that the communication power of the UAV when collecting data from a target node is , the communication energy consumption of the UAV for a target node i is represented by
where is a constant. The communication energy consumption of UAV k for visiting N target nodes is represented by
3.5. Total Energy Consumption Model
To sum up, the total energy consumption of UAV k for visiting N target nodes is calculated as
The total time used by UAV k for visiting N target nodes is
3.6. Problem Formulation
There are, in total, K UAVs initially deployed at the base station , and the UAV k denotes the UAV deployed at the base station. Each UAV starts from the base station, sequentially visits some nodes and finally returns to the base station. For each visited node, the UAV hovers above that node for a certain period of time while collecting data from that node.
Our goal is to design the flight trajectory (which nodes to visit and the corresponding visiting order) as well as the flight speed between any two neighbouring visited nodes on the flight trajectory for each of the K UAVs, such that the task completion time (the total time until when all nodes successfully upload their data) and the maximum single-UAV energy consumption among all the K UAVs are both minimized. We formulate the above joint trajectory design and speed scheduling problem as a multi-objective optimization problem. The representation of the objectives is as follows:
where N represents the total number of target nodes that the UAVs need to visit, and K denotes the number of UAVs. represents the energy consumption of the UAV (as in Equation (12)), while represents the time taken for the UAV to complete its tasks (as in Equation (13)). We aim to maximize two objectives, and . Additionally, the UAVs are subject to the following constraints during task execution:
where N is the total number of target nodes that the UAVs need to visit, and K is the number of UAVs. According to the reference [42], the first constraint represents the variation range of the UAVs’ flight speed, where is set to 0.01 m/s and is set to 30 m/s. The second constraint, , is a binary decision variable indicating whether a UAV flies from node i to node j. The third constraint ensures that each node is visited once, meaning that a UAV flies from node i to node j and then to other nodes. The fourth constraint states that each UAV departs from the base station, visits the nodes, and must return to the base station, resulting in a closed loop for the flight path of each UAV (the sum of the vectors is equal to zero); the vector represents the straight-line vector connecting task node i and j with direction from i to j.
4. Multi-UAV Trajectory Design and Speed Control
In recent years, evolutionary algorithms inspired by nature have become more and more popular in UAV trajectory planning, because evolutionary algorithms can effectively deal with the dynamic constraints of UAVs and can search for the globally optimal solution in complex scenarios. At present, many evolutionary algorithms have been developed and used to solve the trajectory planning problem in UAV-enabled WSNs, such as the cuckoo search algorithm (CS) [43], ant colony optimization algorithm (ACO) [44], genetic algorithm (GA) [45], differential evolution algorithm (DEA) [46] and particle swarm optimization algorithm (PSO) [47]. ACO is a kind of new imitation evolutionary algorithm which is designed to solve the adaptive computing problem. ACO imitates the behavior of ants when foraging and gradually converges to the global optimal solution to the targeted problem according to the heuristic idea and through the induction of information cable. This algorithm is widely used to solve TSP problems [48].
This paper introduces MOACO-ACM, a method that optimizes the trajectory and speed of deployed UAVs simultaneously. The solution process consists of three stages, as shown in Algorithm 1:
- (1)
- The adaptive coordinate method is used to determine orbital nodes for each UAV. Initially, N task nodes are mapped to a two-dimensional plane coordinate system denoted as , where . Assuming the central hangar is at (0, 0), K rays are generated from this node, dividing the two-dimensional plane into K regions, each containing a certain number of task nodes. To ensure that each task node falls between two adjacent rays, a node capture mechanism is designed. This mechanism assigns a node to a task node based on the angle and distance between the node and its adjacent rays. The generation of K rays follows these steps: a random generation strategy is used during the first period of the iteration to explore the entire area and avoid local optima. After this period, local exploration is performed by adjusting the angles of the K rays using Equations (18)–(20).
- (2)
- Once the first stage is completed, the matching between the flying UAVs and the N task nodes is established. Then, the ACO is applied to find the shortest TSP path for each UAV based on the assigned task nodes.
- (3)
- The UAV’s speed interval is discretized into several speed values. Each speed value is sequentially substituted to solve for the candidate optimum between the task completion time of the largest single UAV and the energy consumption of the largest single UAV, resulting in a Pareto front.
| Algorithm 1 MOACO-ACM. |
Input: The coordinate of each node, the number of UAVs K and the maximum number of iterations . Output: Pareto-optimal solution to the proposed problem.
|
| Algorithm 2 Ant colony optimization algorithm for optimizing the flight trajectory of the UAV. |
Input: The city number visited by the UAV; (Maximum number of iterations of ant colony optimization algorithm); (Ant colony numbers). Output: trajectory of the UAV.
|
4.1. Adaptive Coordinate Method
Since the data-uploading demand of each node and the flight trajectory of each UAV both influence the flight time and energy consumption, to ensure the minimum flight time and the minimum energy consumption of a single UAV among all UAVs, a balance must be made between the number and locations of nodes visited by UAVs. Specifically, if a certain UAV chooses to visit the nodes which have relatively high data-uploading demands, then the UAV may need to reduce the number of nodes to be visited or try to find a short trajectory for minimizing both the flight time and the energy consumption during the task. Therefore, we first use the adaptive coordinate method to divide all the N nodes into K different groups where each group of nodes will be visited by one of the K UAVs. Then, the ant colony optimization algorithm is applied to plan the trajectory of each UAV for visiting its assigned group.
The adaptive coordinate method is mainly divided into two stages: the global exploration stage and the local exploration stage. In the exploration stage, more attention is paid to the search space of the algorithm and more feasible solution regions are searched. In the development stage, attention should be paid to the local exploration of solution space, and the local exploration should be carried out near high-quality feasible solutions to ensure the convergence of the algorithm.
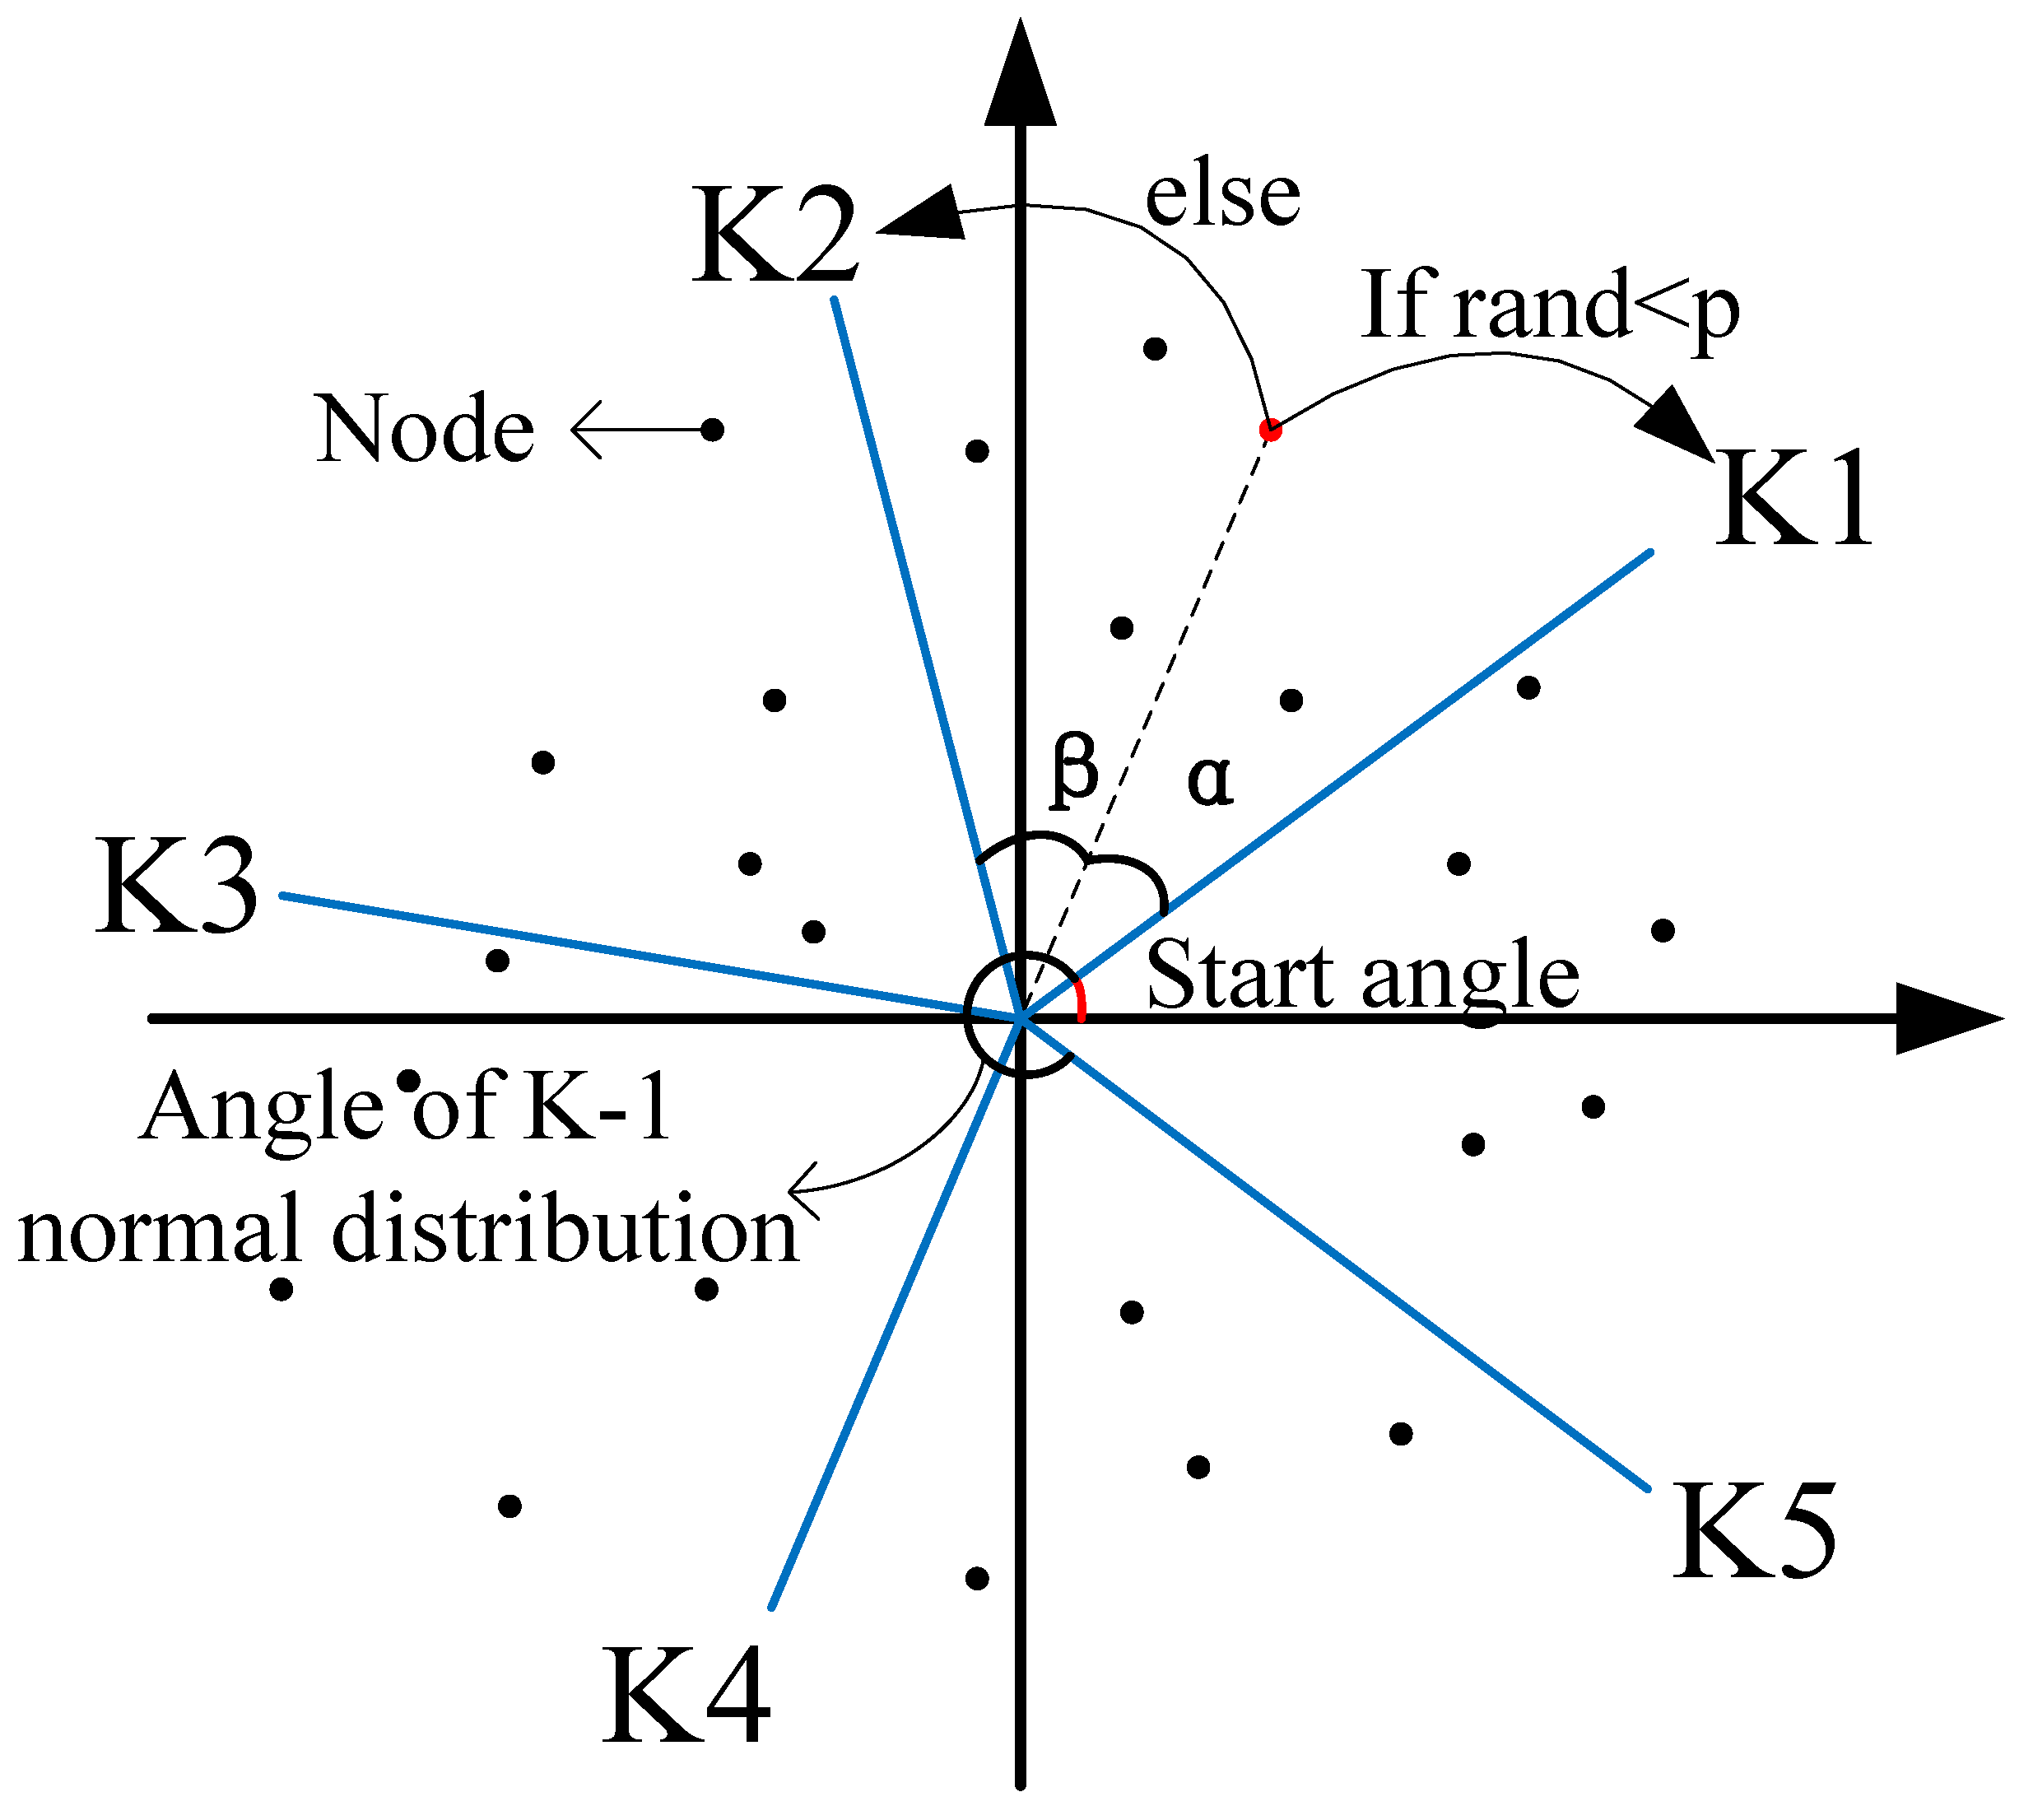
The exploration phase is operated as follows (as shown in Figure 3): K rays are generated to represent K UAVs (The following assumption of K = 5 is used to illustrate the algorithm process). Each ray will capture nearby nodes and the captured nodes will be visited by the corresponding assigned UAV. For the exploration phase, we should answer the following two questions: (1) How can we generate K rays? (2) How do rays capture nodes?
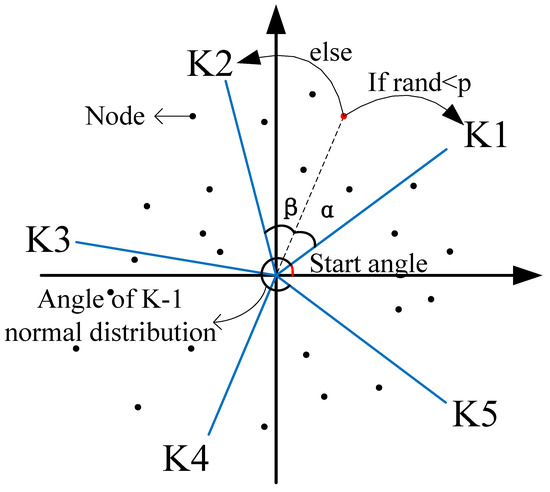
Figure 3.
Exploration phase of the adaptive coordinate method.
First, we divide the coordinate system through angle partition in . We randomly generate a starting angle and random numbers from a distribution with mean and variance . From the starting angle, we sequentially generate K angles which correspond to K rays. We use the array to record the K angles, which is shown in Figure 4.

Figure 4.
K angles generation schematics.
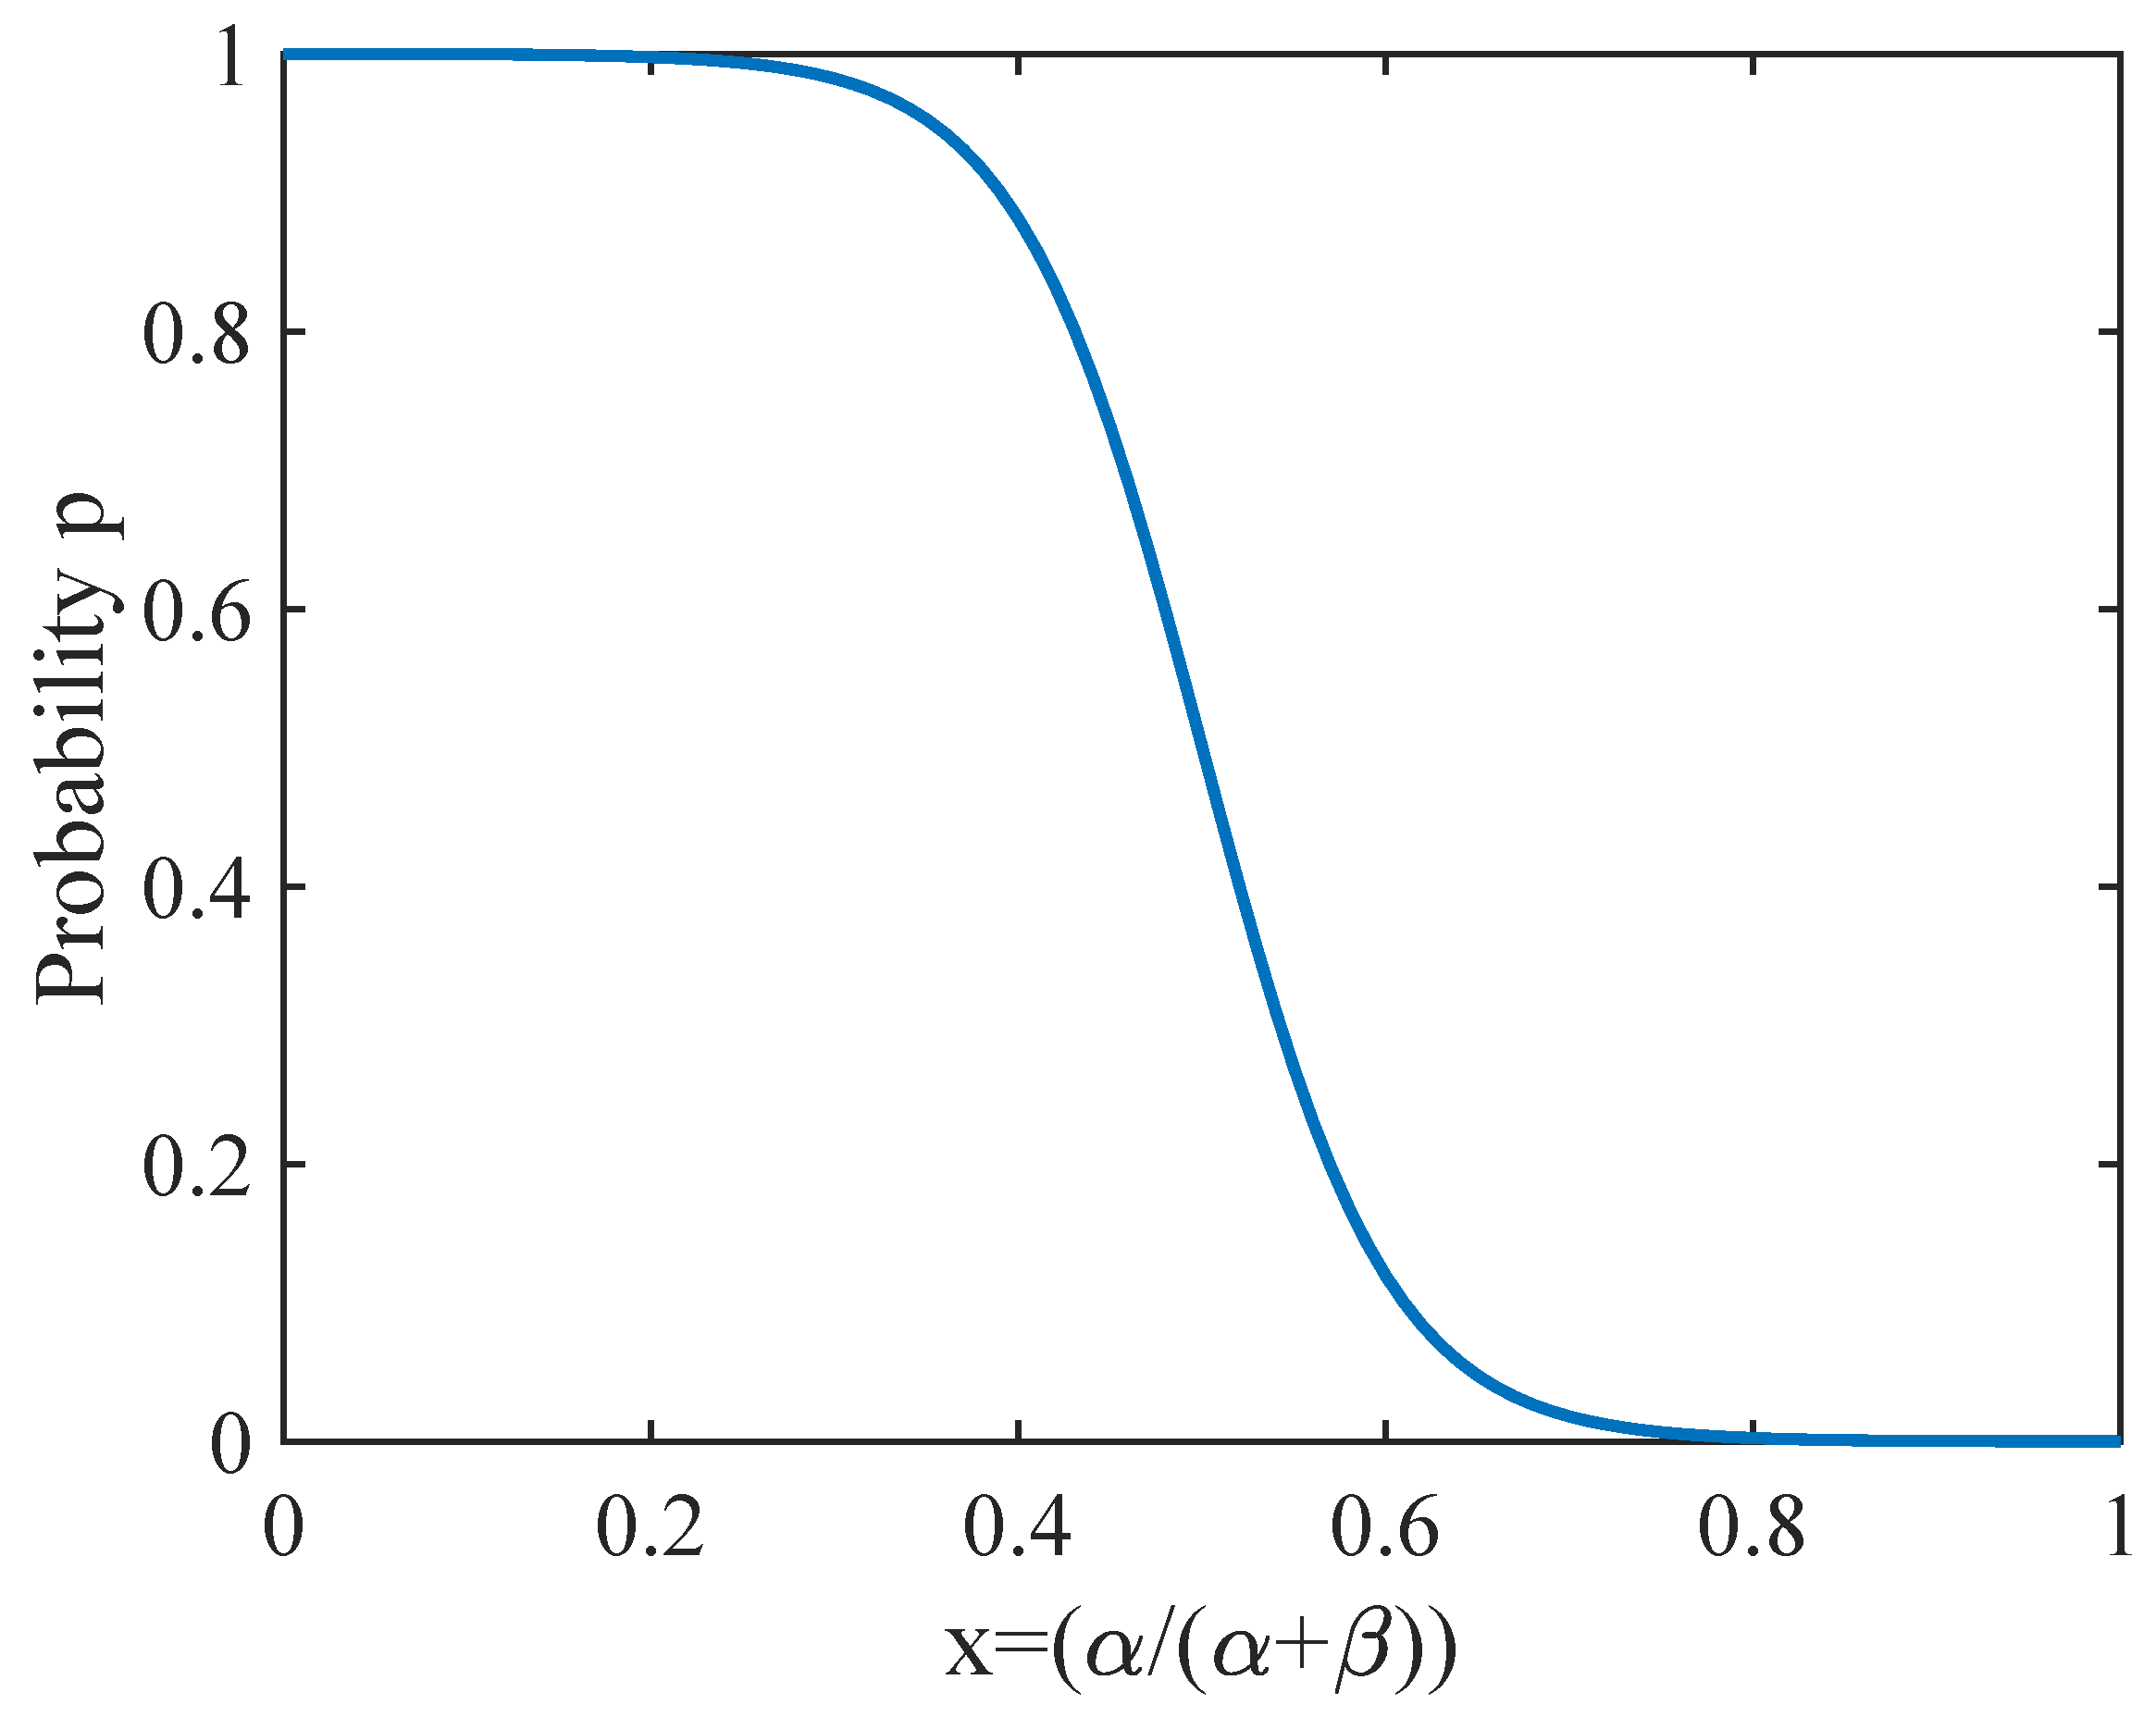
Secondly, to group the captured nodes, we first assign an angle to each node, which is the angle of the ray formed by connecting the origin. Then, we determine which two rays the node is located between (as shown in Figure 3) and calculate the angle or between the node and these two rays. Finally, we use Equations (16) and (17) to calculate the probability p of the node of being visited by UAV and .
where and represent the two angles between rays and . The probability p is shown in Figure 5.
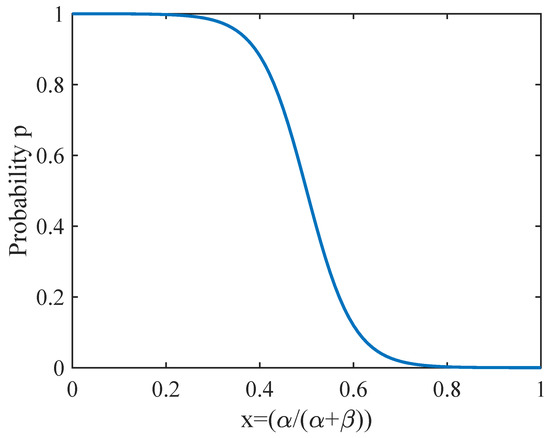
Figure 5.
Sigmoid function.
When entering the global exploration stage, we will first select and record the optimal coordinate angle found in the local exploration stage, and then use this angle for local exploration. There are two optimization methods in this stage. One is to reduce the coordinate angle of the previous UAV and increase the coordinate angle of the latter UAV according to the UAV with the maximum flight time or energy consumption. The other is to choose the UAV with the minimum flight time or energy consumption, increasing the coordinate angle of the former UAV and decreasing the latter UAV. Here, the increment or decrement of the coordinate angle is controlled by Equations (19) and (20).
where represents the number of the UAV that consumes the most or least flight time and energy consumption while generating the trajectory. uses the flight time or energy consumption difference between neighbouring UAVs to control the step size of the moving angle. is adjacent UAVs angle distance.
4.2. The Discussion of the Impact of Flight Speed
When the UAV needs to quickly reach a certain height or speed in a short period of time, variable speed flight may be more efficient, but if it needs to maintain a certain speed and height in a long period of time, constant speed flight will save more energy. Therefore, the impact of variable speed and constant speed on flight energy consumption of the UAV is closely related to specific tasks, flight distance, speed, height and other factors. In practical application, in order to balance the relationship between UAV energy consumption and flight time, various factors such as task requirements and flight environment should be comprehensively considered. This paper discusses the influence of uniform and variable speed flight of UAV on the objective function, which will be shown in Section 6.
5. Comparison Algorithm Design
5.1. Comparison Algorithms and Parameter Setting
All algorithms were run on Matlab of the same computer. The main parameter settings of UAV in this work are shown in Table 1. Each algorithm runs independently 30 times. In order to verify the effectiveness of the proposed algorithm, we will describe the parameter settings of all algorithms in detail below:

Table 1.
UAV Parameters Setting.
- (1)
- UAV trajectory optimization algorithms: Our algorithm was compared with three popular trajectory optimization algorithms (variation of the ant colony algorithm named ACO-NODE [38], a genetic trajectory planning algorithm with variable population size naemd GTPA-VP [39], a novel reinforcement learning based grey wolf optimizer algorithm called RLGWO [40]). In this section of the experiment, the UAV speed is set to 10. The parameters of all the algorithms being compared are based on the settings described in the paper. The maximum number of iterations is set to 1000. However, this section does not discuss the communication traffic of task nodes.
- (2)
- Multi-objective algorithms: Our algorithm was compared with two advanced multi-objective methods (multi-objective particle swarm optimization (MOPSO), multi-objective ant colony optimization-Kmeans (MOACO-Kmeans)). PlatEMO or Github uploaded the source code of the corresponding algorithms. The common parameters of these algorithms are shown in Table 2, and some unique parameters are defined as follows.
 Table 2. Algorithm Parameters Setting.
MOPSO: This algorithm integrates the flight trajectory and flight speed of UAV into one objective function. The PMX [49] crossover method is used to optimize the flight trajectory of UAVs, and the MOPSO operator is used to optimize the flight speed of UAVs (all UAVs have different flight speeds among different data collection locations). Since the algorithm has only one layer of iteration, in order to maximize the fairness, the external iteration is set as times (at this time, the algorithm basically converges and increasing the number of iterations will consume computer resources).
MOACO-Kmeans: The algorithm designs the flight trajectory and speed for each UAV individually. Firstly, the K-means clustering algorithm [50] is utilized to group N nodes into K clusters, where each cluster is assigned a UAV for the task. Next, the MOACO algorithm is employed to optimize the optimal path for the K clusters of task nodes and refine the flight path for each UAV. Subsequently, and are divided into 100 segments, representing 100 different speeds. The time and energy consumption needed for the UAV to complete the task at these speeds are calculated to optimize the flight time and energy consumption along the Pareto front. The maximum number of iterations for the outer trajectory optimization is set to .
The proposed algorithm: The flight trajectory and flight speed of UAV are discussed separately, and the proposed adaptive coordinate method is used to optimize the nodes visited by each UAV. Then, the optimal trajectory of each UAV is optimized using the ant colony optimization algorithm. Finally, different uniform speeds are set (all UAVs fly with the same speed) to optimize the Pareto front for flight time and energy consumption. The maximum number of iterations for the outer trajectory optimization is set to , and 100 identical speeds are set for the inner speed between 0 and 30.
5.2. Experimental Setting
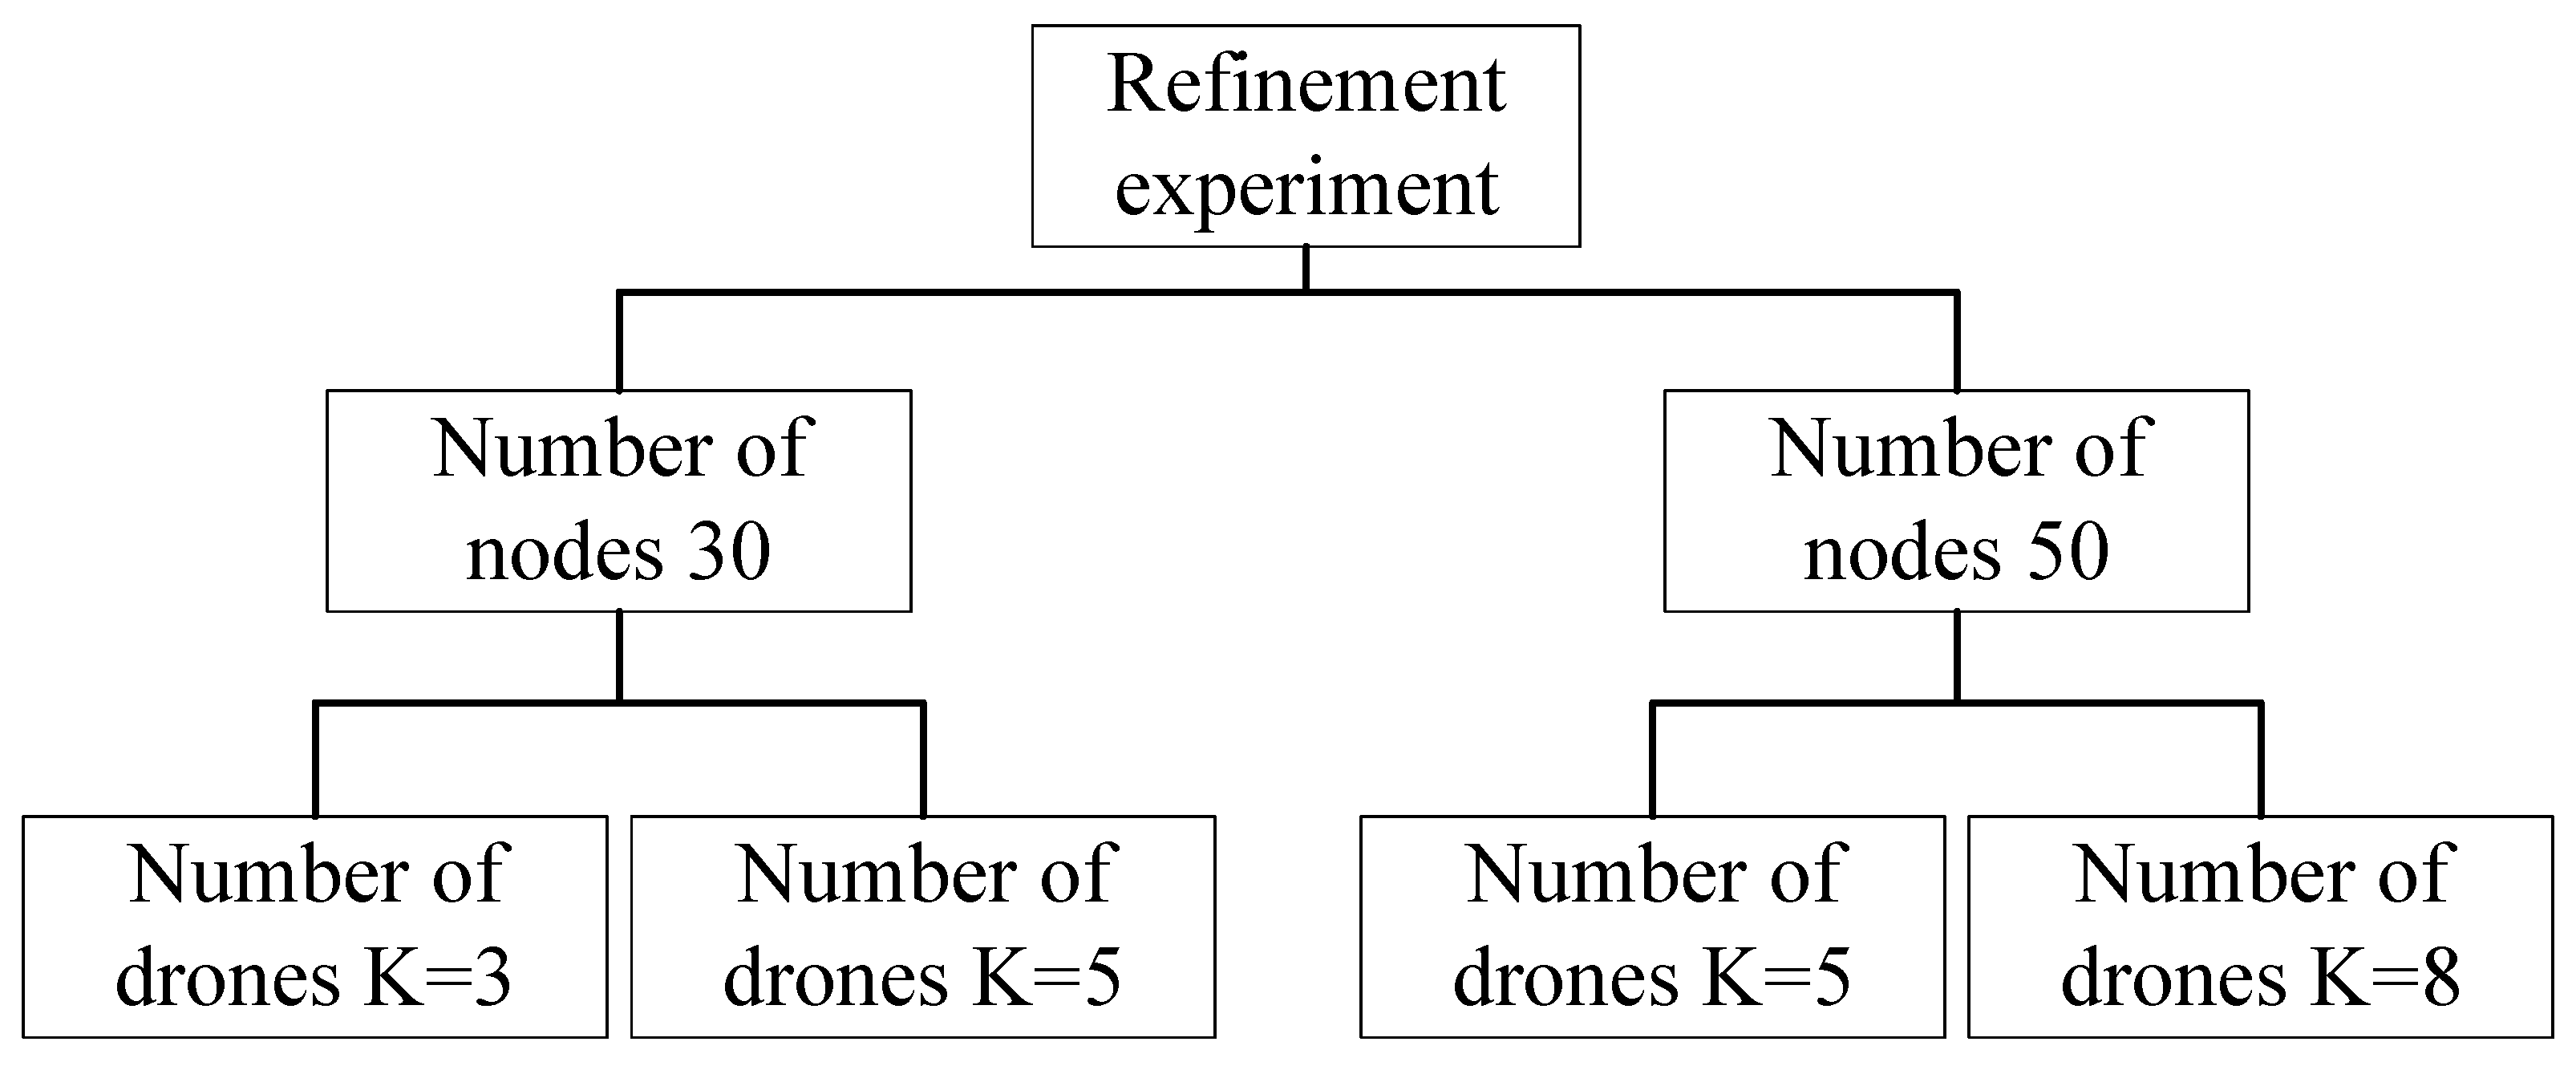
In reality, the distribution of nodes is random and the data-uploading demand of each node is different. Therefore, this section discusses the performance of the algorithm by setting different numbers of nodes and different data-uploading demands of each node and studies the impact of the number of UAVs, the number of nodes and the data-uploading demands on UAVs’ energy consumption and task completion time. This article randomly generates 30 and 50 nodes in a coordinate system, with different data upload ranges for each node. They are divided into four groups: [0–400], [0–600], [0–800], and [0–1000]. In fact, the above setting is not a fixed value that researchers can adjust based on specific environments. We set several feasible values based on the references [30,31,37] to validate the performance of the algorithm. The number of UAVs dispatched to perform data collection tasks are set as 3, 5 and 5, 8, respectively. Specific settings are shown in Figure 6.
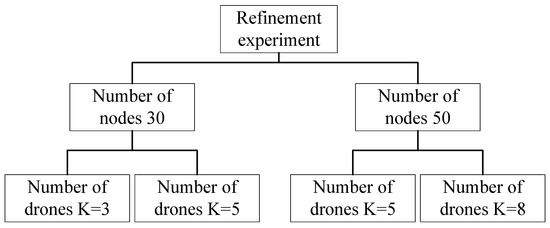
Figure 6.
Experimental Setting.
5.3. Evaluation Index
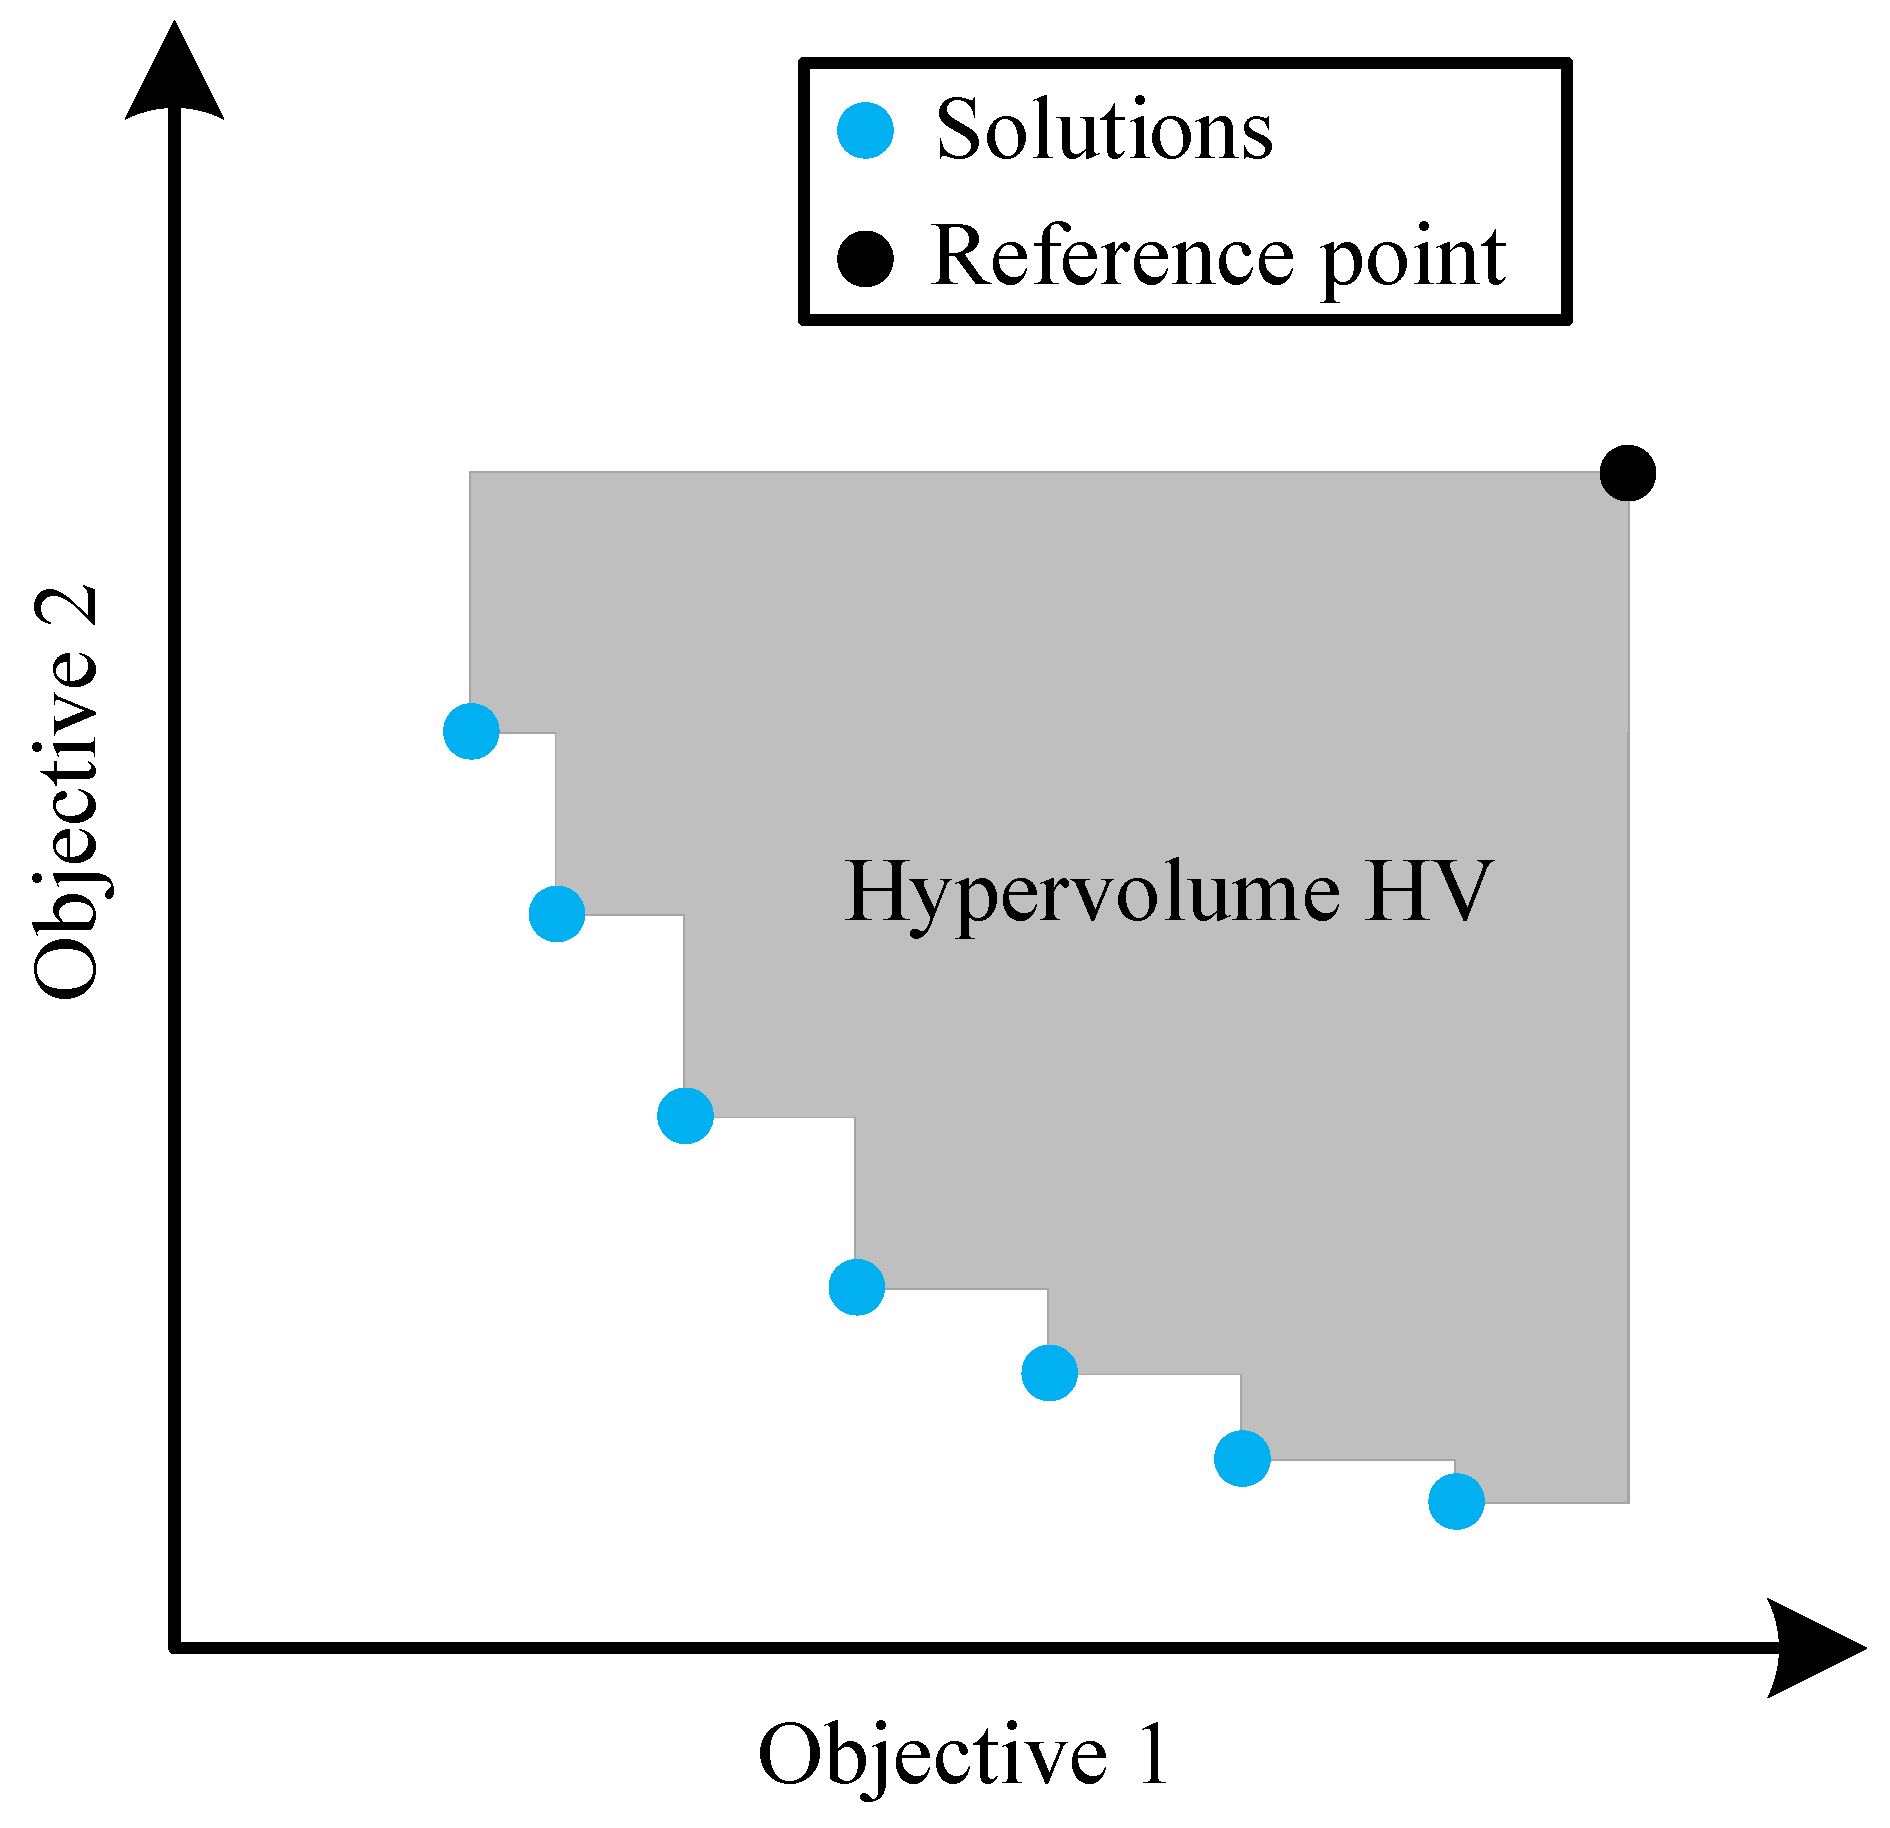
The quality of solution to the multi-objective optimization problem is mainly evaluated by the quality of the Pareto frontier obtained. Therefore, we consider using hypervolume () to evaluate the quality of the obtained solution set. Hypervolume index (, Hypervolume) is defined as follows: The volume of the region in the target space enclosed by the non-dominated solution set obtained by the algorithm and the reference point. The larger the value, the better the comprehensive performance of the algorithm (the comprehensive performance refers to the convergence and diversity of the algorithm), as shown in Figure 7. The setting of reference points is crucial to calculation, so this work obtains the maximum values of UAV time and energy consumption among all results as reference points for . This standard evaluates both diversity and convergence measures [51]. HV is calculated using the following equation
where represents the Lebesgue measure, which is used to measure the volume. denotes the number of non-dominated solution sets, and depicts the formed by the reference point and the solution in the solution set.
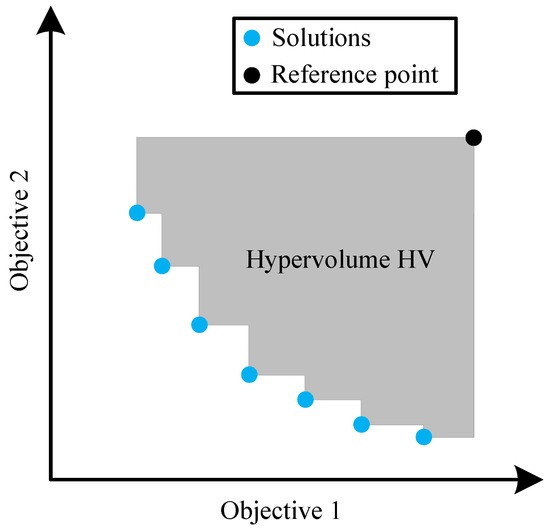
Figure 7.
Example in two dimensions about hypervolume.
6. Simulation Experiment and Result Analysis
This section presents simulation results to evaluate the proposed designs’ effectiveness. The main parameter setting of the UAV is shown in Table 1. All experiments were run on Matlab R2020 with an Intel Core i7 6700HQ CPU and 32 GB of RAM.
6.1. Comparison of the Speed in the Same Trajectory
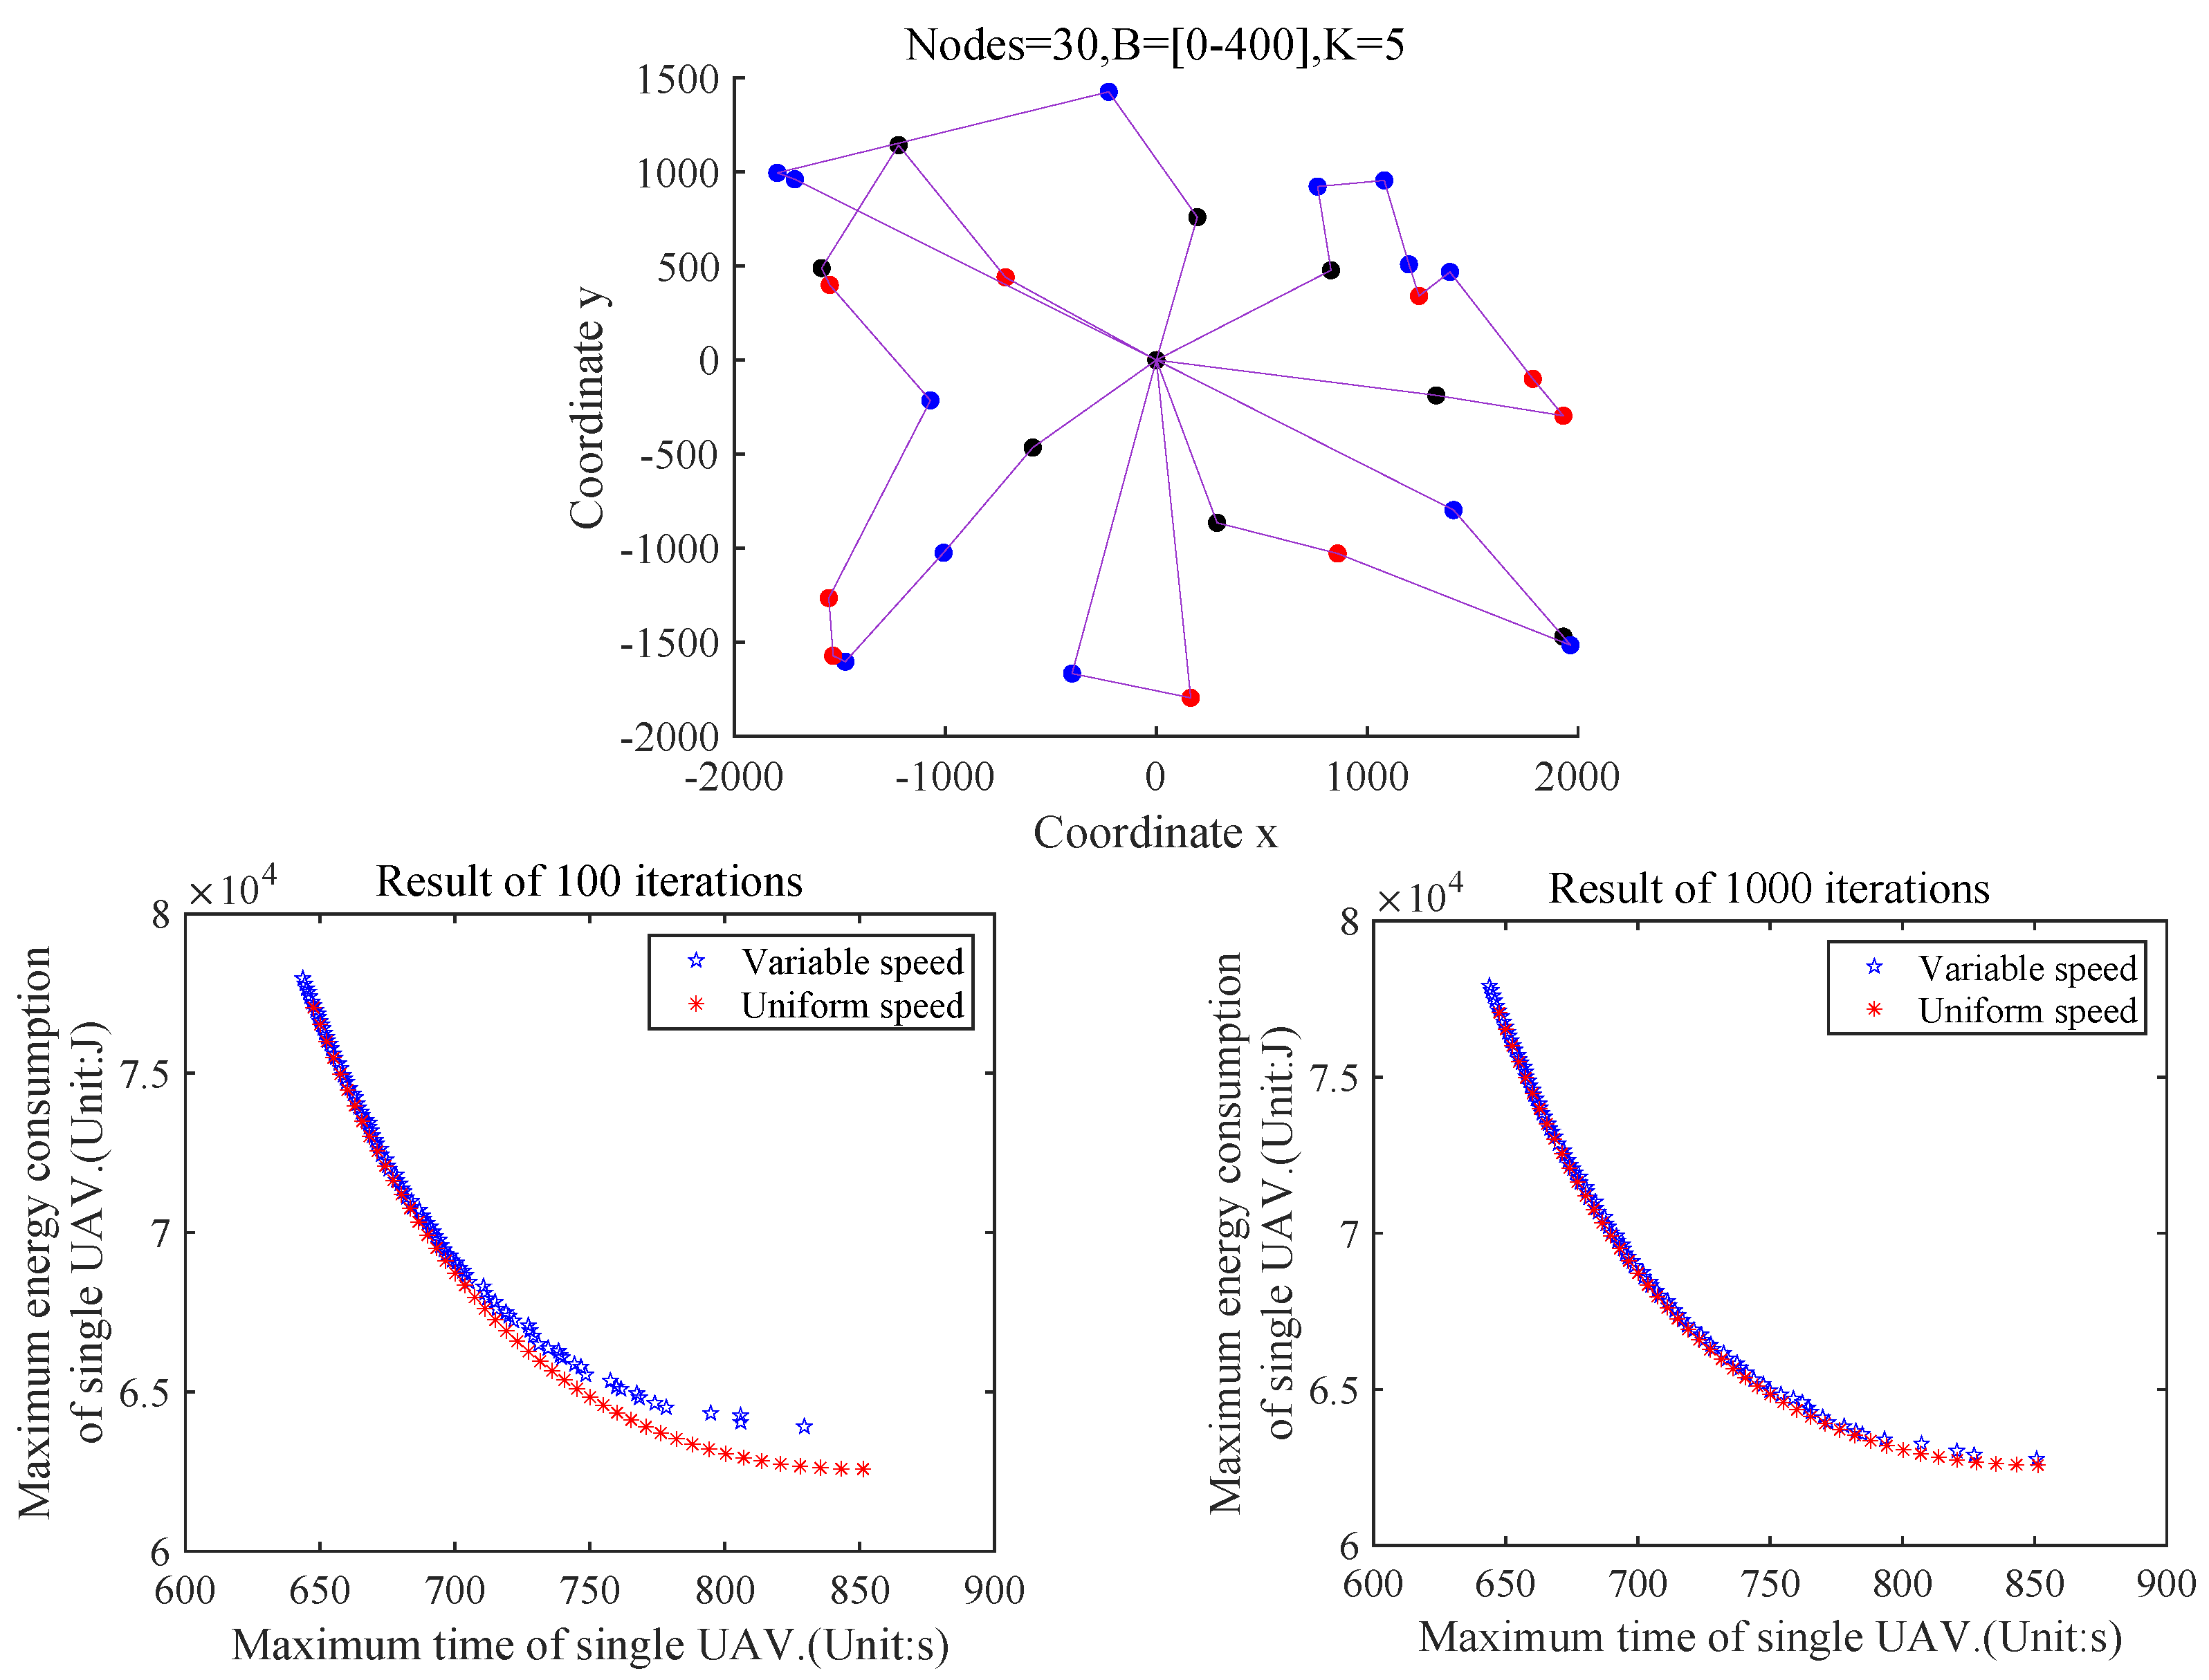
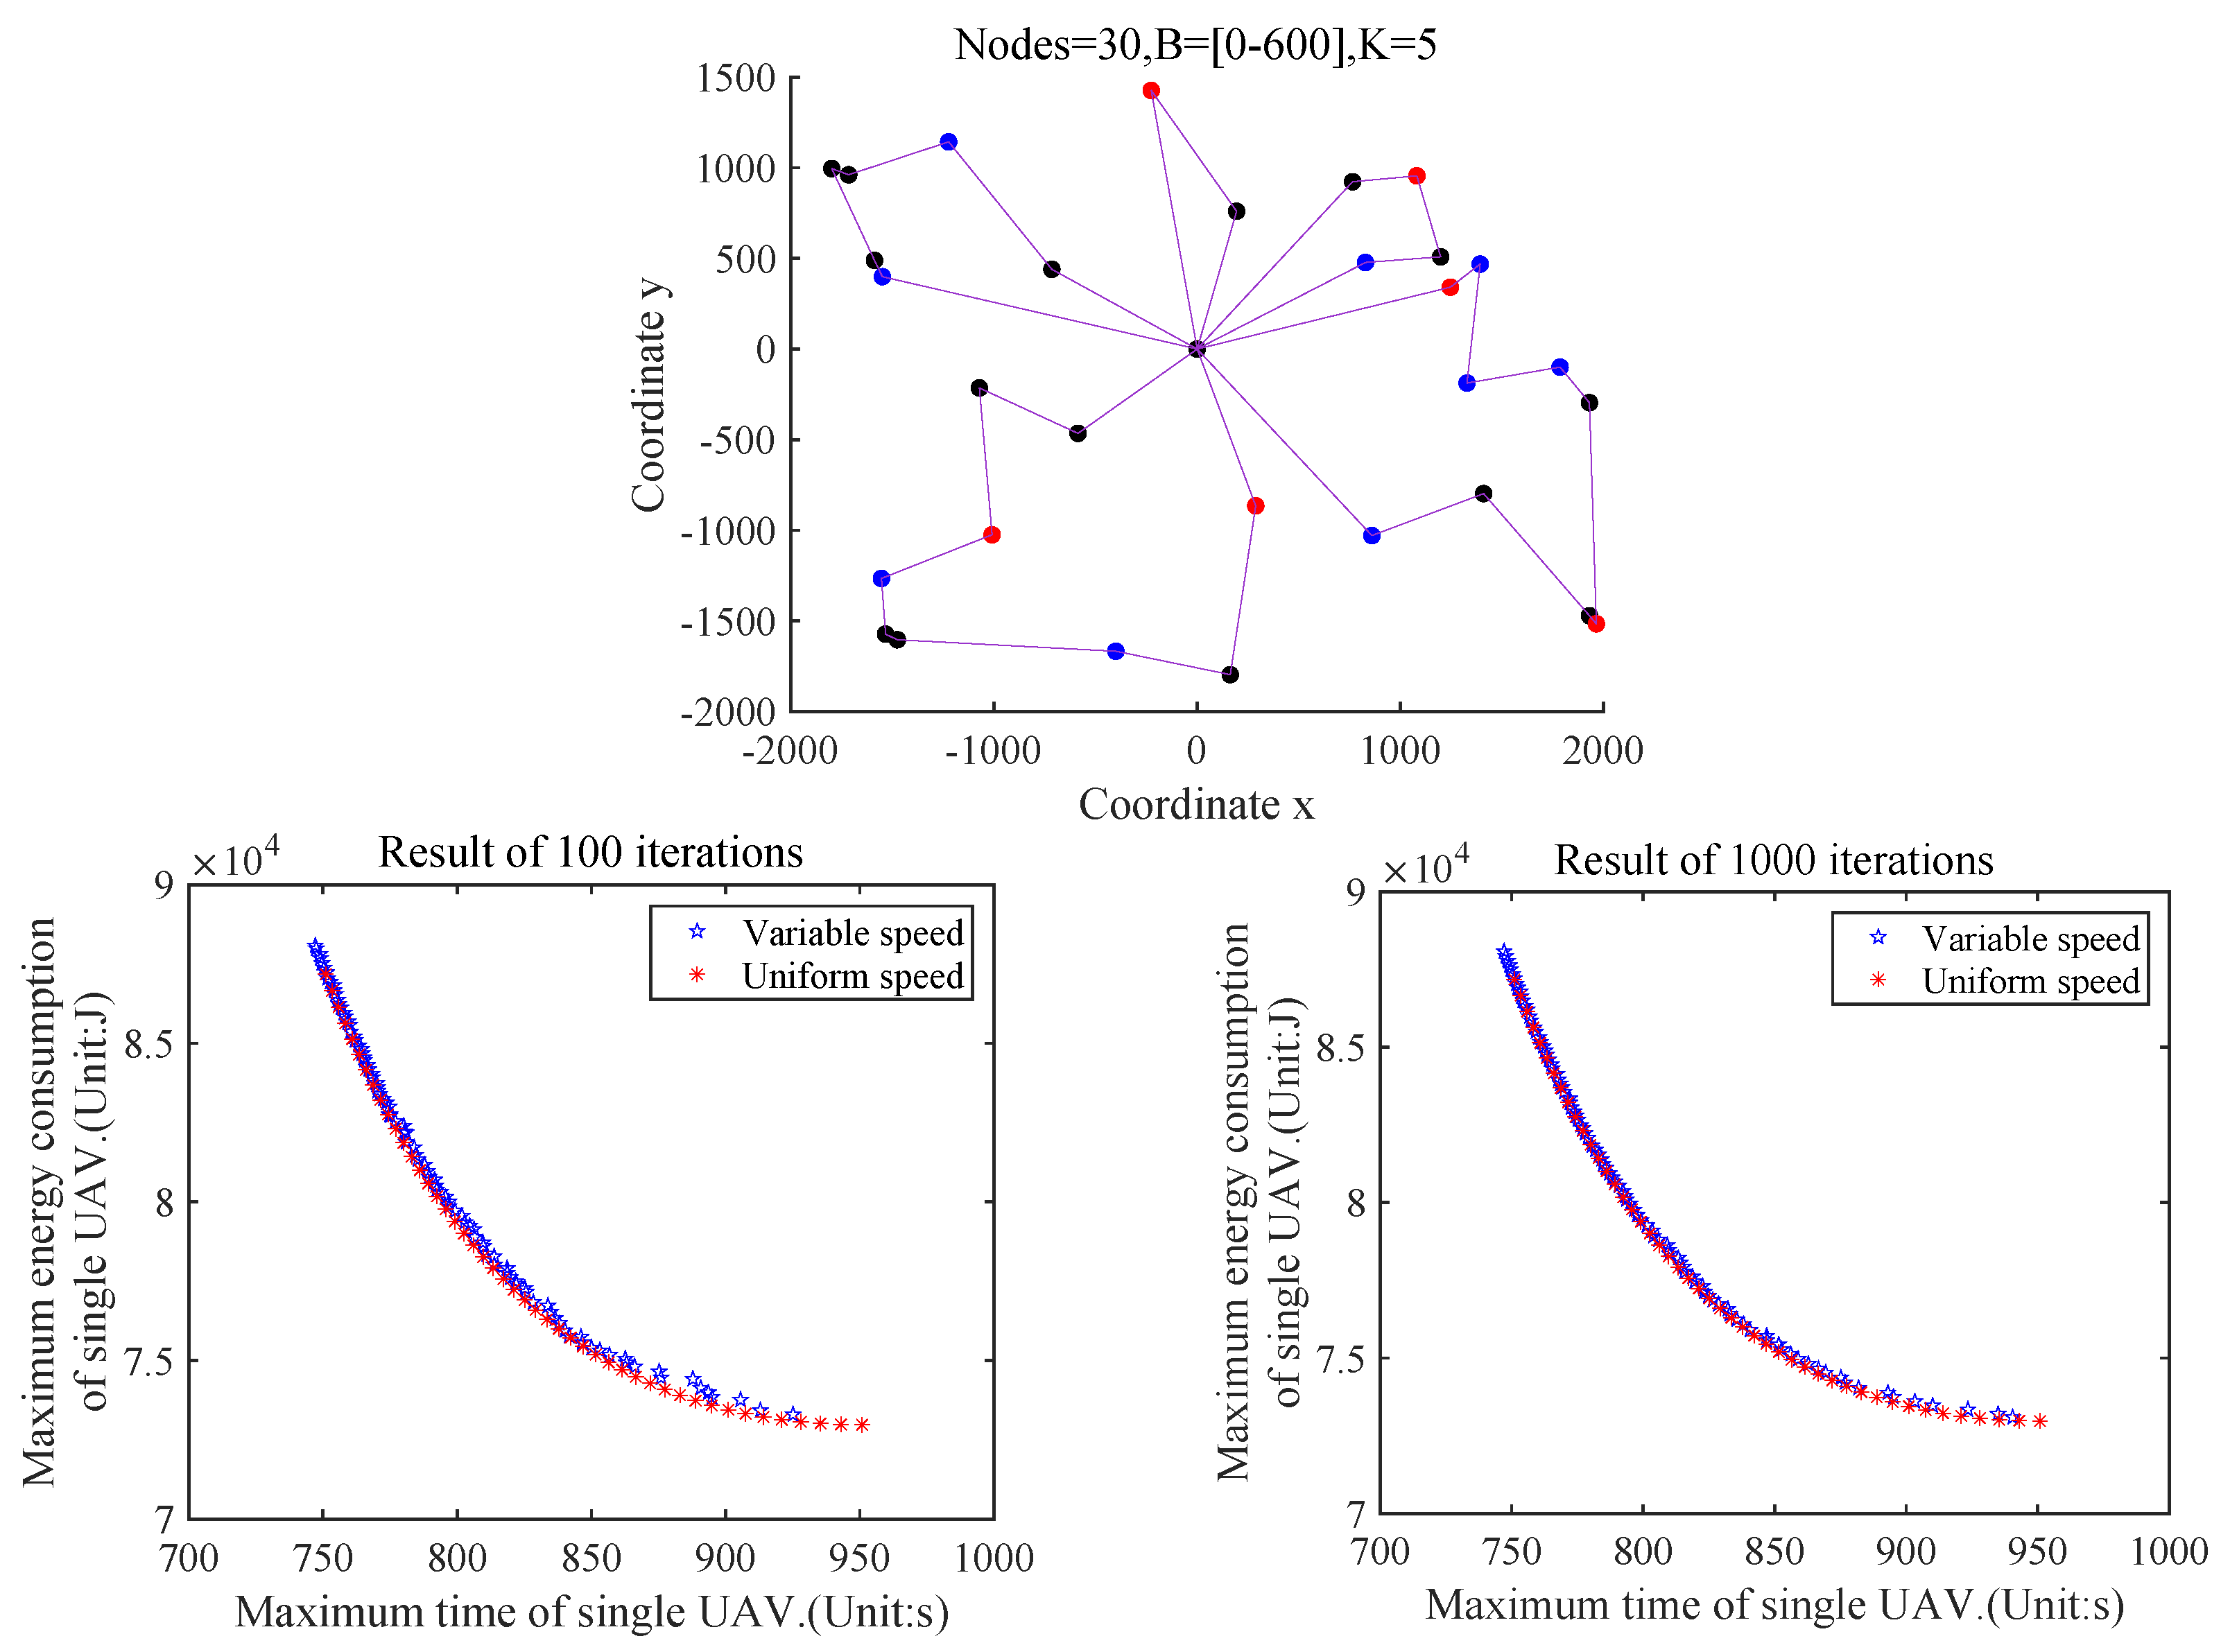
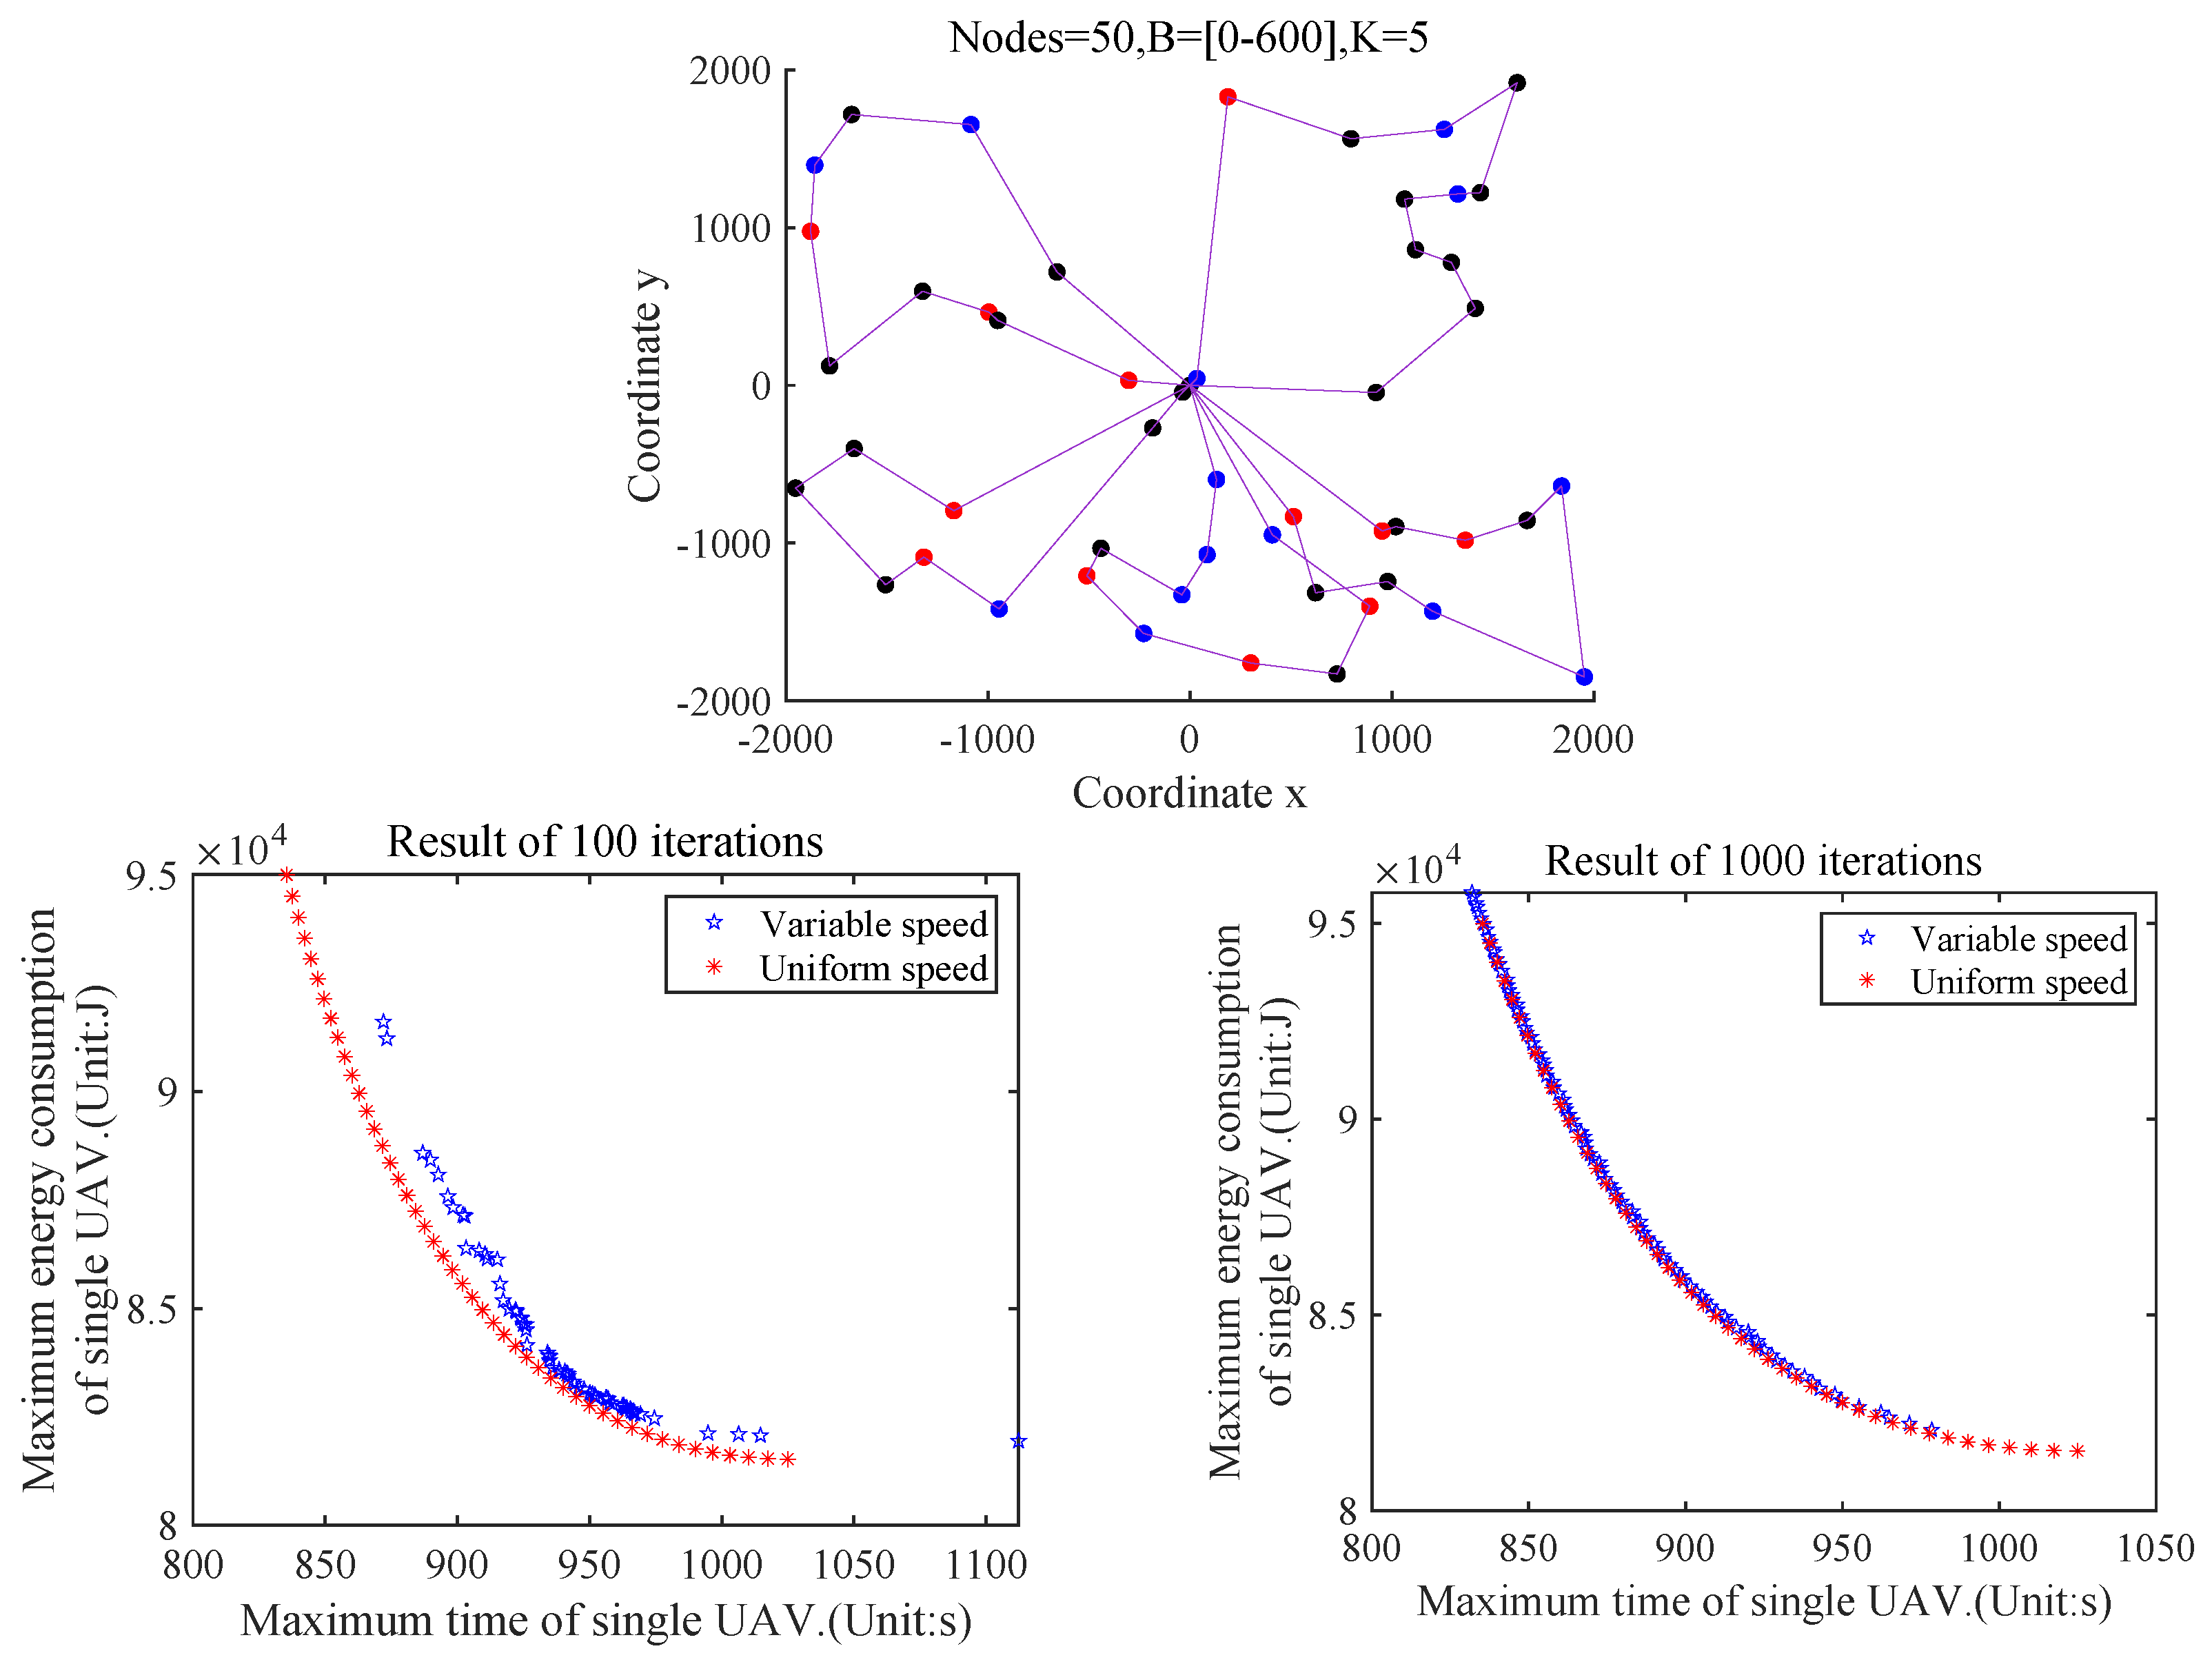
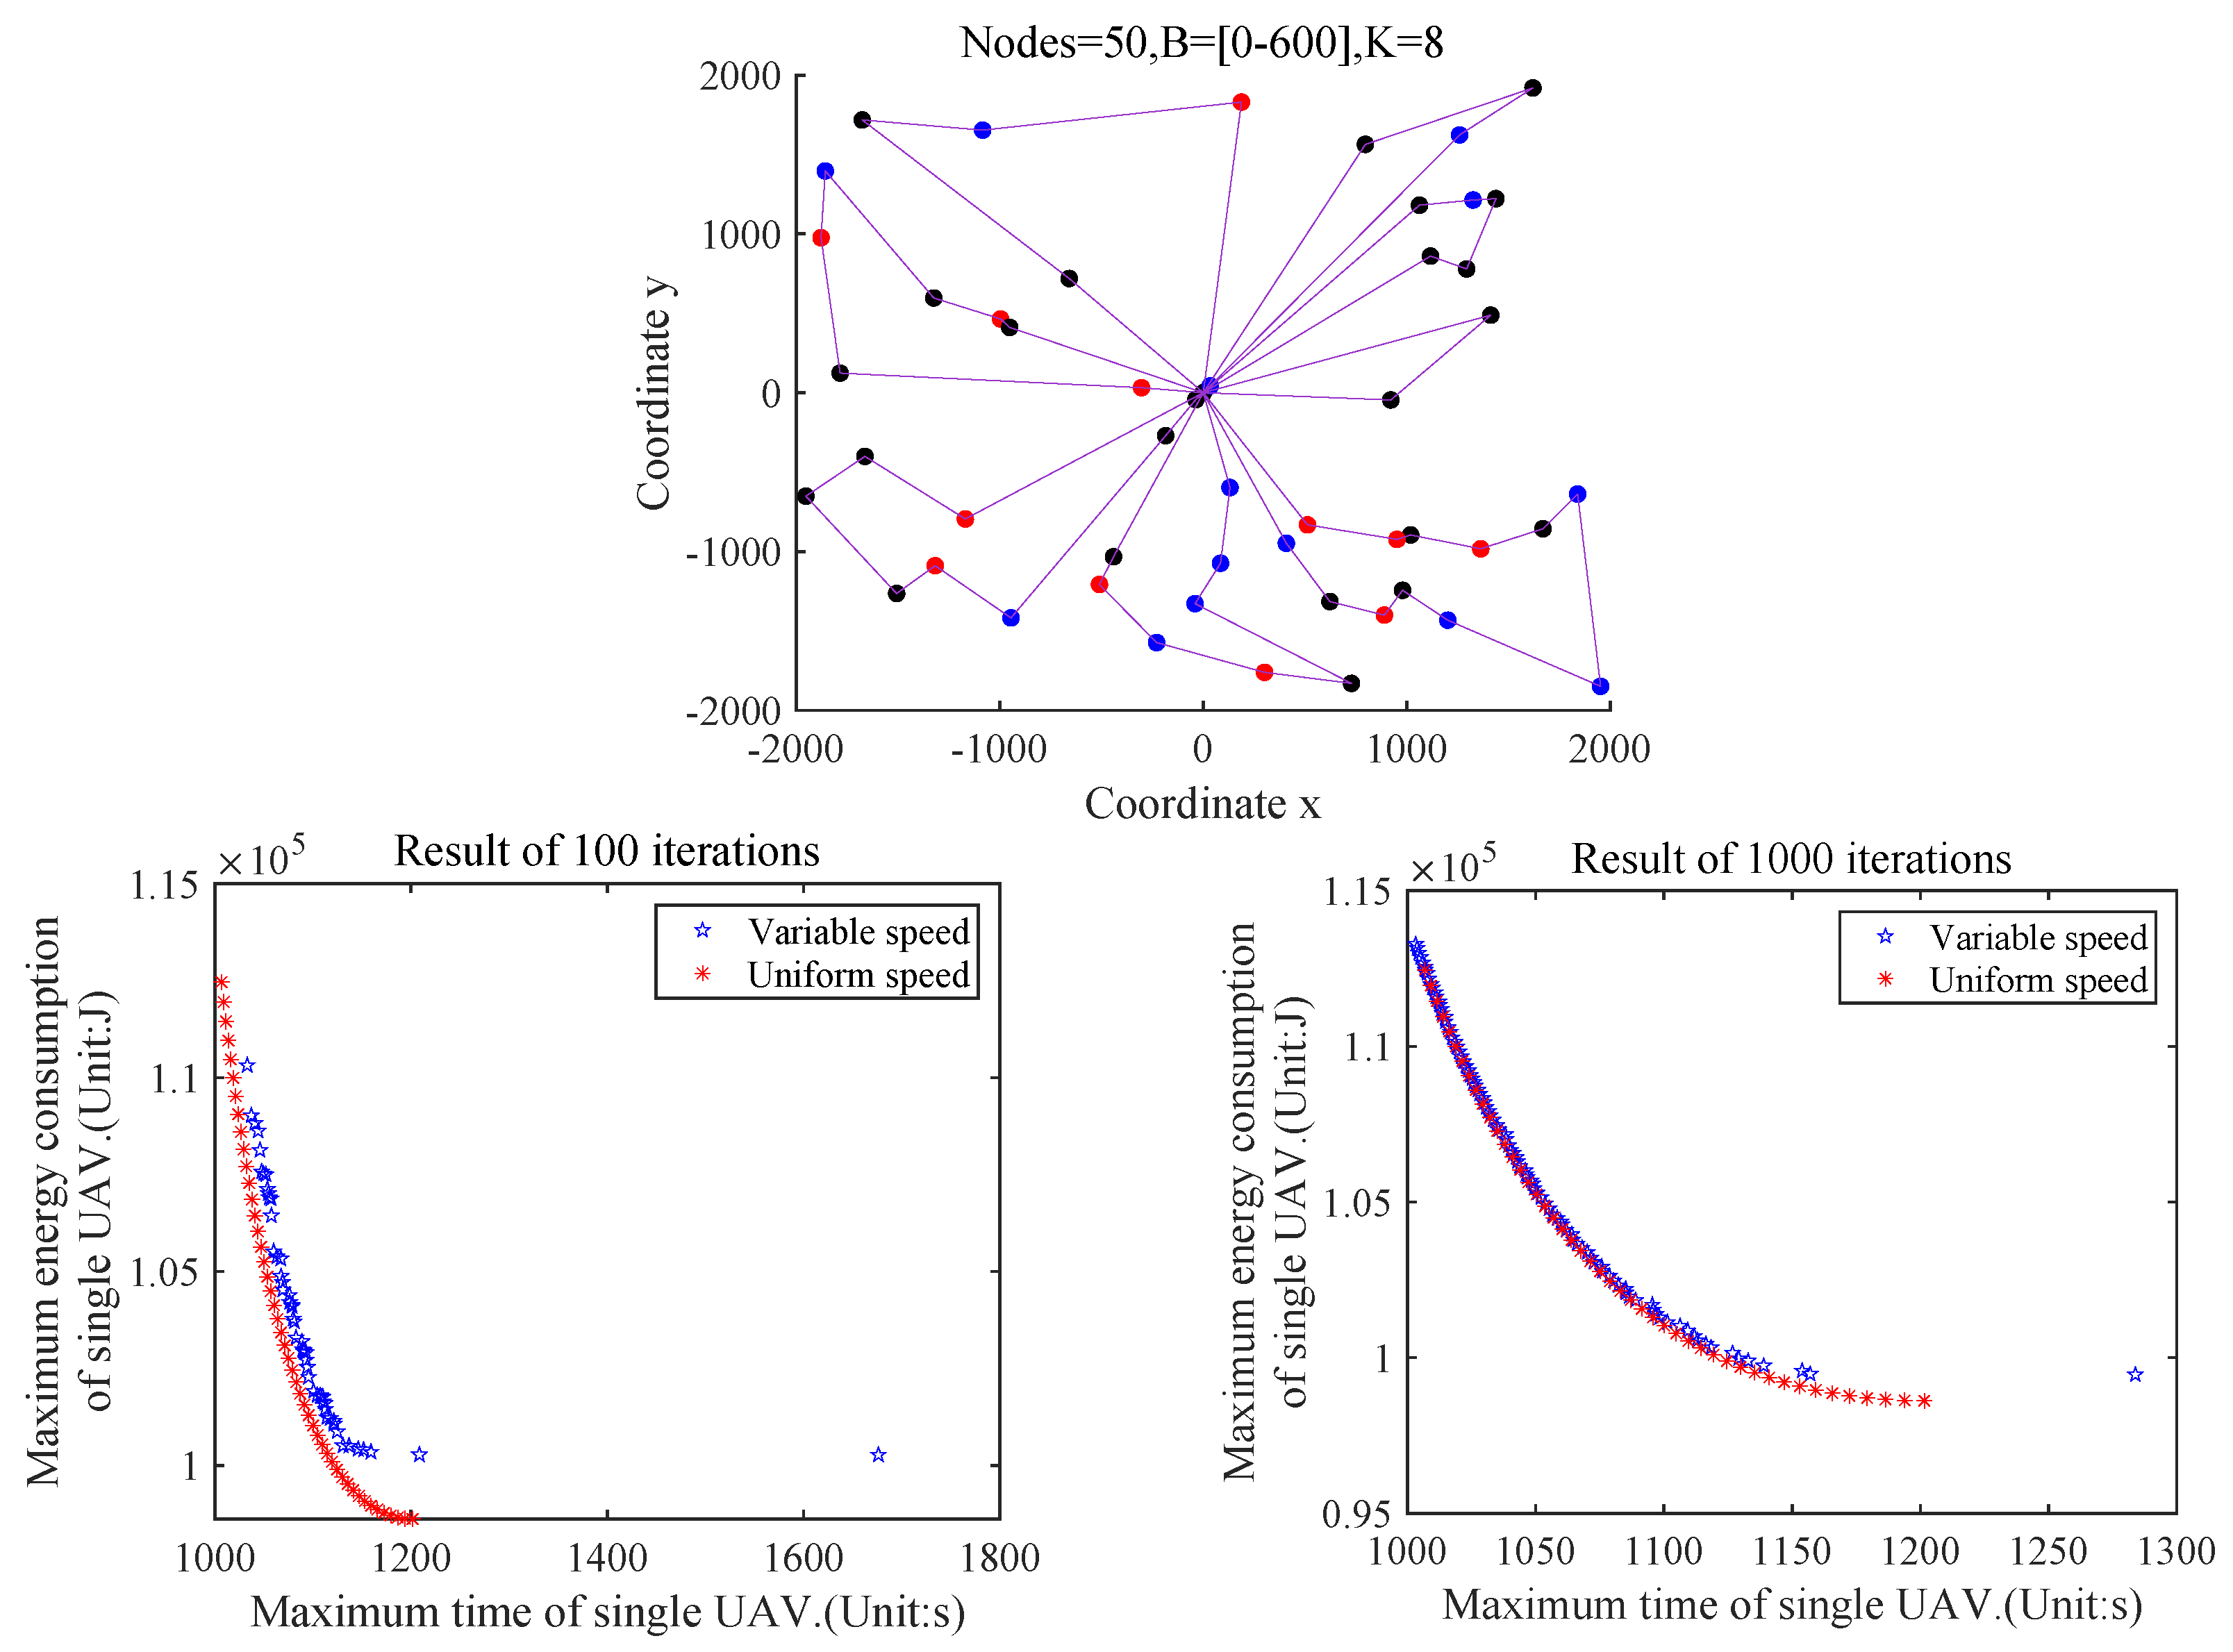
This section focuses on the impacts of comparative speeds on task completion time and energy consumption of UAVs. One is the uniform speed denoted , that is, each UAV has the same speed during the flight. Given a range of (0, 30 m/s], this range is divided into 100 equal parts, each representing a constant uniform speed value. The other one is the variable speed denoted , that is, each UAV flies among nodes with different speeds. Given a range of (0, 30 m/s], the PSO algorithm optimizes the value of . By varying the values of B and K at different nodes, Figure 8, Figure 9, Figure 10 and Figure 11 illustrate the impact of two speeds on the completion time and energy consumption of the UAV during the task, and each figure displays the UAV’s flight path and the results from 100 and 1000 iterations. It is not difficult to find out that in the case of variable speeds, the Pareto front surface gradually approaches the case of setting the average speed with the increment of the number of iterations. Experiments confirm that this situation is independent of the number of UAVs, the number of nodes, and the data-uploading demand of each node. Therefore, we believe that each UAV works better with the same speed. Based on Figure 8, Figure 9, Figure 10 and Figure 11, it is evident that PSO converges after 1000 iterations.
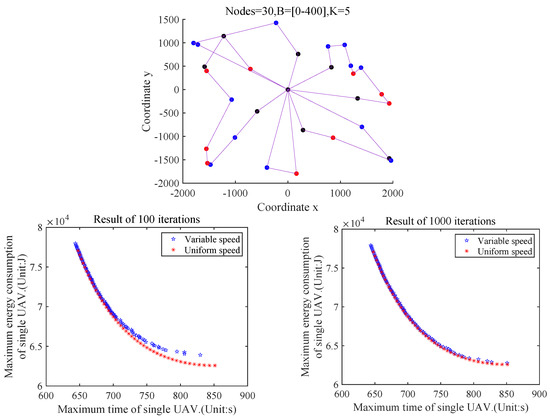
Figure 8.
When Nodes = 30, B = [0–400], k = 5, the Pareto front surface is obtained at uniform speed and variable speed.
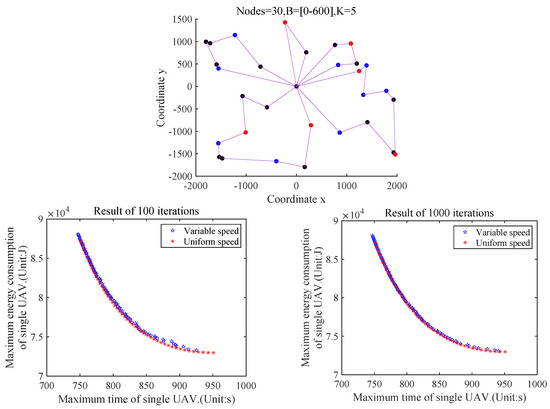
Figure 9.
When Nodes=30, B = [0–600], k = 5, the Pareto front surface is obtained at uniform speed and variable speed.
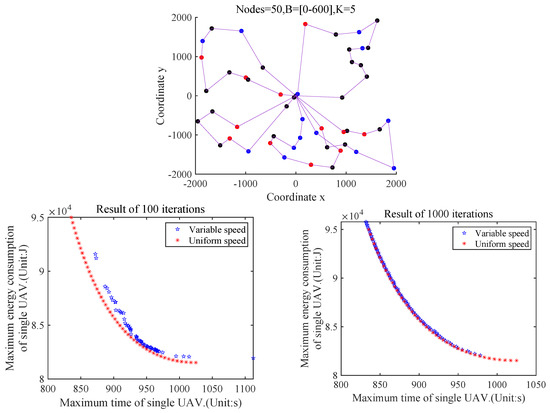
Figure 10.
When Nodes = 50, B = [0–600], k = 5, the Pareto front surface is obtained at uniform speed and variable speed.
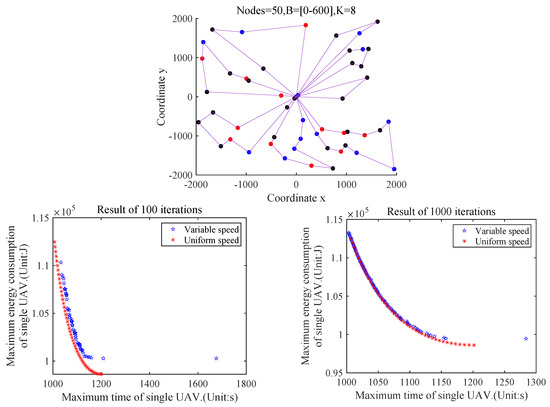
Figure 11.
When nodes = 50, B = [0–600], k = 8, the Pareto front surface is obtained at uniform speed and variable speed.
6.2. Comparison Algorithms
6.2.1. UAV Trajectory Comparison Optimization Algorithms
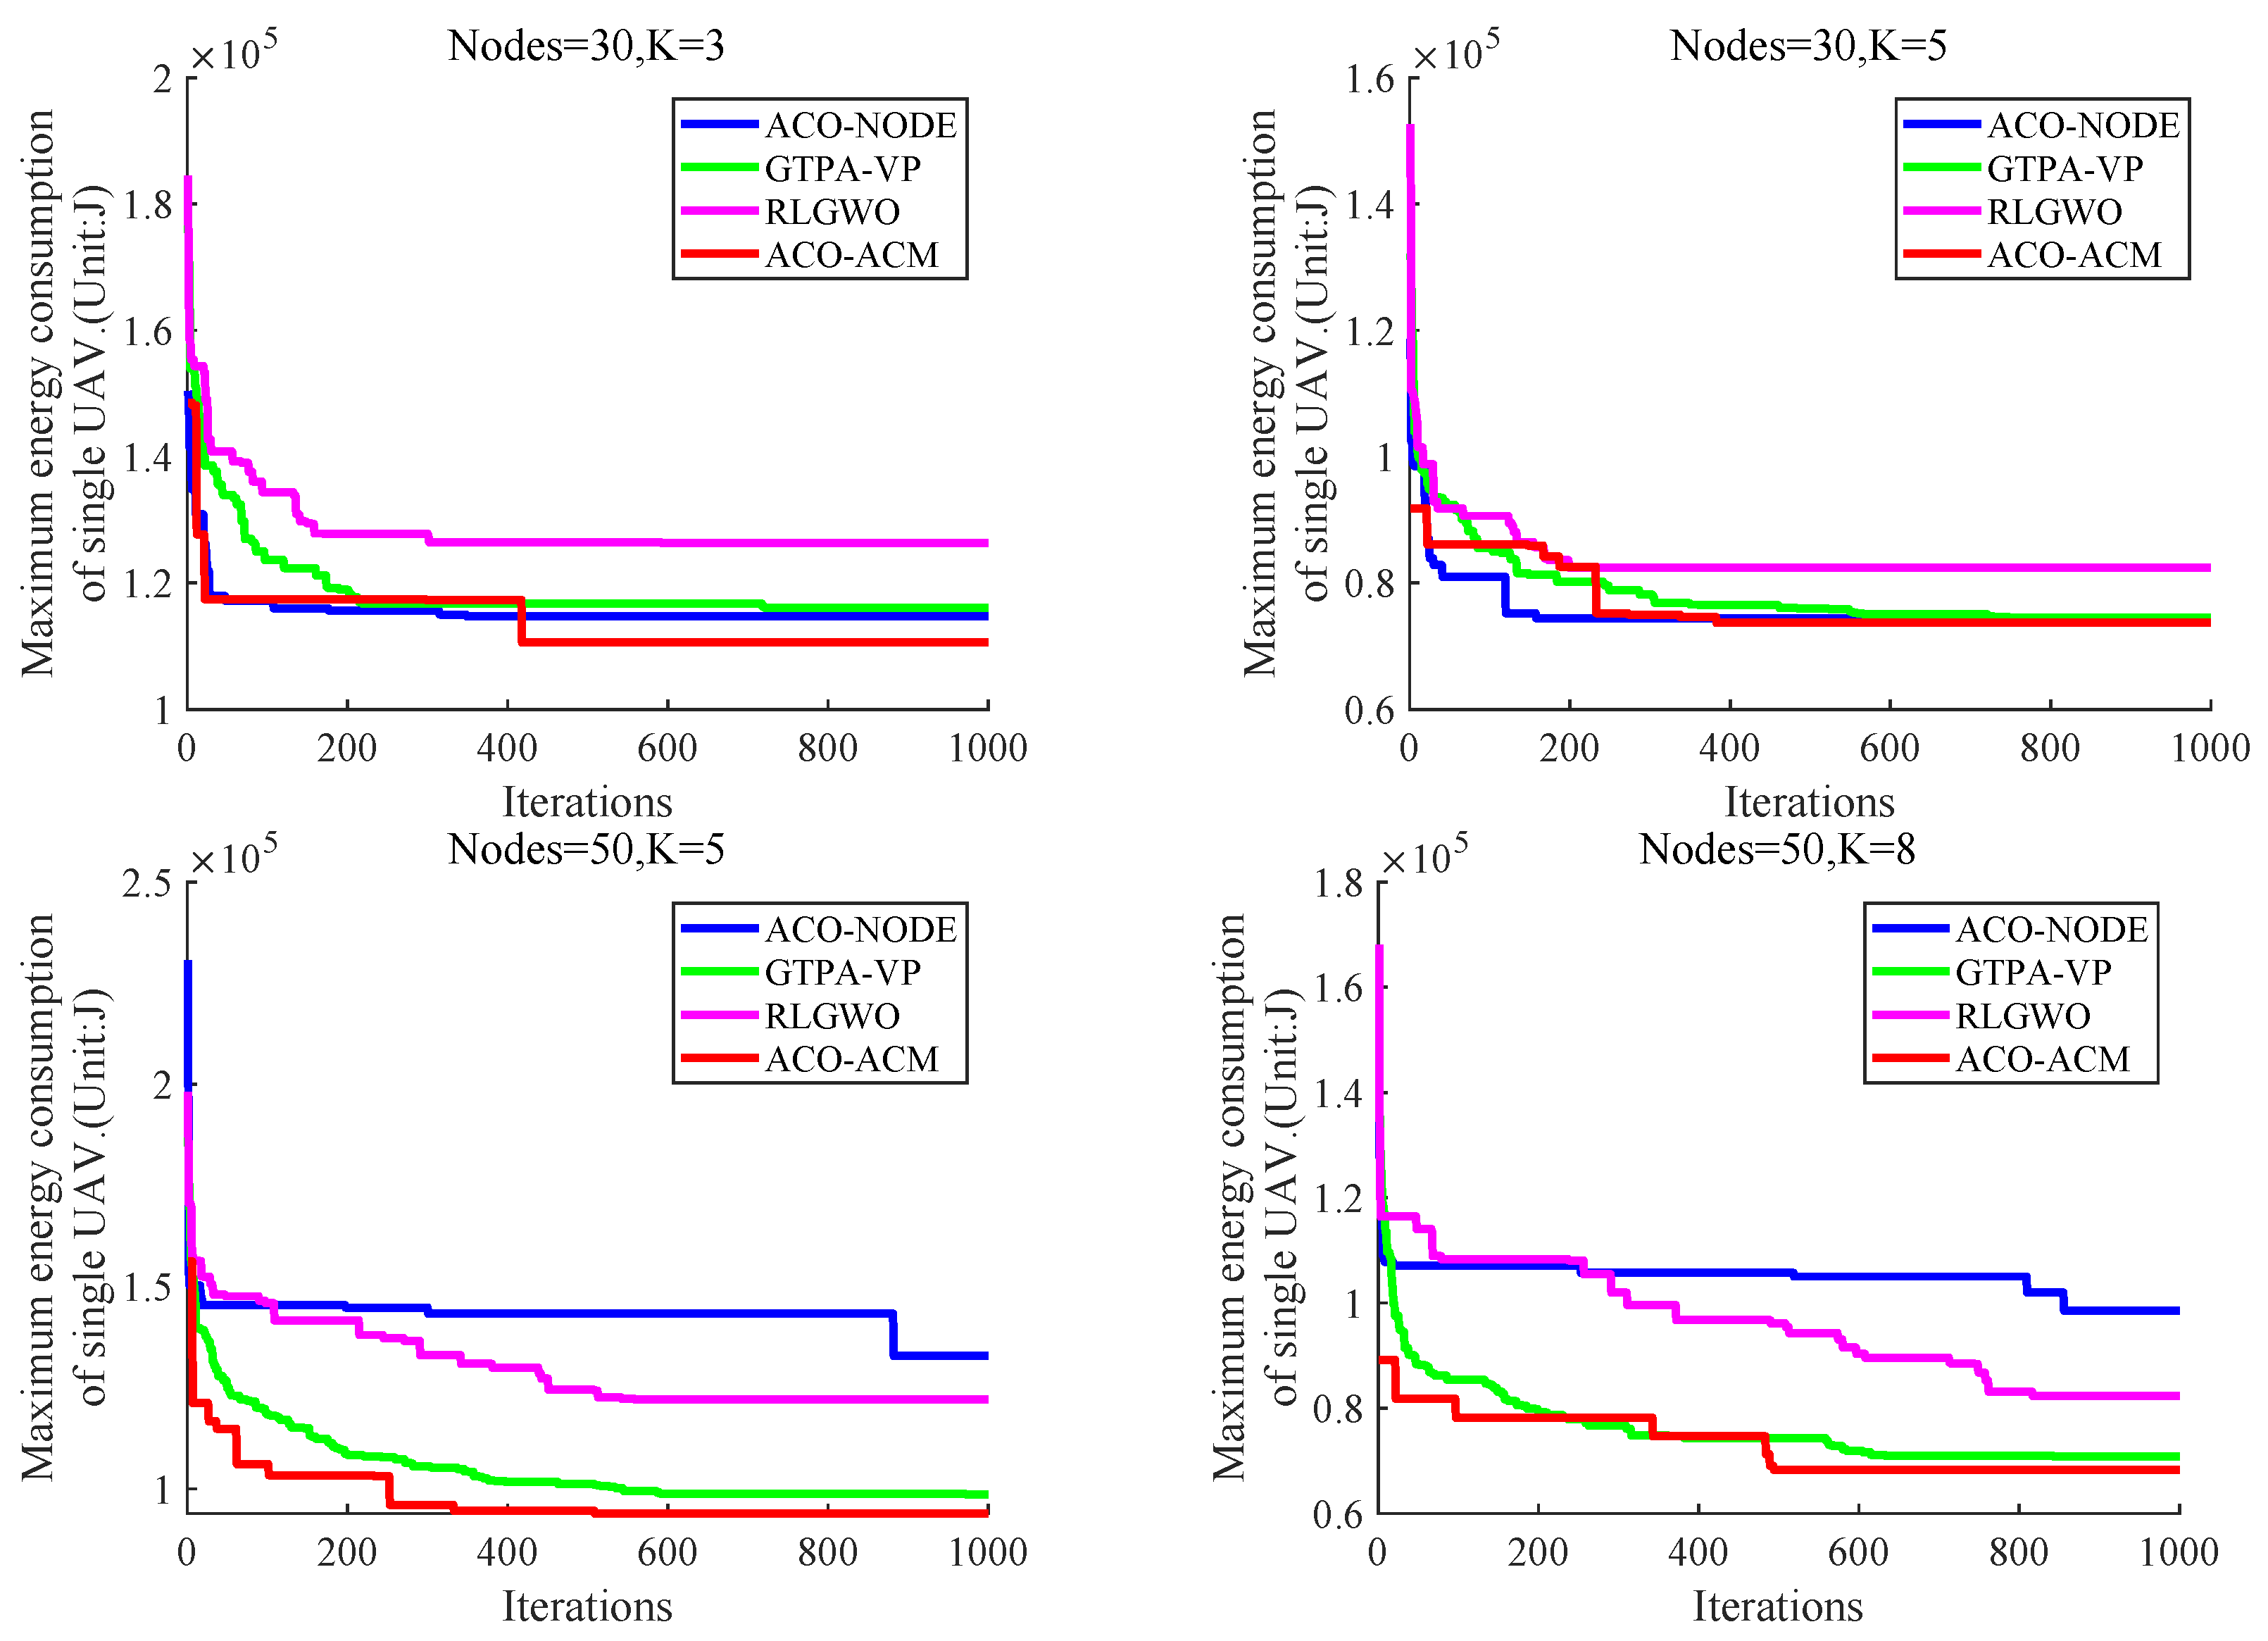
This section compares the proposed algorithm with ACO-NODE, GTPA-VP and RLGWO. The main aim is to explore the superiority of our algorithm in UAV trajectory optimization. Since the speed of the UAV is fixed, the trajectory of the UAV is directly proportional to the energy consumption. To showcase the algorithm’s performance more intuitively, we utilize the maximum energy consumption of a single UAV as the fitness function. In other words, we aim to minimize in Equation (14).
Figure 12 shows the maximum energy consumption of UAVs with different numbers of task nodes and different numbers of UAVs. Since we are considering only one objective, we have abbreviated our algorithm as ACO-ACM. It is evident from Figure 12 that the proposed algorithm is highly competitive in minimizing the maximum energy consumption in a UAV swarm compared to other algorithms. For example, when and in the fourth sub-figure, the maximum energy consumption required for the UAV trajectory optimized by our algorithm is the lowest throughout the entire iteration process.
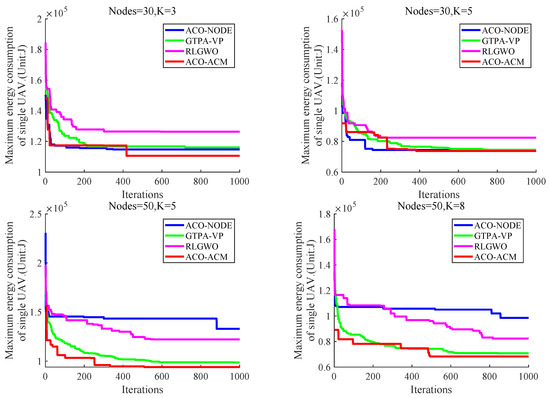
Figure 12.
Comparison of the maximum energy consumption between the proposed algorithm and three other single-objective algorithms.
6.2.2. Multi-Objective Comparison Algorithms
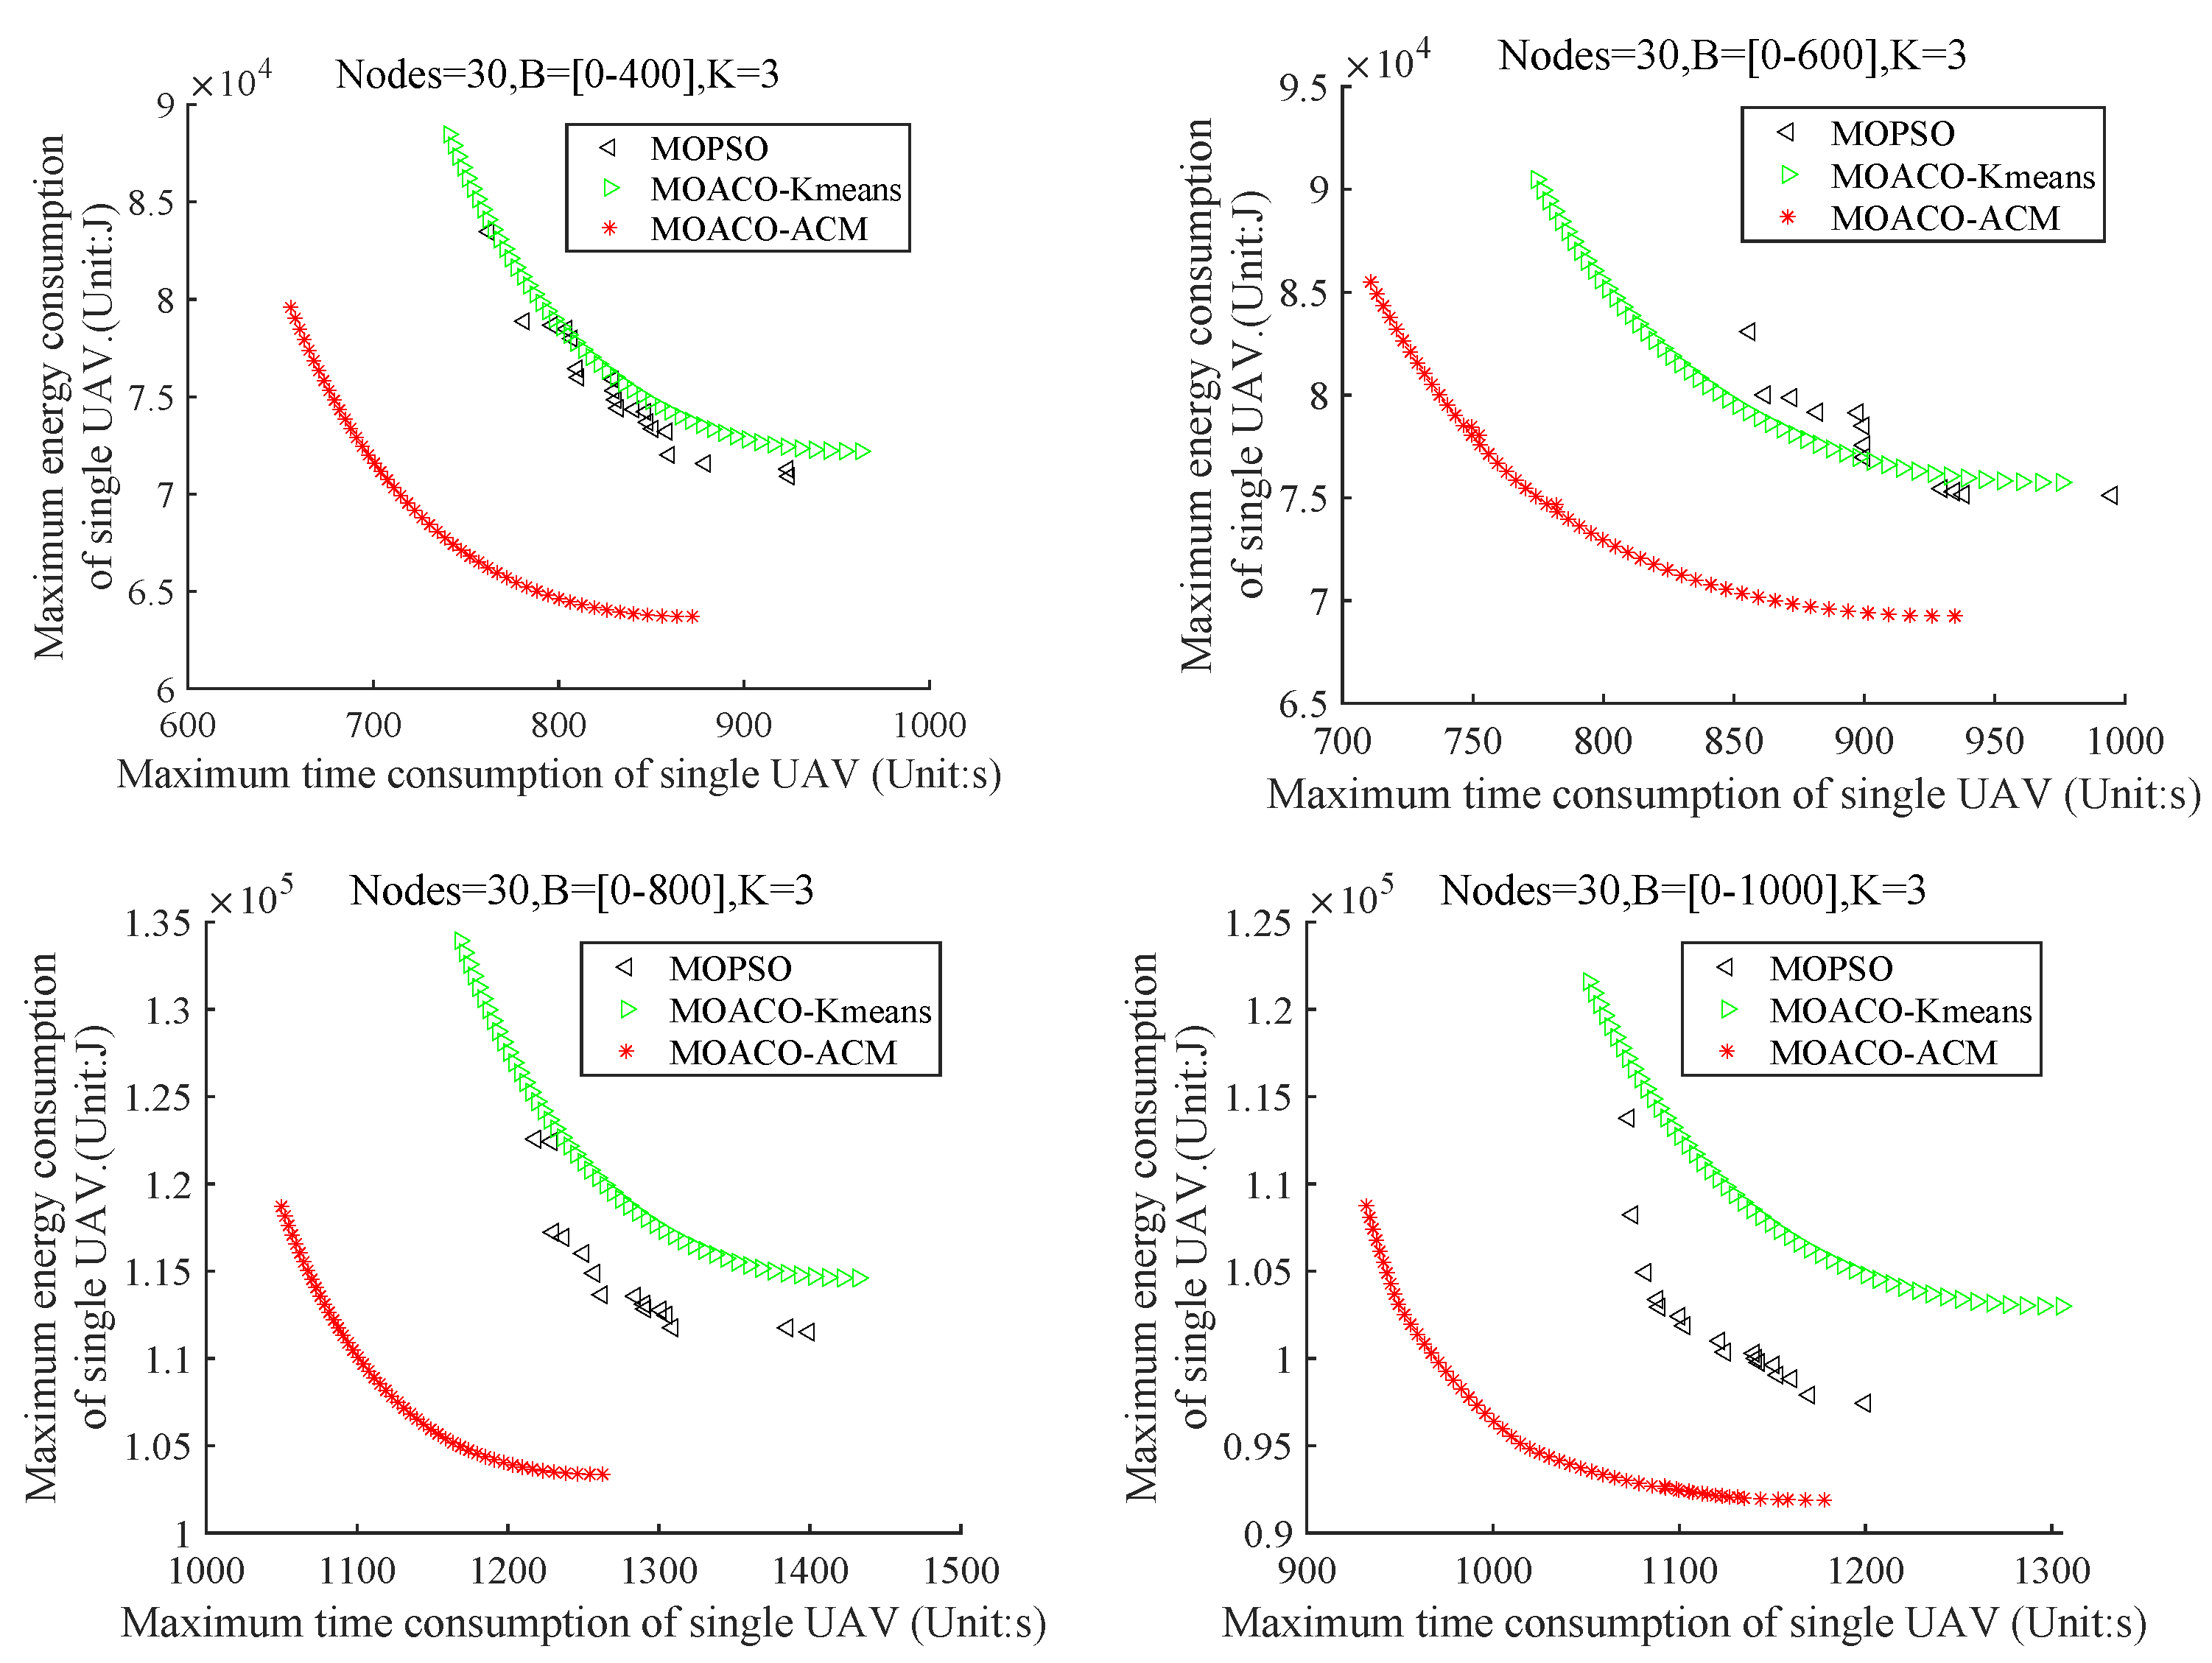
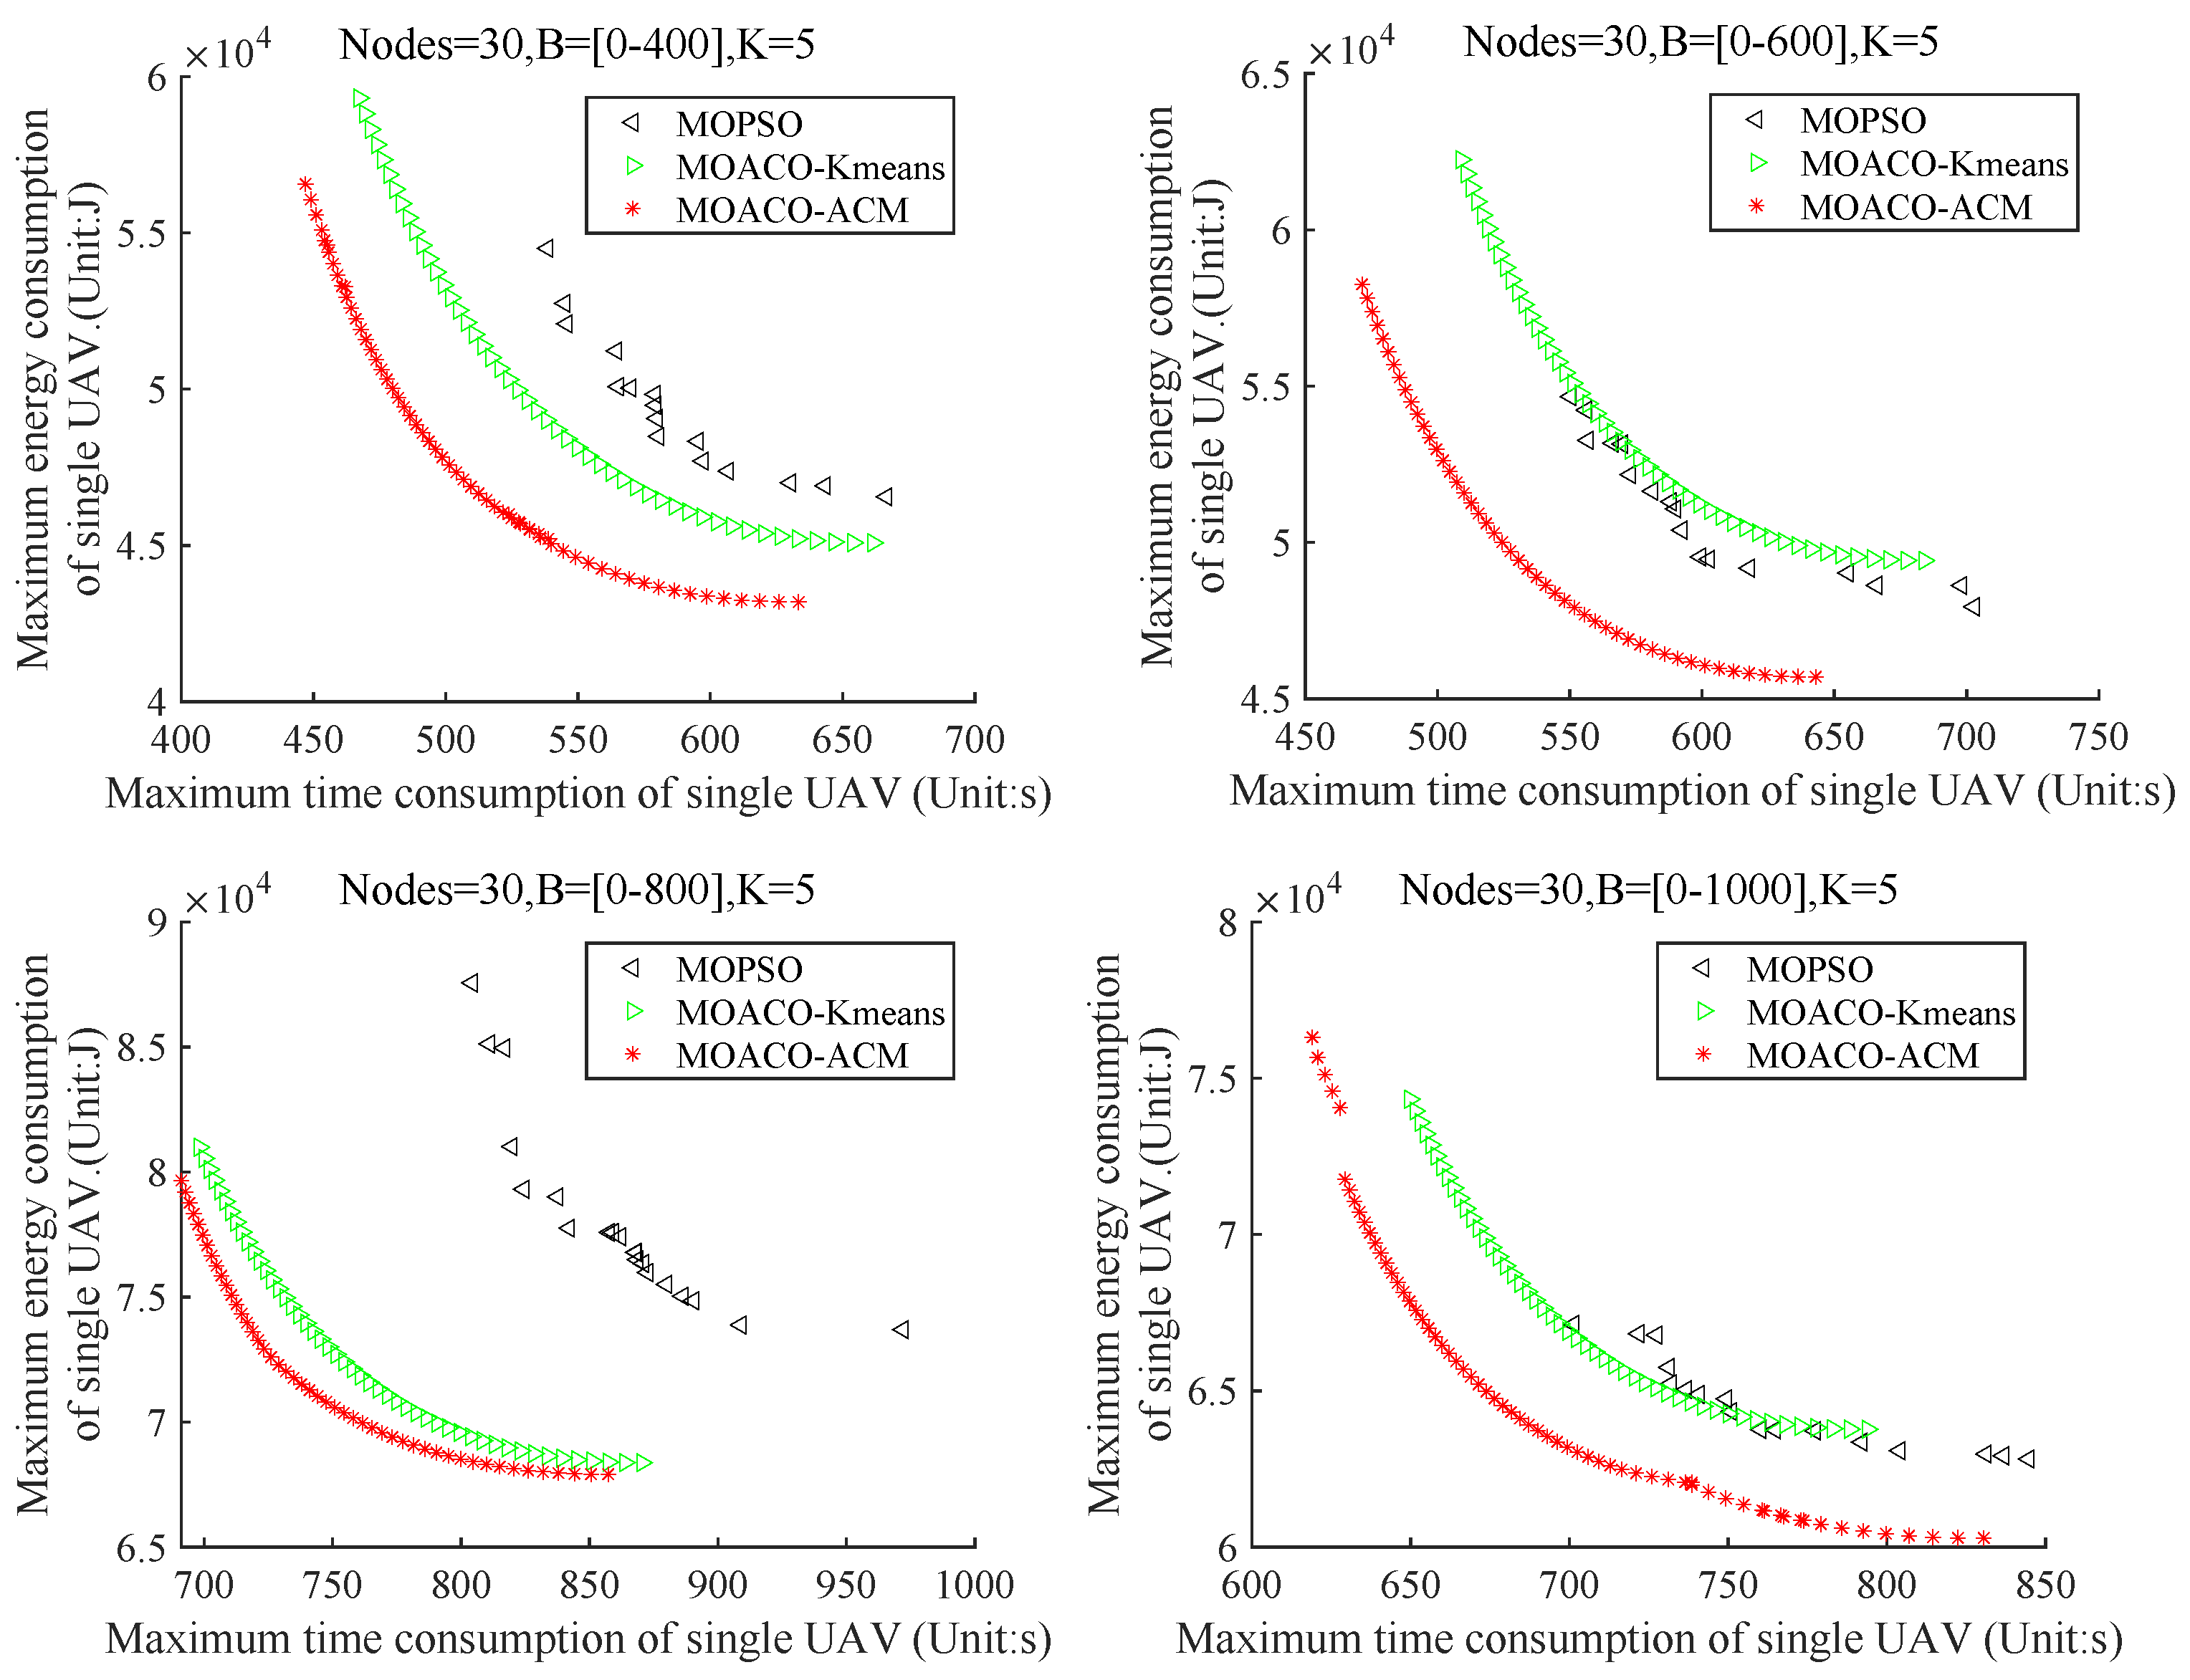
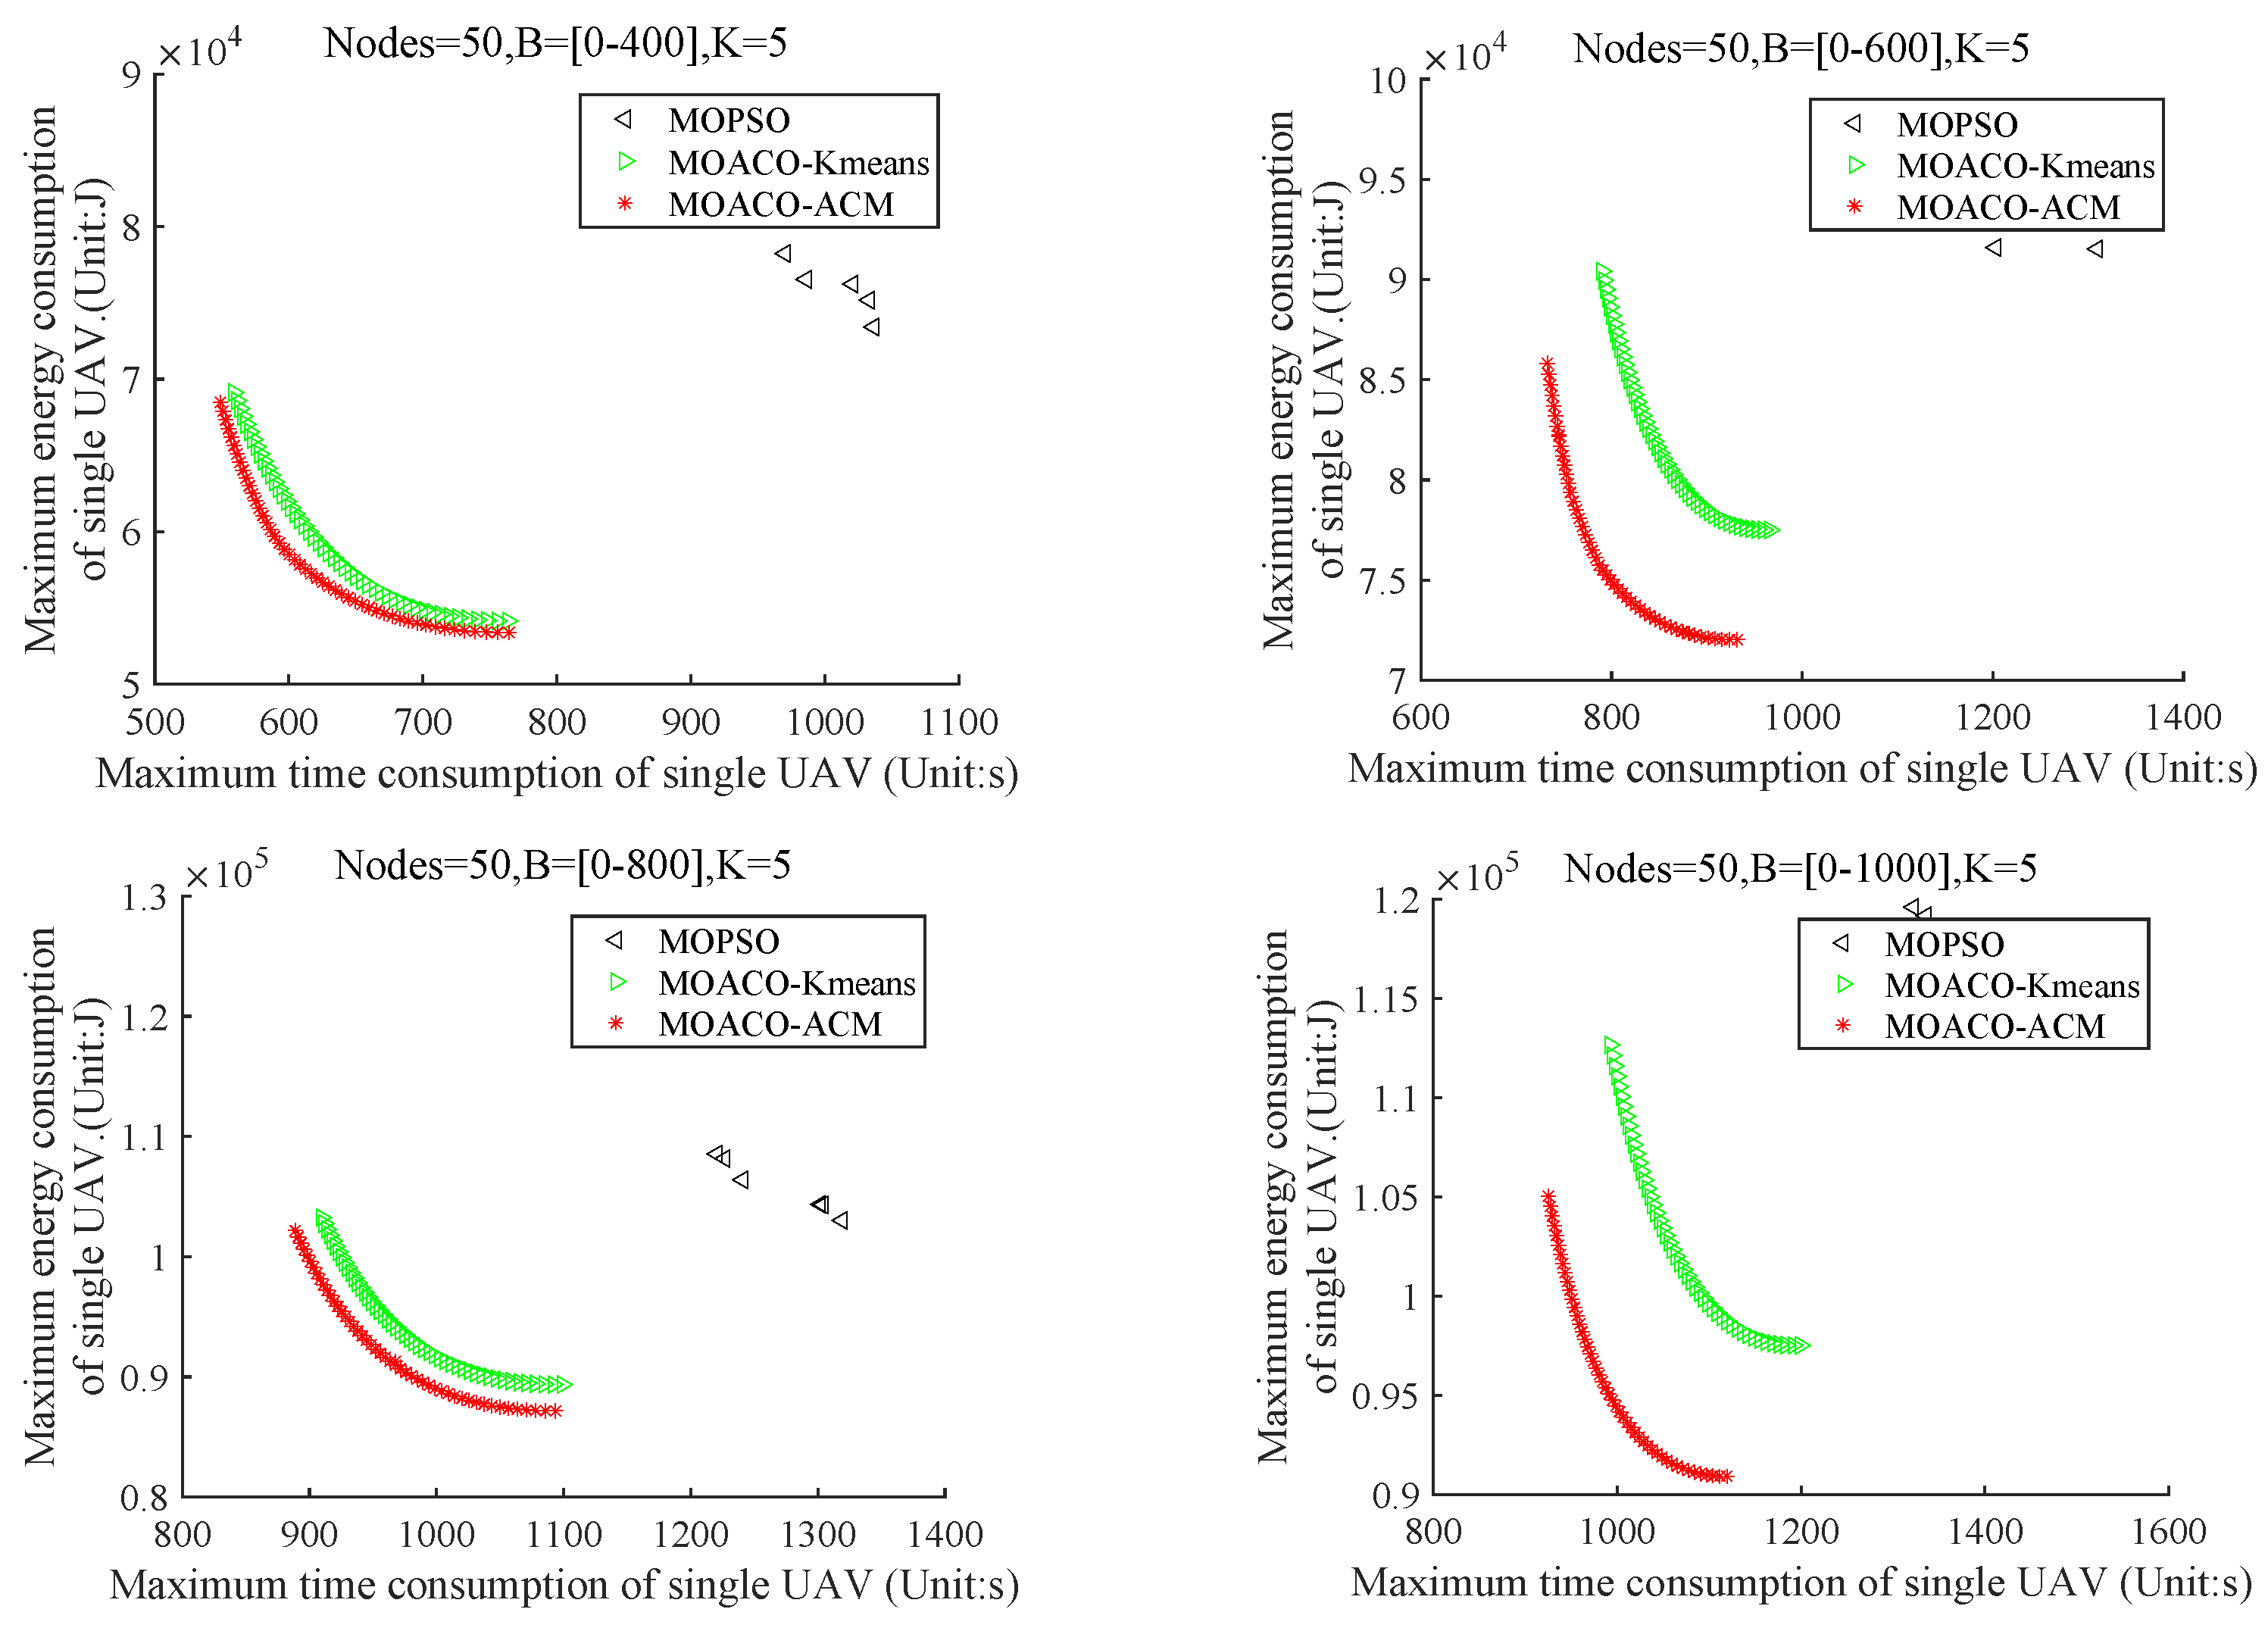
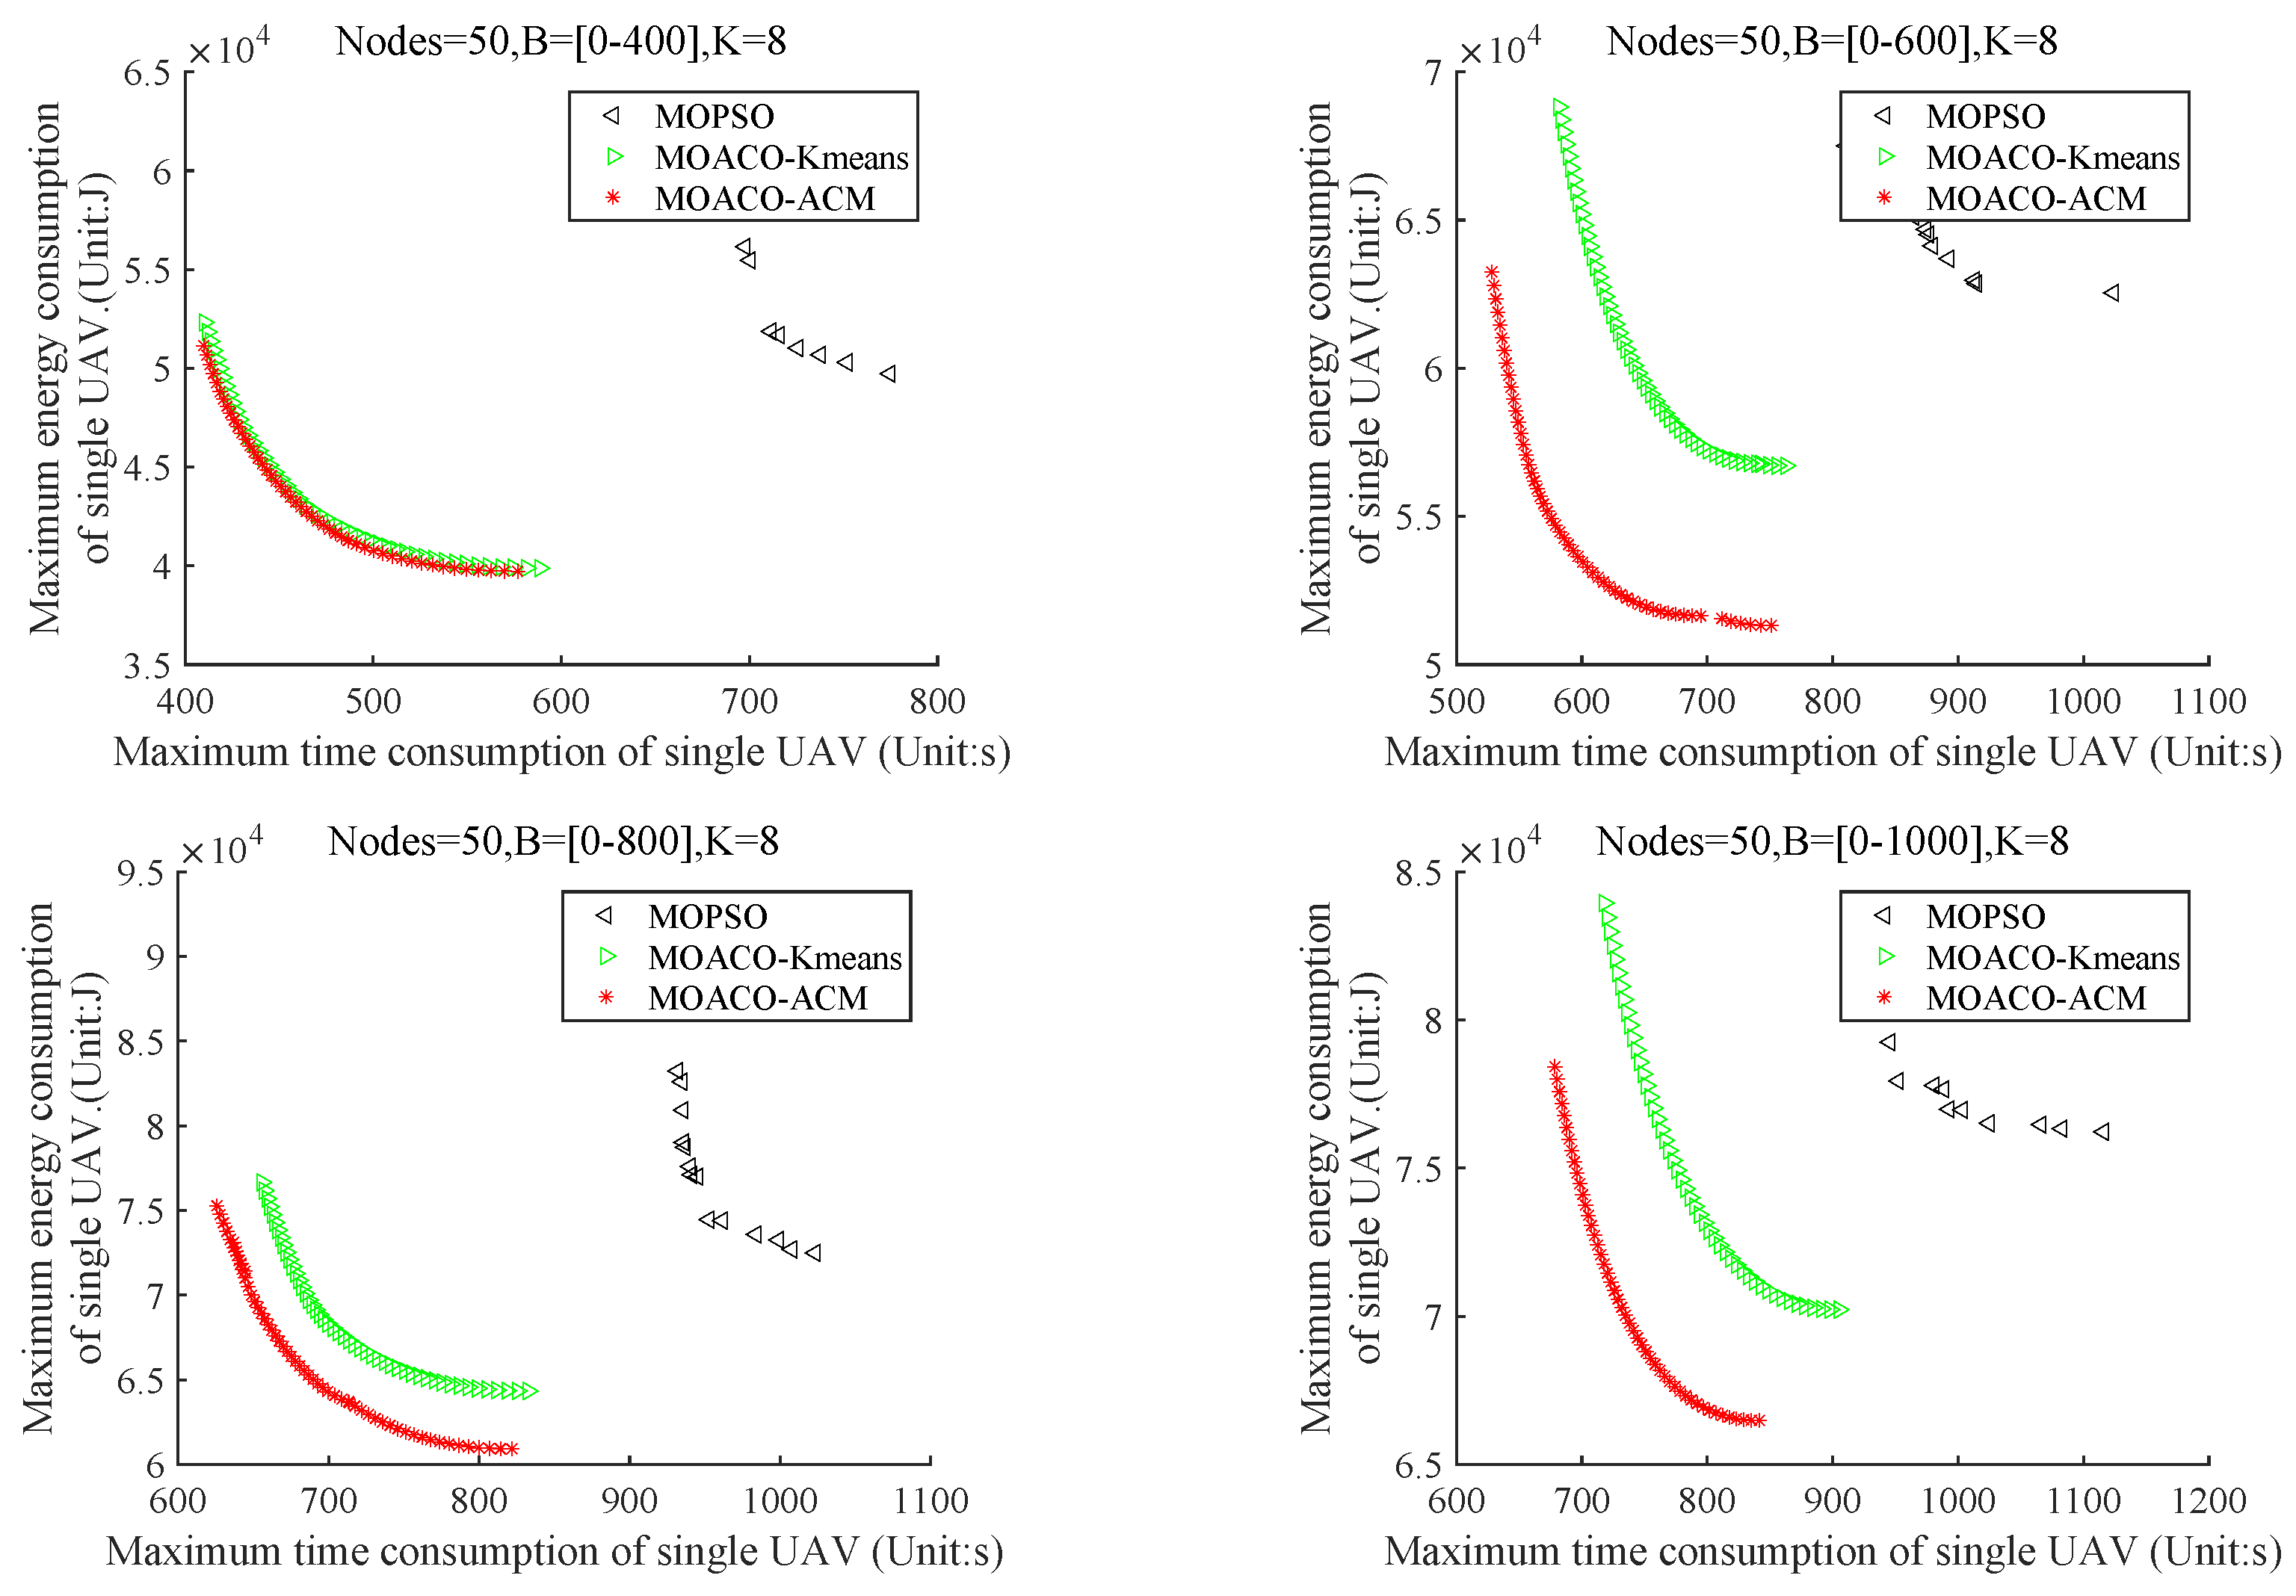
The optimal Pareto front obtained from running all algorithms 30 times under varying conditions such as the number of UAVs, data upload requirements and node numbers for UAVs is displayed in Figure 13, Figure 14, Figure 15 and Figure 16. The horizontal axis represents the maximum time required for a single UAV to complete the task among all UAVs, while the vertical axis represents the maximum energy consumption. The title indicates the number of nodes visited by the UAVs, the amount of data required for communication between nodes, and the number of UAVs involved in the experiment. By comparing algorithms, it was found that the proposed algorithm outperforms the others in minimizing the maximum energy consumption and time of the UAVs. Moreover, we conducted a quantitative analysis of the results of 30 experiments. Table 3, Table 4, Table 5 and Table 6 show the HV evaluation results of all algorithms in 30 independent experiments. The reference point’s setting is determined based on the maximum time and energy consumption required by each UAV to complete the task in the 30 experiments. The last column of Table 3, Table 4, Table 5 and Table 6 displays the HV reference point selection under different scenarios.
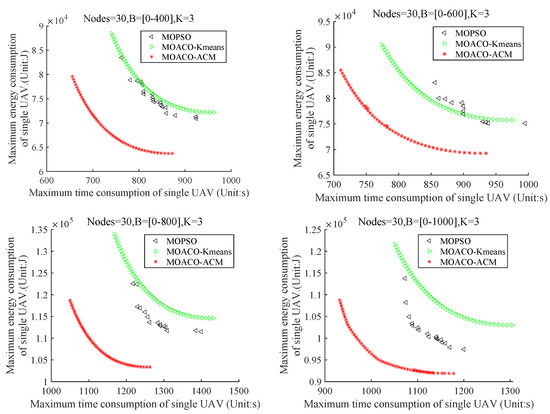
Figure 13.
When Nodes = 30, K = 3, the maximum energy and time consumption of a single UAV.
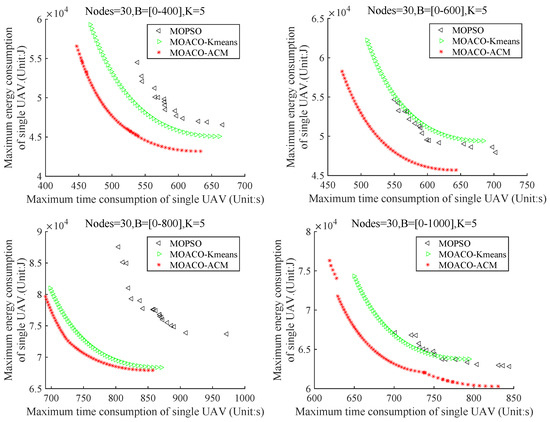
Figure 14.
When Nodes = 30, K = 5, the maximum energy and time consumption of a single UAV.
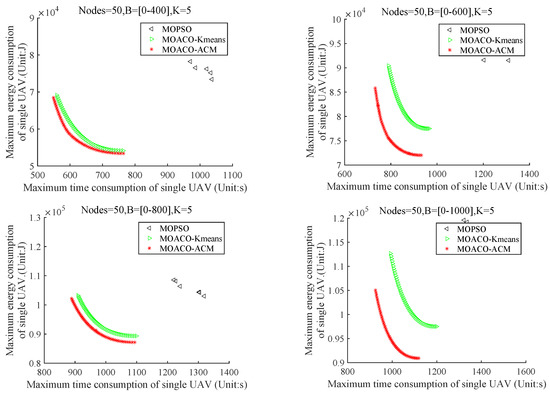
Figure 15.
When Nodes = 50, K = 5, maximum energy and time consumption of a single UAV.
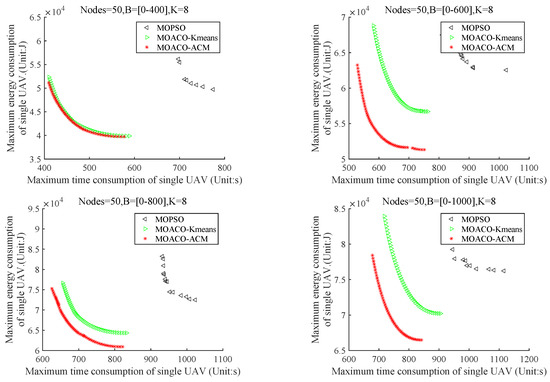
Figure 16.
When Nodes = 50, K = 8, maximum energy and time consumption of a single UAV.

Table 3.
The Supervolume Evaluation Table of 30 Experiments of the Algorithm.

Table 4.
The Supervolume Evaluation Table of 30 Experiments of the Algorithm.

Table 5.
The Supervolume Evaluation Table of 30 Experiments of the Algorithm.

Table 6.
The Supervolume Evaluation Table of 30 Experiments of the Algorithm.
The superiority of the proposed algorithm over other algorithms is evident from Figure 13, Figure 14, Figure 15 and Figure 16. During the exploration phase, the proposed algorithm found more feasible solutions and carried out high-quality local exploration of the solution space. This resulted in achieving a better balance between the convergence and diversity of the population during the search phase. The MOACO-ACM algorithm outperformed both MOPSO and MOACO-Kmeans for several reasons. Firstly, due to the different data-uploading demands, other algorithms cannot properly balance the number and locations of nodes visited by each UAV. Secondly, the two objective functions of task completion time and the maximum energy consumption of a single UAV among all UAVs are related to the nodes visited by each UAV, the flight trajectory of each UAV and the flight speed of each UAV. However, other algorithms do not jointly optimize these factors. Thirdly, when the flight trajectory and flight speed of each UAV are decision variables of a node visited by each UAV, the algorithm easily falls into a local optimum.
In addition, when the data upload requirements of each node change, our algorithm obtains Pareto solutions that are superior to those obtained by other algorithms, and the maximum energy consumption and task completion time of a single UAV continue to increase. When the data-uploading demand of each node is small, the UAV can complete the data acquisition task with only low hover energy consumption and communication energy consumption. In order to visit nodes with larger data-uploading demands, the UAV needs to spend longer hover times above the corresponding nodes, which means that the UAV needs to consume more communication energy and hovering energy to complete the data acquisition task. This makes the hovering, communication energy consumption and flight time of UAV increase with the expansion of data-uploading demands. For example: By observing Table 3, it can be found that when and , the value is about twice that of MOPSO and 1.3 times that of MOACO-Kmeans. At the same time, it can be seen that the standard deviation of HV of our algorithm is the smallest, indicating that the more concentrated the value of our algorithm is, the higher the average representativeness is, and the better the comprehensive performance of the algorithm is. Similar conclusions can also be obtained from Table 4, Table 5 and Table 6.
When , and and 5, respectively, it can be found that our Pareto solution is better than other algorithms, as seen in Figure 13 and Figure 14. When the number of UAVs increases appropriately, the maximum energy consumption of a single UAV and the task completion time gradually decrease, because a UAV only needs to visit some nodes to complete the data acquisition task and does not need to travel between some ground nodes. At the same time, with the increase of the number of UAVs, the diversity of trajectory solutions is expanded, which helps to reduce the energy consumption and flight time of UAVs. By comparing Figure 15 and Figure 16, a similar conclusion can be obtained when the number of UAVs changes from five to eight when . It can be seen from Table 3 and Table 4 that when and the number of UAVs increases from three to five, the HV value of our algorithm is basically reduced by 1.3 times compared with the other two algorithms. It can be seen from Table 5 and Table 6 that when and the number of UAVs increases from five to eight, our evaluation index value is about three times that of MOPSO and higher than that of MOACO-Kmeans.
As can be seen from Figure 14 and Figure 15, when the number of nodes is different, our Pareto solution is superior to other algorithms, because when the number of UAVs is fixed, the energy consumption and flight time of UAVs will increase with the increase of nodes to be visited. This is because the number of UAVs is fixed, but they need to visit more ground nodes in turn to complete the system data acquisition task, which means that the UAV may have to fly longer distances, which also consumes more flight energy and longer task completion time. In addition, as the number of ground nodes increases, UAVs need to spend more hovering energy consumption and communication energy consumption. Therefore, the more ground nodes, the larger energy consumption and the longer task completion time. By comparing Table 4 and Table 5, it can be seen that when B = [0–400] and the number of nodes changes from 30 to 50, the value of our algorithm and MOACO-Kmeans is about four times the original value and the value of MOPSO is twice the original value.
7. Conclusions
In this work, the optimal energy and delay tradeoff in multi-UAV enabled WSNs was studied. The energy consumption model of rotary-wing UAV during a data acquisition task was analyzed. On this basis, the maximum energy consumption of a single UAV among all UAVs and the task completion time were both minimized. Firstly, we proposed an adaptive coordinate method to optimize the nodes to be visited by each UAV. Secondly, the ant colony optimization algorithm was applied to plan the trajectory of each UAV. Finally, we set different uniform speeds to optimize the Pareto front for achieving the optimal tradeoff between the maximum energy consumption of a single UAV and the task completion time. Numerical results validated the effectiveness of the proposed MOACO-ACM algorithm and reveal the importance of flight speed in achieving both the time-efficient and energy-efficient data collection.
Although the proposed method discusses many real-life situations, there are still some deficiencies. For instance, several factors in real life can affect UAV flight, such as weather conditions, UAV flying altitude, battery power attenuation, and others. Therefore, in the future, we can aim to simulate the actual situation more accurately by considering acceleration and deceleration scenarios, incorporating local wind speeds, and so on.
Author Contributions
Conceptualization, R.J. and J.X.; Methodology, J.X. and Q.F.; Writing—original draft preparation, J.X. and Q.F.; Writing—review and editing, R.J. and M.L.; Resources, F.L. and Z.Z.; Supervision, R.J.; Funding acquisition, R.J., M.L., F.L. and Z.Z. All authors have read and agreed to the published version of the manuscript.
Funding
This work was supported in part by the National Natural Science Foundation of China under Grant 62272417.
Data Availability Statement
Not applicable.
Conflicts of Interest
The authors declare no conflict of interest.
References
- Zeng, Y.; Wu, Q.; Zhang, R. Accessing from the sky: A tutorial on UAV communications for 5G and beyond. Proc. IEEE 2019, 107, 2327–2375. [Google Scholar] [CrossRef]
- Zeng, Y.; Zhang, R.; Lim, T.J. Wireless communications with unmanned aerial vehicles: Opportunities and challenges. IEEE Commun. Mag. 2016, 54, 36–42. [Google Scholar] [CrossRef]
- Li, X.; Wang, Q.; Liu, Y.; Tsiftsis, T.A.; Ding, Z.; Nallanathan, A. UAV-aided multi-way NOMA networks with residual hardware impairments. IEEE Wirel. Commun. Lett. 2020, 9, 1538–1542. [Google Scholar] [CrossRef]
- Do, D.T.; Nguyen, T.T.T.; Le, C.B.; Voznak, M.; Kaleem, Z.; Rabie, K.M. UAV relaying enabled NOMA network with hybrid duplexing and multiple antennas. IEEE Access 2020, 8, 186993–187007. [Google Scholar] [CrossRef]
- Hayat, S.; Yanmaz, E.; Muzaffar, R. Survey on unmanned aerial vehicle networks for civil applications: A communications viewpoint. IEEE Commun. Surv. Tutorials 2016, 18, 2624–2661. [Google Scholar] [CrossRef]
- Erdelj, M.; Natalizio, E.; Chowdhury, K.R.; Akyildiz, I.F. Help from the sky: Leveraging UAVs for disaster management. IEEE Pervasive Comput. 2017, 16, 24–32. [Google Scholar] [CrossRef]
- Li, S.; Duo, B.; Yuan, X.; Liang, Y.C.; Di Renzo, M. Reconfigurable intelligent surface assisted UAV communication: Joint trajectory design and passive beamforming. IEEE Wirel. Commun. Lett. 2020, 9, 716–720. [Google Scholar] [CrossRef]
- Li, S.; Duo, B.; Di Renzo, M.; Tao, M.; Yuan, X. Robust secure UAV communications with the aid of reconfigurable intelligent surfaces. IEEE Trans. Wirel. Commun. 2021, 20, 6402–6417. [Google Scholar] [CrossRef]
- Gupta, L.; Jain, R.; Vaszkun, G. Survey of important issues in UAV communication networks. IEEE Commun. Surv. Tutorials 2015, 18, 1123–1152. [Google Scholar] [CrossRef]
- Ngu, A.H.; Gutierrez, M.; Metsis, V.; Nepal, S.; Sheng, Q.Z. IoT middleware: A survey on issues and enabling technologies. IEEE Int. Things J. 2016, 4, 1–20. [Google Scholar] [CrossRef]
- Yan, H.; Chen, Y.; Yang, S.H. UAV-enabled wireless power transfer with base station charging and UAV power consumption. IEEE Trans. Veh. Technol. 2020, 69, 12883–12896. [Google Scholar] [CrossRef]
- Mozaffari, M.; Saad, W.; Bennis, M.; Debbah, M. Mobile Internet of Things: Can UAVs provide an energy-efficient mobile architecture? In Proceedings of the 2016 IEEE Global Communications Conference (GLOBECOM), IEEE, Washington, DC, USA, 4–8 December 2016; pp. 1–6. [Google Scholar]
- Zhan, C.; Zeng, Y.; Zhang, R. Energy-efficient data collection in UAV enabled wireless sensor network. IEEE Wirel. Commun. Lett. 2017, 7, 328–331. [Google Scholar] [CrossRef]
- Lyu, J.; Zeng, Y.; Zhang, R. Cyclical multiple access in UAV-aided communications: A throughput-delay tradeoff. IEEE Wirel. Commun. Lett. 2016, 5, 600–603. [Google Scholar] [CrossRef]
- Zhan, C.; Zeng, Y.; Zhang, R. Trajectory design for distributed estimation in UAV-enabled wireless sensor network. IEEE Trans. Veh. Technol. 2018, 67, 10155–10159. [Google Scholar] [CrossRef]
- Xu, J.; Zeng, Y.; Zhang, R. UAV-enabled wireless power transfer: Trajectory design and energy optimization. IEEE Trans. Wirel. Commun. 2018, 17, 5092–5106. [Google Scholar] [CrossRef]
- Zeng, Y.; Xu, J.; Zhang, R. Energy minimization for wireless communication with rotary-wing UAV. IEEE Trans. Wirel. Commun. 2019, 18, 2329–2345. [Google Scholar] [CrossRef]
- Ren, H.; Zhang, Z.; Peng, Z.; Li, L.; Pan, C. Energy minimization in RIS-assisted UAV-enabled wireless power transfer systems. IEEE Int. Things J. 2022, 10, 5794–5809. [Google Scholar] [CrossRef]
- Zeng, Y.; Xu, X.; Zhang, R. Trajectory design for completion time minimization in UAV-enabled multicasting. IEEE Trans. Wirel. Commun. 2018, 17, 2233–2246. [Google Scholar] [CrossRef]
- Li, J.; Zhao, H.; Wang, H.; Gu, F.; Wei, J.; Yin, H.; Ren, B. Joint optimization on trajectory, altitude, velocity, and link scheduling for minimum mission time in UAV-aided data collection. IEEE Int. Things J. 2019, 7, 1464–1475. [Google Scholar] [CrossRef]
- Zhan, C.; Zeng, Y. Completion time minimization for multi-UAV-enabled data collection. IEEE Trans. Wirel. Commun. 2019, 18, 4859–4872. [Google Scholar] [CrossRef]
- Shan, F.; Luo, J.; Xiong, R.; Wu, W.; Li, J. Looking before crossing: An optimal algorithm to minimize UAV energy by speed scheduling with a practical flight energy model. In Proceedings of the IEEE INFOCOM 2020-IEEE Conference on Computer Communications, IEEE, Toronto, ON, Canada, 6–9 July 2020; pp. 1758–1767. [Google Scholar]
- Zhang, S.; Cao, R.; Jiang, Z. Energy-Efficient Data Collection and Trajectory Design for UAV-Enabled Wireless Sensor Network. In Proceedings of the 2022 IEEE 5th International Conference on Electronics Technology (ICET), IEEE, Chengdu, China, 13–16 May 2022; pp. 933–938. [Google Scholar]
- Dai, X.; Duo, B.; Yuan, X.; Tang, W. Energy-Efficient UAV Communications: A Generalized Propulsion Energy Consumption Model. IEEE Wirel. Commun. Lett. 2022, 11, 2150–2154. [Google Scholar] [CrossRef]
- Yang, D.; Wu, Q.; Zeng, Y.; Zhang, R. Energy tradeoff in ground-to-UAV communication via trajectory design. IEEE Trans. Veh. Technol. 2018, 67, 6721–6726. [Google Scholar] [CrossRef]
- Zeng, Y.; Zhang, R. Energy-efficient UAV communication with trajectory optimization. IEEE Trans. Wirel. Commun. 2017, 16, 3747–3760. [Google Scholar] [CrossRef]
- Zhu, K.; Xu, X.; Han, S. Energy-efficient UAV trajectory planning for data collection and computation in mMTC networks. In Proceedings of the 2018 IEEE Globecom Workshops (GC Wkshps), IEEE, Abu Dhabi, UAE, 9–13 December 2018; pp. 1–6. [Google Scholar]
- Tao, Q.; Su, G.; Chen, B.; Dai, M.; Lin, X.; Wang, H. Secrecy Energy Efficiency Maximization for UAV Enabled Communication Systems. In Proceedings of the 2021 30th Wireless and Optical Communications Conference (WOCC), IEEE, Taipei, Taiwan, 7–8 October 2021; pp. 240–244. [Google Scholar]
- Sun, C.; Xiong, X.; Ni, W.; Wang, X. Three-Dimensional Trajectory Design for Energy-Efficient UAV-Assisted Data Collection. In Proceedings of the ICC 2022-IEEE International Conference on Communications, IEEE, Rome, Italy, 28 May–1 June 2022; pp. 3580–3585. [Google Scholar]
- Zhan, C.; Hu, H.; Sui, X.; Liu, Z.; Niyato, D. Completion time and energy optimization in the UAV-enabled mobile-edge computing system. IEEE Int. Things J. 2020, 7, 7808–7822. [Google Scholar] [CrossRef]
- Jin, C.; Wang, J.; Tang, Q.; Li, F. Wireless Powered Collaborative UAV-Enabled Mobile Edge Computing for the weighted time and energy minimization. In Proceedings of the 2021 IEEE Region 10 Symposium (TENSYMP), IEEE, Jeju, Republic of Korea, 23–25 August 2021; pp. 1–5. [Google Scholar]
- Luo, Y.; Xu, Y.; Zhang, T. Completion Time Minimization for Content Delivery in Cache-Enabled UAV Networks. In Proceedings of the 2021 Computing, Communications and IoT Applications (ComComAp), IEEE, Shenzhen, China, 26–28 November 2021; pp. 268–273. [Google Scholar]
- Wang, H.; Wang, J.; Ding, G.; Chen, J.; Yang, J. Completion time minimization for turning angle-constrained UAV-to-UAV communications. IEEE Trans. Veh. Technol. 2020, 69, 4569–4574. [Google Scholar] [CrossRef]
- Zhu, G.; Guo, L.; Dong, C.; Mu, X. Mission time minimization for multi-UAV-enabled data collection with interference. In Proceedings of the 2021 IEEE Wireless Communications and Networking Conference (WCNC), IEEE, Nanjing, China, 29 March–1 April 2021; pp. 1–6. [Google Scholar]
- Gong, J.; Chang, T.H.; Shen, C.; Chen, X. Flight time minimization of UAV for data collection over wireless sensor networks. IEEE J. Sel. Areas Commun. 2018, 36, 1942–1954. [Google Scholar] [CrossRef]
- Zong, J.; Shen, C.; Cheng, J.; Gong, J.; Chang, T.H.; Chen, L.; Ai, B. Flight time minimization via UAV’s trajectory design for ground sensor data collection. In Proceedings of the 2019 16th International Symposium on Wireless Communication Systems (ISWCS), IEEE, Oulu, Finland, 27–30 August 2019; pp. 255–259. [Google Scholar]
- Hellaoui, H.; Bagaa, M.; Chelli, A.; Taleb, T.; Yang, B. On Supporting Multi-Services in UAV-Enabled Aerial Communication for the Internet of Things. IEEE Int. Things J. 2023; Early Access. [Google Scholar] [CrossRef]
- Perez-Carabaza, S.; Besada-Portas, E.; Lopez-Orozco, J.A.; de la Cruz, J.M. Ant colony optimization for multi-UAV minimum time search in uncertain domains. Appl. Soft Comput. 2018, 62, 789–806. [Google Scholar] [CrossRef]
- Asim, M.; Mashwani, W.K.; Belhaouari, S.B.; Hassan, S. A novel genetic trajectory planning algorithm with variable population size for multi-UAV-assisted mobile edge computing system. IEEE Access 2021, 9, 125569–125579. [Google Scholar] [CrossRef]
- Qu, C.; Gai, W.; Zhong, M.; Zhang, J. A novel reinforcement learning based grey wolf optimizer algorithm for unmanned aerial vehicles (UAVs) path planning. Appl. Soft Comput. 2020, 89, 106099. [Google Scholar] [CrossRef]
- Bertran, E.; Sànchez-Cerdà, A. On the tradeoff between electrical power consumption and flight performance in fixed-wing UAV autopilots. IEEE Trans. Veh. Technol. 2016, 65, 8832–8840. [Google Scholar] [CrossRef]
- Thibbotuwawa, A.; Nielsen, P.; Zbigniew, B.; Bocewicz, G. Factors affecting energy consumption of unmanned aerial vehicles: An analysis of how energy consumption changes in relation to UAV routing. In Proceedings of 39th International Conference on Information Systems Architecture and Technology–ISAT 2018: Part II; Springer: Berlin/Heidelberg, Germany, 2019; pp. 228–238. [Google Scholar]
- Yang, X.S.; Deb, S. Cuckoo search via Lévy flights. In Proceedings of the 2009 World congress on nature & biologically inspired computing (NaBIC), IEEE, Coimbatore, India, 9–11 December 2009; pp. 210–214. [Google Scholar]
- MarcoDorigoaLuc, M. Ant colonies for the traveling salesman problem. Biosystems 1997, 43, 73–81. [Google Scholar]
- Golberg, D.E. Genetic algorithms in search, optimization, and machine learning. Addion Wesley 1989, 1989, 36. [Google Scholar]
- Storn, R.; Price, K. Differential evolution-a simple and efficient heuristic for global optimization over continuous spaces. J. Glob. Optim. 1997, 11, 341. [Google Scholar] [CrossRef]
- Kennedy, J.; Eberhart, R. Particle swarm optimization. In Proceedings of the ICNN’95-International Conference on Neural Networks, IEEE, Perth, WA, USA, 27 November–1 December 1995; Volume 4, pp. 1942–1948. [Google Scholar]
- Laporte, G. The traveling salesman problem: An overview of exact and approximate algorithms. Eur. J. Oper. Res. 1992, 59, 231–247. [Google Scholar] [CrossRef]
- Kolo, T.; Fanggidae, A. Analisis Metode Cycle Crossover (Cx) Dan Metode Partial Mapped Crossover (Pmx) Pada Penyelesaian Kasus Traveling Salesman Problem (Tsp). J-ICON J. Komput. Dan Inform. 2019, 7, 61–66. [Google Scholar]
- Lloyd, S. Least squares quantization in PCM. IEEE Trans. Inf. Theory 1982, 28, 129–137. [Google Scholar] [CrossRef]
- Nouri-Moghaddam, B.; Ghazanfari, M.; Fathian, M. A novel multi-objective forest optimization algorithm for wrapper feature selection. Expert Syst. Appl. 2021, 175, 114737. [Google Scholar] [CrossRef]
Disclaimer/Publisher’s Note: The statements, opinions and data contained in all publications are solely those of the individual author(s) and contributor(s) and not of MDPI and/or the editor(s). MDPI and/or the editor(s) disclaim responsibility for any injury to people or property resulting from any ideas, methods, instructions or products referred to in the content. |
© 2023 by the authors. Licensee MDPI, Basel, Switzerland. This article is an open access article distributed under the terms and conditions of the Creative Commons Attribution (CC BY) license (https://creativecommons.org/licenses/by/4.0/).

