Article

Flight Test Analysis of UTM Conflict Detection Based on a Network Remote ID Using a Random Forest Algorithm

1
Department of Power Mechanical Engineering, National Formosa University, Huwei 632301, Taiwan
2
Department of Aeronautical Engineering, National Formosa University, Huwei 632301, Taiwan
3
Taiwan Transportation Safety Board, New Taipei City 231, Taiwan
*
Author to whom correspondence should be addressed.
Drones 2023, 7(7), 436; https://doi.org/10.3390/drones7070436
Submission received: 1 June 2023 / Revised: 28 June 2023 / Accepted: 28 June 2023 / Published: 30 June 2023
(This article belongs to the Section Innovative Urban Mobility)

Abstract

:
In an area where unmanned aerial system (UAS) traffic is high, a conflict detection system is one of the important components for the safety of UAS operations. A novel UAS traffic management (UTM) monitoring application was developed, including a conflict detection system using the inverted teardrop area detection based on real-time flight data transmitted from the network remote identification (Remote ID) modules. This research aimed to analyze the performance of the UTM-monitoring application based on flight test data using statistical and machine learning approaches. The flight tests were conducted using several types of small fixed-wing unmanned aerial vehicles (UAVs) controlled by a human pilot using a Taiwan cellular communication network in suburban and rural areas. Two types of scenarios that involved a stationary, on-the-ground intruder and a flying intruder were used to simulate a conflict event. Besides the statistical method calculating the mean and standard deviation, the random forest algorithm, including regressor and classifier modules, was used to analyze the flight parameters and timing parameters of the flight tests. The result indicates that the processing time of the UTM application was the most significant parameter to the conflict warning parameter, besides the relative distance and height between UAVs. In addition, the latency time was higher for the flight in the rural area than the suburban area and also higher for data transmitted from the flying position than the ground position. The findings of our study can be used as a reference for aviation authorities and other stakeholders in the development of future UTM systems.

1. Introduction

Beyond visual line of sight (BVLOS) operation of an unmanned aerial system (UAS) is one of the key factors to obtaining the full benefits of a UAS business. Examples of BVLOS operations are UAS cargo delivery, environmental monitoring, and surveillance.
UAS-based cargo delivery has several advantages over conventional vehicles, including a constant and high travel speed, no need for physical road infrastructure, directness of travel, and no exposure to traffic and congestion. This logistics system is preferable for the emerging market of e-commerce in an urban area and emergency medical supply in a rural area where the companies and customers benefit from saving time and cost. However, safety and privacy issues regarding UAV-based logistics are the main barrier to this application [1].
A UAS can also be used for environmental monitoring with mounted sensors to measure the conditions of environmental parameters, such as water, air, electromagnetic, light, and heat [2]. For example, this remote sensing application could be used for a risk assessment of the rising temperature effect on certain locations, especially on their populations [3]. Furthermore, a machine learning technique can be used to improve the detection of environmental conditions based on images captured from a UAV flight [4].
Another popular application of UAVs is surveillance. This application has a wide range of users from travelers, hobbyists, news reporters, security officers, and military personnel. The point of view of UAVs that humans have never been able to experience becomes one of the advantages, besides being scalable and flexible with more comprehensive surveillance coverage. However, this application also encounters several challenges, such as limited processing and power resources, and disturbance in transmission signals [5,6].
These UAS applications and operations will require a UAS traffic management (UTM) system that maintains the safety level and monitors the traffic situation and communicates the information to all the stakeholders on the ground. Cellular communication is one of the proposed communication channels to be used in the UTM system.
In an area where UAS traffic is high, conflict detection is crucial to maintain the safety level of UAS operations. The conflict is defined as “an event in which two or more aircraft experience a loss of minimum separation” [7]. Conflict detection can be classified into two types, which are strategic and tactical conflict detection. The strategic aim is that a planned UAS trajectory must be free of all known conflicts in 4-dimensional space prior to the departure. Strategic detection may be applied using trajectory- or volume-based representation of operations, while tactical detection involves a separation service that helps the UAV to avoid near-term conflicts during flight. Tactical conflict detection may take the form of a real-time sense and avoidance system that reacts to UAV traffic in the vicinity. This system could be deployed over the network, onboard the UAV, or a combination of both [8].
It is predicted that the current aviation communication channel is not suitable for UTM purposes where a higher degree of automation is expected. The new communication channel could allow machine learning and artificial intelligence to be involved in the decision-making of future UTM systems. However, safety- and risk-based evaluations must be carefully conducted as part of the certification process. Thus, machine learning techniques could be implemented at the strategic level first [8]. An example of these techniques is a deep reinforced learning algorithm to assist the UAV in avoiding static or moving obstacles during flight [9] and a random forest algorithm to detect and classify objects from images captured by the UAV [10].
There was some research conducted to solve this issue. Based on the literature found that analyzed UTM conflict detection by conducting a flight test, there were three categories of communication architectures in conflict detection, which were vehicle-to-ground (V2G), vehicle-to-vehicle (V2V), and mixed V2G and V2V architecture.

1.1. Vehicle-to-Ground (V2G) Communication

V2G conflict detection employs data received by a ground station to detect the conflict between UAVs. Most V2G-based conflict detections used automatic dependence surveillance–broadcast (ADS-B)-like technology as their communication combined with other communication, such as telemetry, radar, and a cellular network [11,12,13]. However, other research used only telemetry for transmitting data to a ground station [14,15].
National Aeronautics and Space Administration (NASA) used an ADS-B module from uAvionix hardware attached to Da-Jiang Innovations (DJI) Phantom 4 UAVs combined with DJI telemetry to demonstrate the UTM conflict detection application. The demonstration parameters, such as position, speed, direction, altitude, and produced resolution advice, were evaluated [11]. Similarly, Oklahoma State University conducted V2G conflict detection with Vigilant’s FlightHorizon software using ADS-B from intruder Cessna aircraft combined with telemetry from several UAVs (DJI Phantom 4, DJI M600, MakeFlyEasy Believer, Foxtech Nimbus, STRIX Stratosurfer) and ground radar. This test focused on the range of detection [12]. Another ADS-B-based UTM conflict detection combined with cellular network communication was conducted by Universität der Bundeswehr München using two DJI Matrice UAVs in simulated controlled airspace. This test measured the cellular network performance including the data trip time, signal-to-noise ratio (SNR), and bit rate [13].
NASA also conducted non-ADS-B V2G conflict detection using telemetry and dedicated short-range radio channel (DSRC) communication. This test aimed to evaluate the detection range and to enable a transition from the extended visual line of sight (EVLOS) to BVLOS operations using a commercial octocopter outfitted with a Pixhawk autopilot [14]. The other flight test using telemetry in UTM conflict detection was conducted by Nanyang Technological University, Singapore. The test used DJI Mavic 2 Zoom and a DJI Inspire 1 UAS to evaluate separation requirements in urban airspace [15].

1.2. Vehicle-to-Vehicle (V2V) Communication

Unlike V2G, V2V conflict detection relies on the data received by UAVs in flight to detect the conflict between UAVs. Most of the V2V-based conflict detection in small UAVs used vision technology due to its light weight and simplicity [16,17,18]. However, other technologies were also used, such as ADS-B, radar, flight alarm (FLARM), DSRC, and telemetry [19,20,21,22,23,24].
NASA conducted a flight test to fuse image differencing and morphological filtering detections using Kalman-based object tracking. The test evaluated several types of true detection and detection accuracy using two types of flight encounters: multi-copter sUAS (DJI S1000) vs. fixed-wing sUAS (Tempest N533NU) and multi-copter sUAS (DJI S1000) vs. general aviation (Cirrus SR22) aircraft [16]. Other research at National Cheng Kung University, Taiwan, used a monocular camera to estimate the distance from an incoming UAV using a deep learning approach. The flight test employed the Sky Surfer fixed-wing UAV as an intruder and a quadcopter as a host [17]. Similar to the NASA flight test, which involved UAV and general aviation (GA) aircraft, Oklahoma State University investigated onboard collision avoidance systems using computer vision and machine learning. The test examined the ability of the camera onboard a Nimbus fixed-wing UAV to detect GA aircraft (Cirrus SR20, Piper PA-44-180, Cessna C-172, Cessna C-152) and then performed the necessary avoidance maneuvers. The result was a high-level detection in combination with ADS-B for triggering capabilities [18].
Other NASA flight tests in V2V conflict detection using ADS-B were performed to detect potential conflicts with other aircraft and autonomously maneuver to avoid collisions. Two types of flight tests were conducted involving UAS-to-UAS encounters (DJI S1000 octocopter as the host and the Tempest UAV as the intruder) and UAS-to-GA aircraft encounters (the intruder was a Cirrus SR-22) [19]. Other research in collaboration with Virginia Polytechnic Institute and State University and NASA evaluated onboard radar on a DJI Inspire 2 quadcopter to support minimum requirements for sense and avoid (SAA) applications of an sUAS [20]. Furthermore, NASA conducted flight tests to demonstrate the use of onboard autonomy-enabling technologies in scenarios where a non-conforming UAS flies through. The test used a flight alarm (FLARM) system and involved two DJI S-1000 Octocopters and two UAV America Eagle Octocopters [21]. Similar to NASA using the FLARM system, the University of Lisbon Portugal conducted a flight test to measure its behavior in a noisy environment and its usefulness in flight. It tested a collision between a DJI F450 and a Uavision UX-Spyro [22].
The University of North Texas conducted a flight test with two UASs equipped with DSRC radios to assess the functionality, capabilities, and limitations of DSRC-based V2V detection. The test used DJI Matrice UAVs that were capable of exchanging their position data [23]. The last paper on V2V conflict detection was written by the National Institute of Aerospace in collaboration with NASA. The test aimed to validate the distributed consensus-based merging algorithm with a robust communication link, such as telemetry and a cellular network. The test involved a DJI S1000 Octocopter [24].

1.3. Mixed V2G and V2V Communication

Besides research on V2G- or V2V-based conflict detection, there was some research that combined V2G and V2V conflict detection. The Federal Aviation Administration (FAA) and its industry partners formed a team to integrate the detect and avoid (DAA) systems featuring the Airborne Collision Avoidance System (ACAS) Xu logic. The system is embedded in onboard UAS vehicle platforms and a ground-based cloud environment in a UTM service supplier (USS) platform. It used ADS-B as V2V and V2G communication with the addition of radar in V2G conflict detection. The test involved a Bushmaster UAV equipped with GE Aviation’s low SWaP avionics computer and a manned intruder Piper Cherokee aircraft [25]. The last publication on combined V2G and V2V came from a NASA test flight to demonstrate and evaluate a set of technologies and an over-arching air-ground system concept aimed at enabling the safety of UTM operations. The research UAV was tracked continuously via the DSRC communication channel during nominal planned flight paths while autonomously operating over moderately populated land. In some flights, off-nominal risks were simulated, such as V2V encounters [26].
Based on other literature found, analyzing the effect of data latency and flight parameters for UAS conflict detection is a research area that has not been fully explored yet. In this research, a flight test using UTM conflict detection based on the network’s remote identification (Remote ID) communication is conducted. The present study endeavored to analyze the flight test outcomes of the UTM monitoring system, focusing on communication latency, flight parameters, and their consequential impacts on system performance. Statistical and machine learning methodologies were employed for this analysis. The distinctive contributions of our research lie in the utilization of network Remote ID for the development of a UTM monitoring system, as well as the introduction of a novel conflict detection algorithm based on an inverted teardrop shape. This manuscript contains the UTM monitoring description, including the conflict detection algorithm in Section 2, the flight test setup to validate the conflict detection in Section 3, the flight test results and analysis in Section 4, and the conclusion in Section 5.

2. UTM Monitoring Framework

This section explains the concept of a UTM monitoring system, including the network Remote ID, conflict detection algorithm, flight data measurement, and machine learning algorithm used for analysis.

2.1. Network Remote ID

A network Remote ID is one of the features in the Remote ID specification that transmits UAV information via an internet protocol. Its standard is established in the American Society for Testing and Materials (ASTM) F3411-19 document [27], but not included in Federal Aviation Regulation (FAR) 89 due to some objections from the public [28]. The transmitted information includes a unique ID as its identification that can be traced to the UAV and its operator. The other information is flight parameters, such as position, height, and speed, that can be used for UTM monitoring.
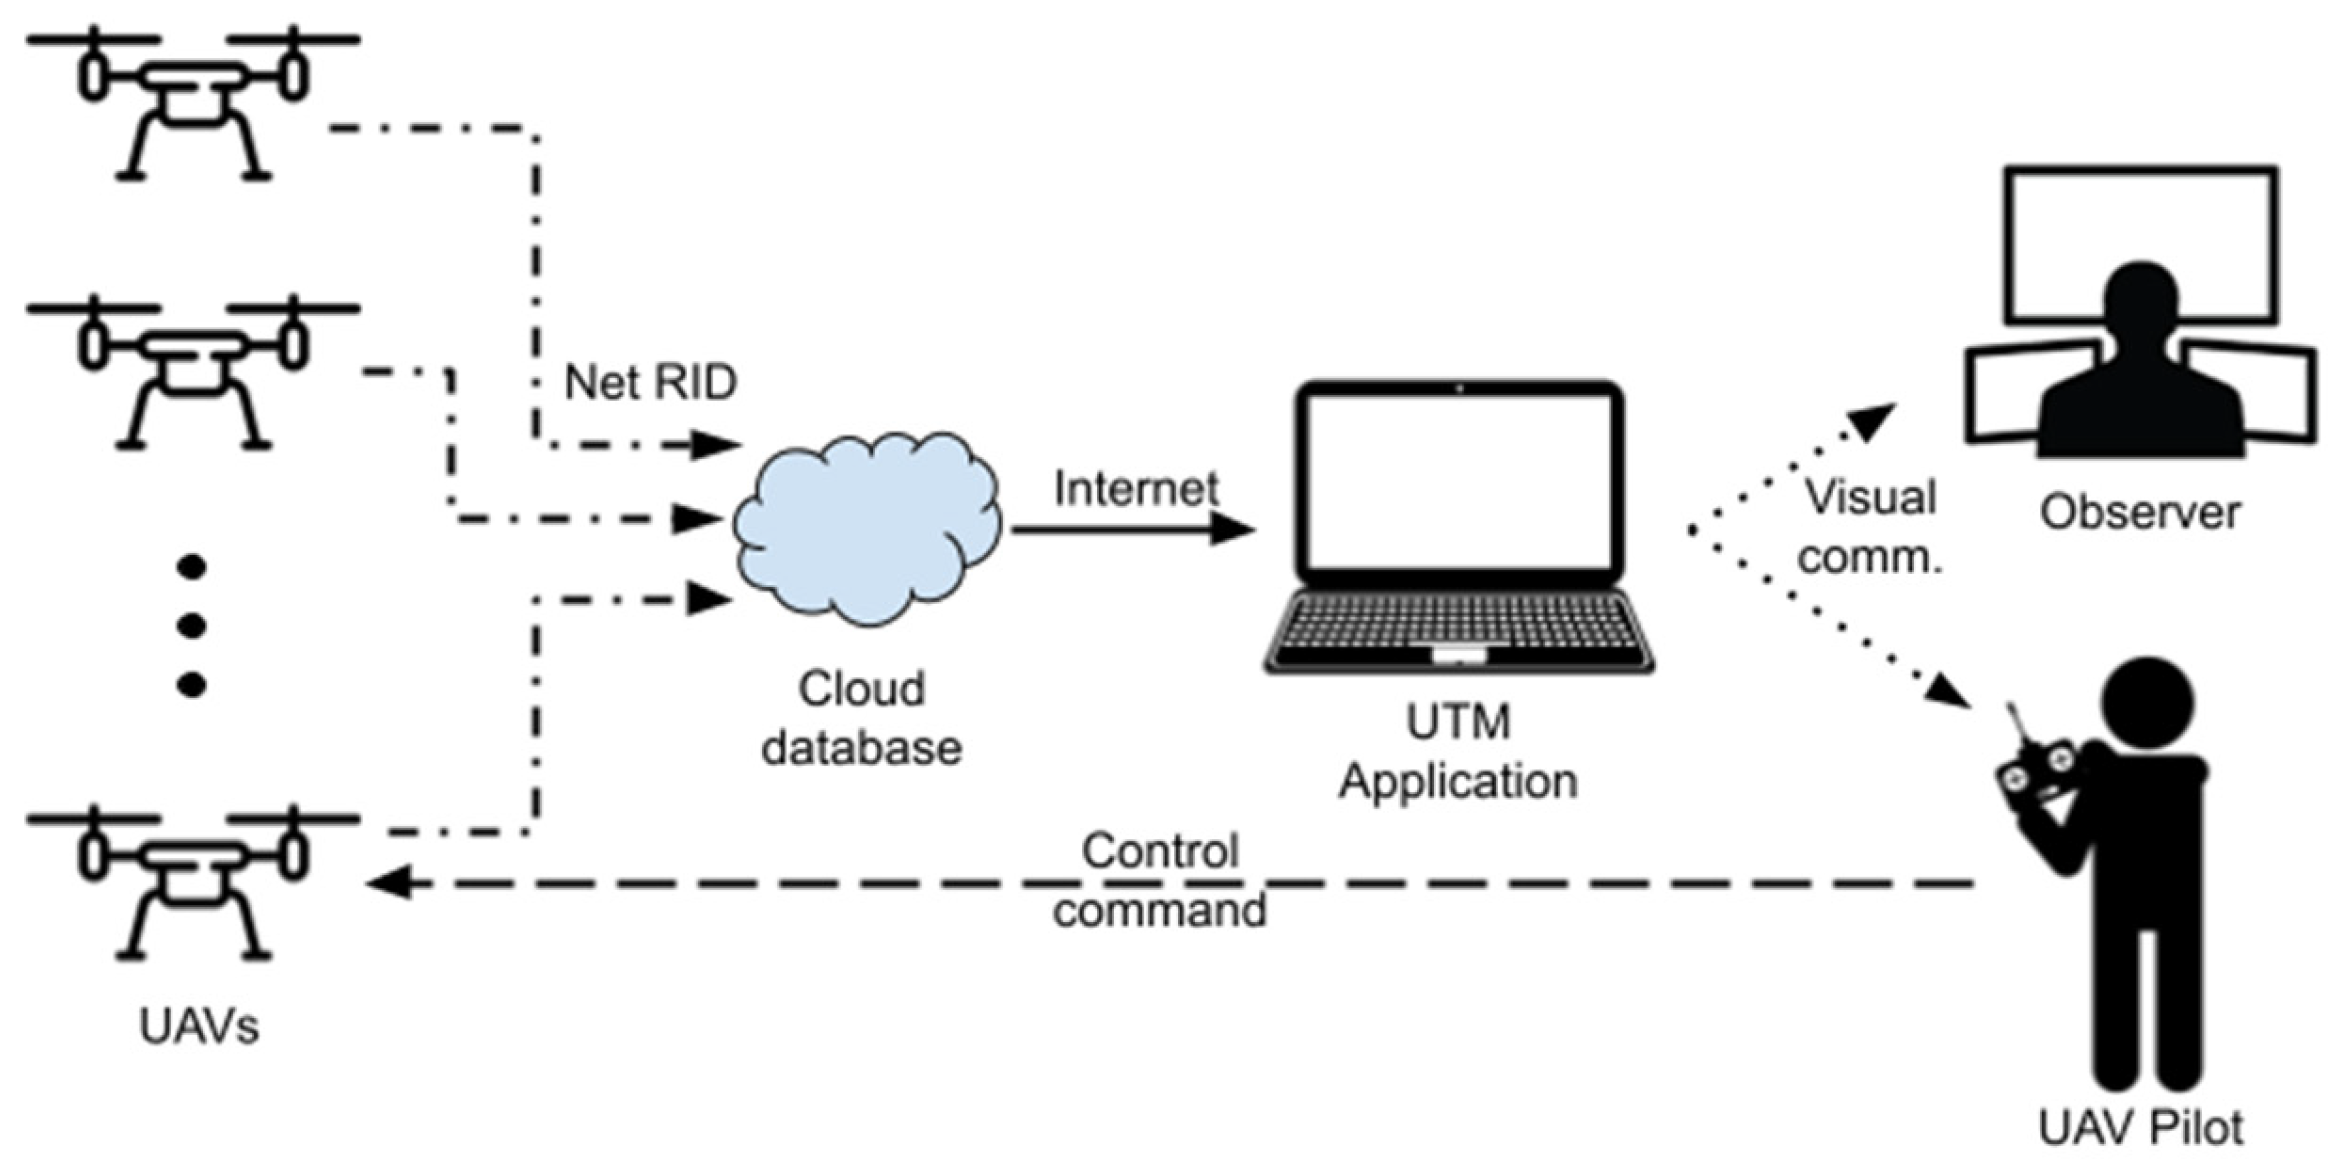
There are two types of service providers involved in this data transmission, which are the network Remote ID service providers and network Remote ID display providers, as shown in Figure 1. The network Remote ID service providers develop the hardware in the UAV that transmits the information and the cloud database to receive the transmitted information. The hardware could be a built-in module as part of UAV components or an add-on module that is not part of the UAV. The network Remote ID display providers develop an application for the user to visualize the UAV information collected in the cloud database. Conflict detection monitoring can be developed as a feature in the network Remote ID display provider. Especially for UAS operators, this feature is very important for their safe operation.

2.2. Conflict Detection Algorithm

The inverted teardrop shape algorithm for UAS conflict detection in 3D space was used in this research. It employs a new shape of a teardrop as the horizontal detection area with the sharp edge pointing toward the direction of the UAV flight movement, as shown in Figure 2. However, the inner near-collision area still used a circle shape. The teardrop shape gives two advantages, which are providing a larger buffer area in UAV movement and allowing a higher traffic capacity.
The radius of the near-collision circle is based on the research from MIT Lincoln Laboratory (MIT LL) and the John Hopkins University Applied Physics Laboratory (JHU APL) [29,30,31] as 50 ft or 15 m plus the horizontal accuracy from the GNSS system. This fixed separation concept was demonstrated successfully in an Airborne Collision Avoidance System for a small UAS (ACAS sXu) system to mitigate the likelihood of a loss of separation. While the teardrop round shape was selected to be 3 times the near-collision circle with an assumption that the near-collision circle was equal to the average distance of the UAV traveled in 1 s plus another 2 s to allow for the UAV to react to and avoid the conflict.
The sharp edge of the teardrop shape has a distance of two times the circle radius of the round shape. This distance definition is based on the proportionality of a teardrop shape that produces a larger buffer area at a 120° wide angle in front of its movement direction. This 120° angle is the same as the maximum horizontal binocular vision of a human [32].
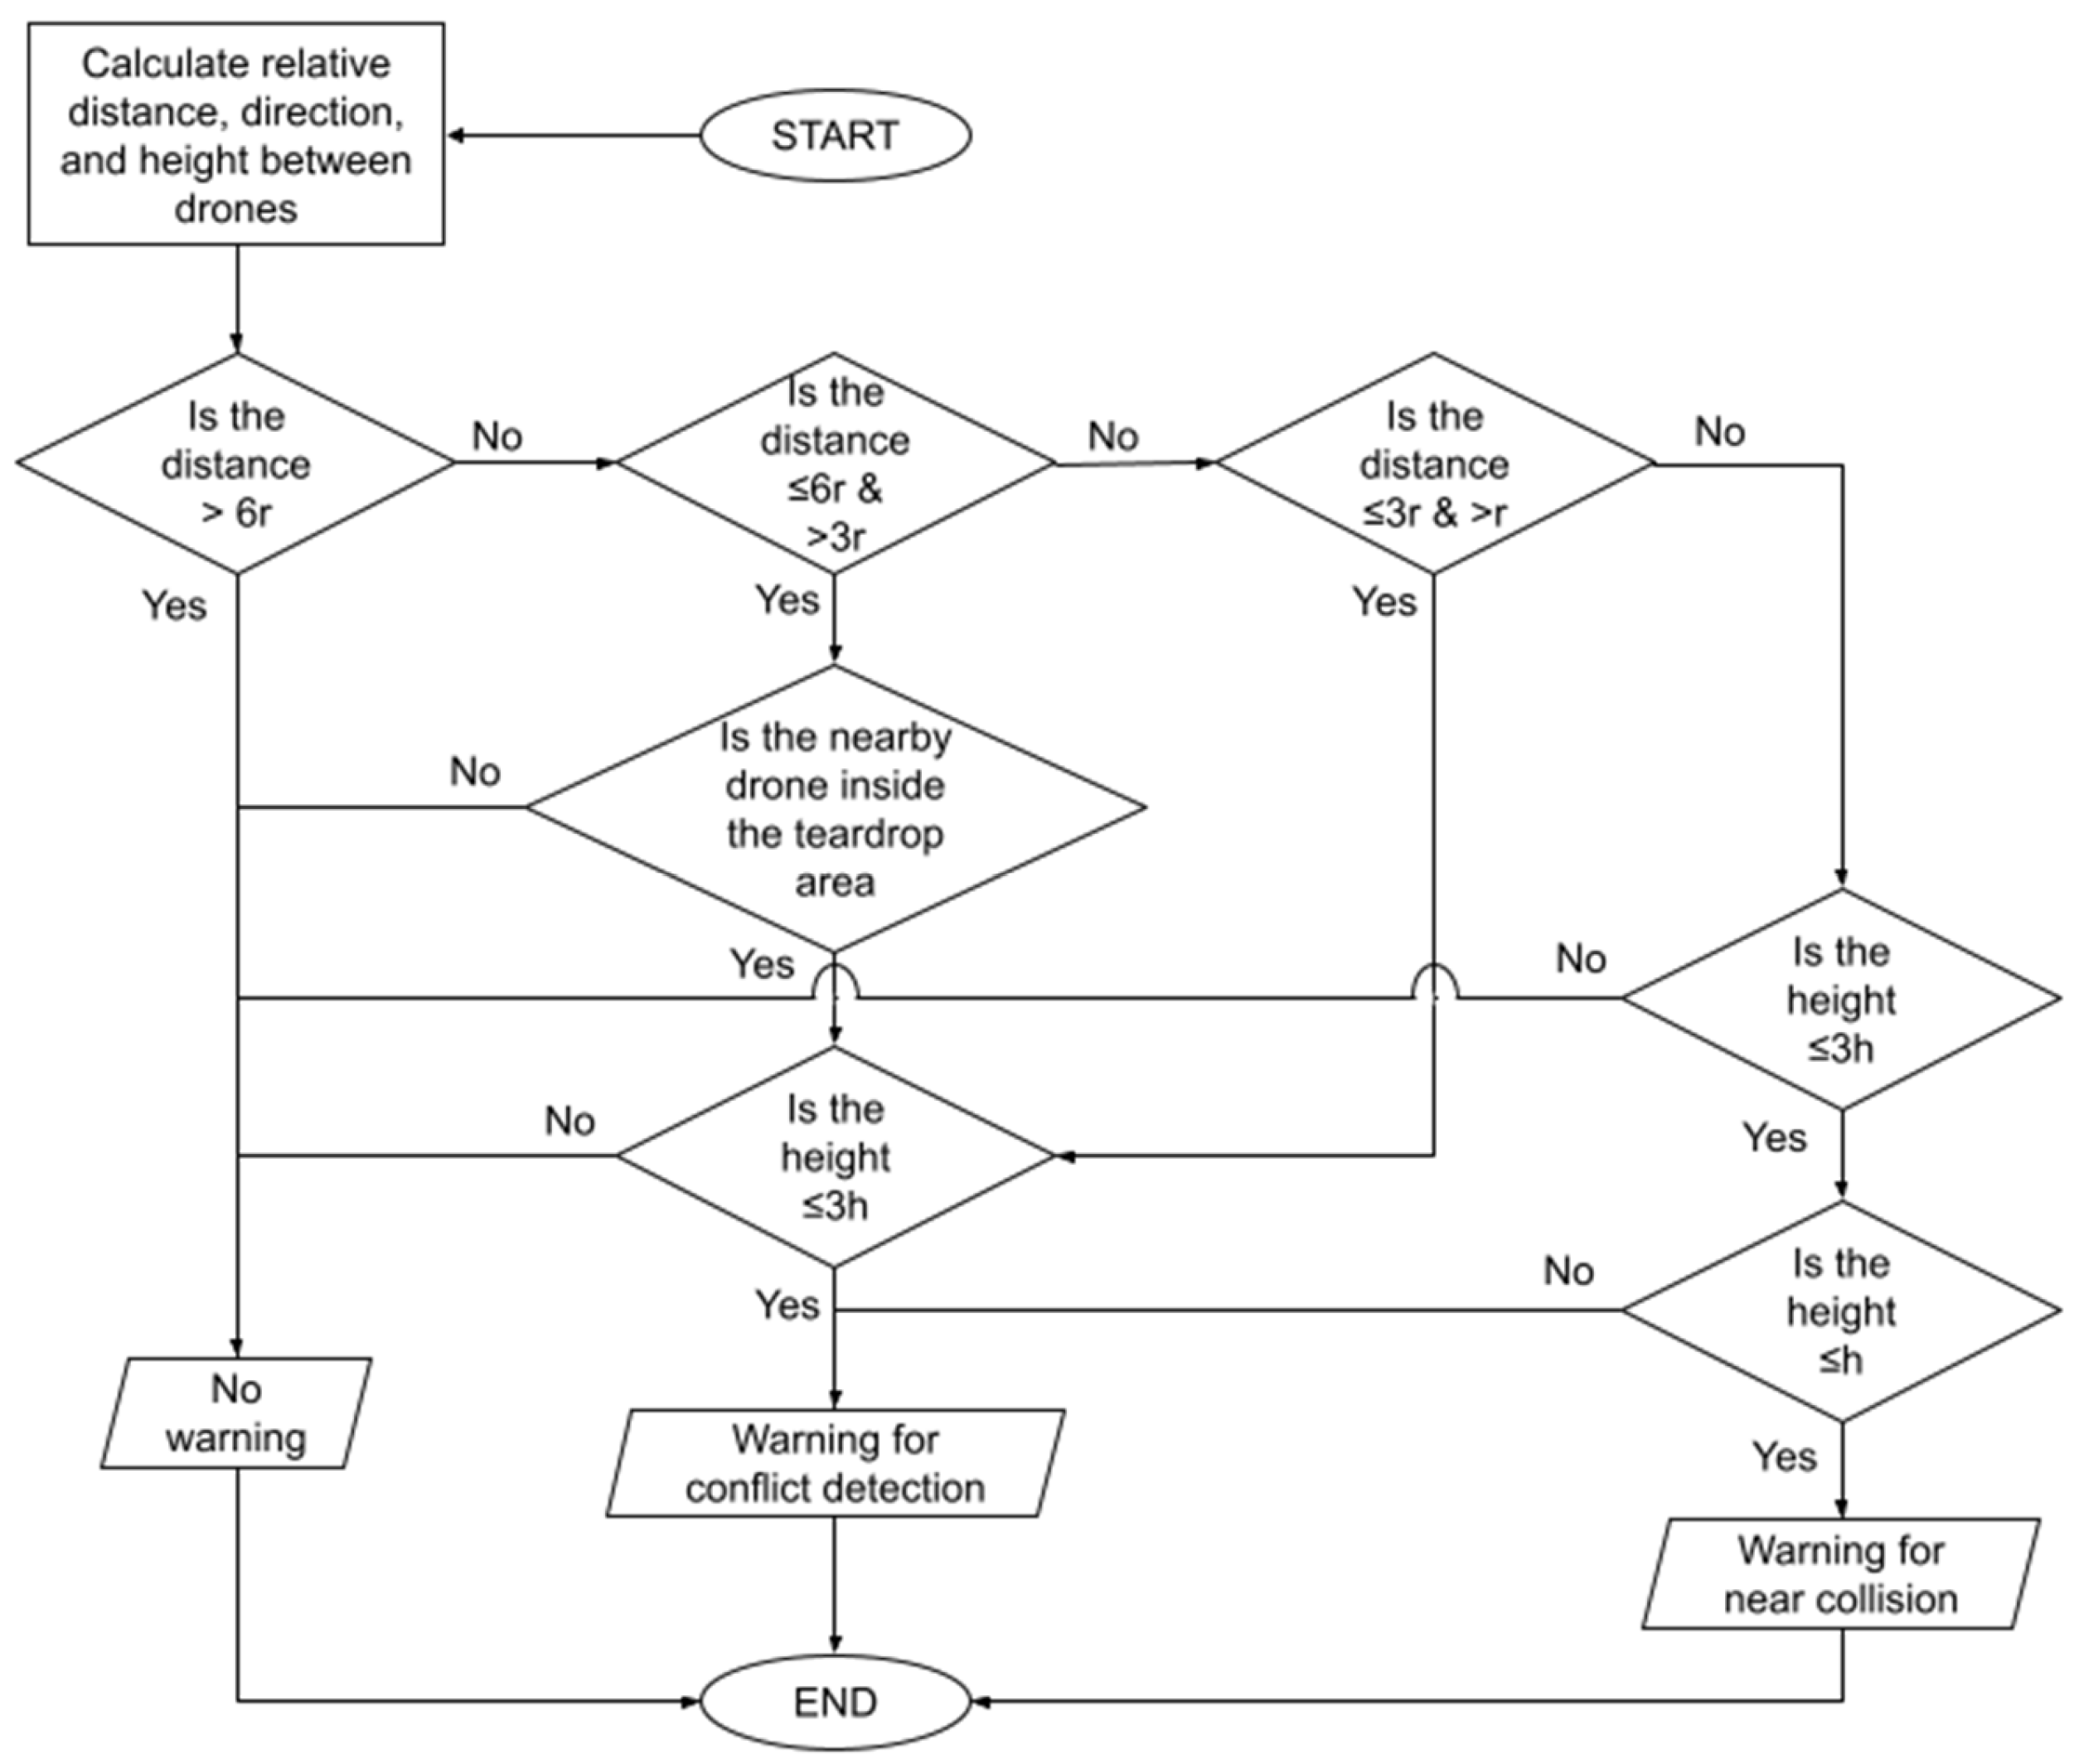
This shape combination gives a larger buffer zone on the front side of the UAV movement to reduce the possibility of a collision event. For three-dimensional (3D) consideration, the height range was adopted for vertical area detection in accordance with what is mostly used in the concept of aviation airspace and suggested by other research [33]. Like horizontal detection, the size of the height range for conflict detection was selected to be 3 times the height range of the near-collision height. The algorithm for conflict detection of UAVs in 3D space is shown in Figure 3.
It starts with the calculation of the UAV flight direction, horizontal relative distance, relative direction, and relative height between UAVs based on the position of two UAVs at the same timestamp. For UAV flight direction ψ in geographical standard (0 degrees pointing to the north), it can be calculated using the trigonometry principle from the speed vector as shown in Equation (1):
ψ = t a n 1 V e V n
where V e is the speed in the east direction and V n is the speed in the north direction.
The relative horizontal directions θ and relative height h are calculated as in Equations (2) and (3), and the horizontal distances between UAVs d are calculated using the haversine method, which uses the great circle reference, as shown in Equations (4) and (5), where R is Earth’s reference radius of 6,378,137 m [34].
θ = ψ 1 ψ 2
h = h 1 h 2
h a v   θ = s i n 2 θ 2
d = 2 R × s i n 1 h a v ( θ )
Based on the calculated parameters, the algorithm can define whether a conflict is detected based on the position of the intruder UAV relative to the teardrop detection volume. First, if the distance d between UAVs is more than 6r, then there is no conflict detected and no warning produced. The “r” is the radius of the circle used in the near-collision area.
Second, when an intruder UAV is at a distance between 3r and 6r from the detecting UAV, it will trigger a warning if the intruder location is inside the area of the inverted teardrop shape. Previously, the relative direction angle θ and distance d between two UAVs were calculated using Equations (2) and (5). Then, angle δ between the UAV’s relative direction to the flight direction of UAV 1 is calculated using Equation (6):
δ = ψ θ
When angle δ is between −60° and +60°, UAV 2 could be inside the teardrop area. Then, the reference distance of the teardrop boundary b for the angle δ is calculated using Equation (7):
b = 3 r / c o s 60 δ
Equation (7) shows that the closer the intruder UAV is to the flight path of the detecting UAV, the longer the detection distance is considered. This is the difference between this teardrop shape area detection algorithm compared with the circle detection area.
If the distance between UAVs d is less than the reference distance b, it means that the other UAV is inside the detection area from a two-dimensional perspective. However, the height must be considered to confirm it as a three-dimensional perspective. Then, a warning of conflict detection will be produced; otherwise, no warning will be produced.
Another possibility is when the distance between UAVs d is less than or equal to 3r and more than r; then, a warning detection will be produced after the height is also considered. This means that the nearby UAV is in the circle part of the teardrop detection volume.
The last possibility is the distance is less than equal to r and the height difference is less than or equal to h, which means that the nearby UAV is inside the near collision volume. Then, a warning for a near collision will be produced.

2.3. Flight Data Measurement

The concepts of the inverted teardrop shape for conflict detection volume and its algorithm were implemented in our UTM monitoring application. The application is developed based on the network Remote ID with the architecture as shown in Figure 4. The UAV flight information is transmitted via a network remote ID to a cloud database; then, our UTM application makes a data query via an internet protocol to obtain the data in real time. After the monitoring processes, the information and its warning are displayed to the users.
The transmitted UAV flight parameters are measured from sensors included in the Remote ID module, which are a GNSS, a barometer, and accelerometers [35]. The lateral position of the UAV in coordinate format is measured from GNSS sensors in reference to a GPS, GLONASS, or GALILEO satellite constellation. Besides the position, lateral accuracy information is also provided. The barometer sensor is used to measure the height of a UAV flight with reference to the take-off point and the vertical accuracy information. The last sensors are accelerometers, which are used to measure the acceleration with reference to the north–east–down (NED) coordinates. However, the transmitted parameters is the speeds in the NED format, which are integrated from the accelerations.
Besides the flight parameters, the time of the transmitted data and received time in the cloud database are recorded. The time required for the data to travel from the UAV until it is displayed in the UTM application is called the latency time. It consists of the broadcast time, query time, and process time. First, the broadcast time is calculated from the UAV transmitting the information until it reaches the cloud server. Second, the query time is the time from the cloud database until it is received by the UTM application. Last is the processing time, which is the time from receiving the data in the UTM application until it is streamed to the display. In addition, the interval time is also calculated based on the difference in time between data displayed. Since the UTM monitoring application uses one thread of computing calculation, the interval time is affected by the latency time.
Moreover, due to the wireless 4G signal quality, internet connection quality, and computing capability, data latency varies over time in the UTM application. This data latency is crucial for UTM operation, especially in conflict detection and resolution, which involve wireless communication [36].

2.4. Machine Learning Algorithm

Besides statistical analysis, machine learning analysis was applied to the flight test data. Based on the studies in the surveyed literature, which conducted a flight data analysis using machine learning, the random forest algorithm is recommended to be used for parameter identification in aviation. For this context, the random forest algorithm is superior in accuracy, collinear resistance, overfitting resistance, and parametric robustness compared with other algorithms, such as the boosting Eensemble, decision trees, K-nearest methods, and naive Bayes [37].
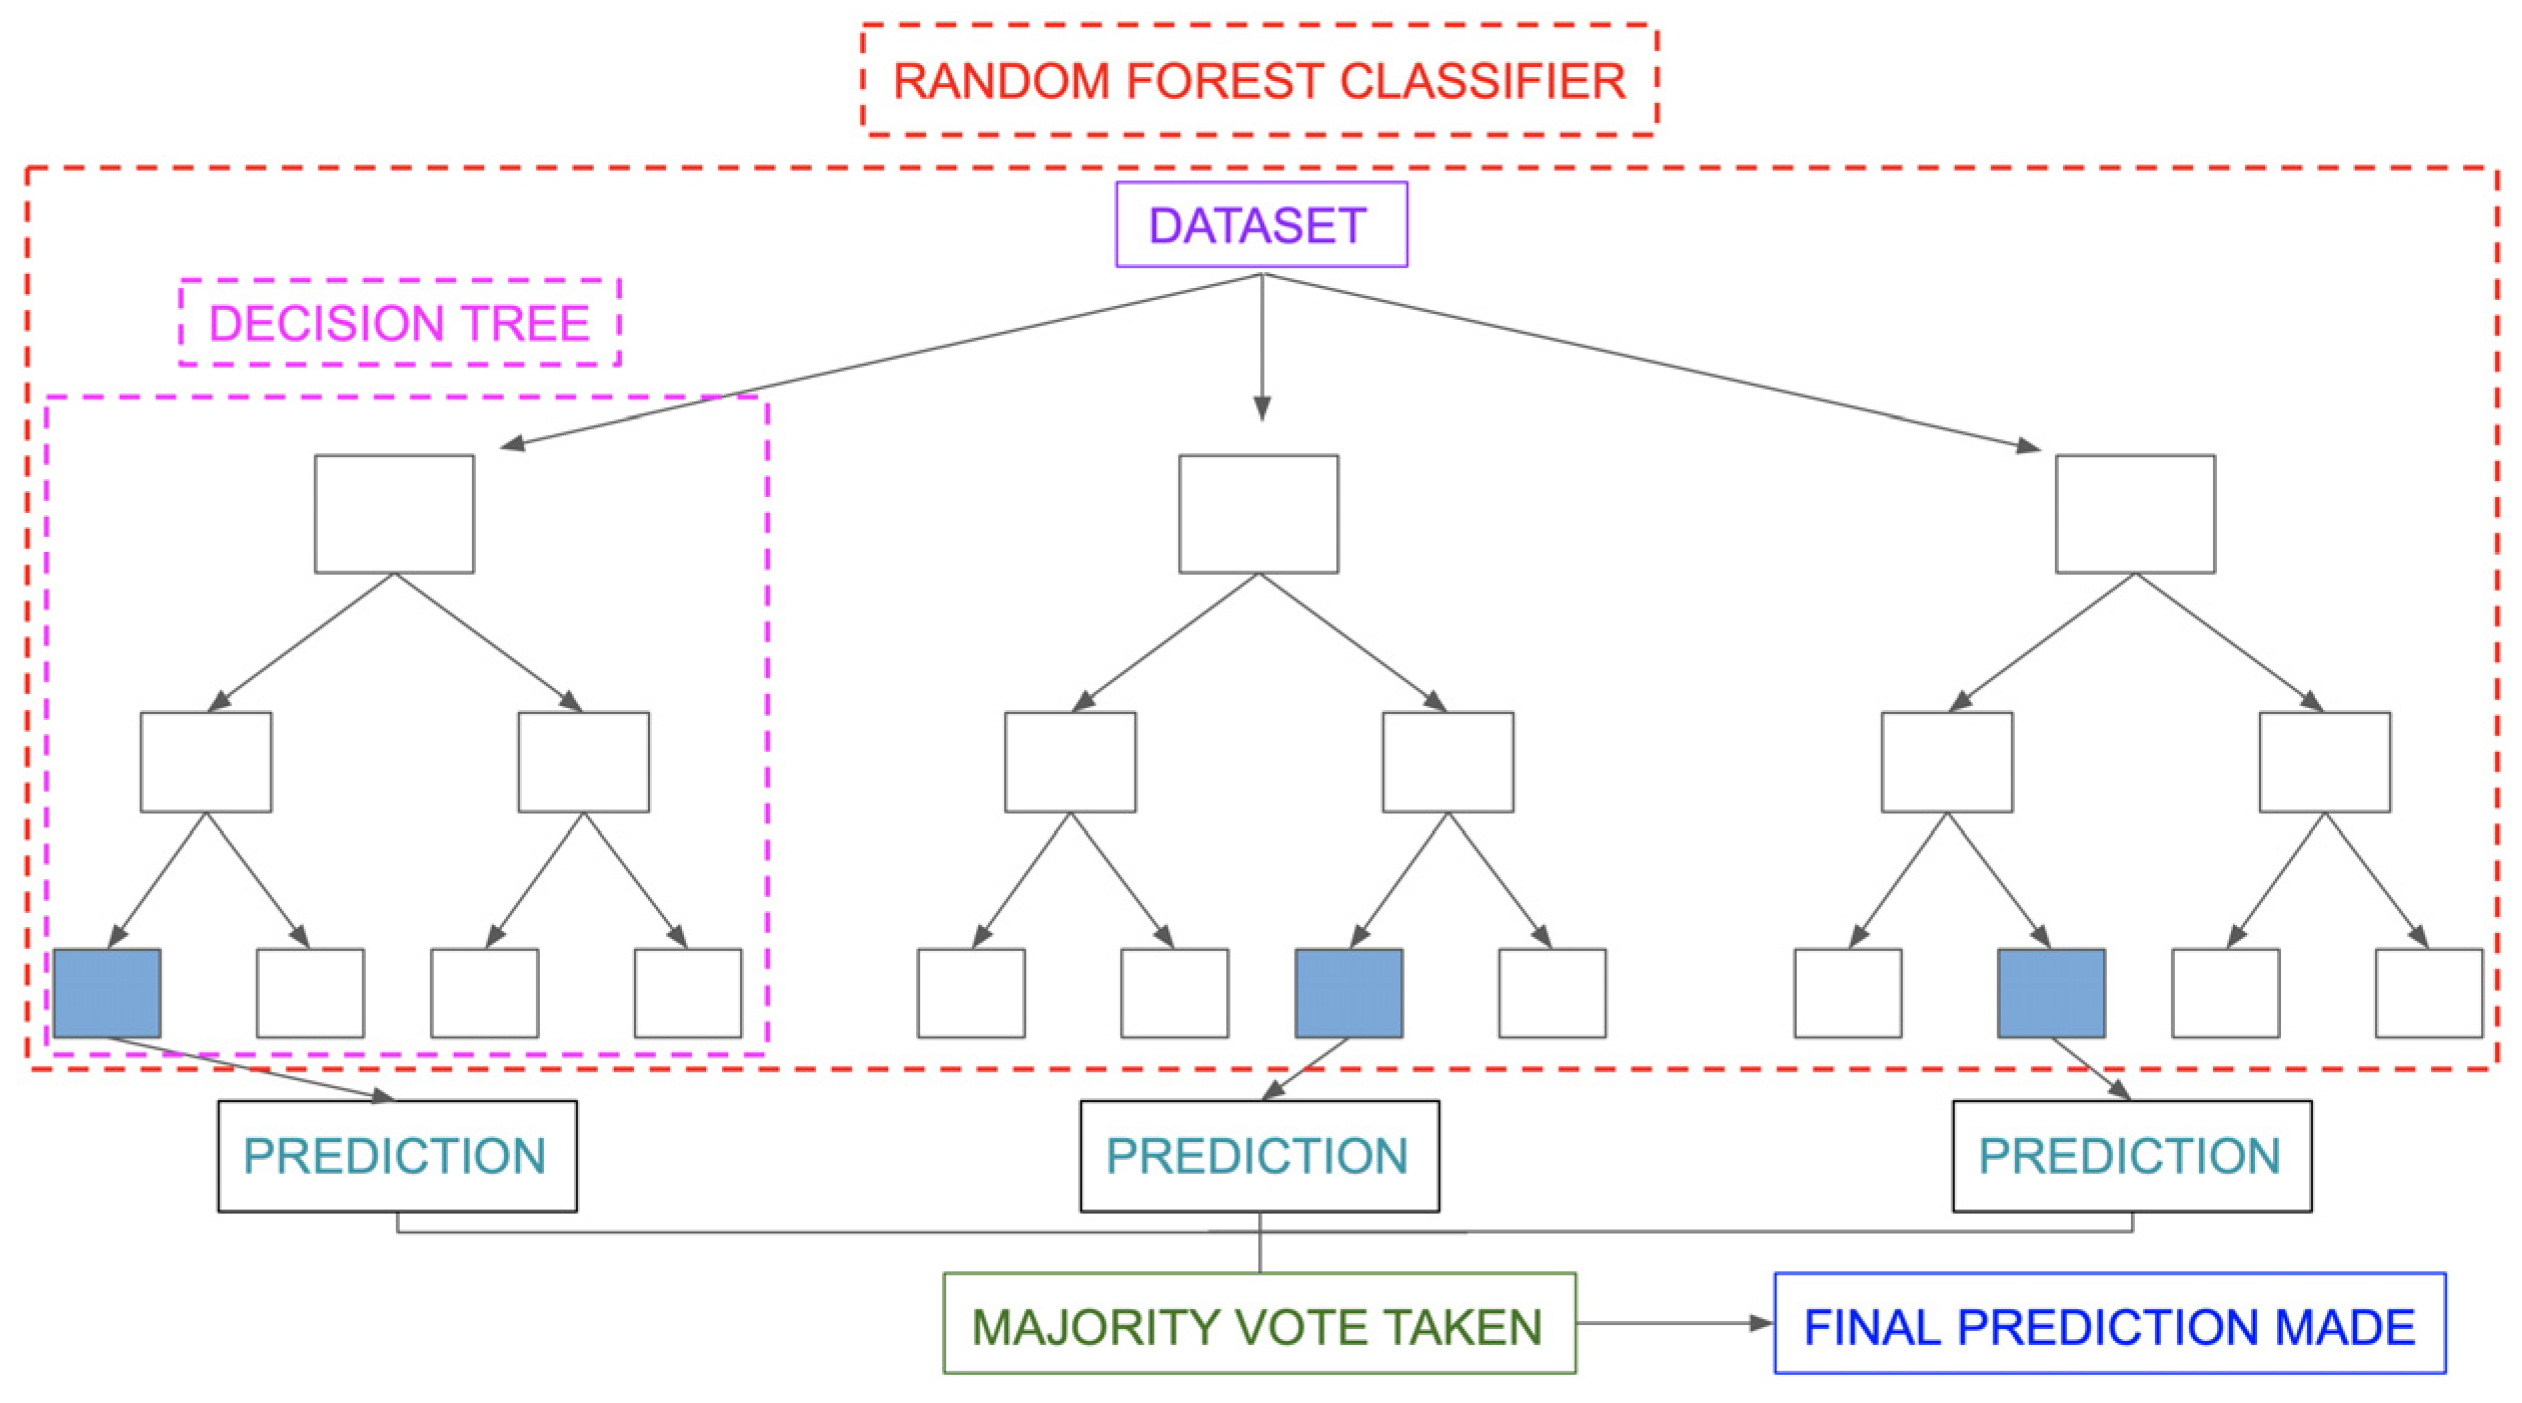
The random forest algorithm is a combination of multiple decision trees processing data. The algorithm comprises a root node, a few internal nodes, and leaf nodes that consists of a subset of randomly selected features, as shown in Figure 5.
The procedure used by the random forest algorithm consists of three main parts, which are the input, training, and prediction process. The input consists of sample training set x, which consists of the flight parameters data, and the response y, which is the target parameter. The training process is a loop for each dataset as follows [39]:
For t = 1 to T:
  • Take a bootstrap sample [ x t , y t ] of size N from [x, y];
  • Use [ x t , y t ] as the training data to train the t-th decision nodes by using a binary recursive function;
  • Repeat the following steps recursively for each unsplit node until the stopping criteria are met.
The prediction process predicts the y target parameters based on the new x i test data.
There are two application types of the random forest algorithm, which are the regression and classification problems. The regression problem is related to a continuous target parameter. It is solved using the mean square error (MSE), as shown in Equation (8) [40]:
M S E = 1 N i = 1 N f i y i 2
where N—the number of data points;
f i —the value returned by the model;
y i —the actual value for data point i.
In contrast, the classification problem is related to a discrete target parameter. It is solved using the GINI index, which is calculated using Equation (9):
G I N I = 1 i = 1 C p i 2
where p i —relative frequency of the class of the dataset;
C—the number of classes.

3. Methodology

To analyze the UTM monitoring application, a series of flight tests were conducted involving several small fixed-wing UAVs flying in suburban and rural areas. This section explains the UTM monitoring application setup, Remote ID hardware, UAV frames, locations, and flight test scenarios.

3.1. UTM Monitoring Application Setup

The UTM monitoring application based on the network Remote ID was developed in Python language programming version 3.7 with the Bokeh module version 2.4.3 for visualization. The inverted teardrop detection algorithm was implemented in 3D space as explained in the previous section. The UTM application can be viewed in a web browser with the user interface as shown in Figure 6. The most challenging process in the UI design of our UTM monitoring is how to draw the inverted teardrop shape because there is no built-in teardrop shape in the Bokeh module used. However, the best option found was using multiple circles with different radii arranged in the direction of the UAV flight to form an inverted teardrop shape. Each UAV was surrounded by a teardrop shape as the detection volume and a circle as the near-collision volume. A teardrop shape in orange indicates a conflict was detected, while green indicates no detection. For the near-collision shape, red indicates a near-collision event, while yellow indicates no near-collision event.
The UTM monitoring application was installed on a laptop computer with a core i3 Intel processor and Python programming language version 3.7. The computer was connected to the internet via a WiFi connection from a smartphone that used the FarEasTone 4G cellular network.

3.2. Remote ID and UAV Hardware

The Remote ID hardware used was two DroneTag Mini modules produced by DroneTag s.r.o. from the Czech Republic. It transmitted a broadcast Remote ID using Bluetooth technology and the network Remote ID used IoT 4G Chunghwa Telecom cellular network with a cloud-supporting database. The hardware size was 54 × 35 × 15 mm with a weight of 32 g equipped with internal GNSS, LTE, and Bluetooth antennas. Sensors for the GNSS, a barometer, and accelerometers were included for flight data measurement. It is a standalone module with a battery life of up to 14 h [35].
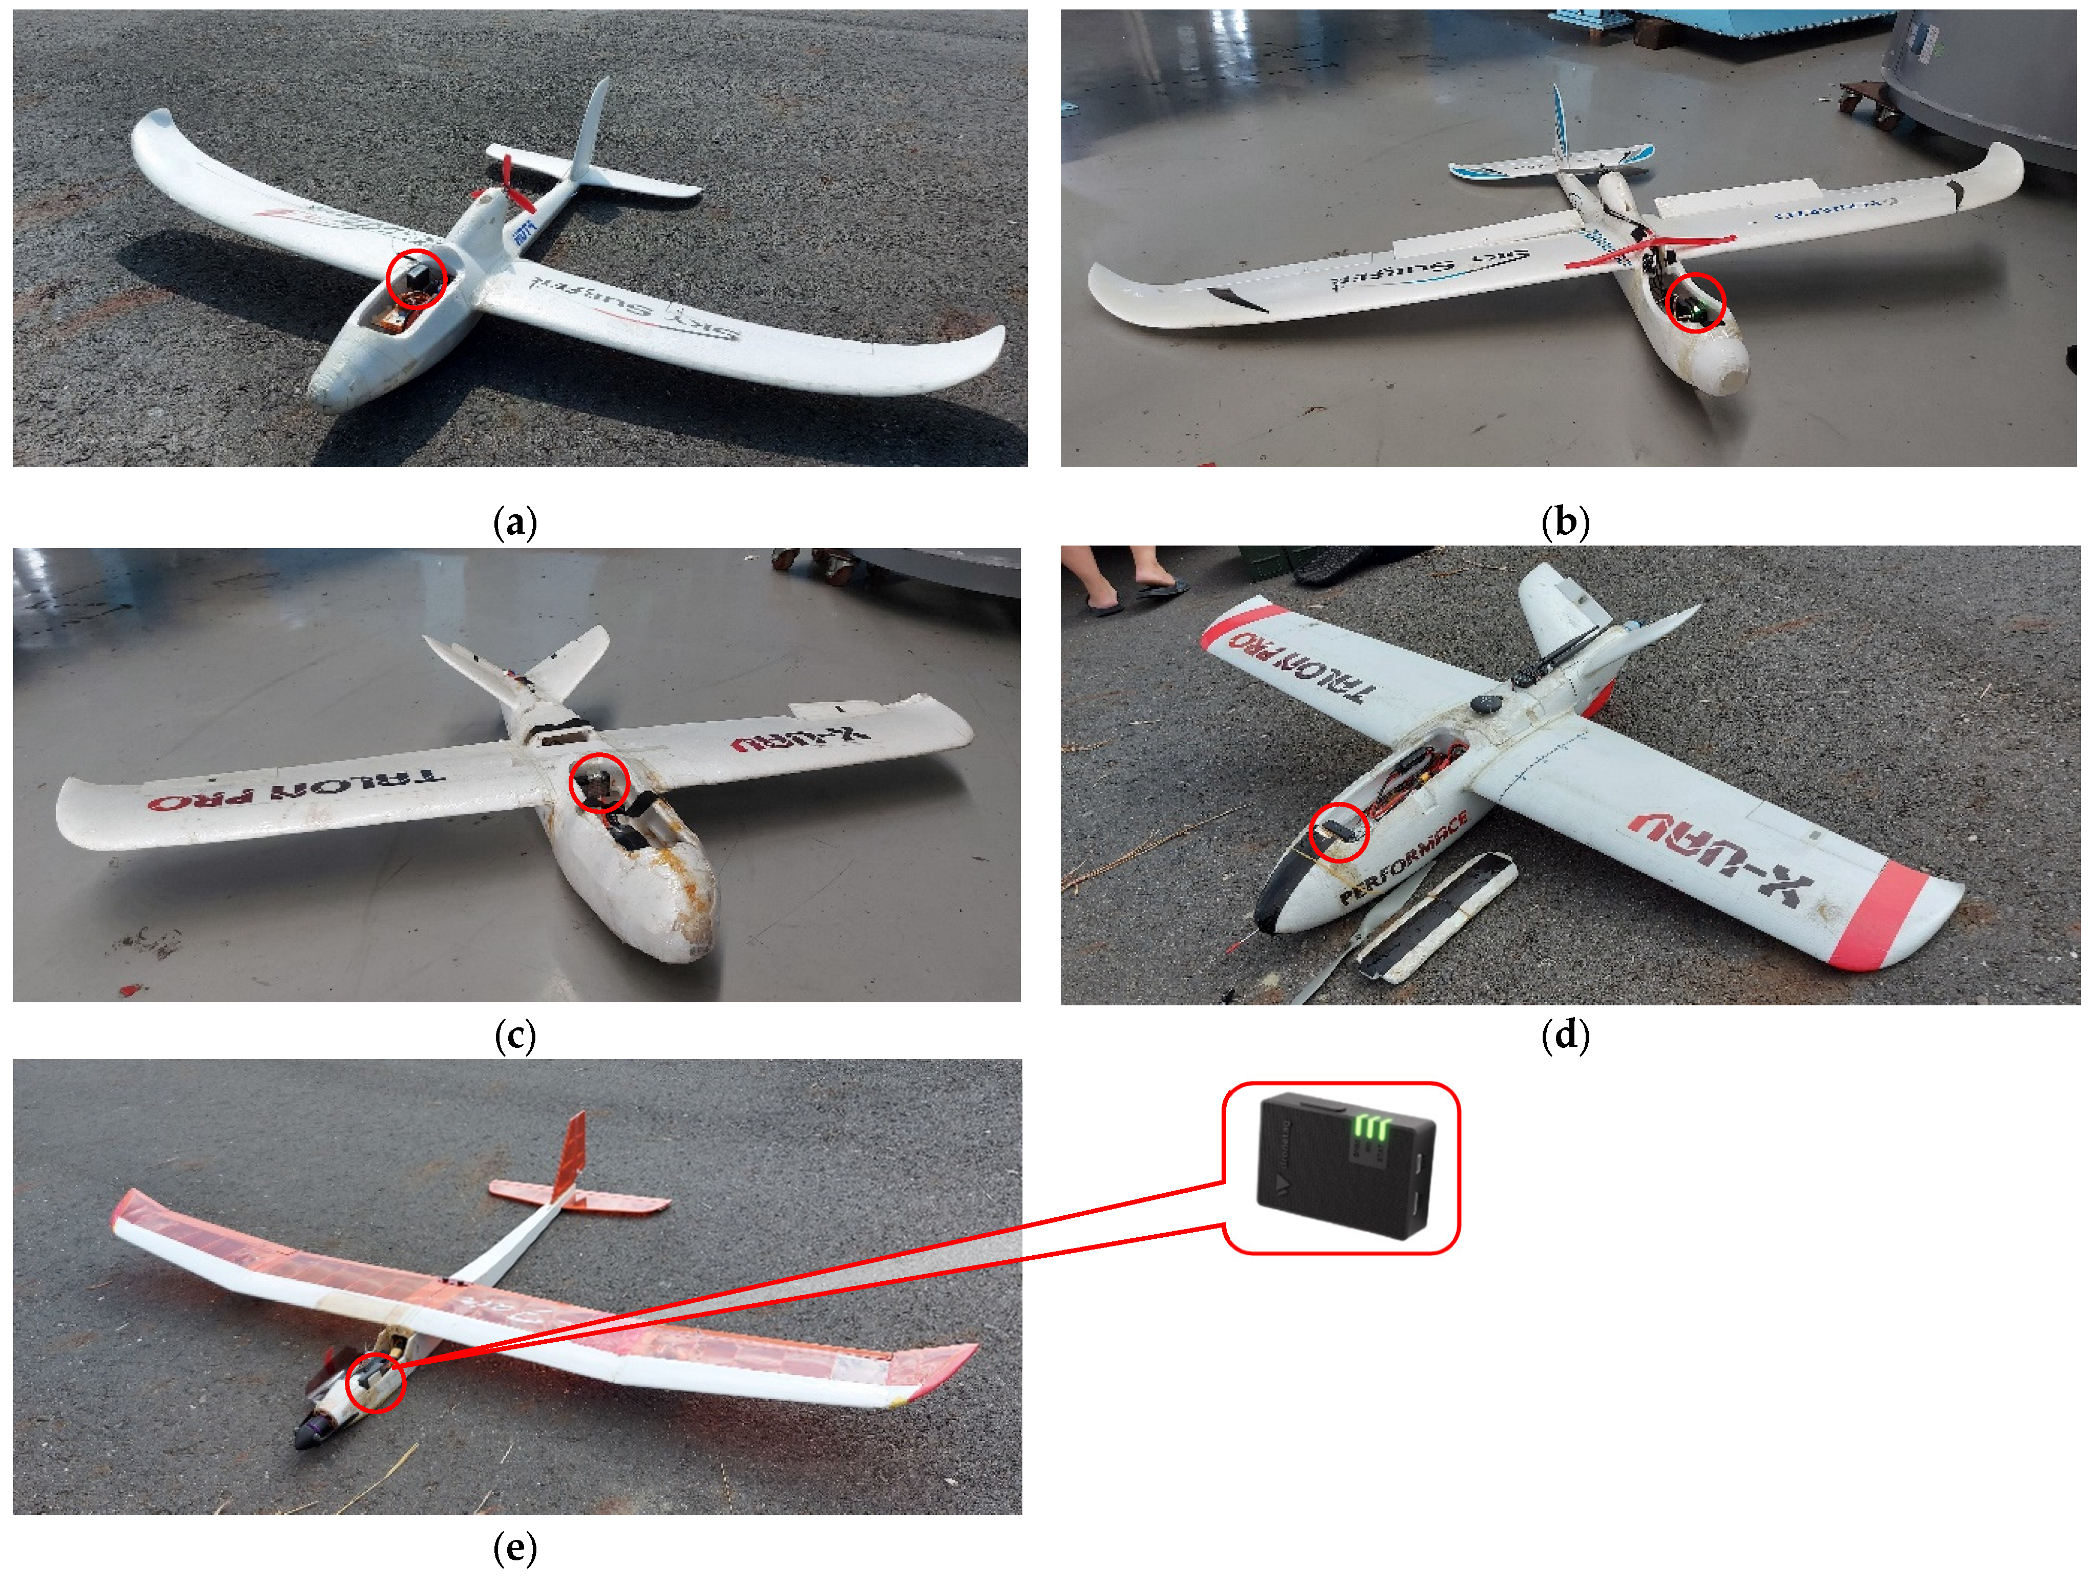
During the flight test, the remote ID modules were mounted inside the fixed-wing UAVs, as shown in Figure 7. There were 5 fixed wings UAVs used, which were 2 Sky Surfers, 2 Mini Talons, and 1 Lanyu E-Fair. The UAV detail specification is described in Table 1. Each UAV was controlled by an experienced UAV pilot from our laboratory with a radio frequency remote controller.

3.3. Location and Flight Test Scenarios

There were two locations used in our flight tests, as shown in Figure 8. The first one was the UAV flying zone near the Yunlin high-speed rail (HSR) station (23.730495 N, 120.418773 E), which is popularly used by the Huwei UAV community. It is a suburban location where there are some residential and commercial buildings mixed with parks and empty space. The second place was the National Formosa University (NFU) Agriculture campus (23.728259 N, 120.375310 E), which is considered a rural area with a majority area of farmland.
There were two conflict scenarios of flight tests conducted in our research. The first scenario involved a stationary intruder represented by a Remote ID staying on the ground. The second scenario involved a flying intruder represented by both the Remote ID modules flying in UAVs. However, in both scenarios, only one UAV was instructed to conduct collision avoidance maneuvers. This scenario avoided both UAVs execute avoidance maneuvers that led to another conflict. In addition, due to safety considerations, the second scenario flight tests were only conducted in the rural flight test location. For both scenarios, the UTM monitoring application was in the same location where the flight test was conducted.

4. Flight Test Results and Discussion

The flight test results, including the flight test record, flight parameter plots, and data analysis, are presented in this section.

4.1. Flight Test Records

There were 10 flight tests conducted in two locations, with 6 flights for scenario 1 and 4 flights for scenario 2, as recorded in Table 2. It involved 5 UAVs with 4 experienced UAV pilots from our NFU UAV Laboratory. The flight test data was filtered based on the take-off to landing time of the controlled UAV 1. The total flight test time was 71 min and 55 s, which consists of 4607 data points. The flight tests were always conducted in the morning Taiwan time when the wind was relatively calm.
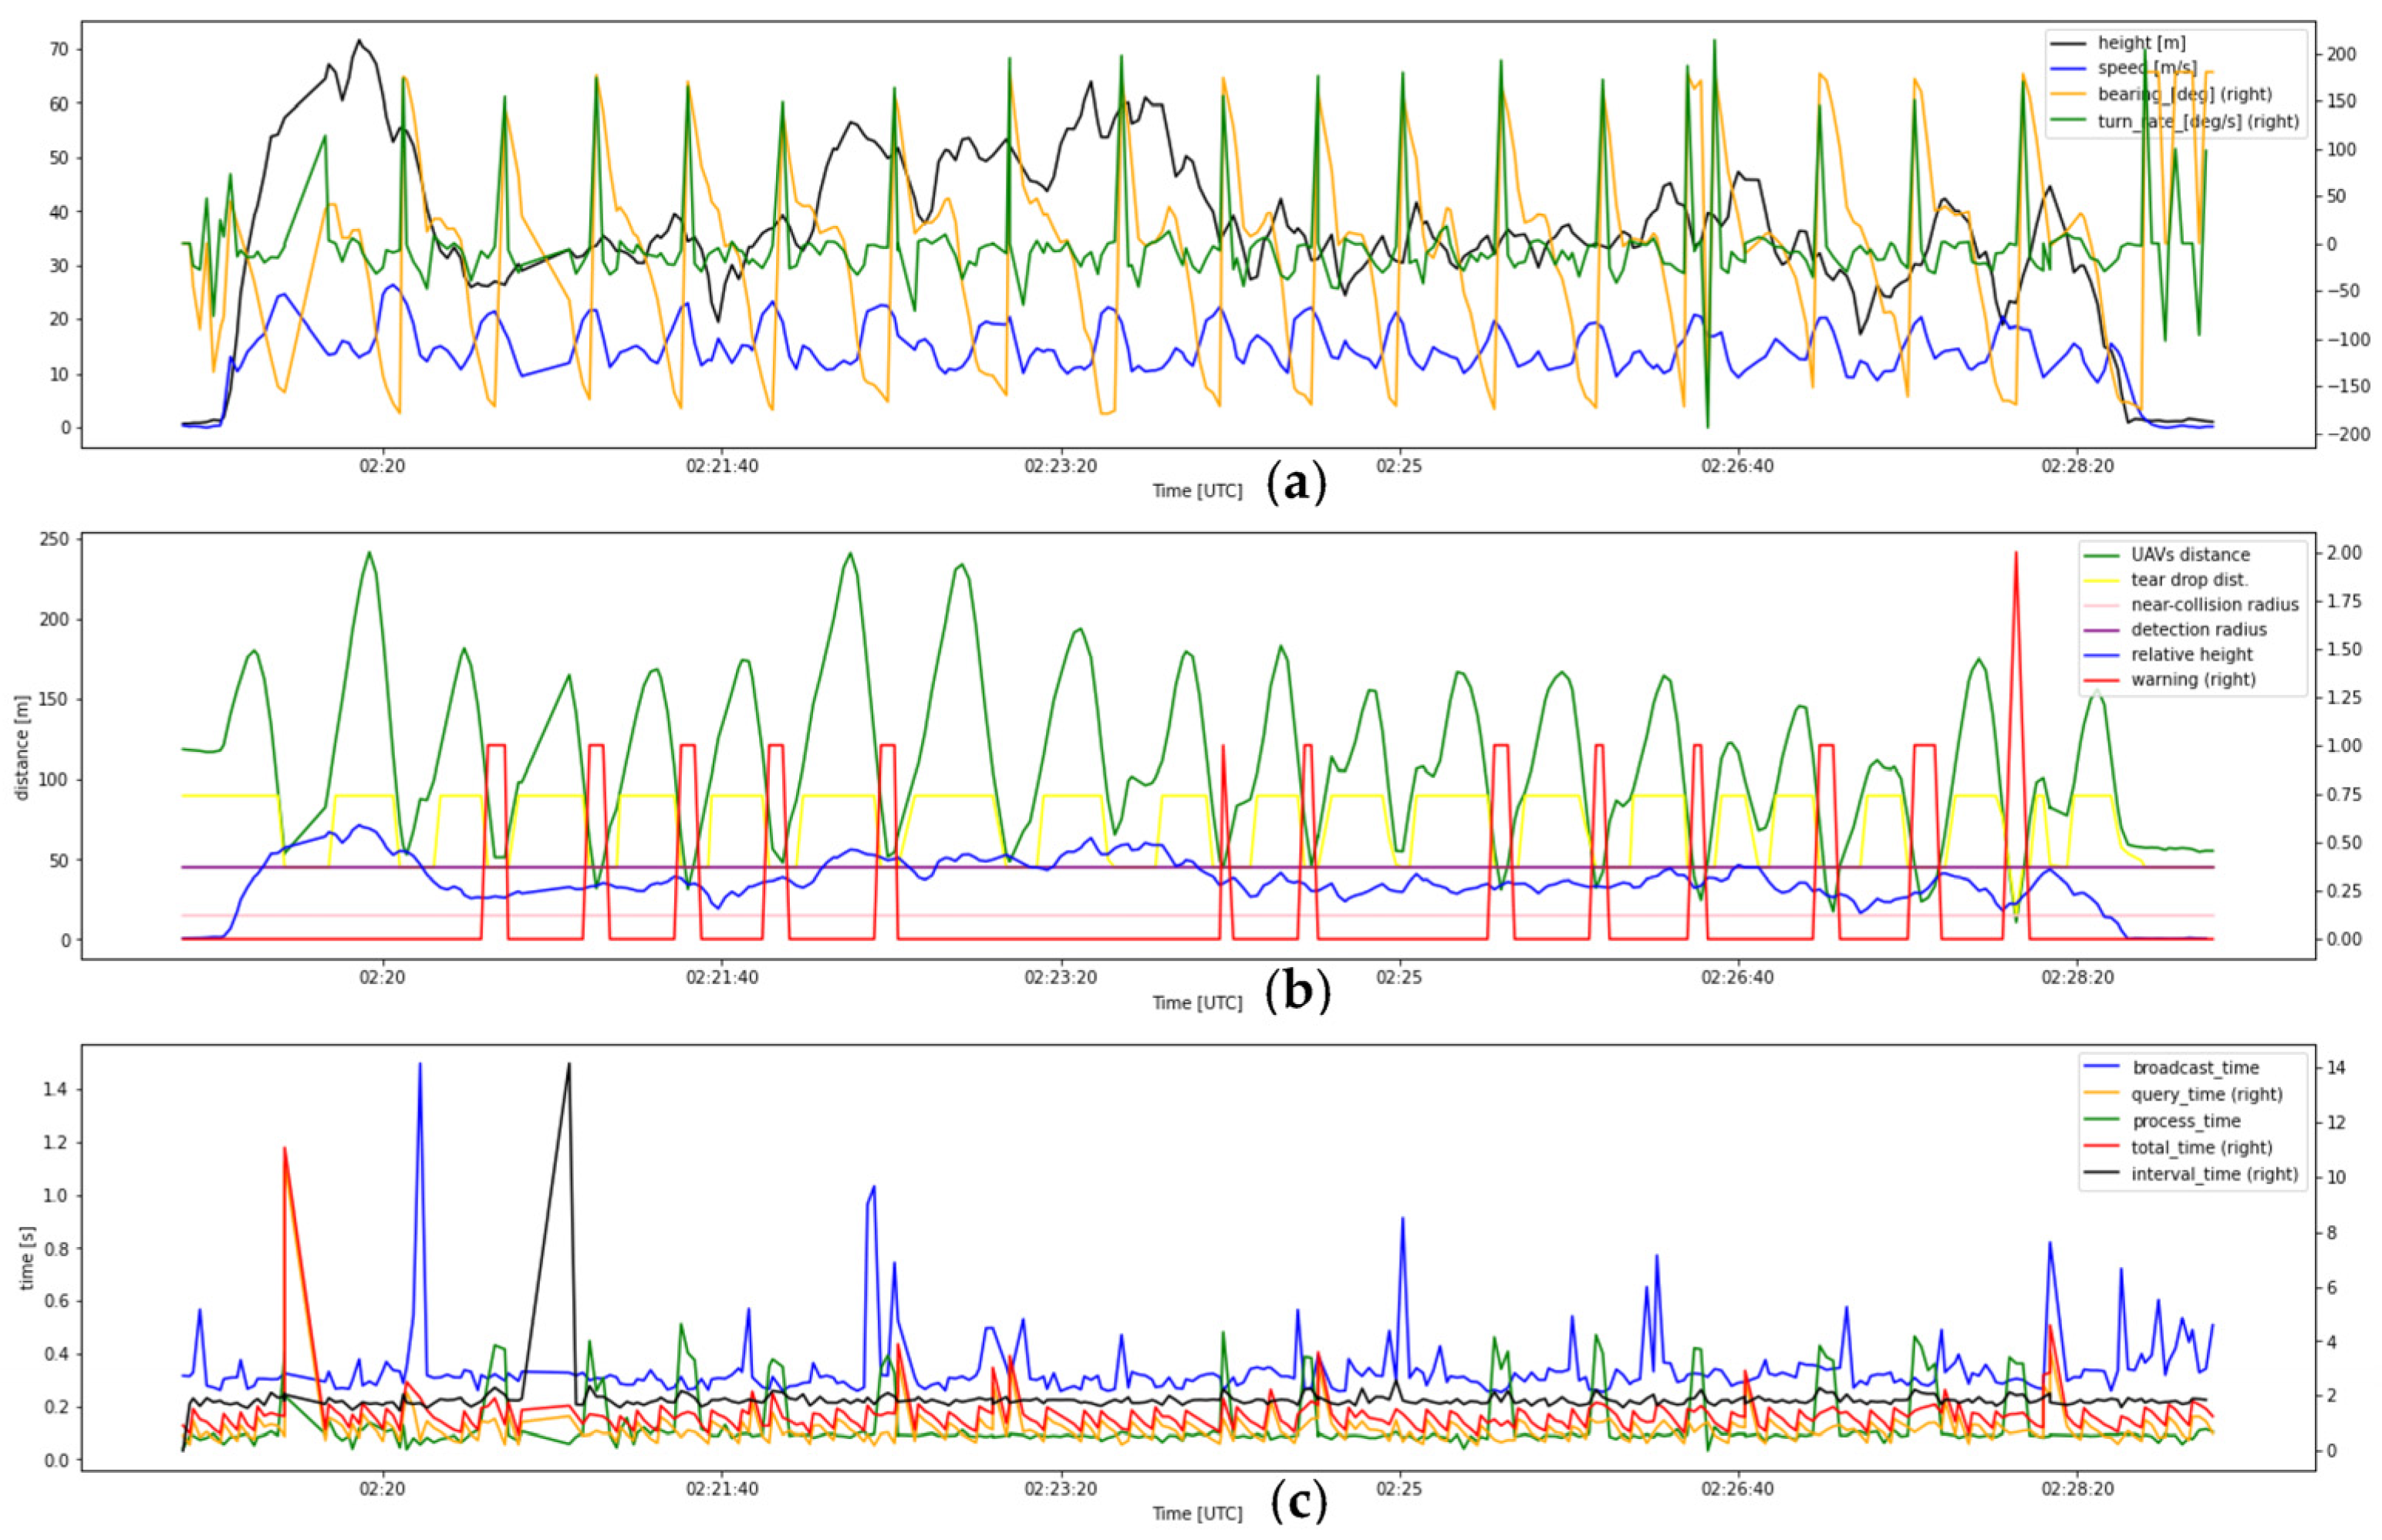
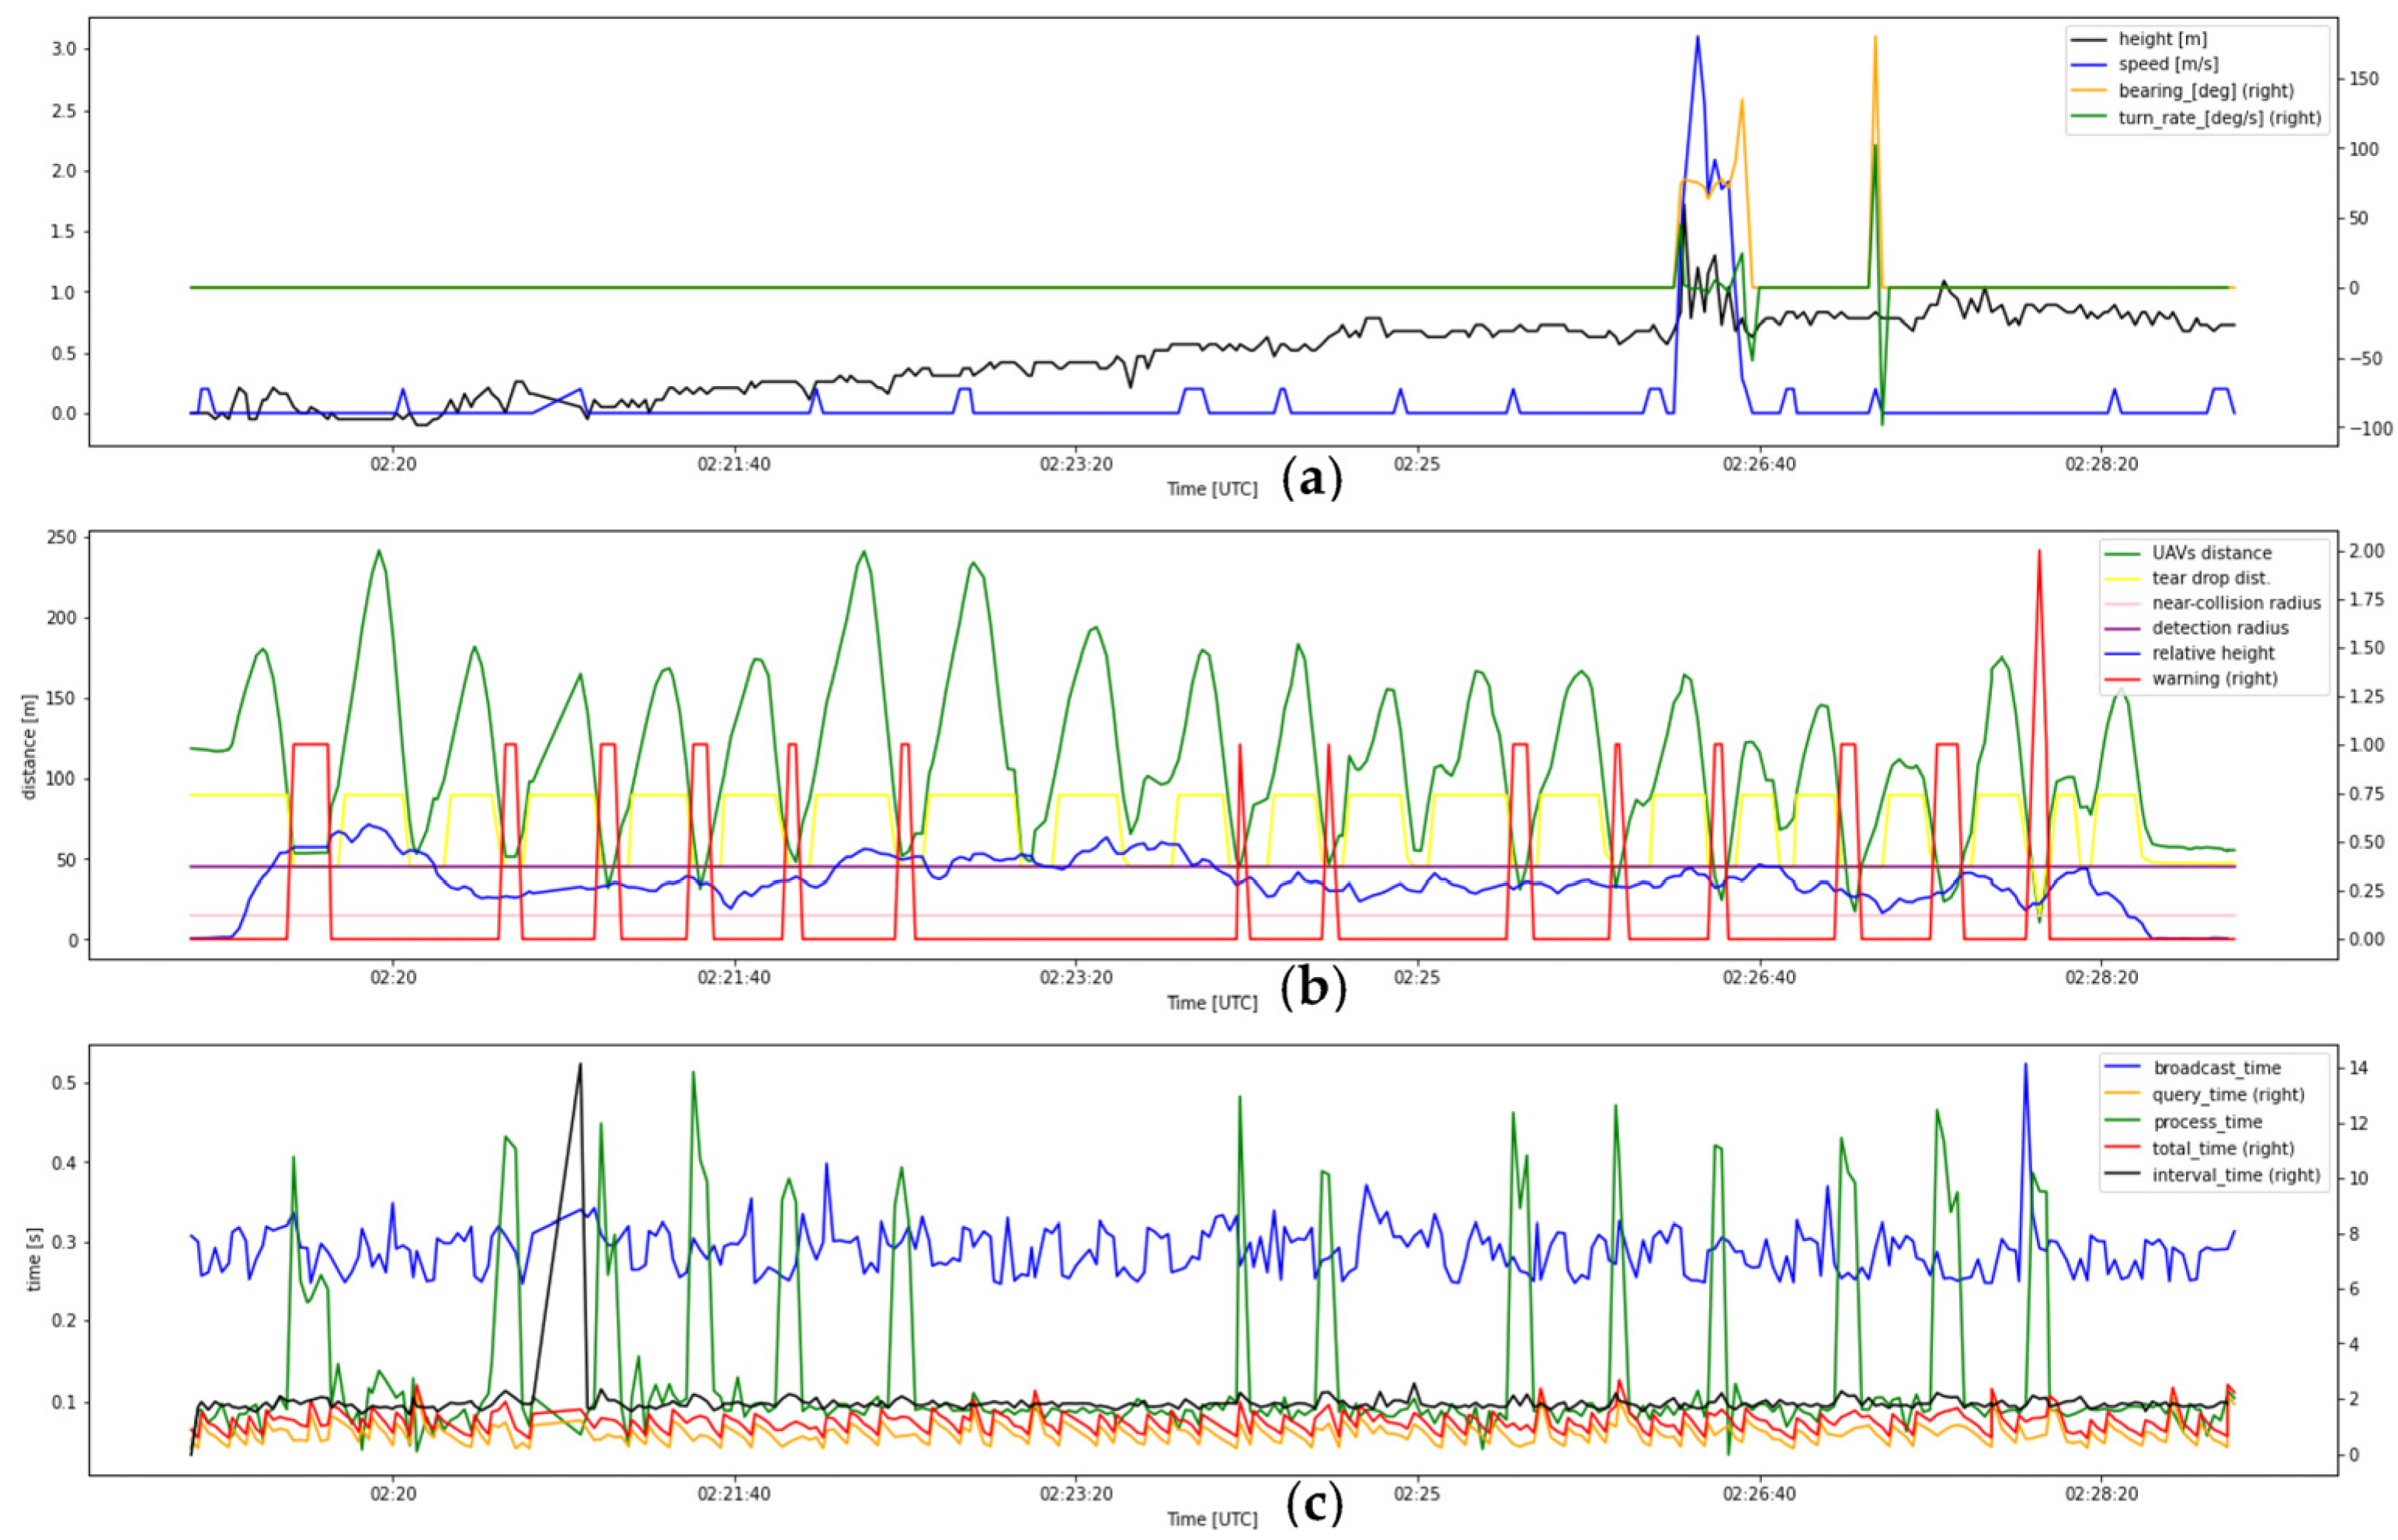
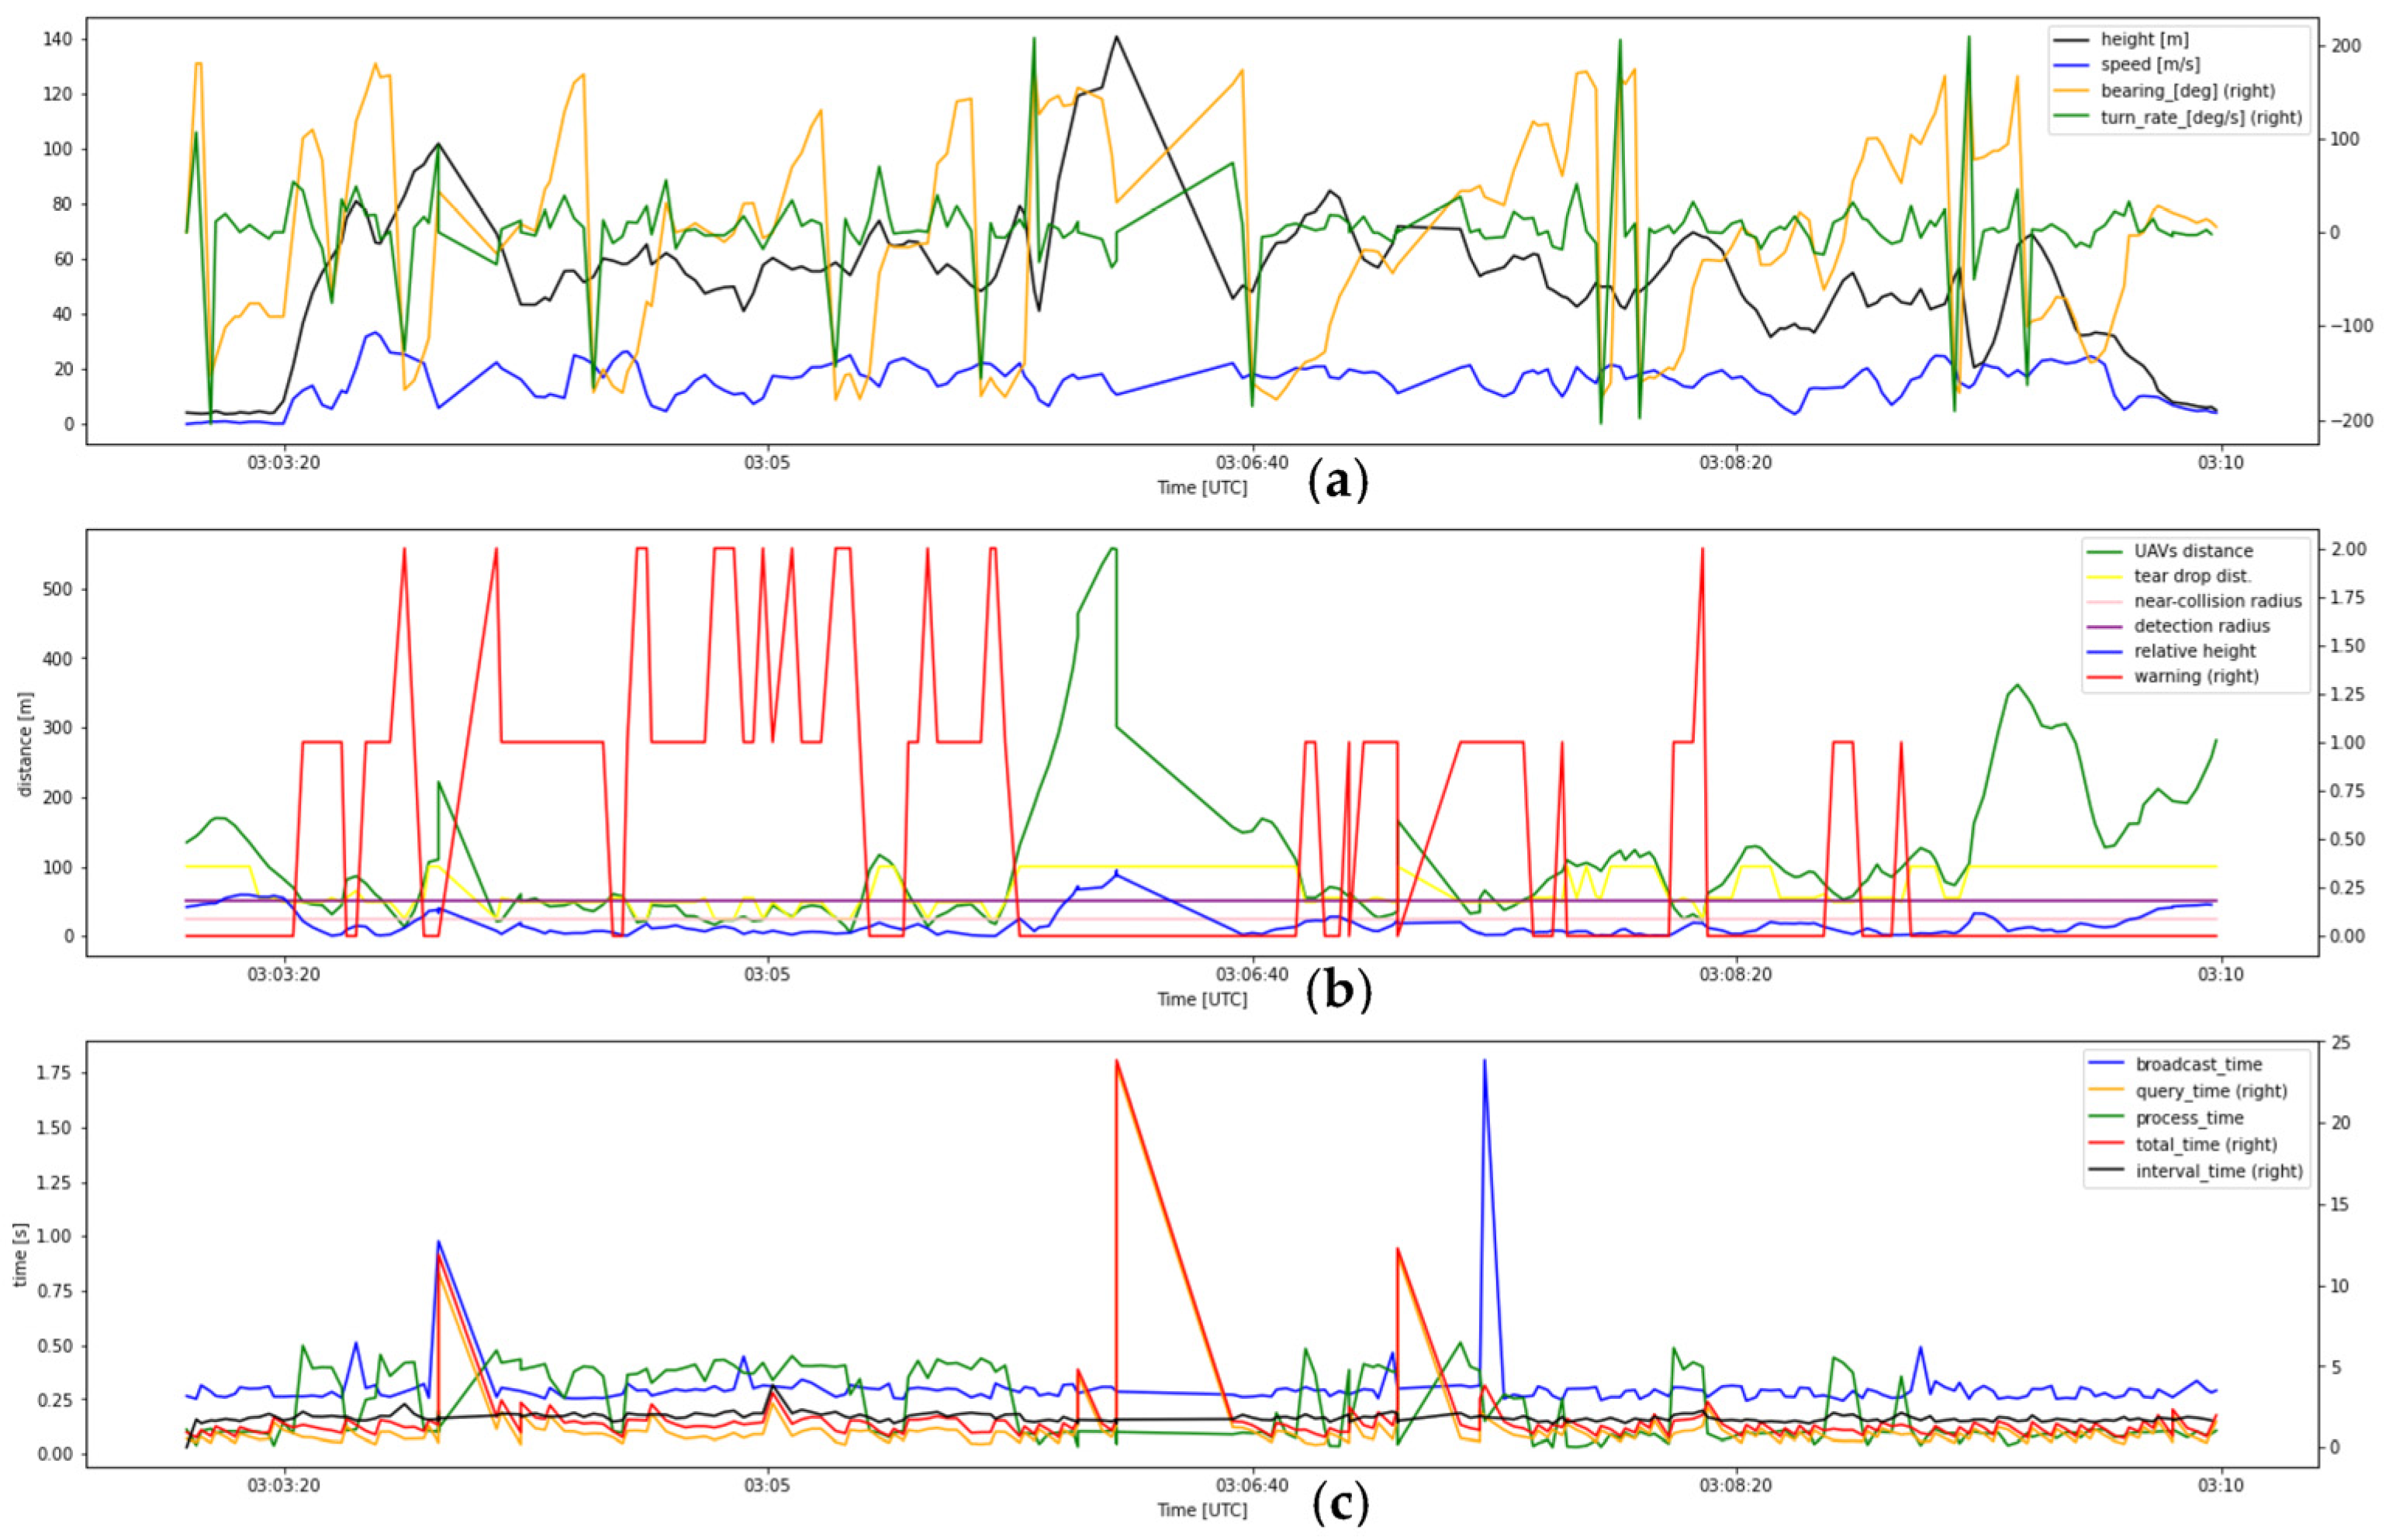
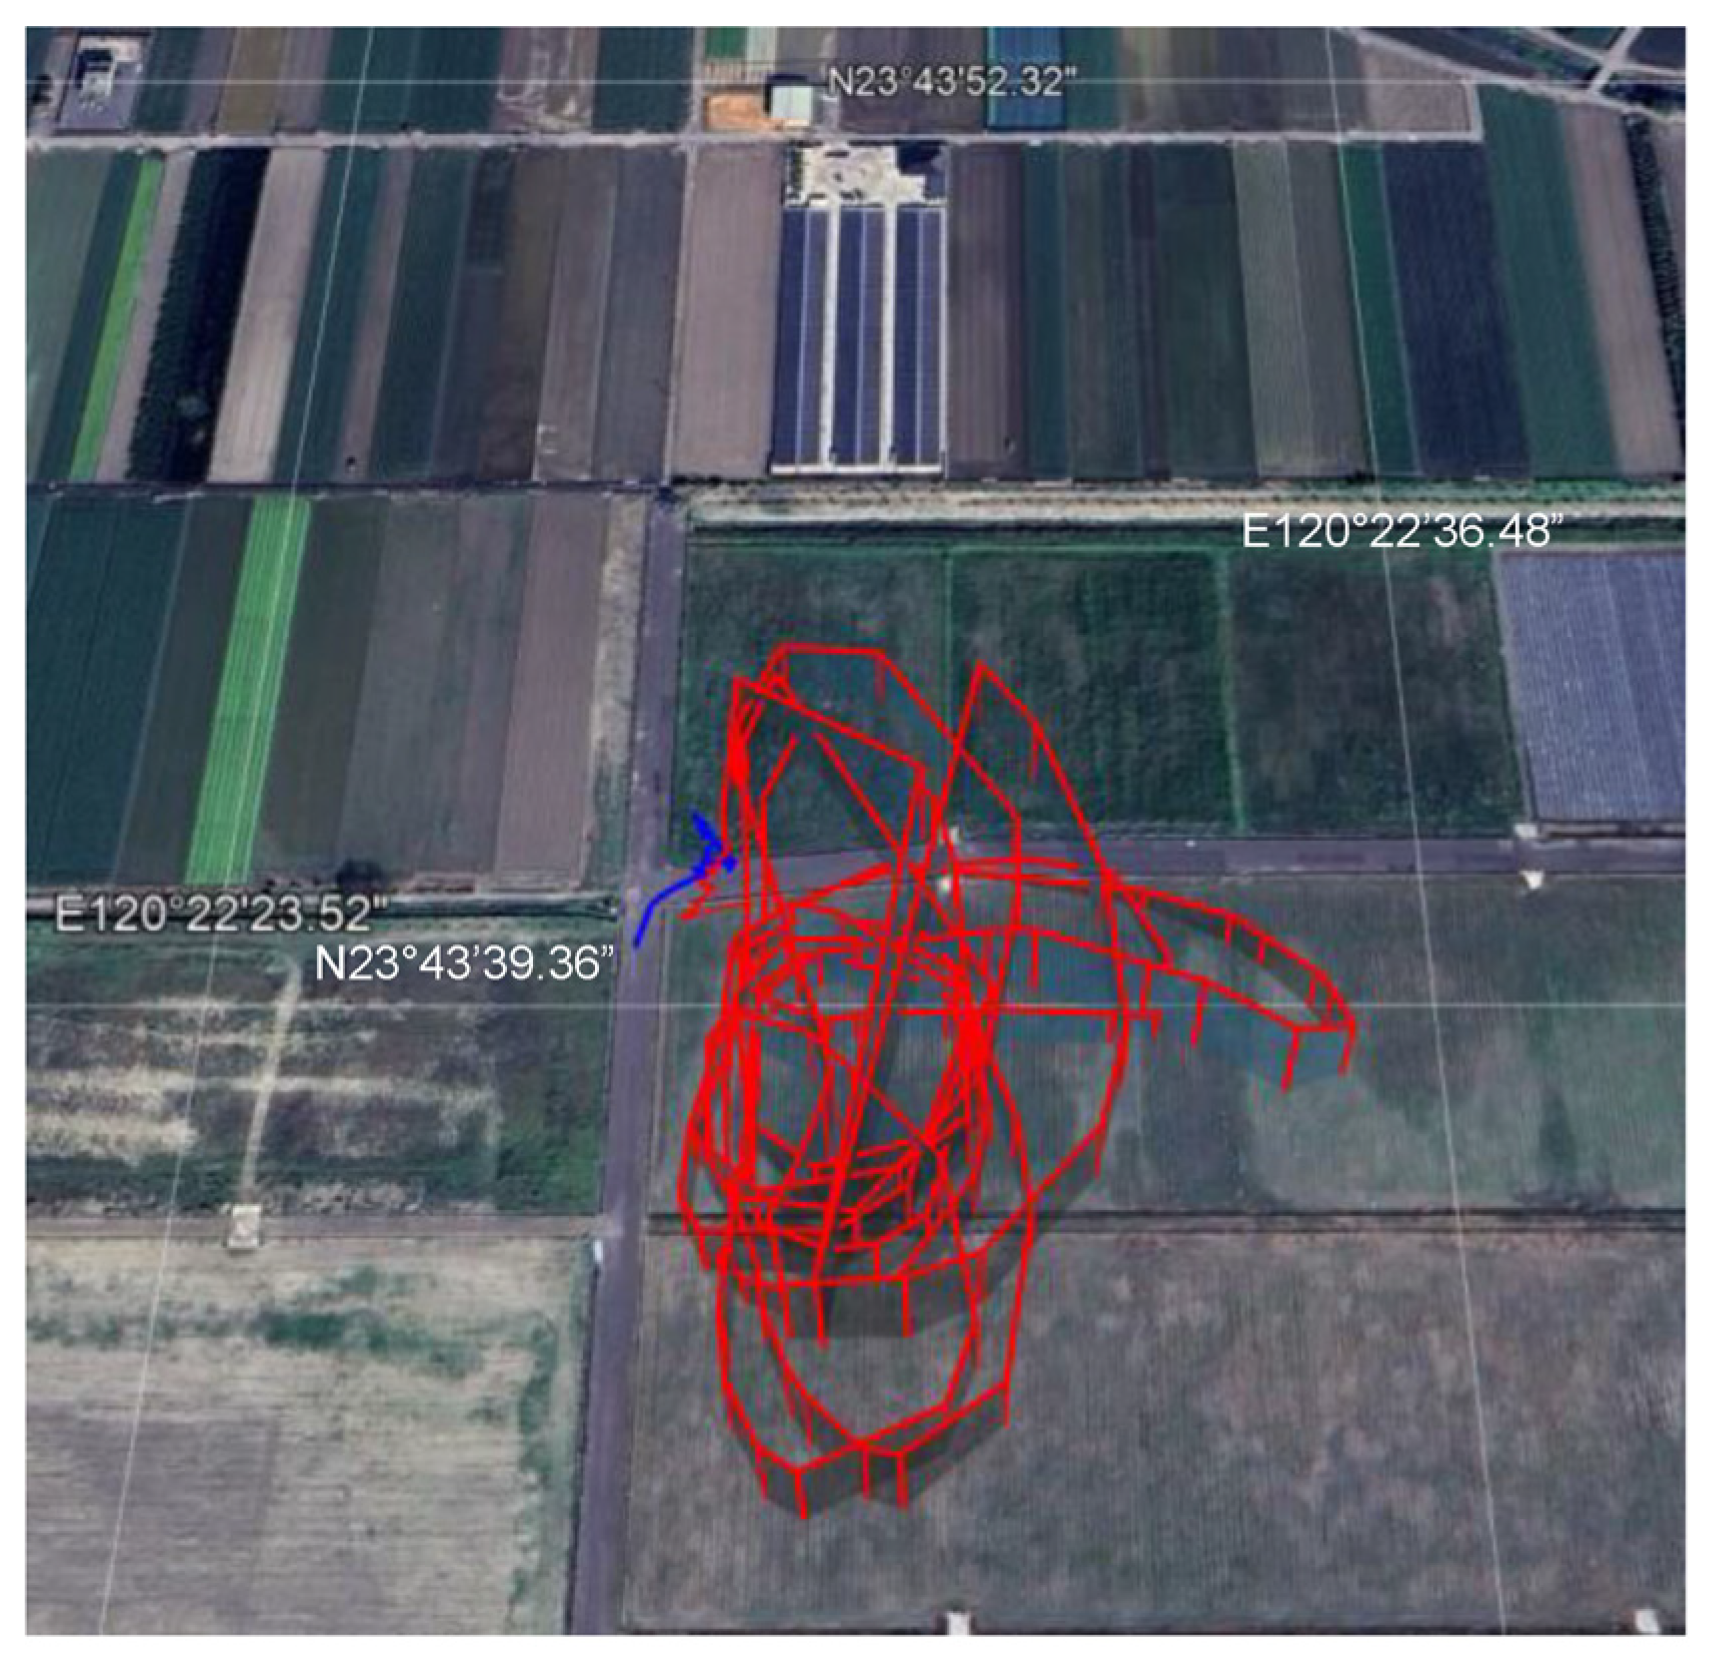
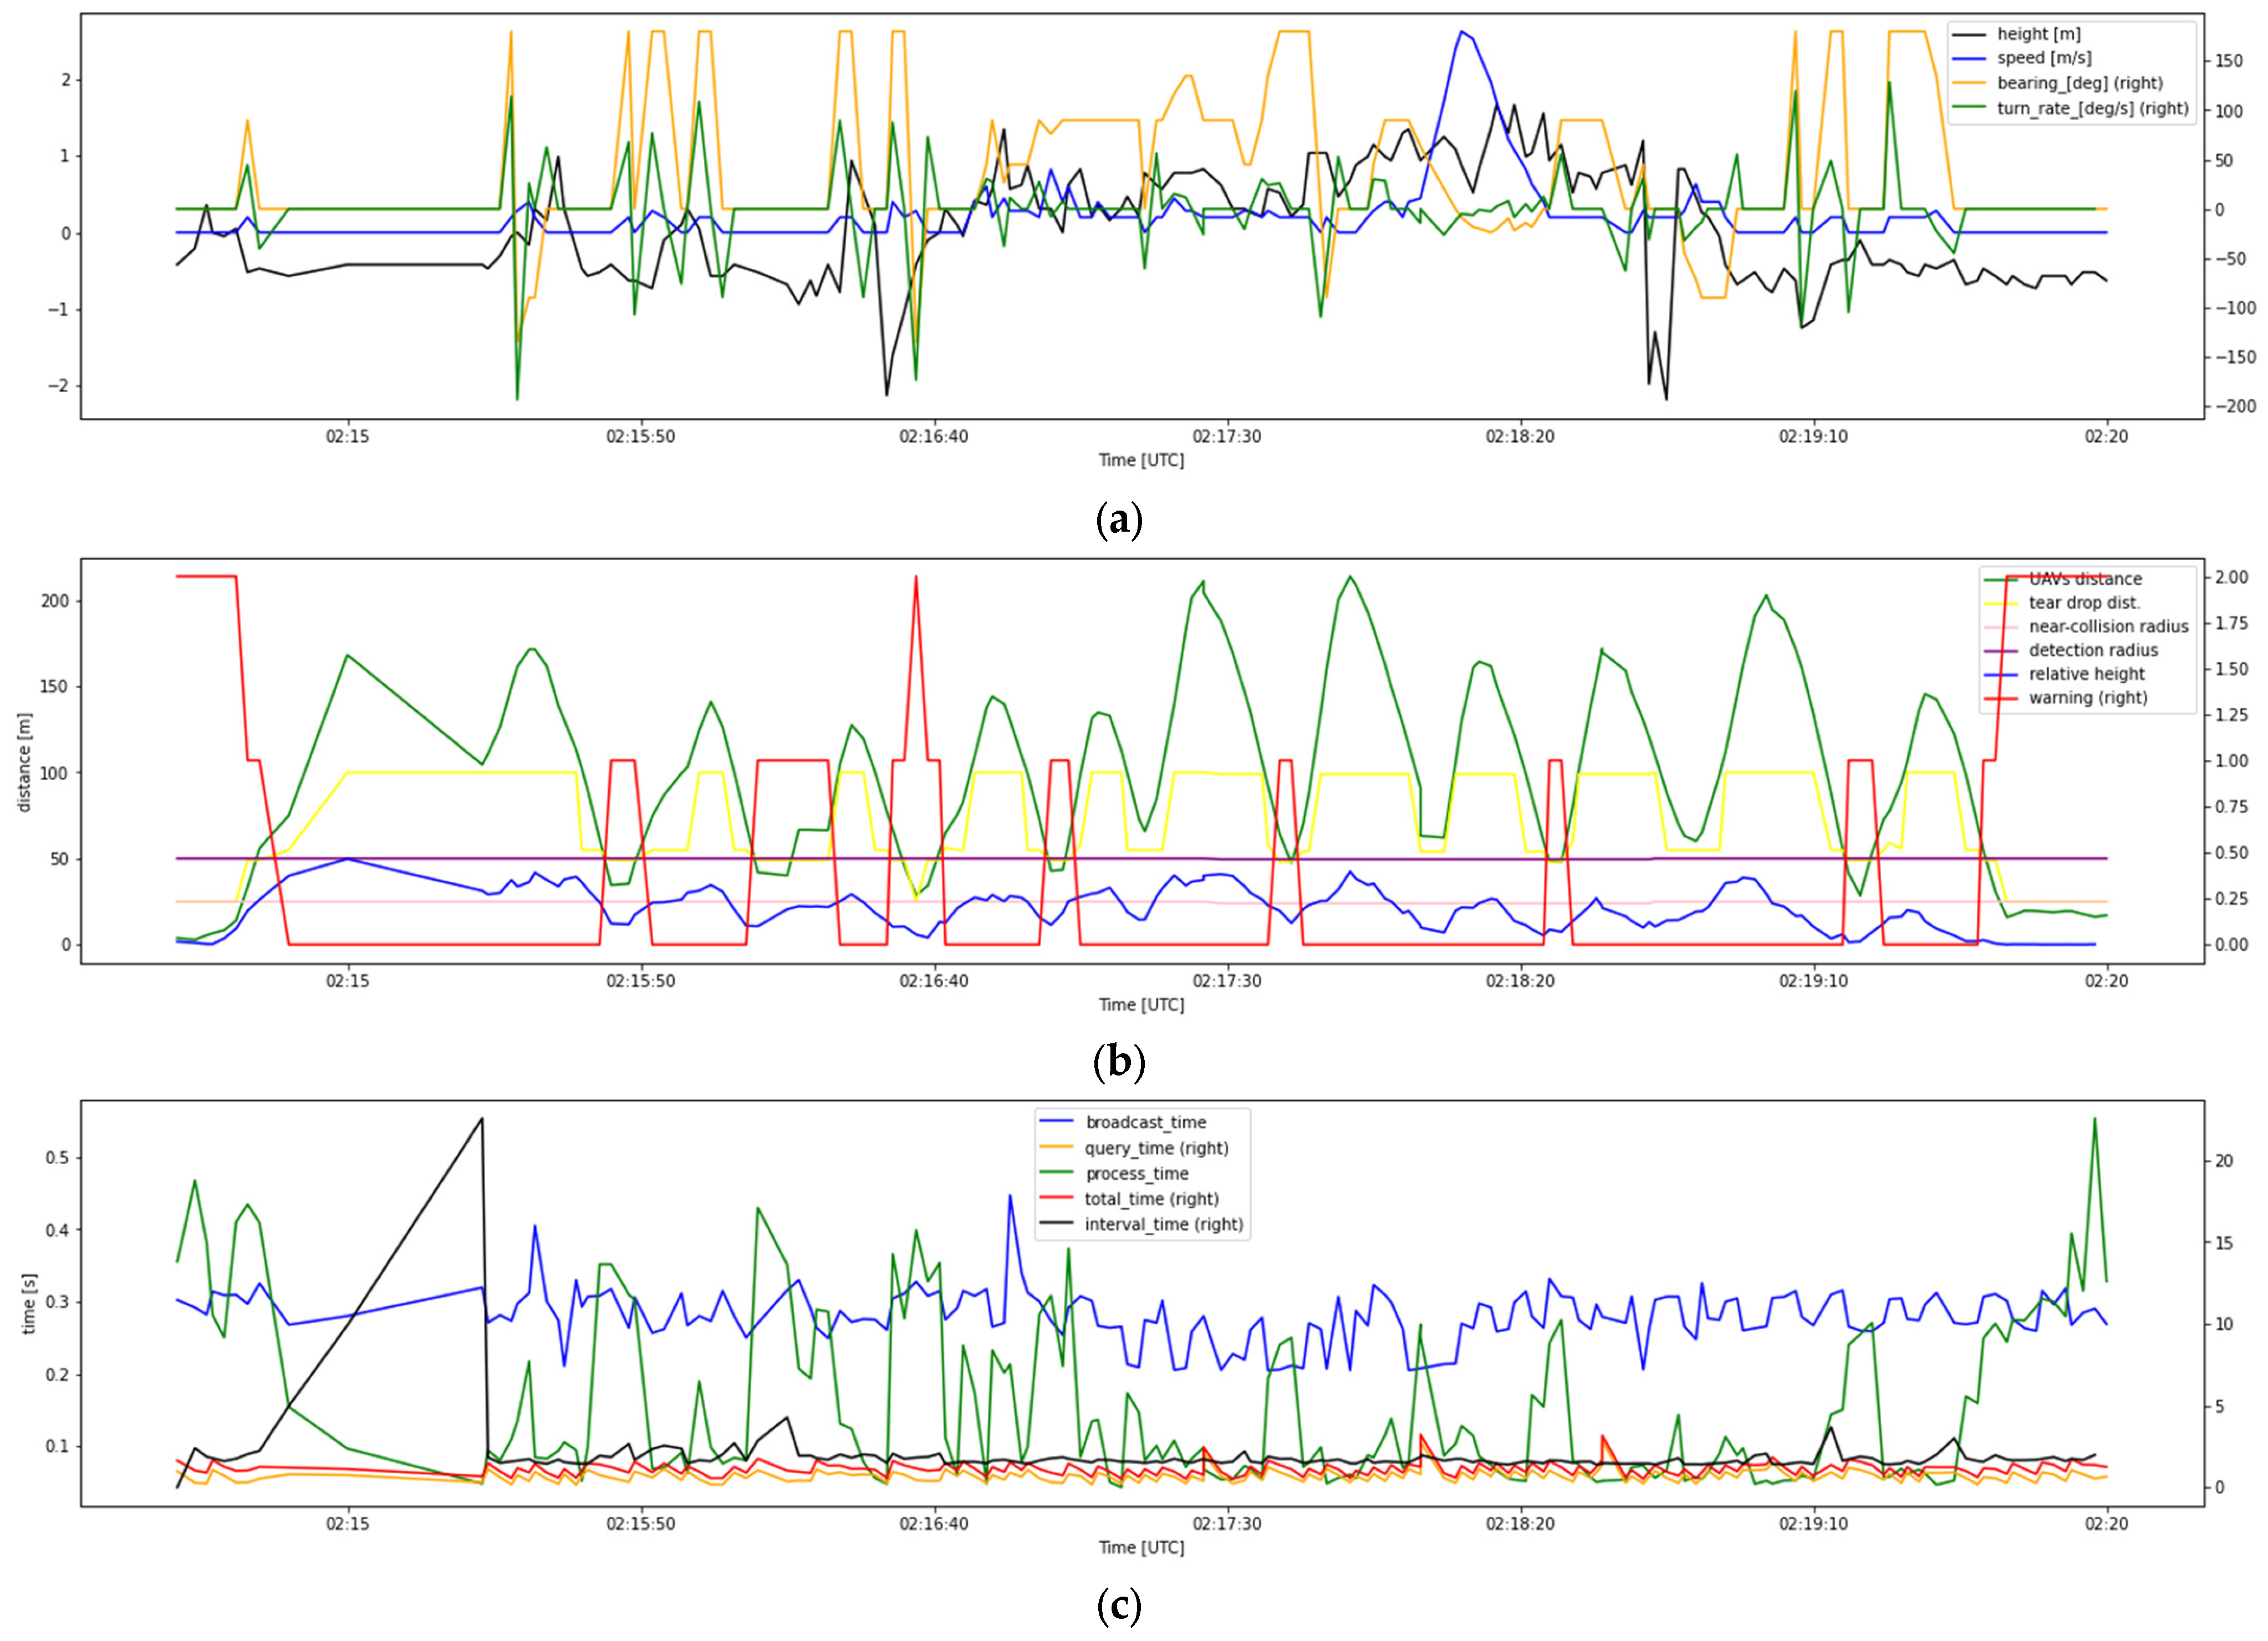
The flight data for our analysis came from the log file of the UTM monitoring application, which consisted of flight parameters and conflict detection parameters. The sample of the flight test trajectory from record number 8 is shown in Figure 9. Module 1 of the Remote ID flew in the Sky Surfer 1 and module 2 stayed on the ground. The flight test data is shown in Figure 10 and Figure 11. Each of the data is plotted in three subplots, which describe the flight parameters, detection parameters, and time parameters.
The flight parameter subplots in Figure 10a and Figure 11a indicate that UAV 1 flew at a height between 10 and 50 m and a speed between 10 and 30 m/s. It also shows that UAV 1 executed several turns, as shown by the changes in its bearing and turn rate. However, the UAV 2 stayed on the ground with altitude and speed changes being very small due to noise in the GPS and accelerometer measurements. Due to this noise, the bearing and turn rate fluctuated. This condition is confirmed by the trajectory plot in Figure 8.
The detection parameter subplots in Figure 10b and Figure 11b show that UAV 1 moved toward the position of module 2 of the Remote ID and then moved out for several rounds to exercise a conflict detection process. Since the location of module 2 of the Remote ID was near the take-off and landing points, the warning level 2 (near-collision event) is shown at the beginning and the end of the plot. At some points during the flight test, the distance between UAVs was closed enough to trigger a detection warning (warning level 1). At this point, the UTM system produced a warning sound and the color changed in the UI display. When the pilot managed to avoid conflict, the warning faded. However, in some events, the UAVs were so close that they penetrated the near-collision area, which was indicated by a near-collision warning (warning level 2).
The third set of subplots in Figure 10c and Figure 11c shows the latency time or latency time, which consisted of the broadcast time, query time, and process time. It also shows the interval time between data transmission. At a certain point, the query time was very large, up to 5 s, which, in turn, affected the latency time. Furthermore, we found a large interval time at the beginning of the flight that resulted in a large trajectory gap, as indicated in Figure 8. The data indicate that the latency and interval data times varied over time due to the signal quality of the 4G communication used.
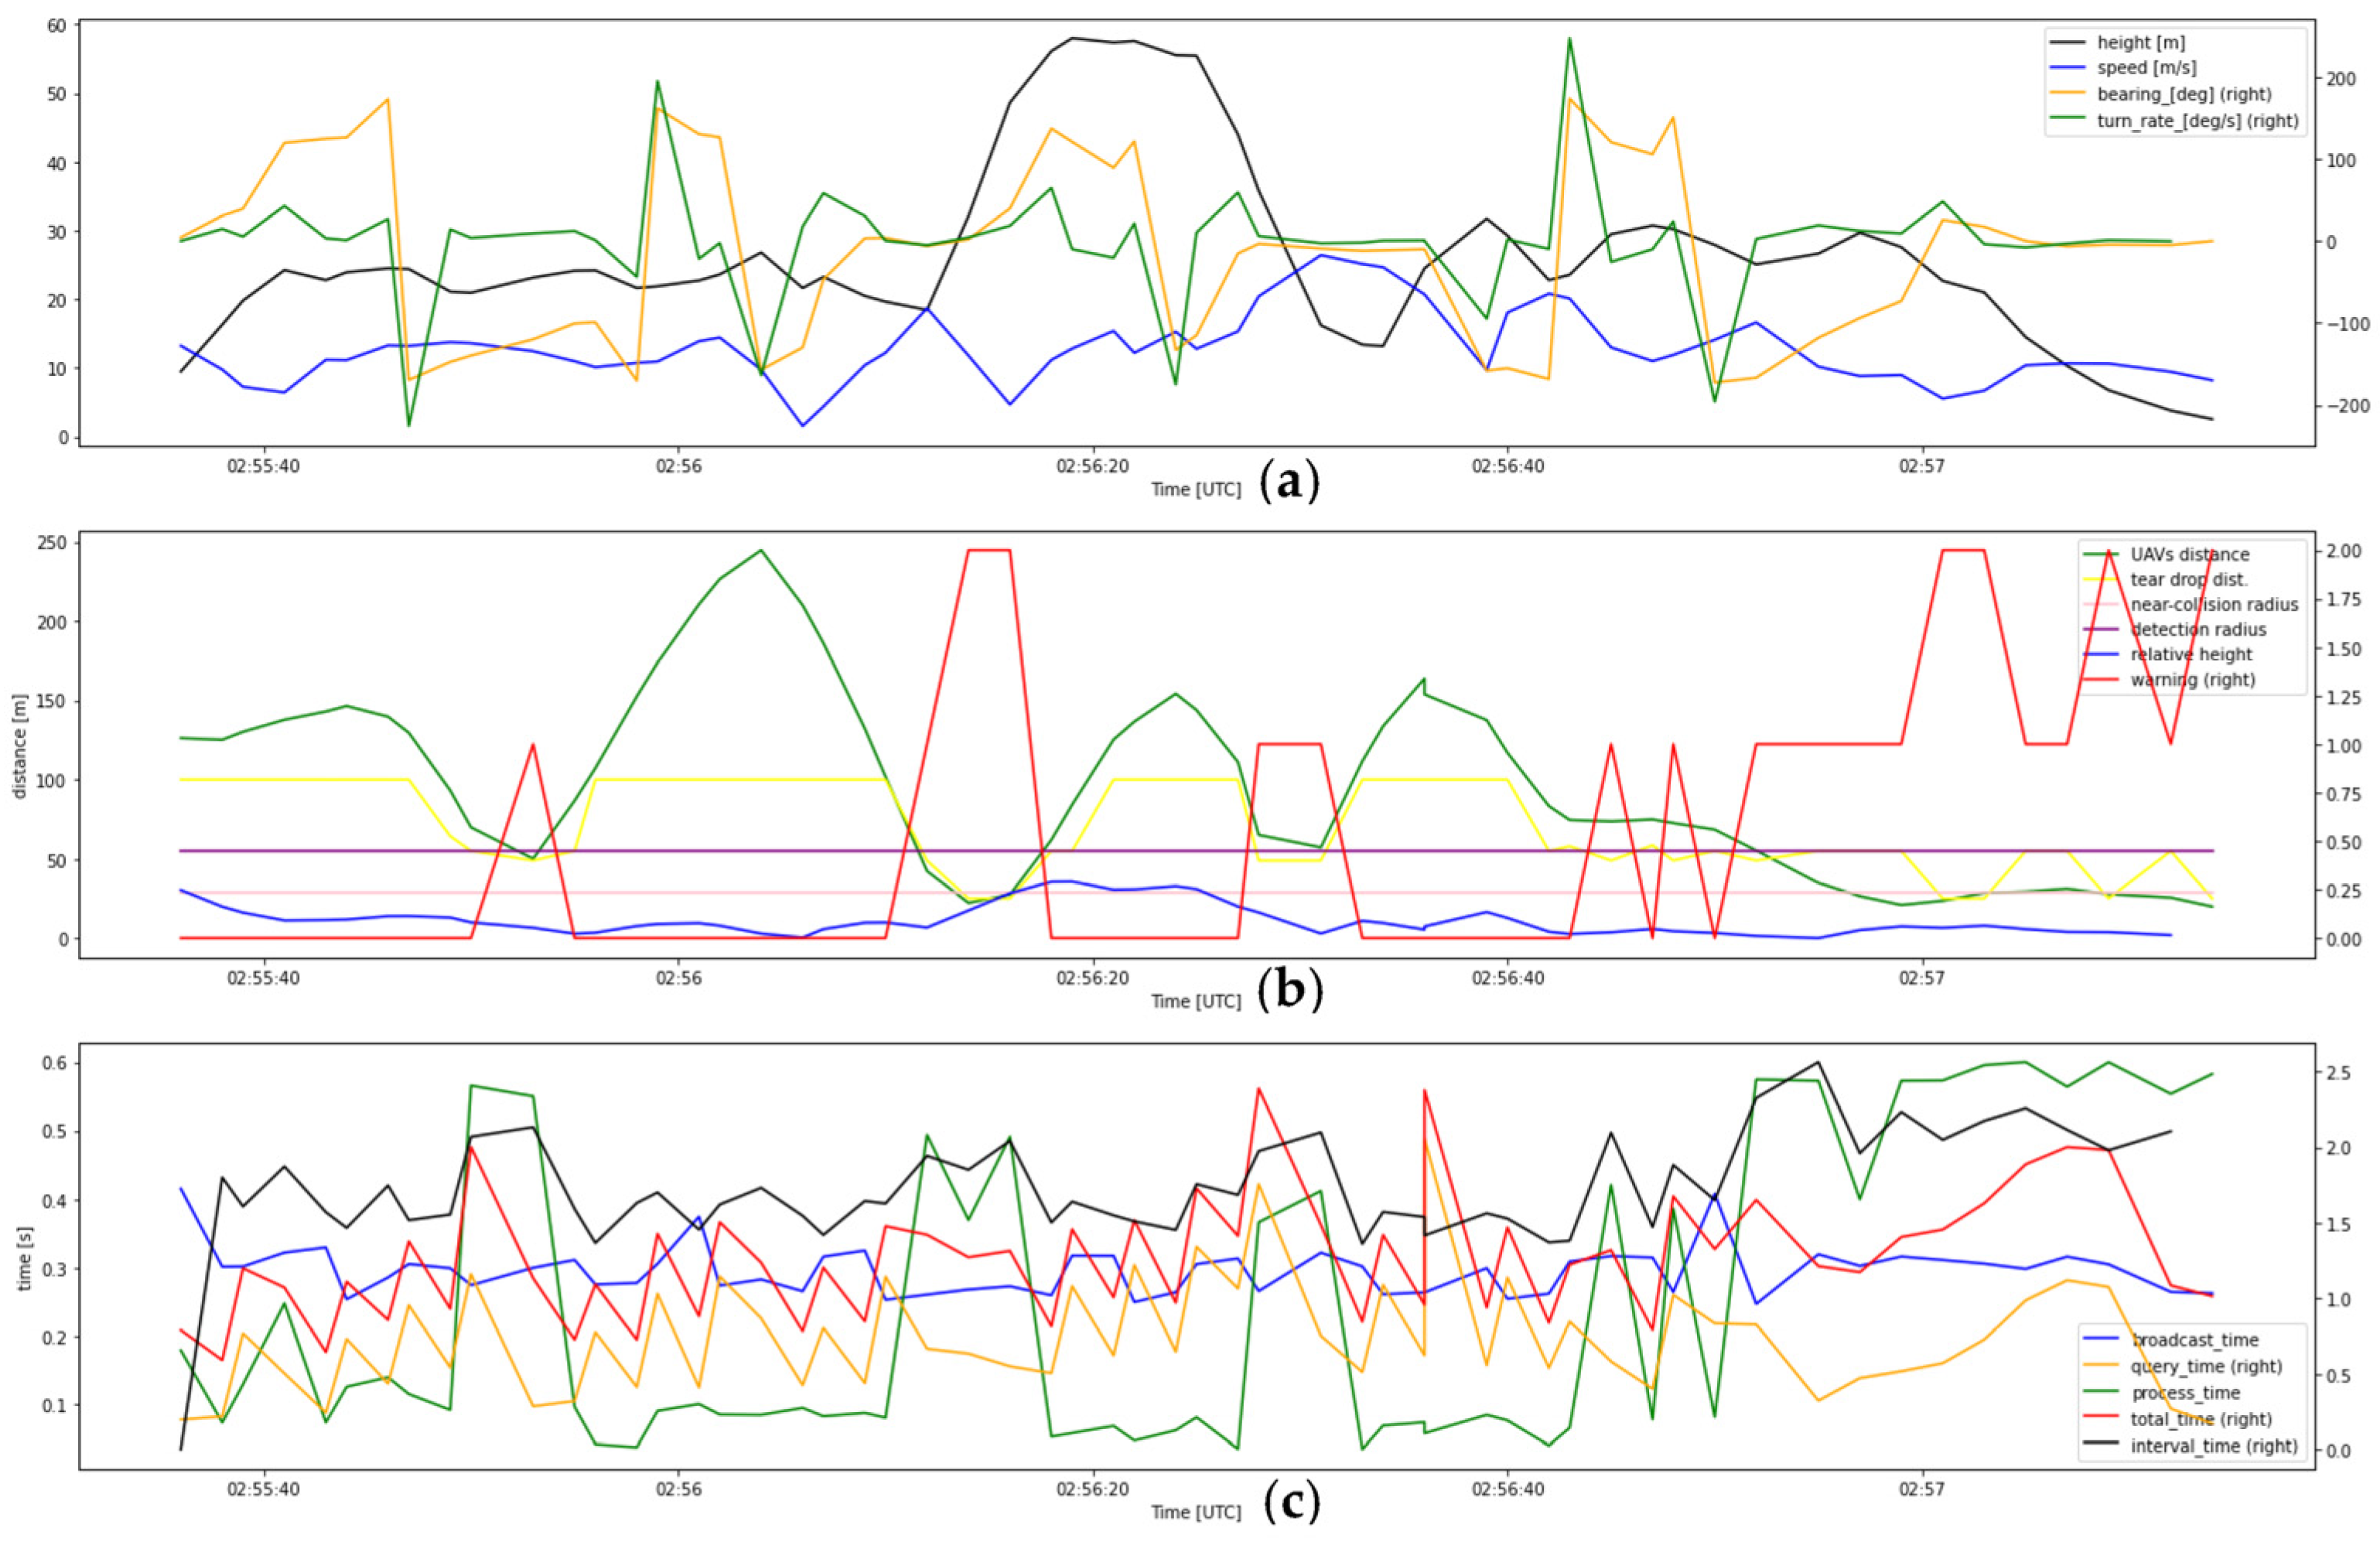
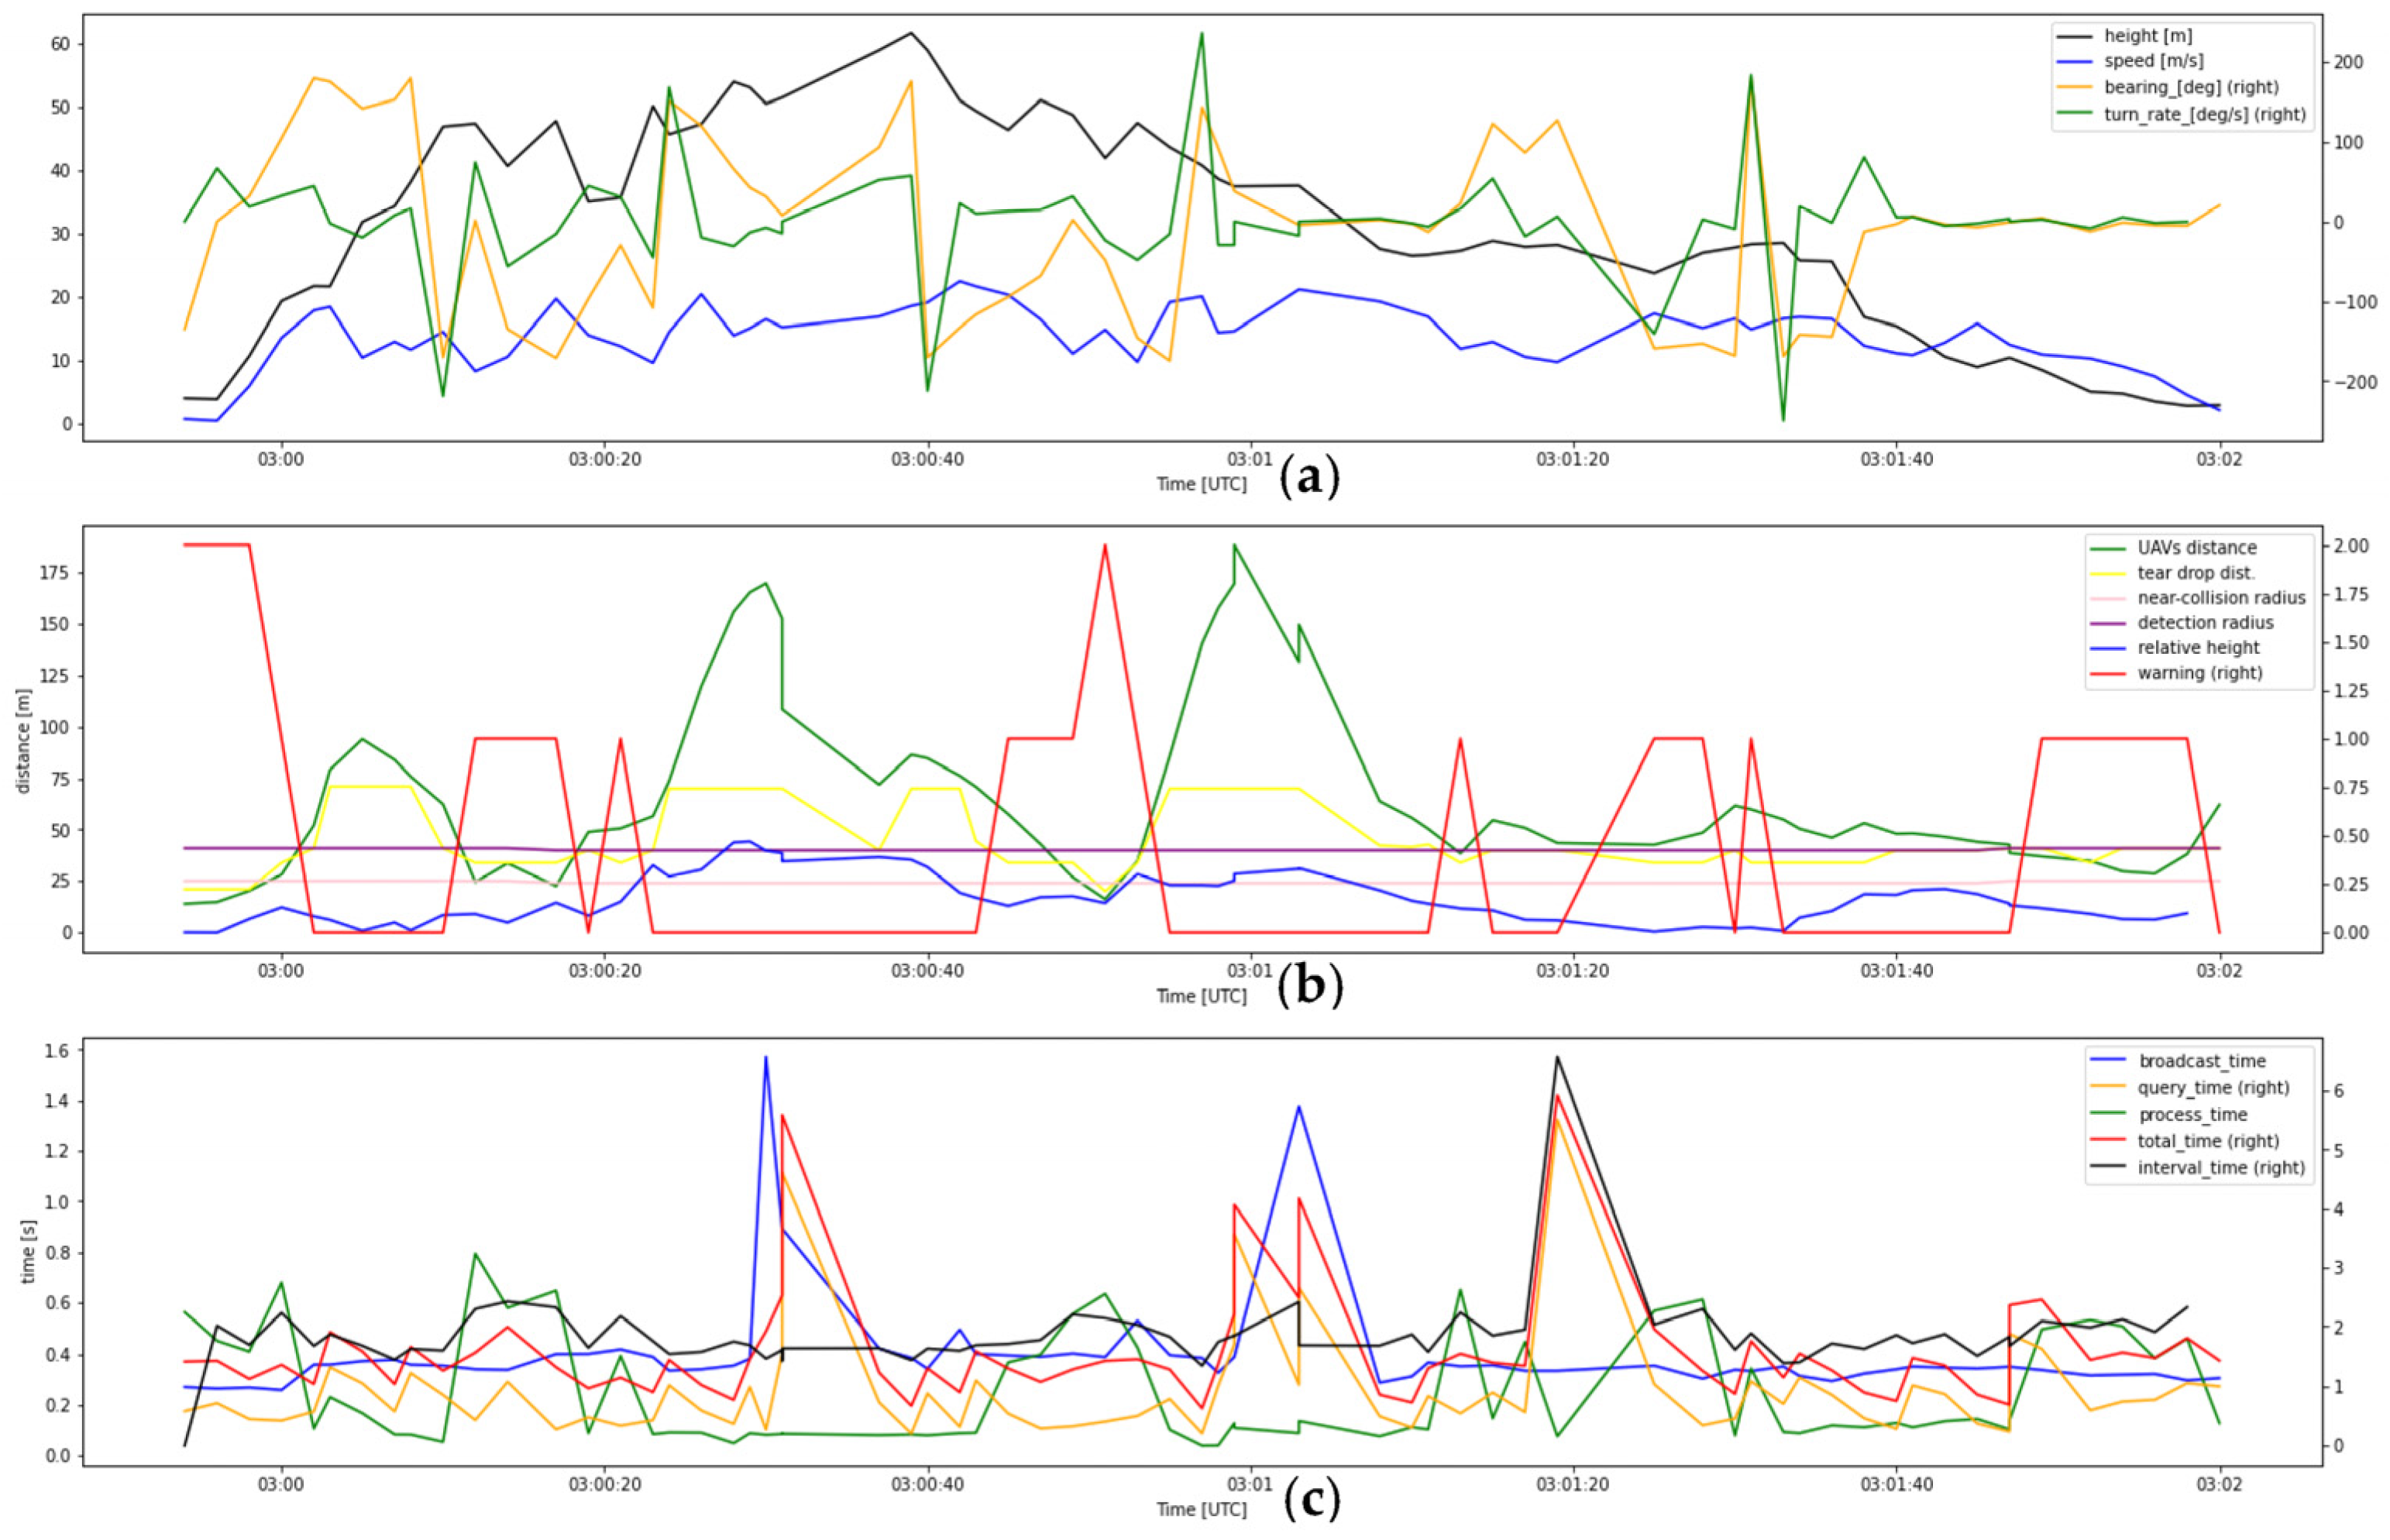
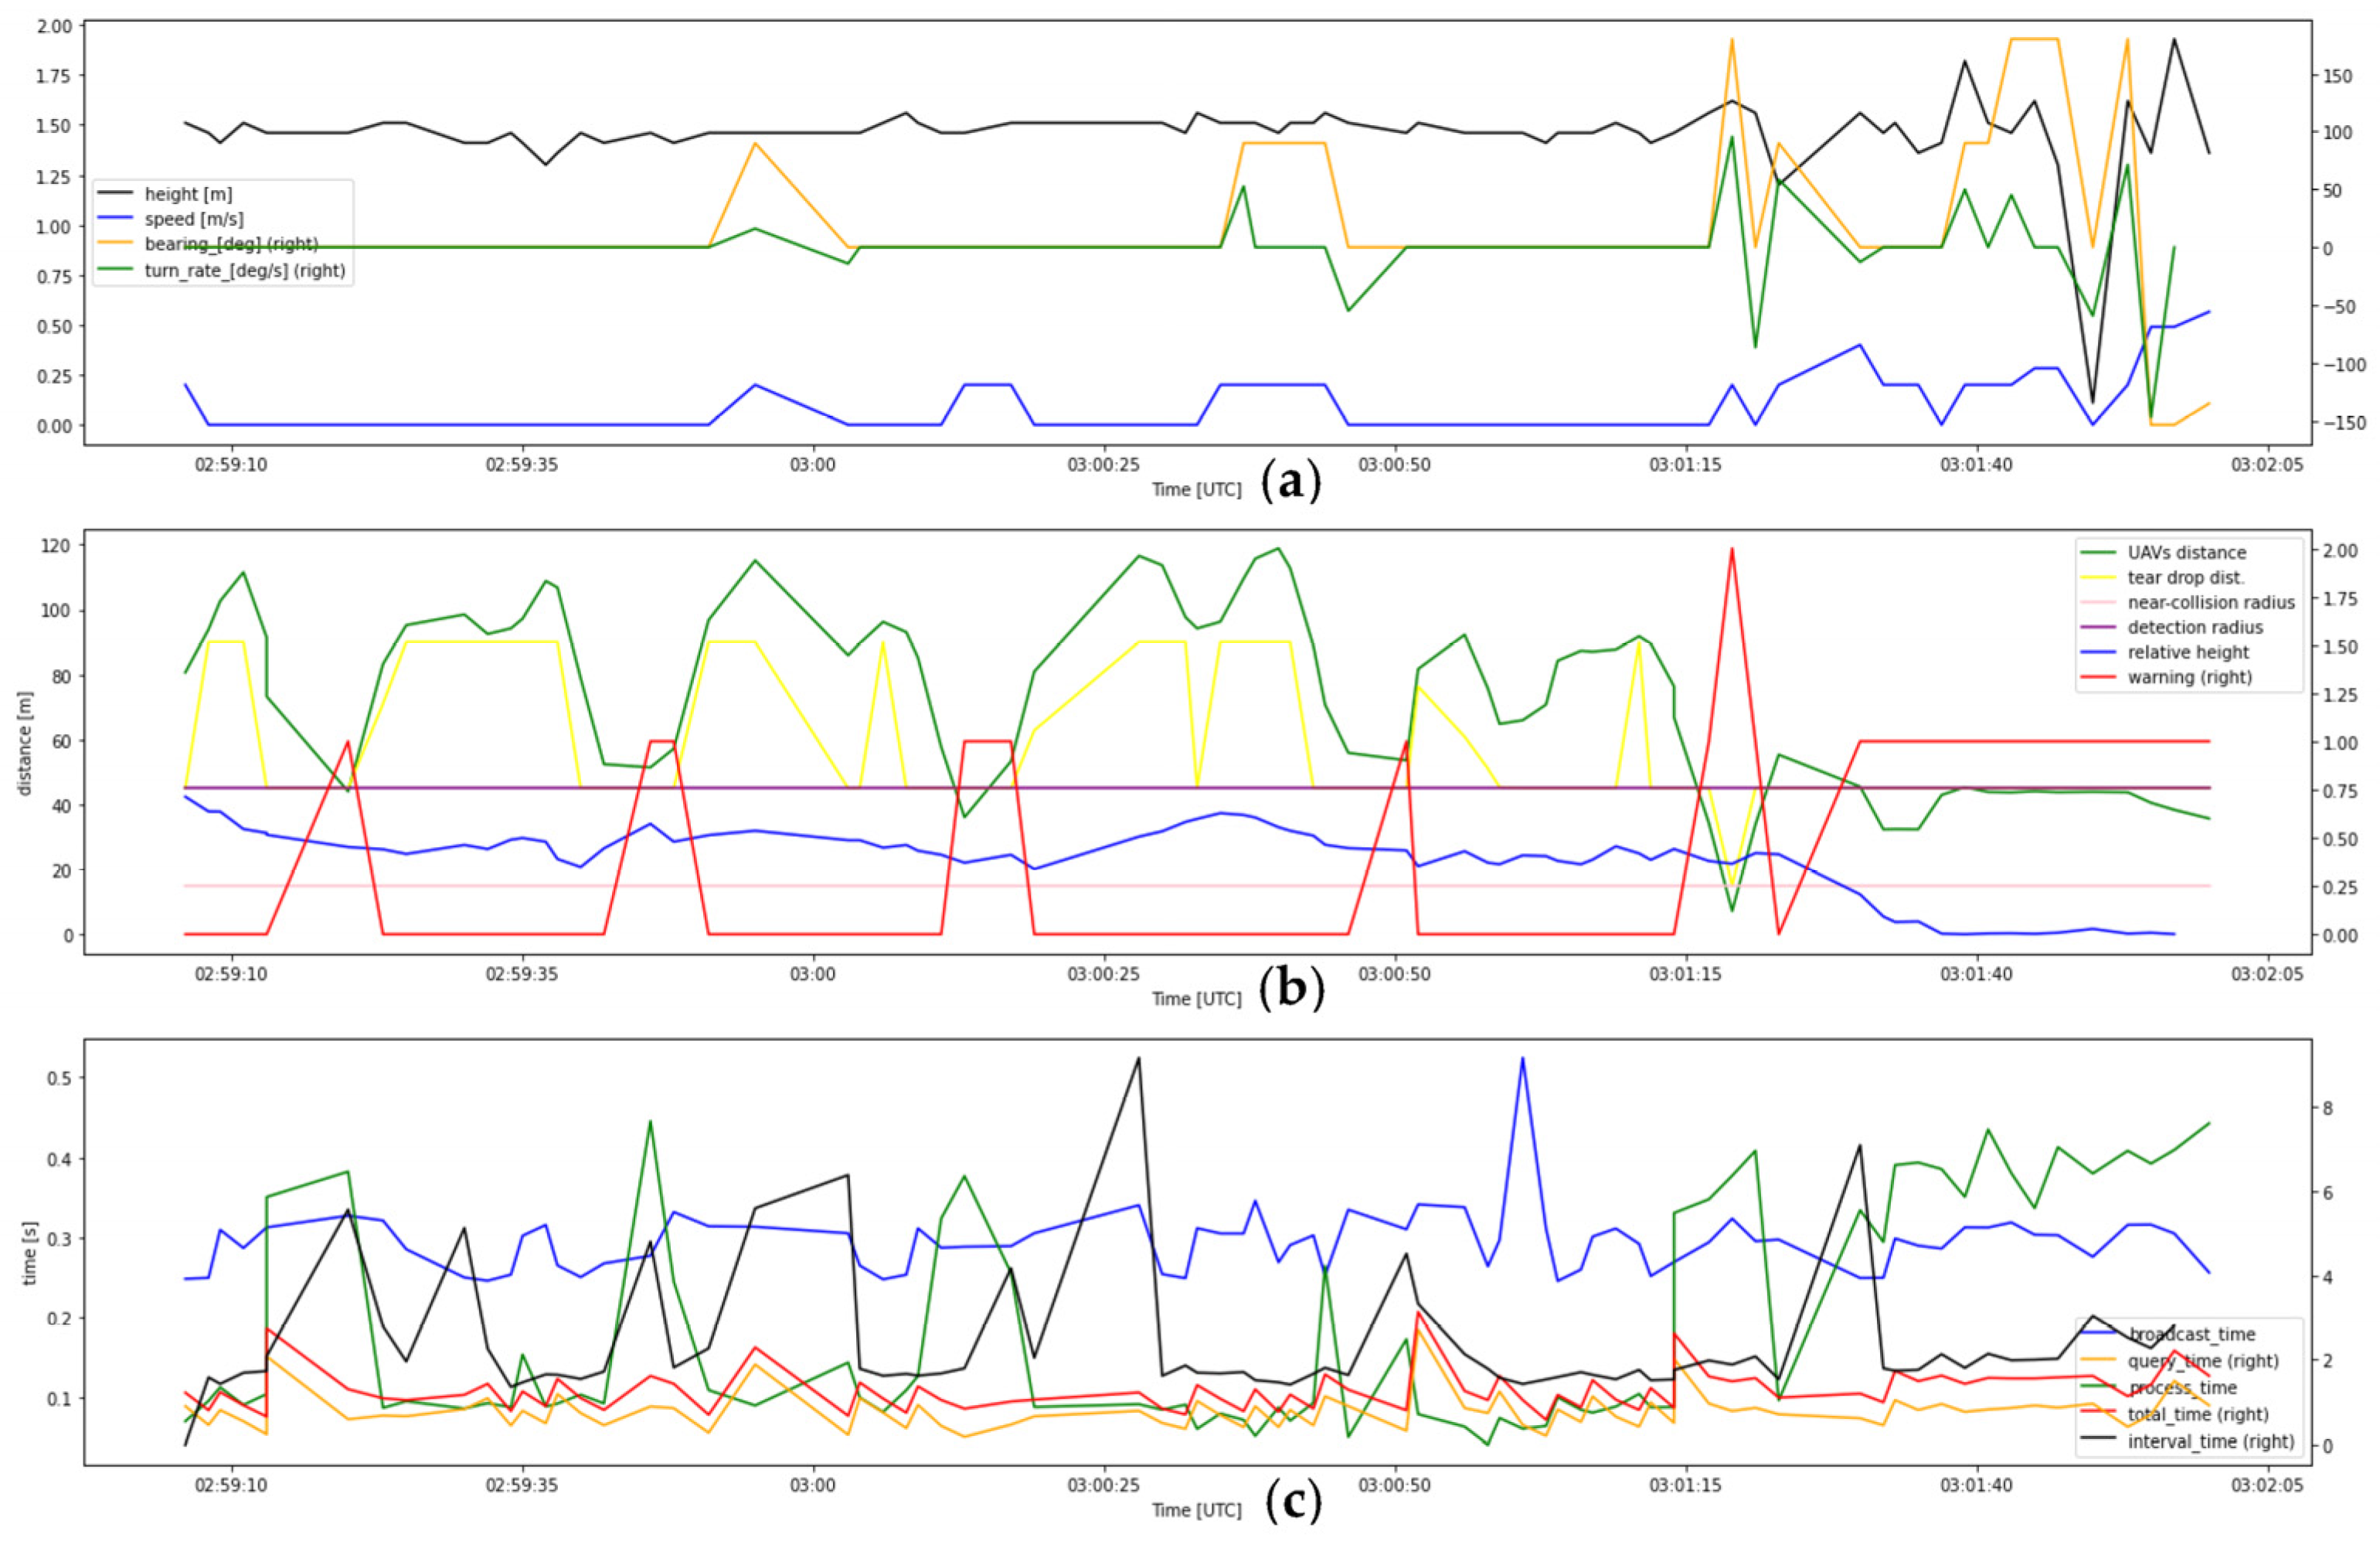
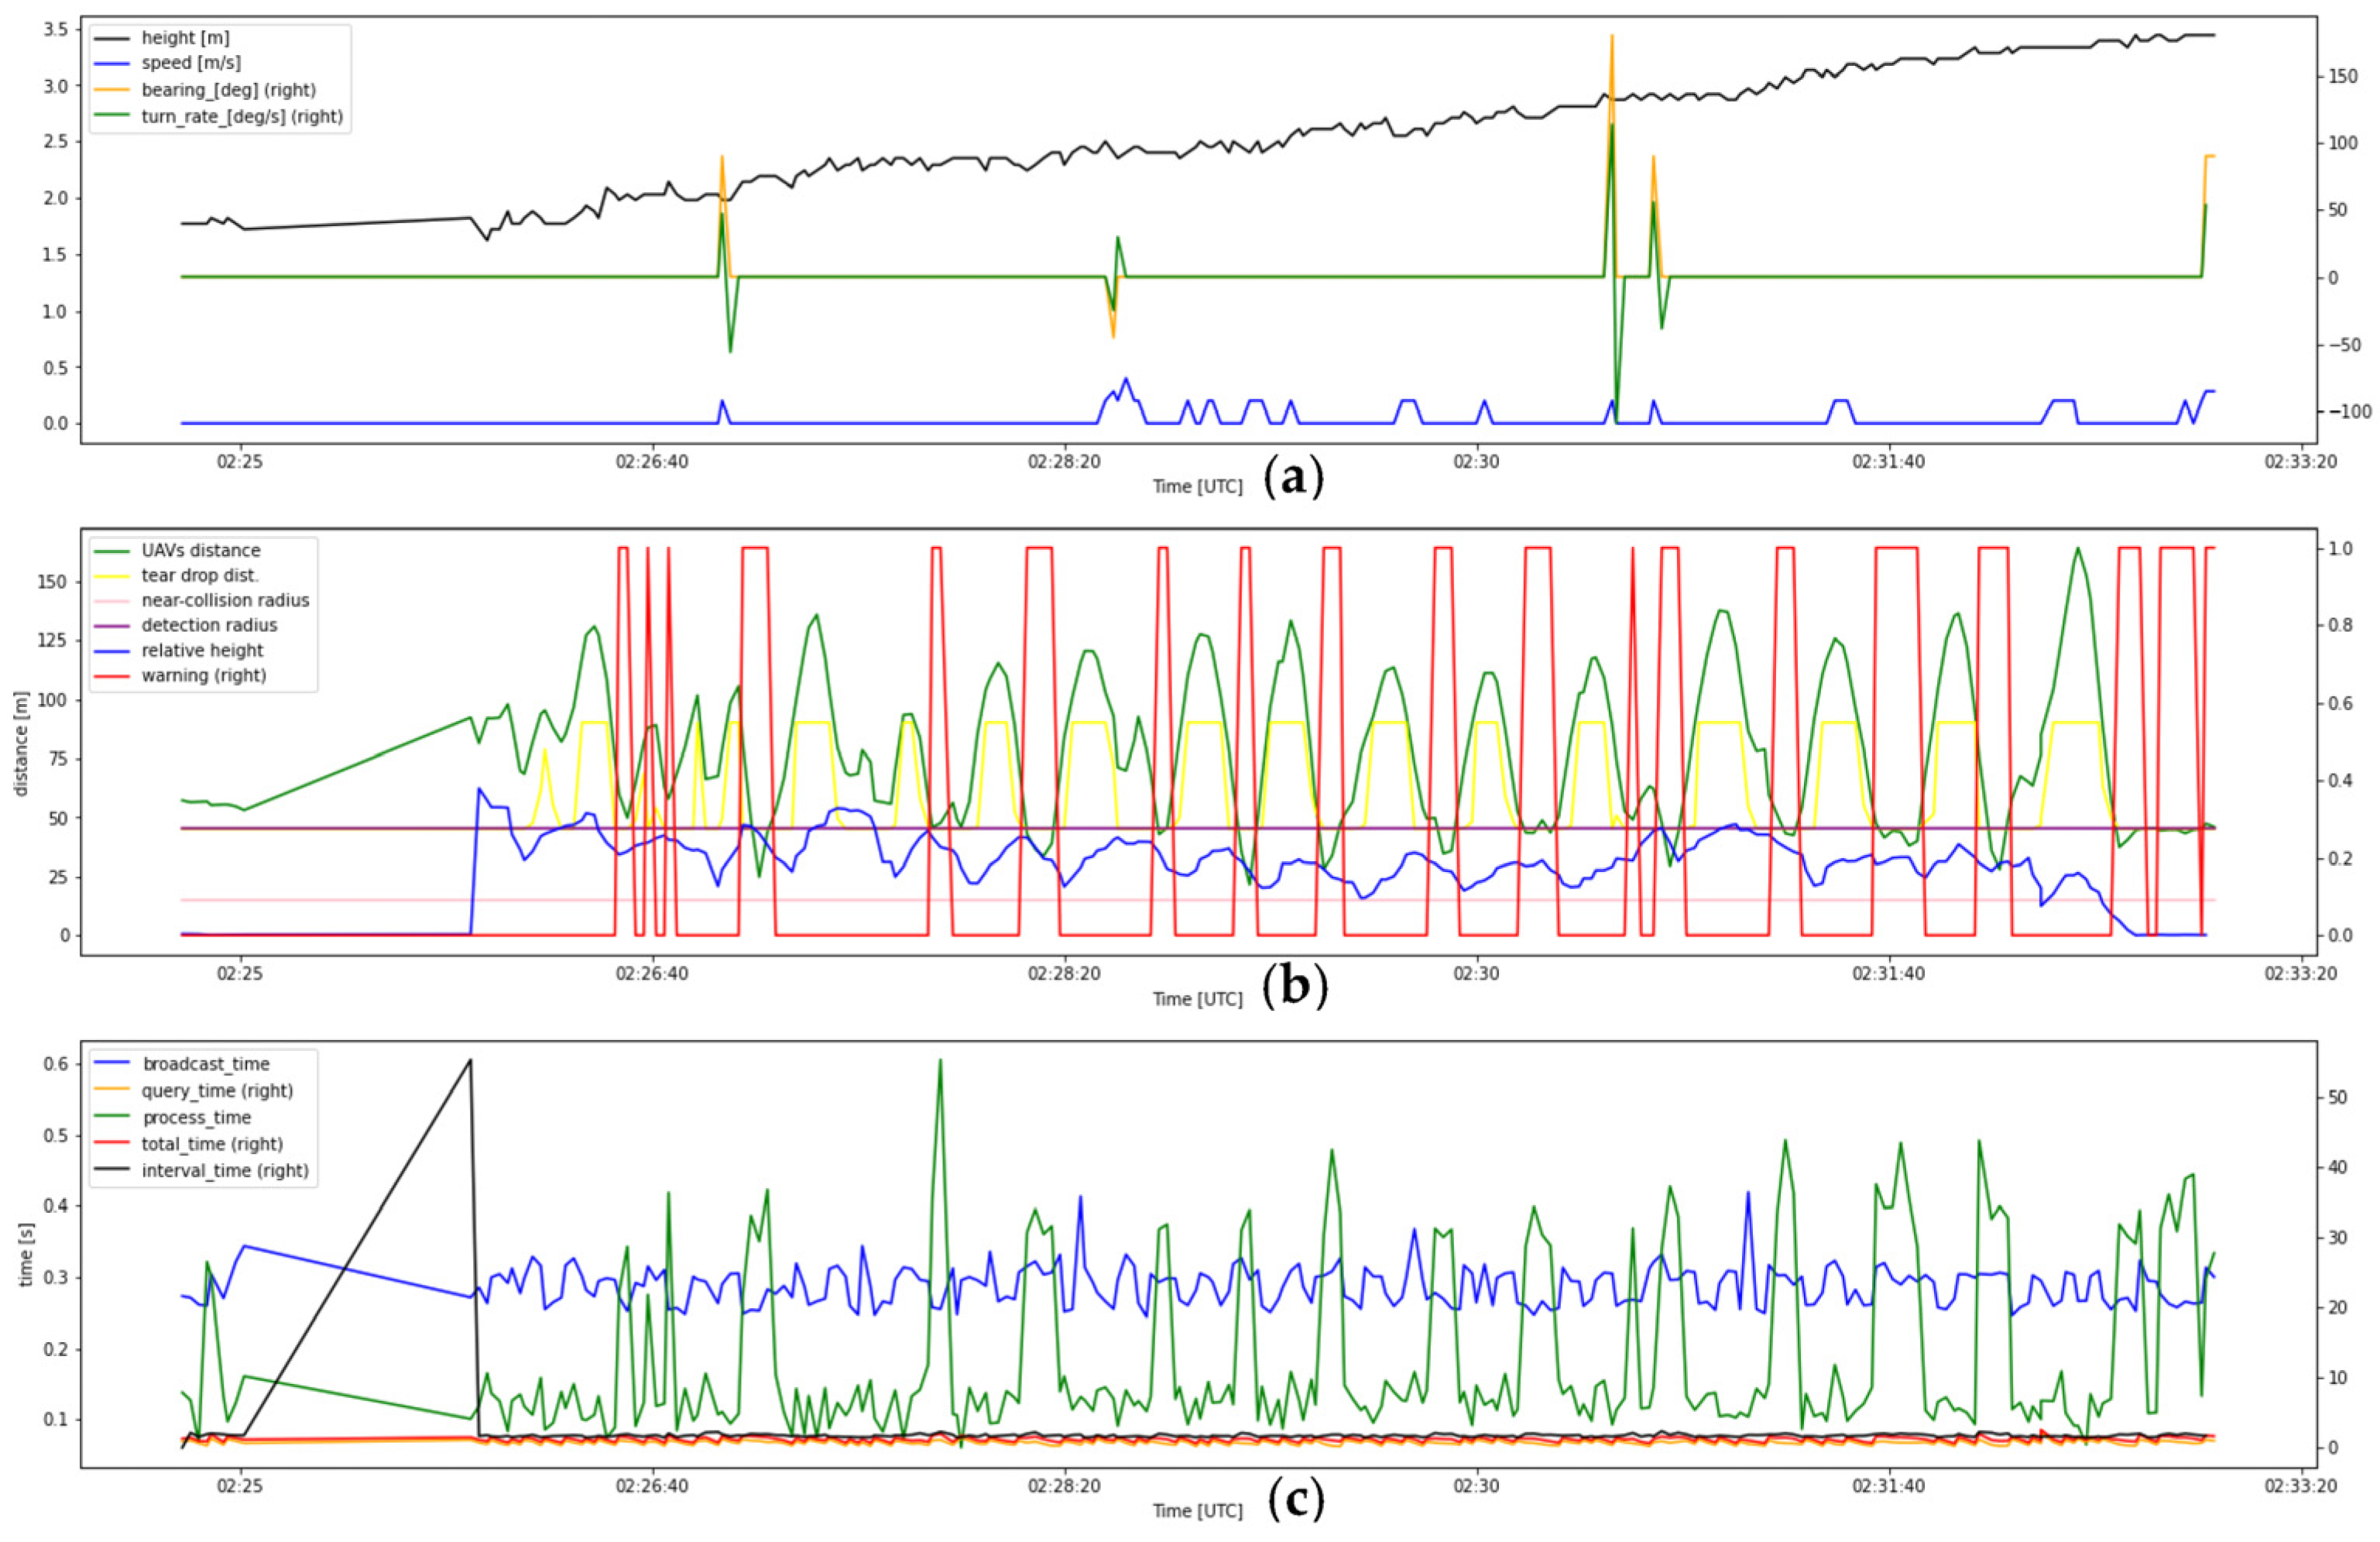
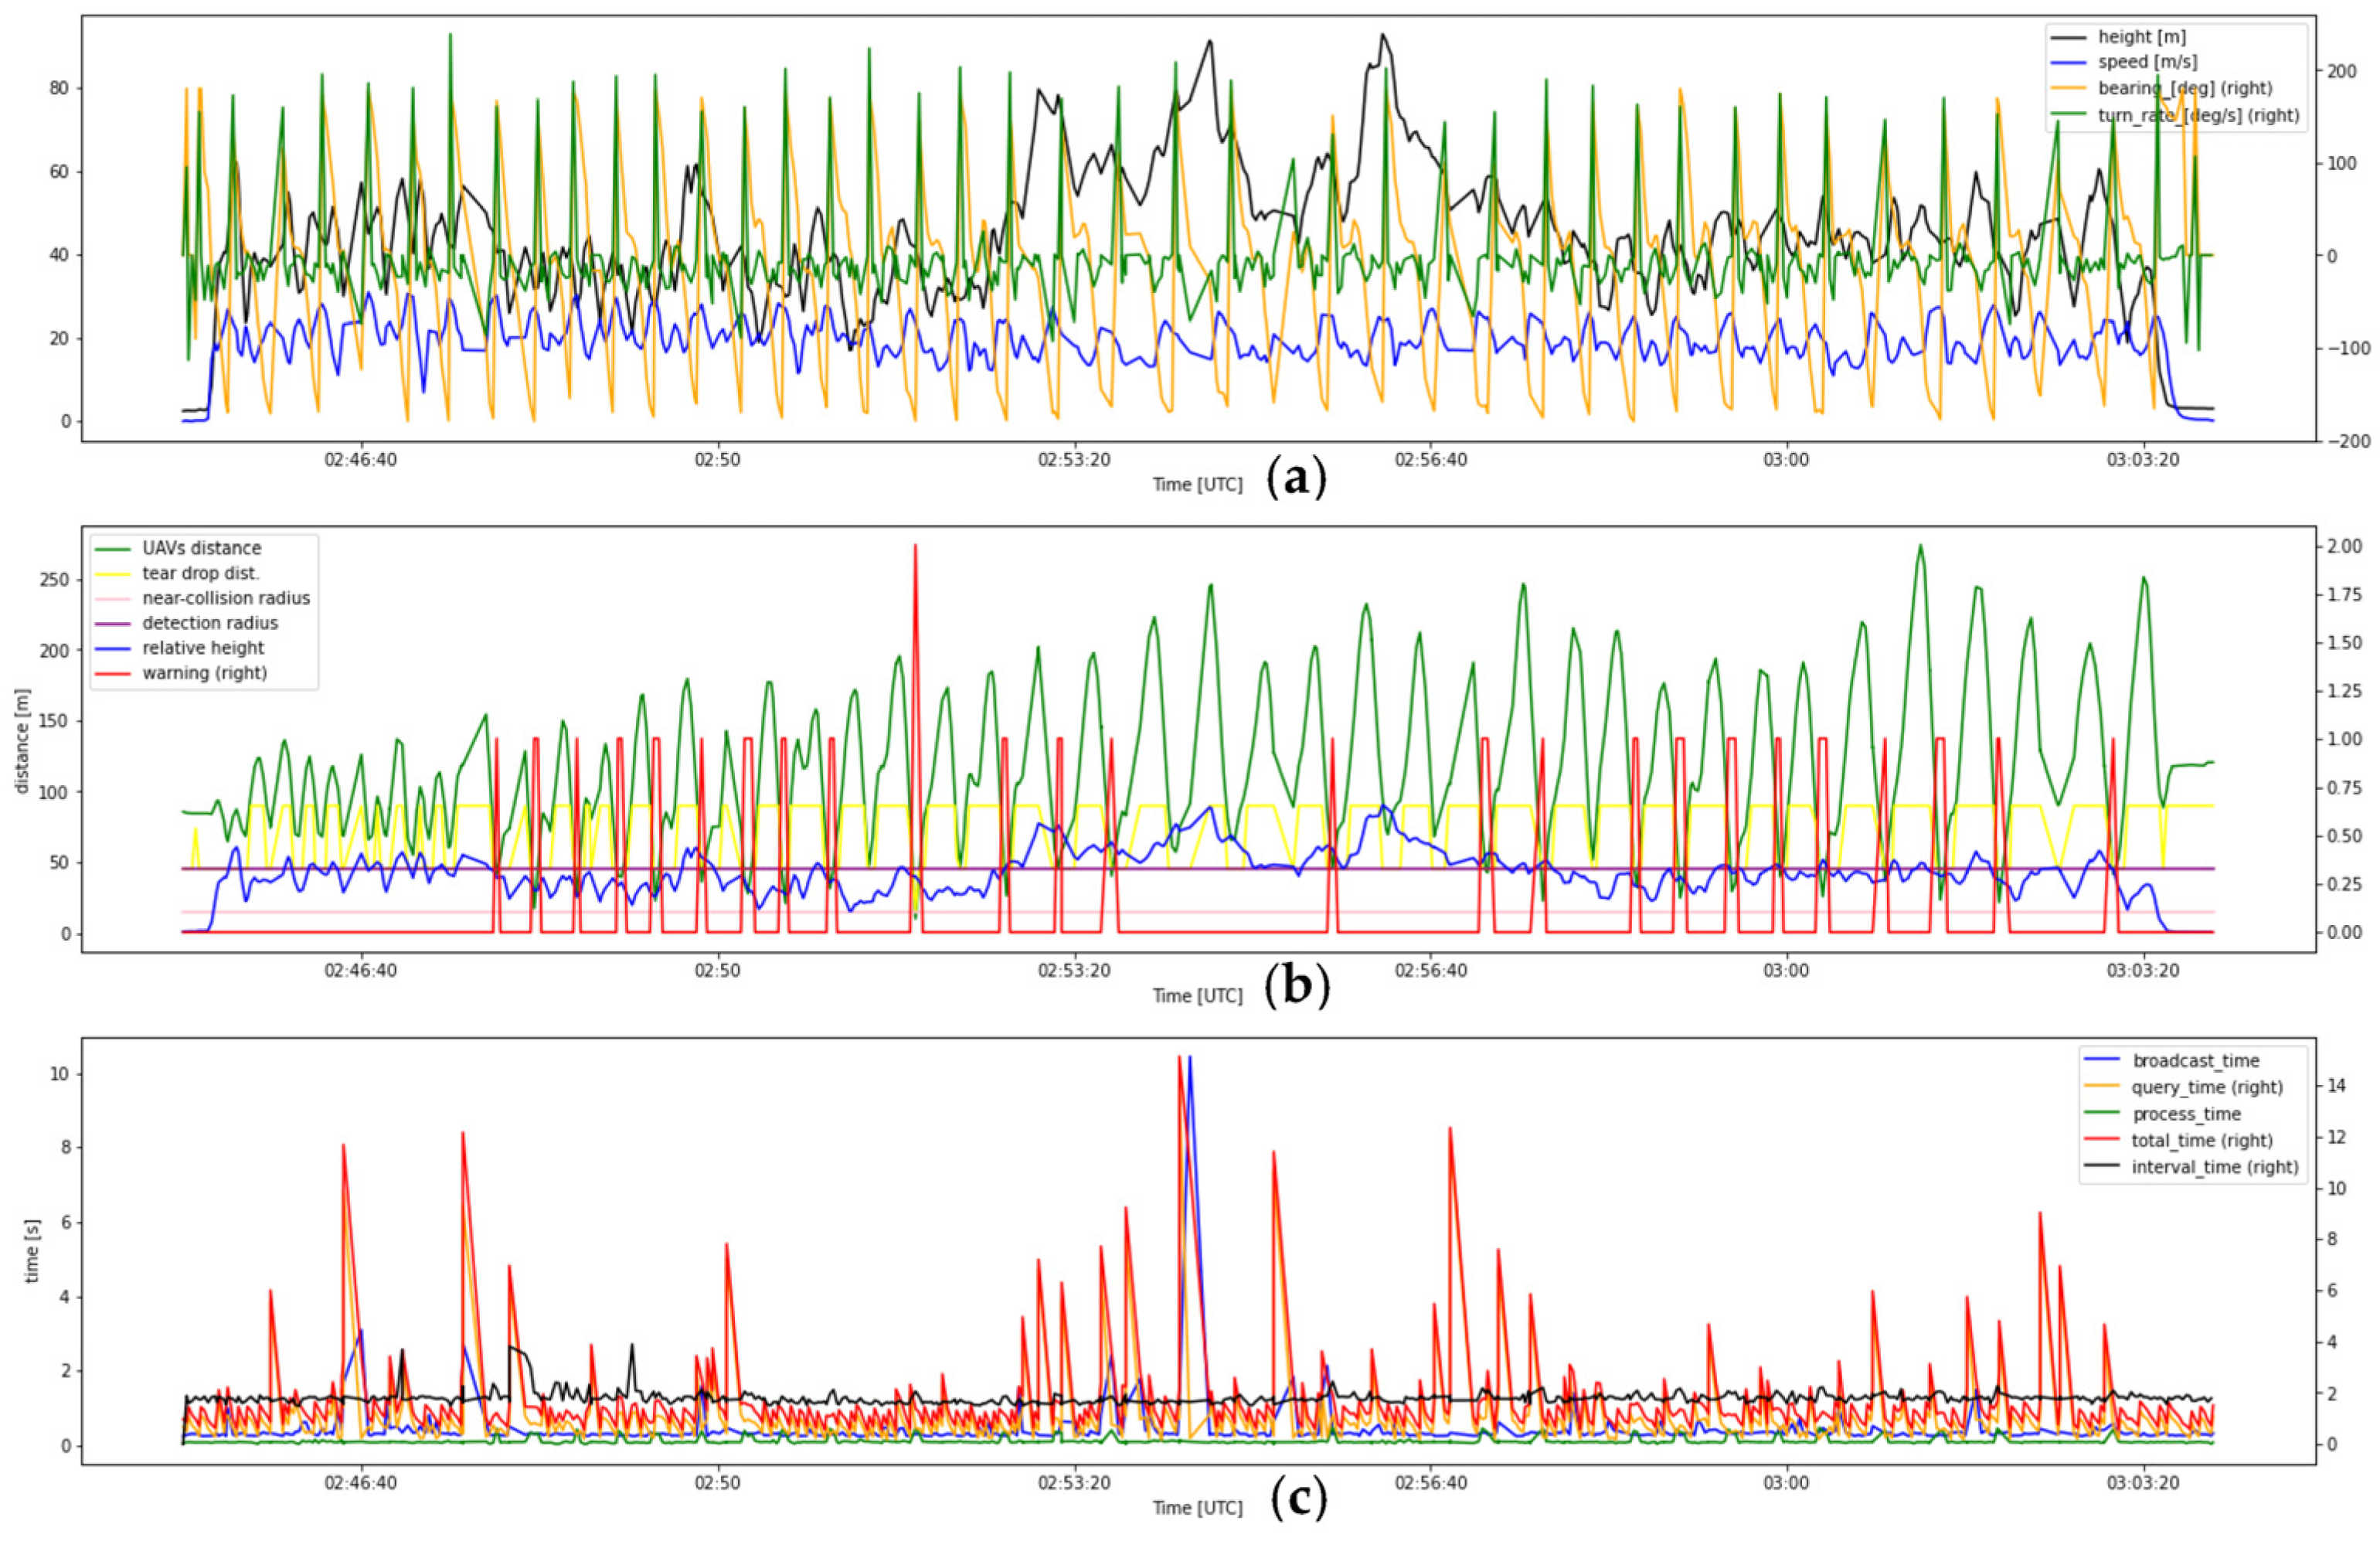
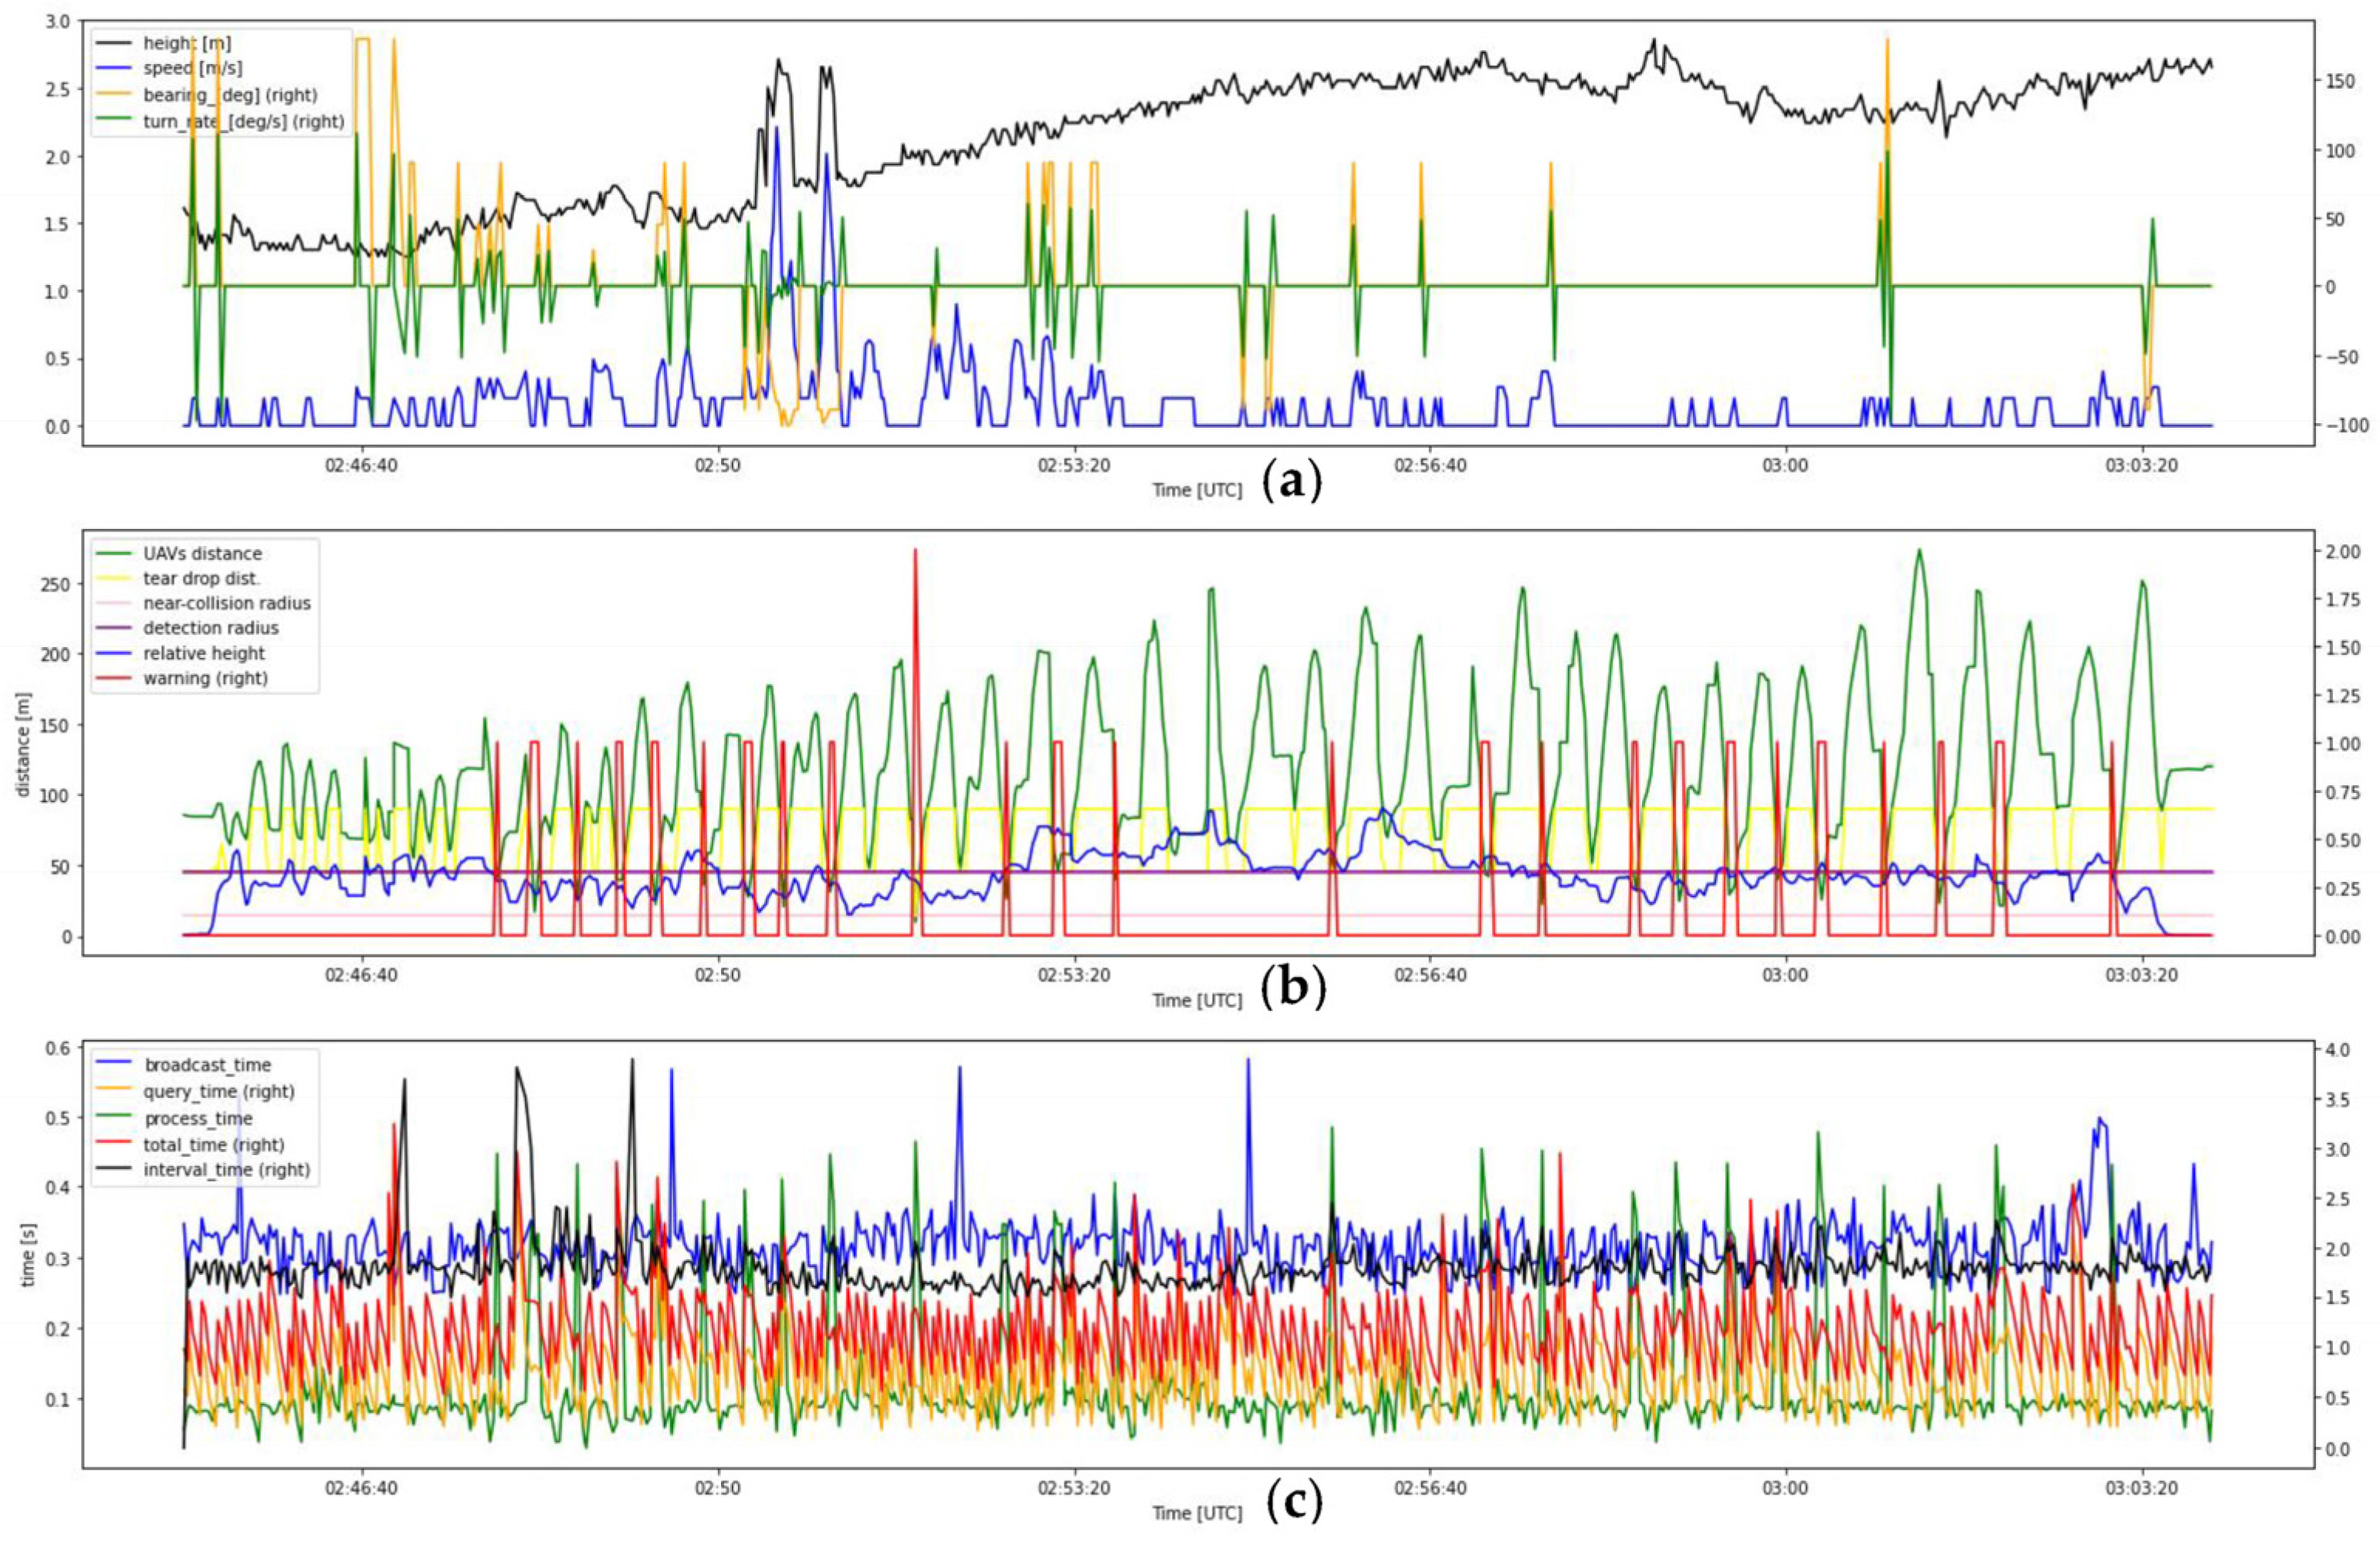
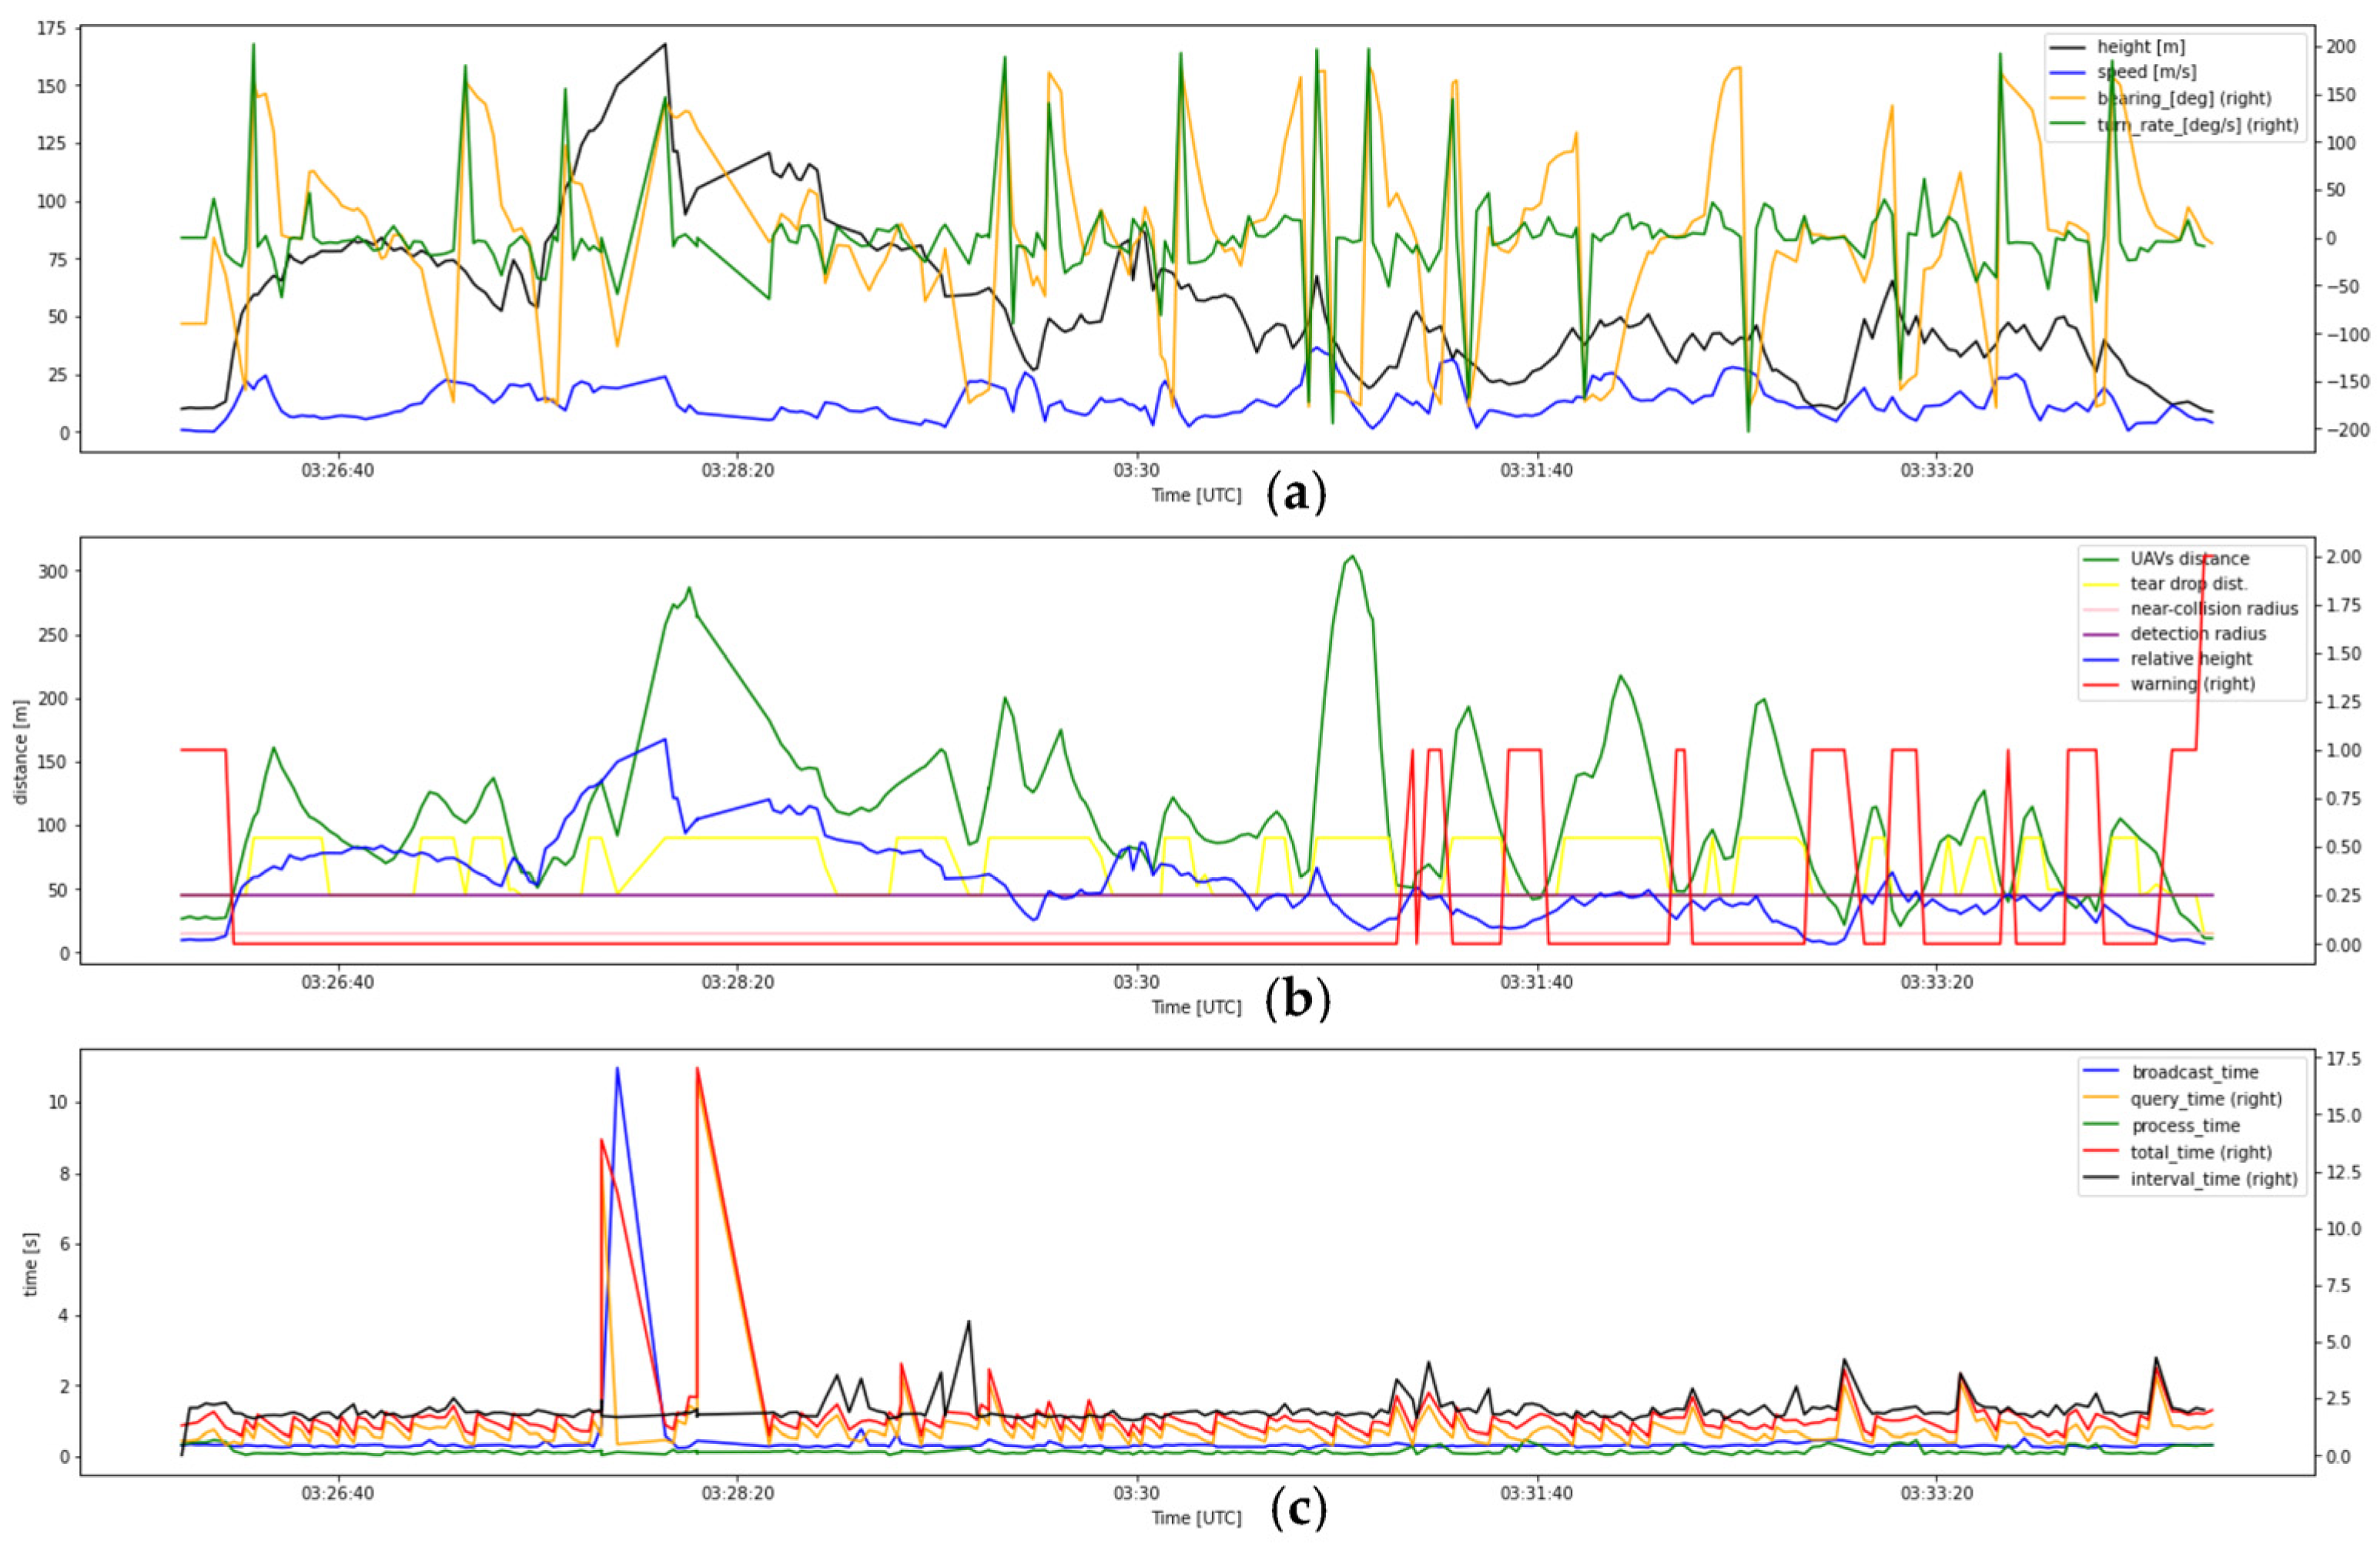
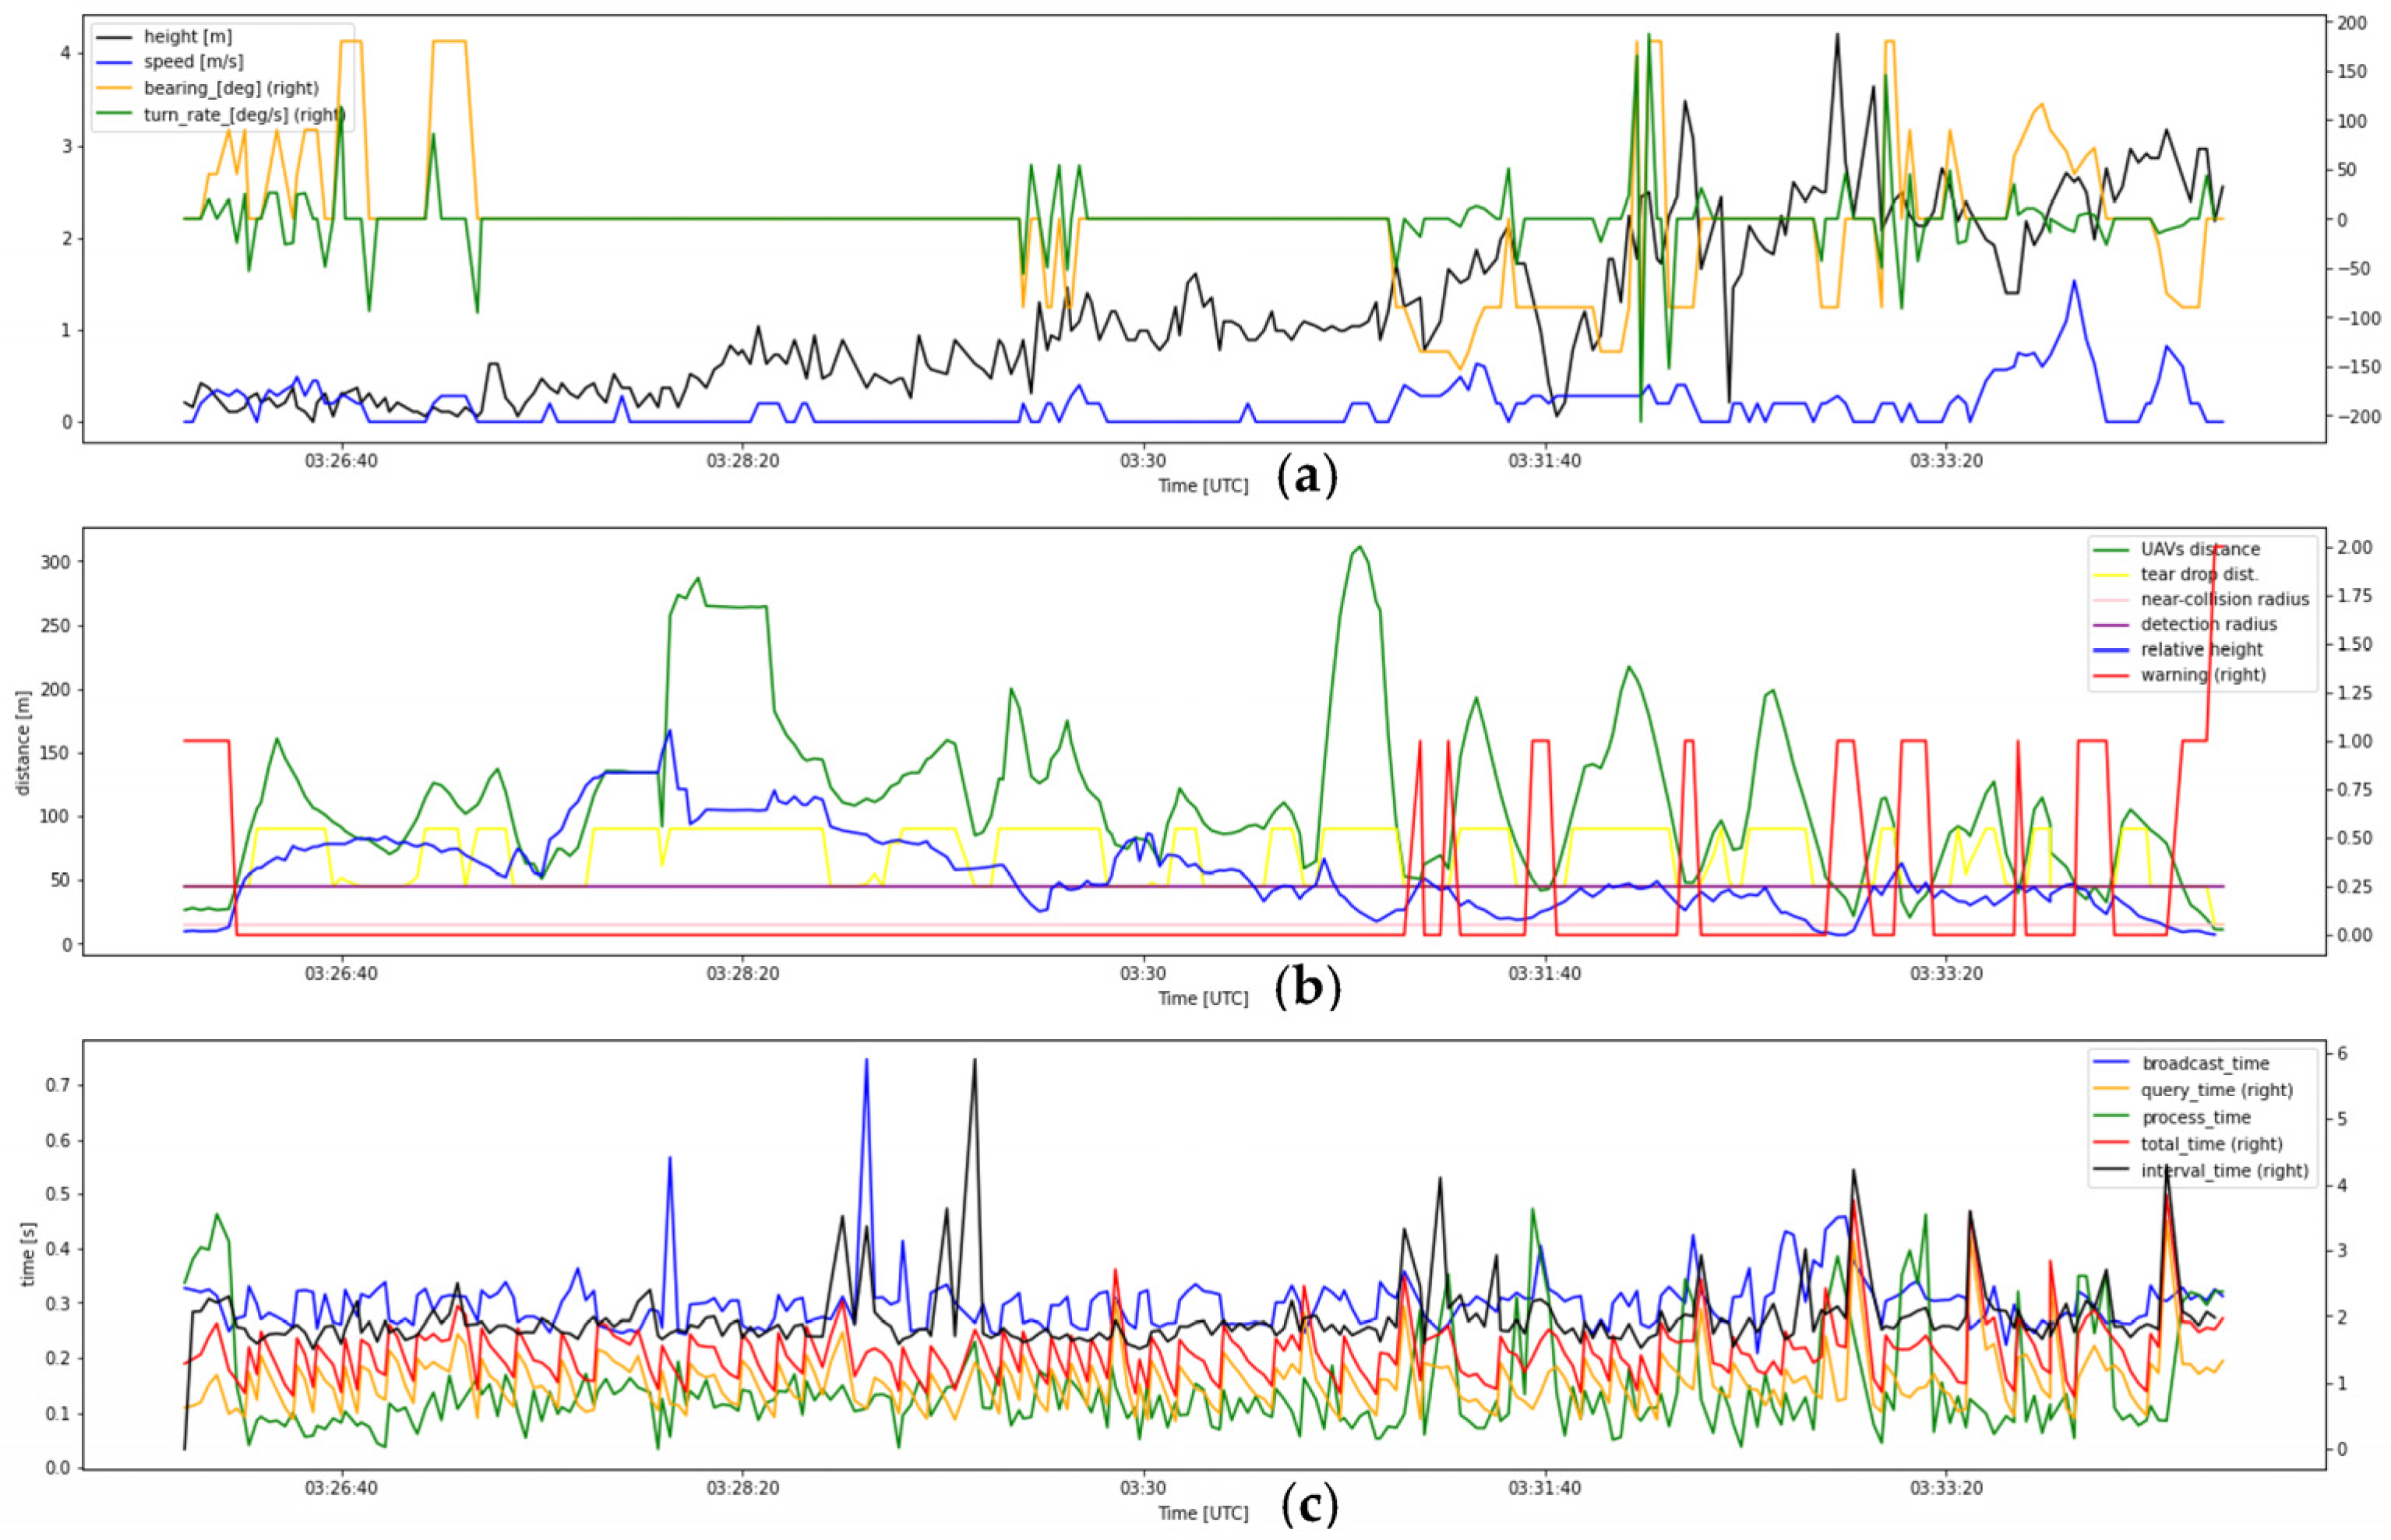
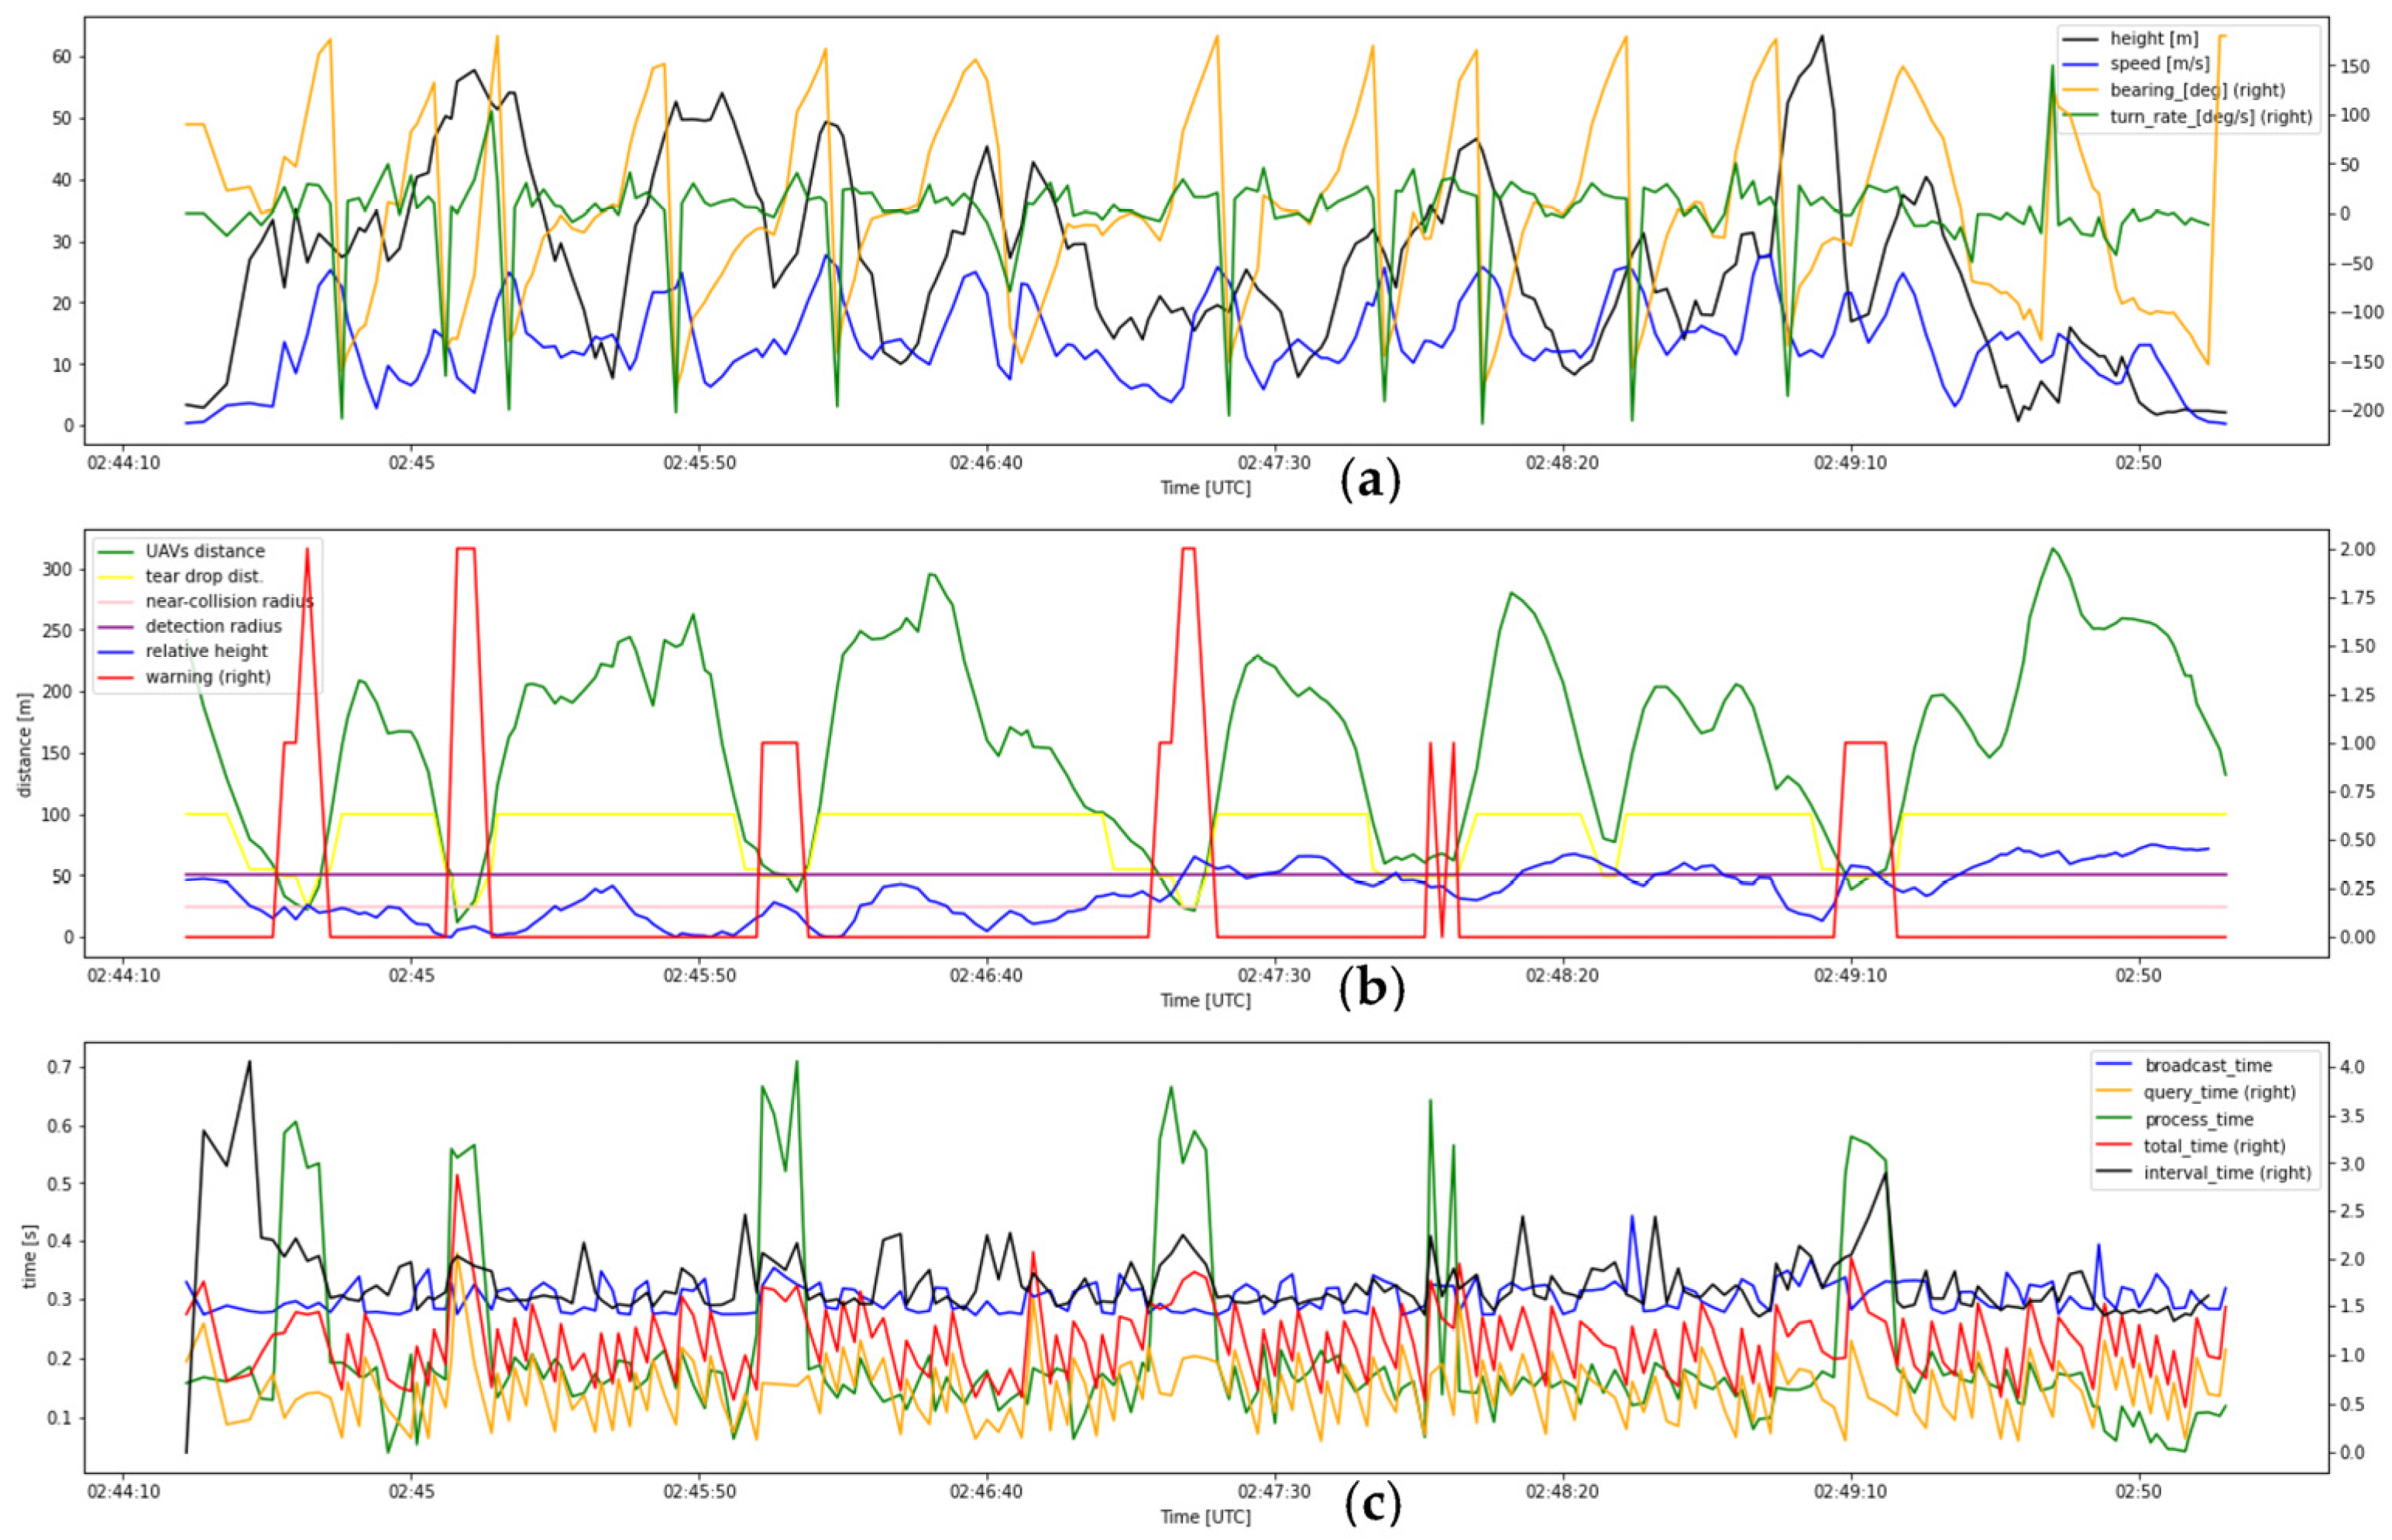
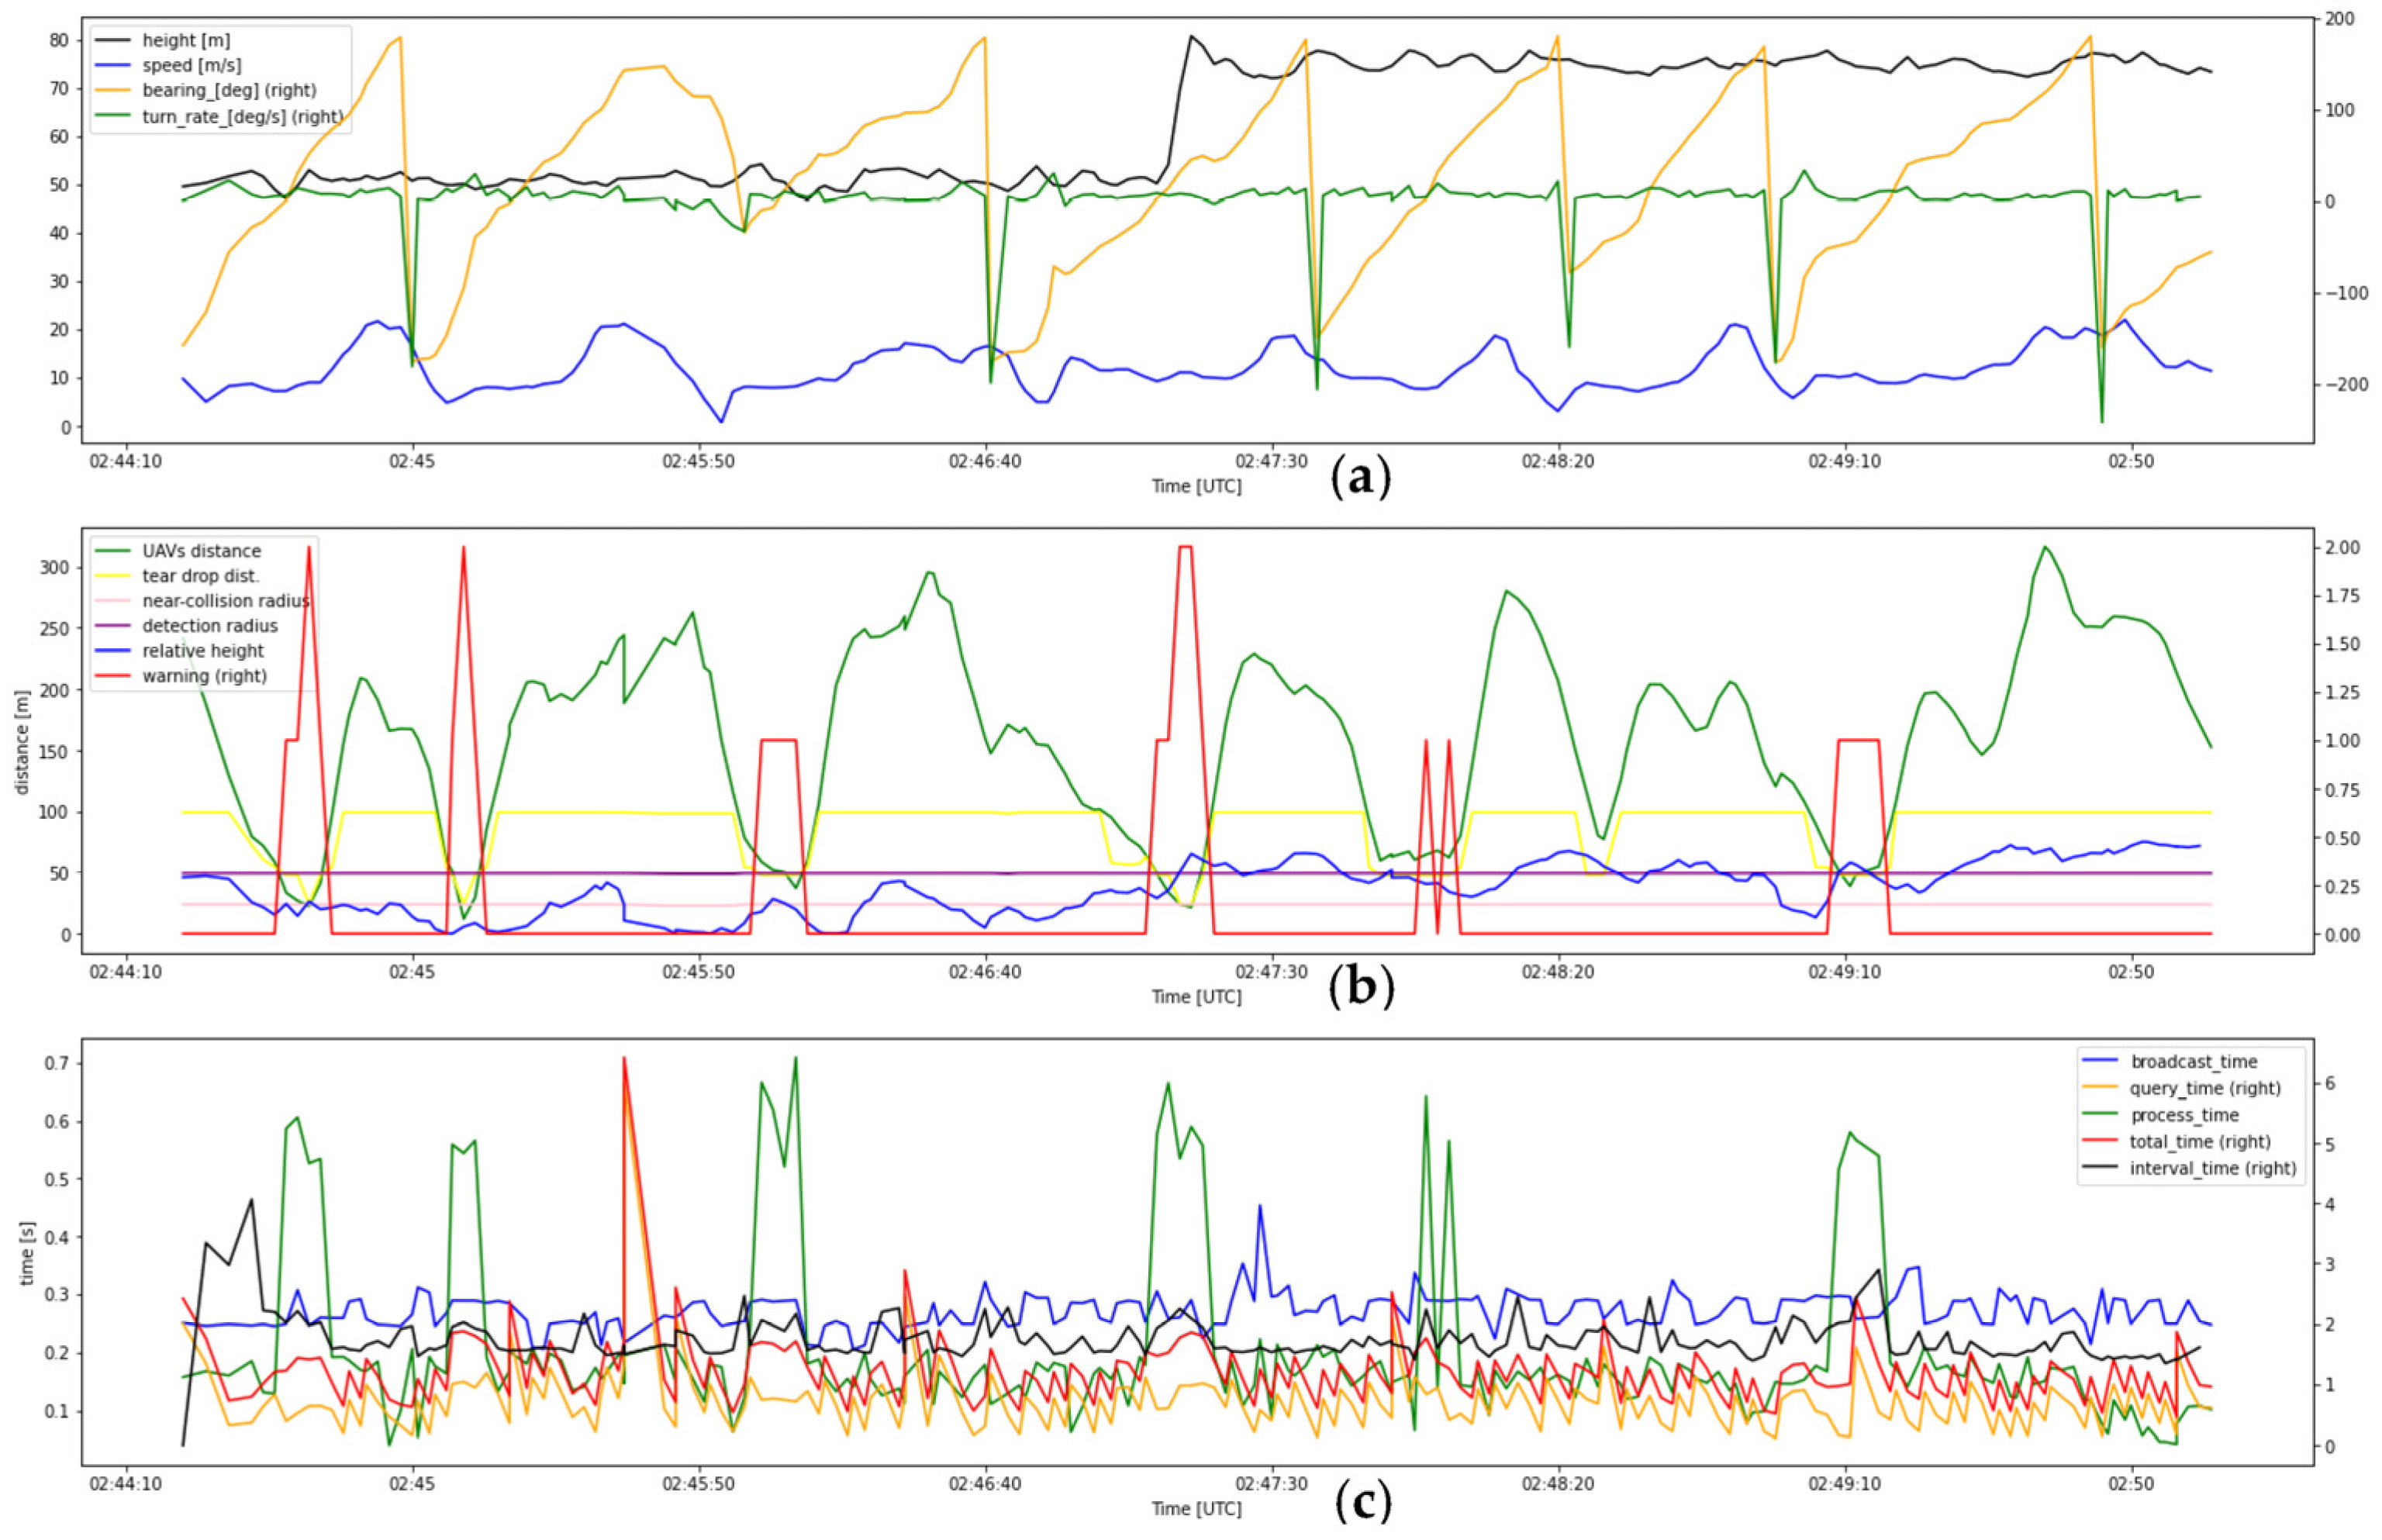
The complete flight data as mentioned in the record of Table 2 is shown in Appendix A. Each flight test record consisted of two sets of charts from module 1 and module 2 of the Remote ID. In general, the UTM monitoring system functioned as intended. However, its performance varied due to some influencing factors, the analysis of which is discussed in the later part of this section.

4.2. Latency Time Analysis

To evaluate the performance of the developed UTM monitoring application, the system time latency was analyzed. The time latency indicates how fast the data traveled from the UAV until it was shown in the UTM monitoring application. Since there were some outlier data in the flight test, specifically in the broadcast time and interval time, the data was filtered with a time threshold of 10 s. The outlier data of the broadcast time can be seen in flight test records 6 and 7 in Figure A11 and Figure A13 of Appendix A. Meanwhile, the outlier data of the interval time can be seen in flight test records 4 and 5 in Figure A7 and Figure A9 of Appendix A. There were three categories used for the analysis of the latency time, which were based on the livelihood of the location and the flying condition of the Remote ID modules.

4.2.1. Livelihood of Location Analysis

For this analysis, the flight test data were grouped based on the livelihood of each location, namely, a suburban or rural area. The resulting boxplots for the broadcast time, process time, query time, latency time, and interval time are shown in Figure 12.
The broadcast time shown in Figure 12a indicates that the average value in the suburban area (0.33 s) was a little bit higher than for the rural area (0.3 s) and the data variation was larger in the suburban area. In contrast, the query time shown in Figure 12c indicates the average value in a rural area (1 s) was a little bit higher than in the suburban area (0.9 s), and the query time had a larger variation in the rural area.
Since the query time was measured based on a normal 4G connection on the ground, the result was in line with the characteristic of 4G signal quality, where the suburban area had better signal quality than the rural area [45]. However, most of the broadcast times were measured based on a 4G signal at a certain height above the ground. Since the rural area had a better line of sight to the 4G tower, the broadcast time was better than in the suburban area. This phenomenon is mentioned in other research about 4G signal measurement in the suburban area in Malaysia [46].
The process time shown in Figure 12b indicates that the rural area had slightly larger average and variation values. The livelihood should not affect the process time since the system uses the same application and computer hardware. Since the process time was large when a detection event happened, this indicates that the flight test in the rural area had more frequent or longer warning events.
In total, the latency time shown in Figure 12d was higher in rural areas with averages of 1.48 s and 1.40 s for the suburban area with more variation in the rural area. Similarly, the interval time in Figure 12e shows the same trend as the latency time because the interval time depends on the latency time, as mentioned in Section 2.3.

4.2.2. Flying Condition Analysis

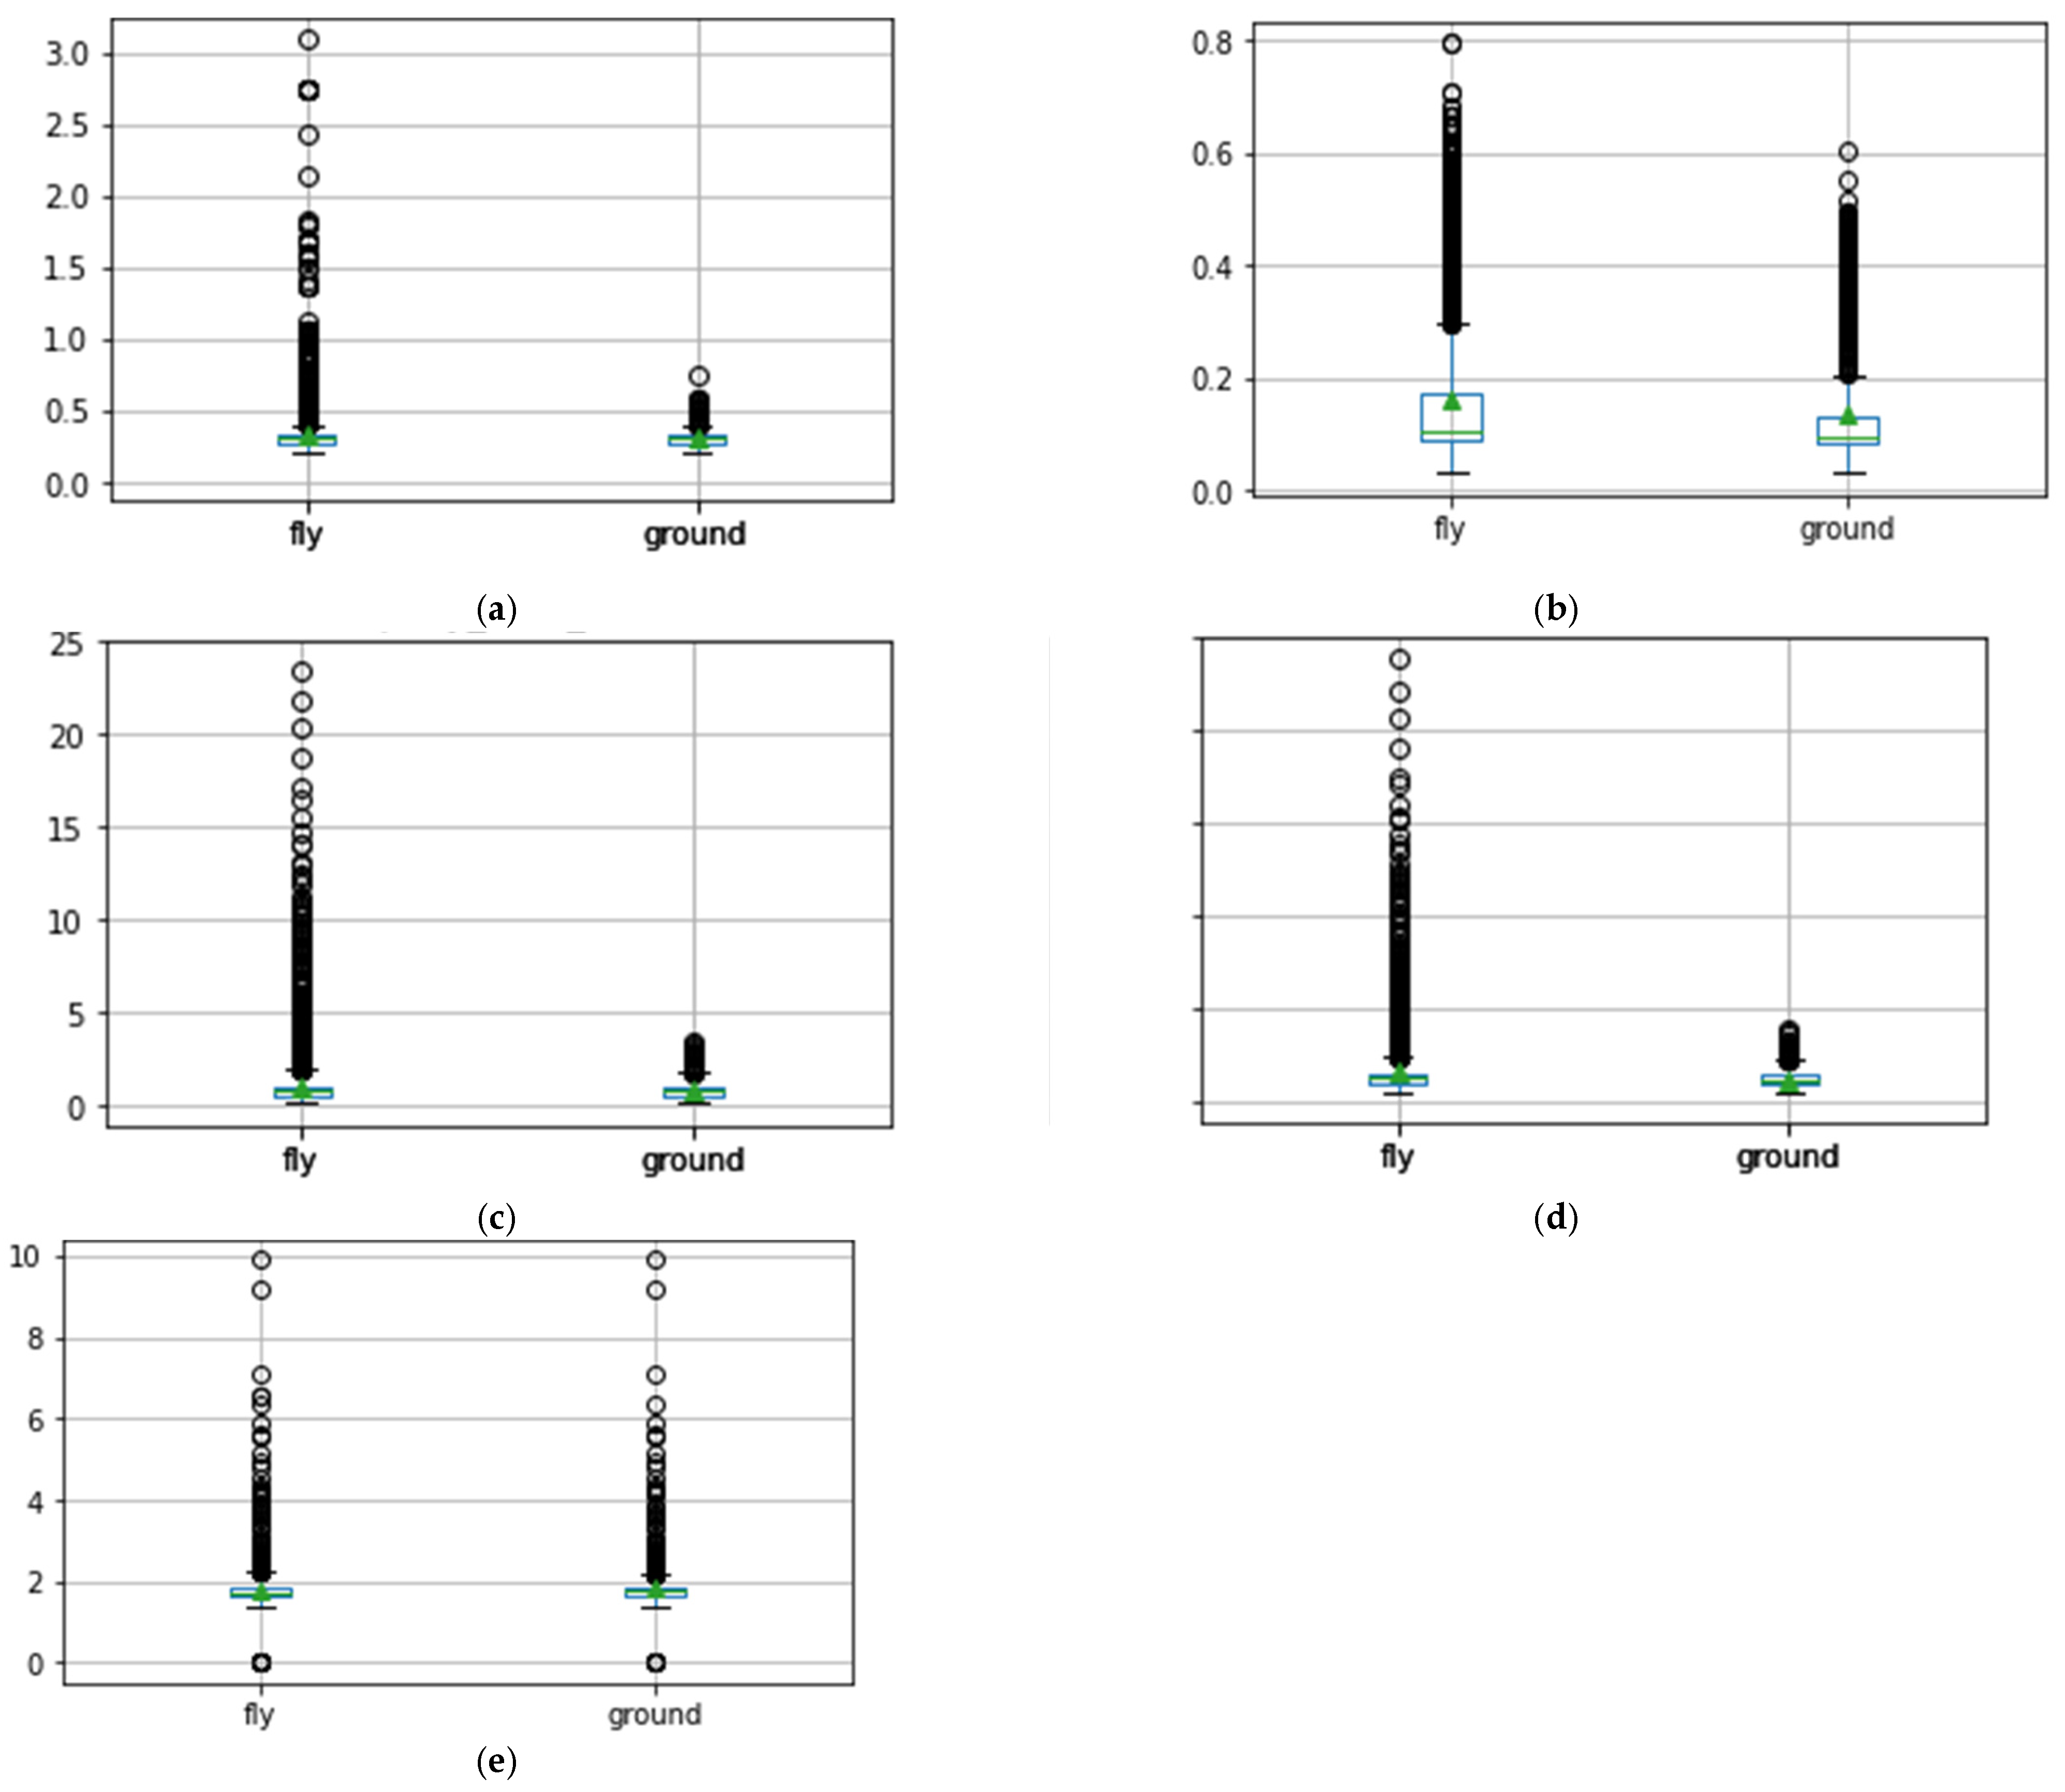
In this analysis, the flight test data were grouped based on the flying condition of the Remote ID module. Module 1 (flying in a UAV) from scenario 1 is categorized as a flying condition combined with both modules in scenario 2. The ground category was only module 2 (stay on the ground) from scenario 1. The resulting boxplots for the broadcast time, process time, query time, latency time, and interval time are shown in Figure 13.
The broadcast time and query time shown in Figure 13a,c had similar trends, which, in flying conditions, had a higher average value (broadcast time: 0.33613 s, query time: 1.066873 s) and variation than in the ground condition (broadcast time: 0.299612 s, query time: 0.784528 s). This indicates that the 4G signal quality on the ground was better than in the air. This is confirmed by the result from other research that measured 4G signal performance using UAVs at several heights above the ground [46].
Meanwhile, the process time shown in Figure 13b indicates that the flying condition had slightly larger average and variation values. The flying condition should not affect the process time since the system uses the same application and computer hardware. Because the process time was large when a detection event happens, this indicates that the flight test in the flying condition had more frequent or longer warning events.
In total, the latency time in flying conditions had a larger average value (1.566143 s) and variation than on the ground (1.220758 s). This is in line with the finding from the trend of broadcast and query time earlier showing that the 4G signal quality on the ground was better than in the air. According to Figure 13d, the longest latency time was around 24 s. Although it is considered an outlier in the boxplot, the value was much larger than the average and its standard deviation. The larger contribution to this large value came from the query time, which was affected by the internet signal quality.

4.3. Detection Warning Analysis

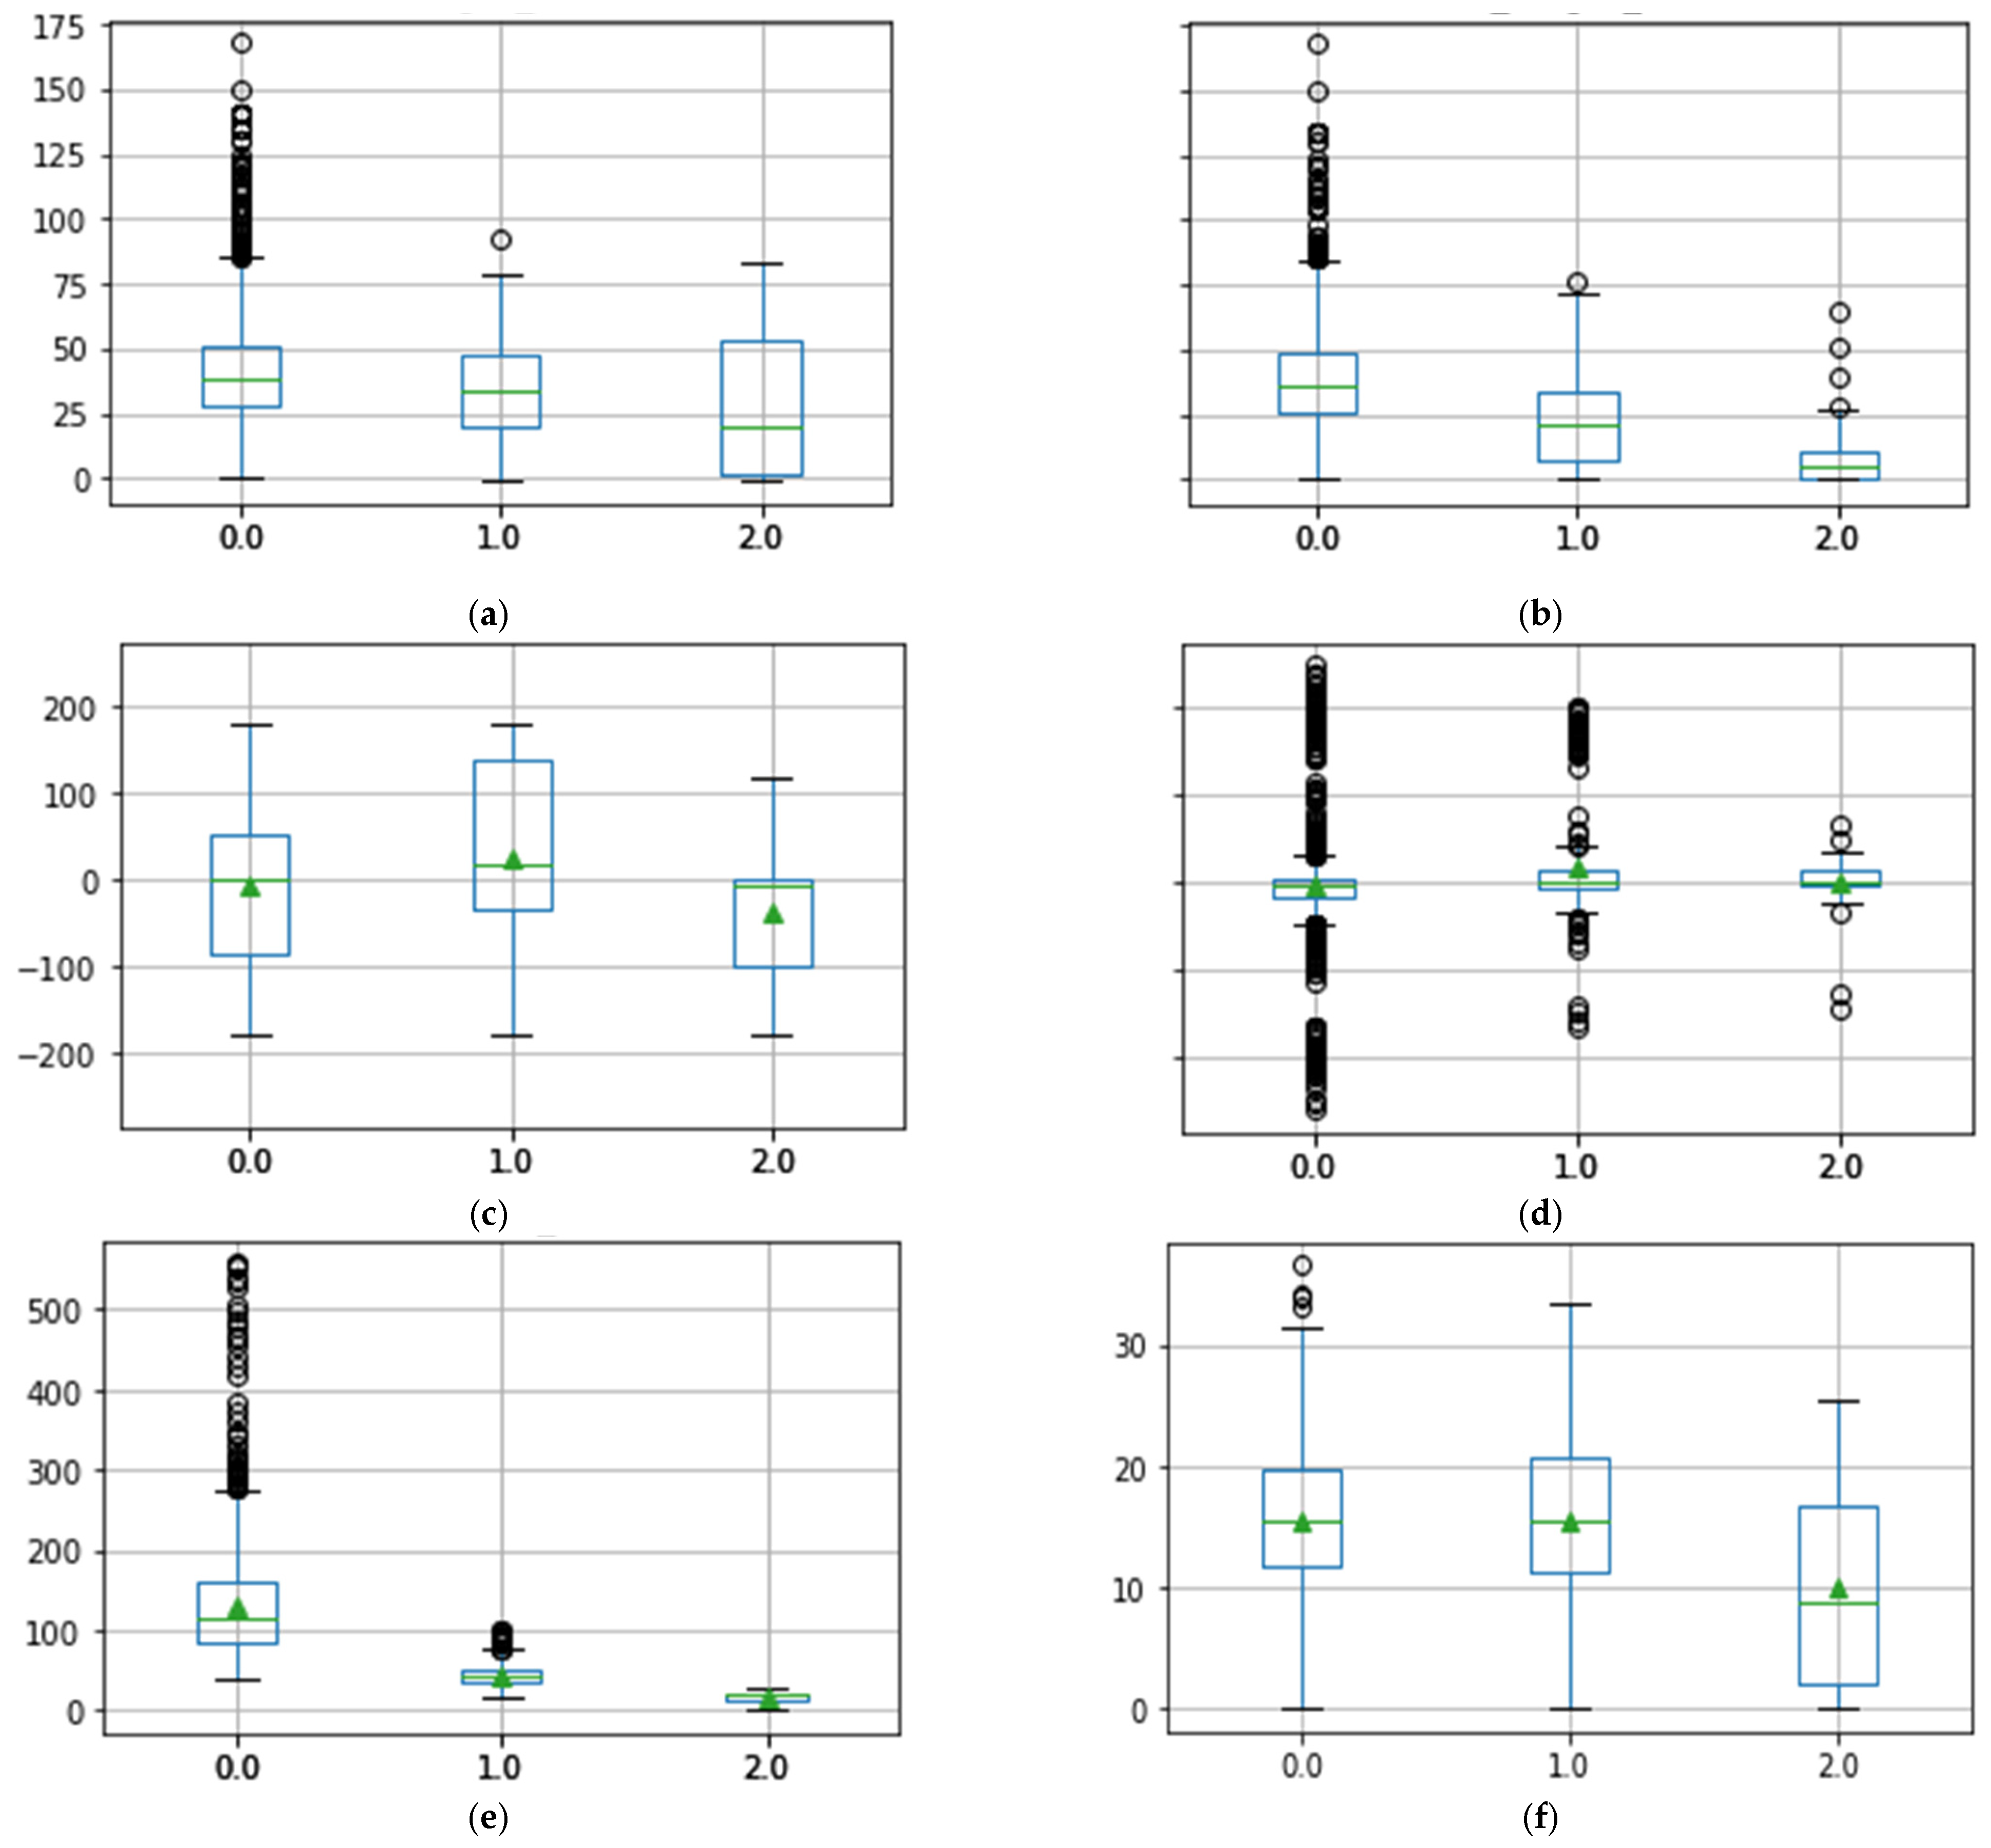
In this analysis, only the flight test data from the Remote ID module 1, which was in the controlled UAV, was used because only UAV 1 was controlled to initiate a conflict and then maneuvered to avoid it. The data were grouped based on the warning parameters (0: no warning, 1: conflict detection warning, 2: near-collision warning). The analyzed parameters were UAV height; course angle; yawing rate; and relative height, distance, and speed between the UAVs. The resulting boxplots are shown in Figure 14.
The average values of UAV height and speed shown in Figure 13f and Figure 14a decreased with increased warning levels. This indicates that the pilot turned the controlled UAV away to avoid conflict. Due to this turning, the height and speed were reduced with the increase in the warning level. The turning indication is also shown in the yawing rate plot of Figure 14d, where the highest average turn rate happens at warning level 1. This means that the pilot started the turn or changed the bearing angle at warning level 1. However, the course angle plot in Figure 14c was not the parameter that influenced the warning since it only indicated the direction angle of the flight movement.
The UTM monitoring application was developed with the detection algorithm based on the distance measurement in lateral and vertical modes. This is clearly shown in the relative distance and relative height of Figure 14e,b, which indicates that the algorithm functioned well as intended. The average relative distance and relative height decreased with the increase in the warning level.

4.4. Random Forest Analysis

In addition to the statistical analysis in previous subsections, a machine learning analysis, specifically the random forest algorithm, was implemented to analyze the flight test data. The algorithm is an ensemble of multi-decision trees with the advantages of versatile use, easy-to-understand hyperparameters, and avoiding overfit with enough trees compared with other machine learning techniques. It is also one of the most-used algorithms due to its simplicity and diversity that can be used for both classification and regression tasks. The regressor model of the random forest algorithm was used to analyze the latency time, and the classifier model of the random forest algorithm was used to analyze the detection warning.
The complete flight test data was used for both analyses, with 75% chosen as the training data and 25% as the testing data. The random forest algorithm from the SKLEARN module version 1.0.2 of Python programming was used.

4.4.1. Latency Time Analysis

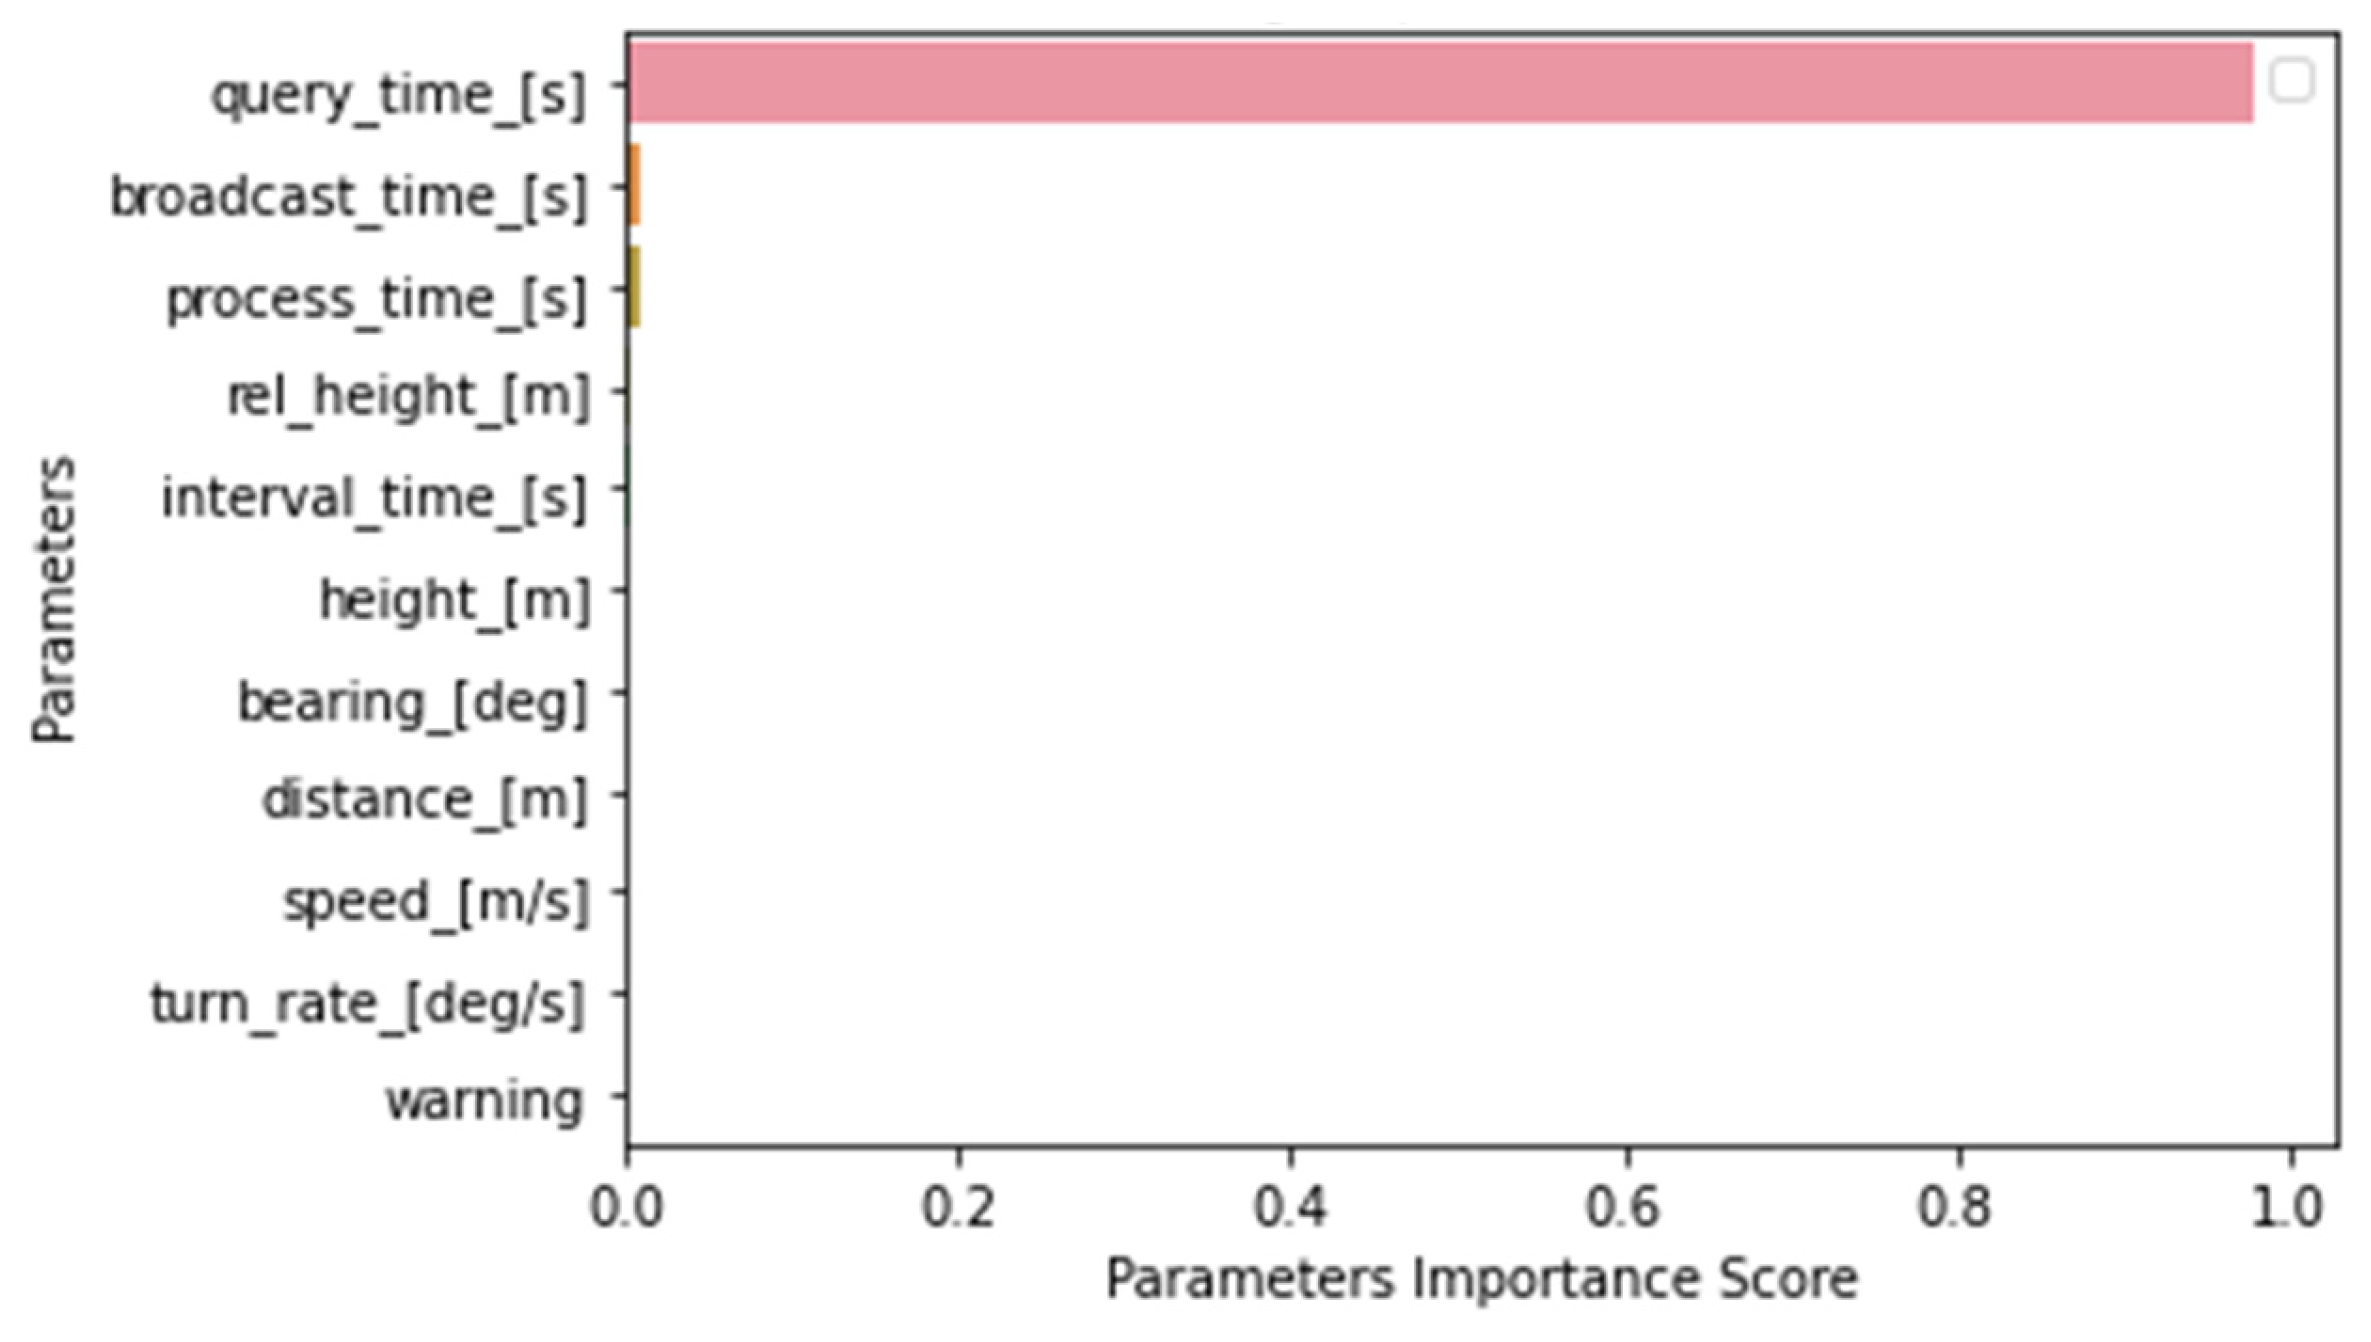
Since the regressor of the random forest algorithm is suitable for continuous parameters, this analysis was used to define the important parameters affected by the latency time. The number of estimators or trees was 100, as suggested by the default value in the random forest module. The result of the analysis is plotted in Figure 15 with the query time as the most important factor, with up to 97.9% importance.
The other two factors in the top three important factors for latency time were broadcast time (0.87%) and process time (0.79%). Meanwhile, the other parameters had a less than 0.2% effect. To evaluate the validity of the random forest regressor model, the validation metrics of the mean squared error (MSE), root mean squared error (RMSE), mean absolute error (MAE), and R-squared score of the model were calculated. MSE represents the average of the squared differences between the predicted and actual values. RMSE takes the square root of MSE to obtain a metric in the original unit of the target variable. MAE calculates the average of the absolute differences between the predicted and actual values. R-squared is the proportion of the variance in the target variable that can be explained by the model.
The calculated MSE was 0.0173, RMSE was 0.1315, and MAE was 0.0328. Smaller MSE, RMSE, and MAE values represent a better model for predicting the result. In contrast, the R-squared score was 0.9913, which indicates that the model had a good fit to the data and the default of 100 estimators was good enough for the model.
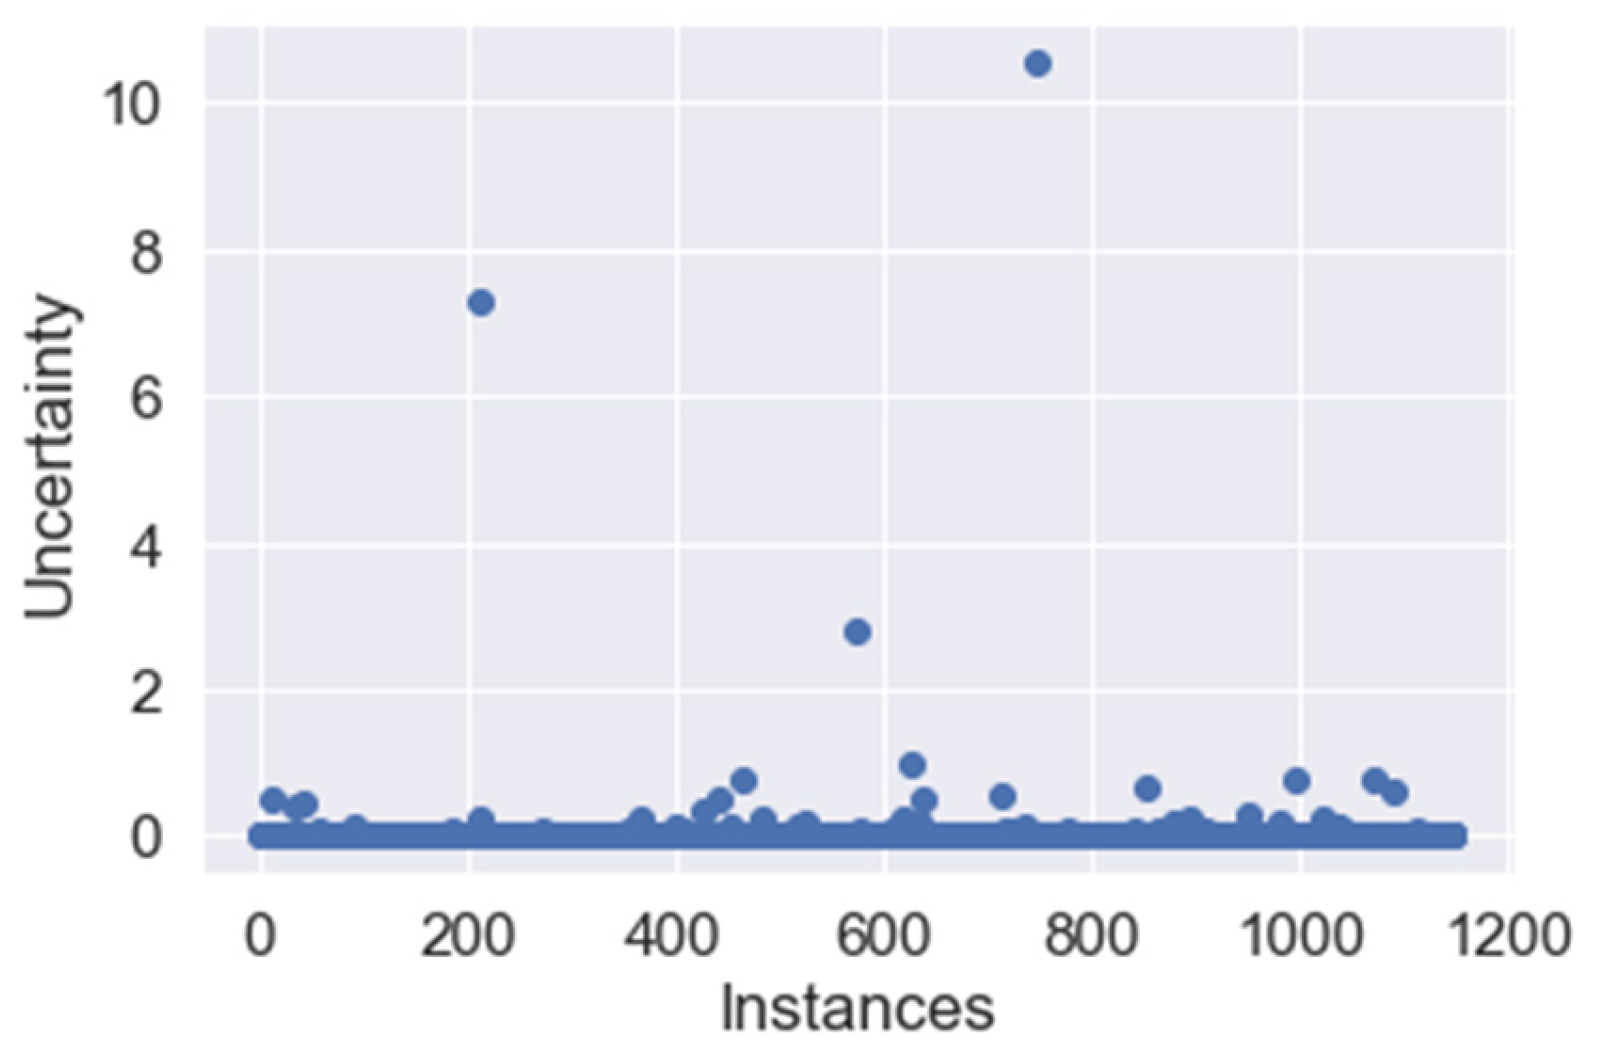
The accuracy is not commonly used as a metric for regression problems since it is typically used for classification tasks. Another evaluation parameter for the regression model is uncertainty, as shown in Figure 16. It was plotted in a scatter format over the instances. The mean of this uncertainty was 0.031, with a standard deviation of 0.393. This narrow spread of data suggested more consistent or certain predictions. However, there were some outlier values at instances around 200, 600, and 750. These outliers were representative of certain outlier values in the query time data that had very high values, as shown in Figure 12c and Figure 13c.
In comparison with the latency time analysis in Figure 12 and Figure 13, this result confirmed that the query time was the most important parameter to the latency time. There should be an effort to reduce the query time, such as by updating the normal HTTPS API in the current UTM monitoring application into a more advanced process that could produce a lower query time.

4.4.2. Detection Warning Analysis

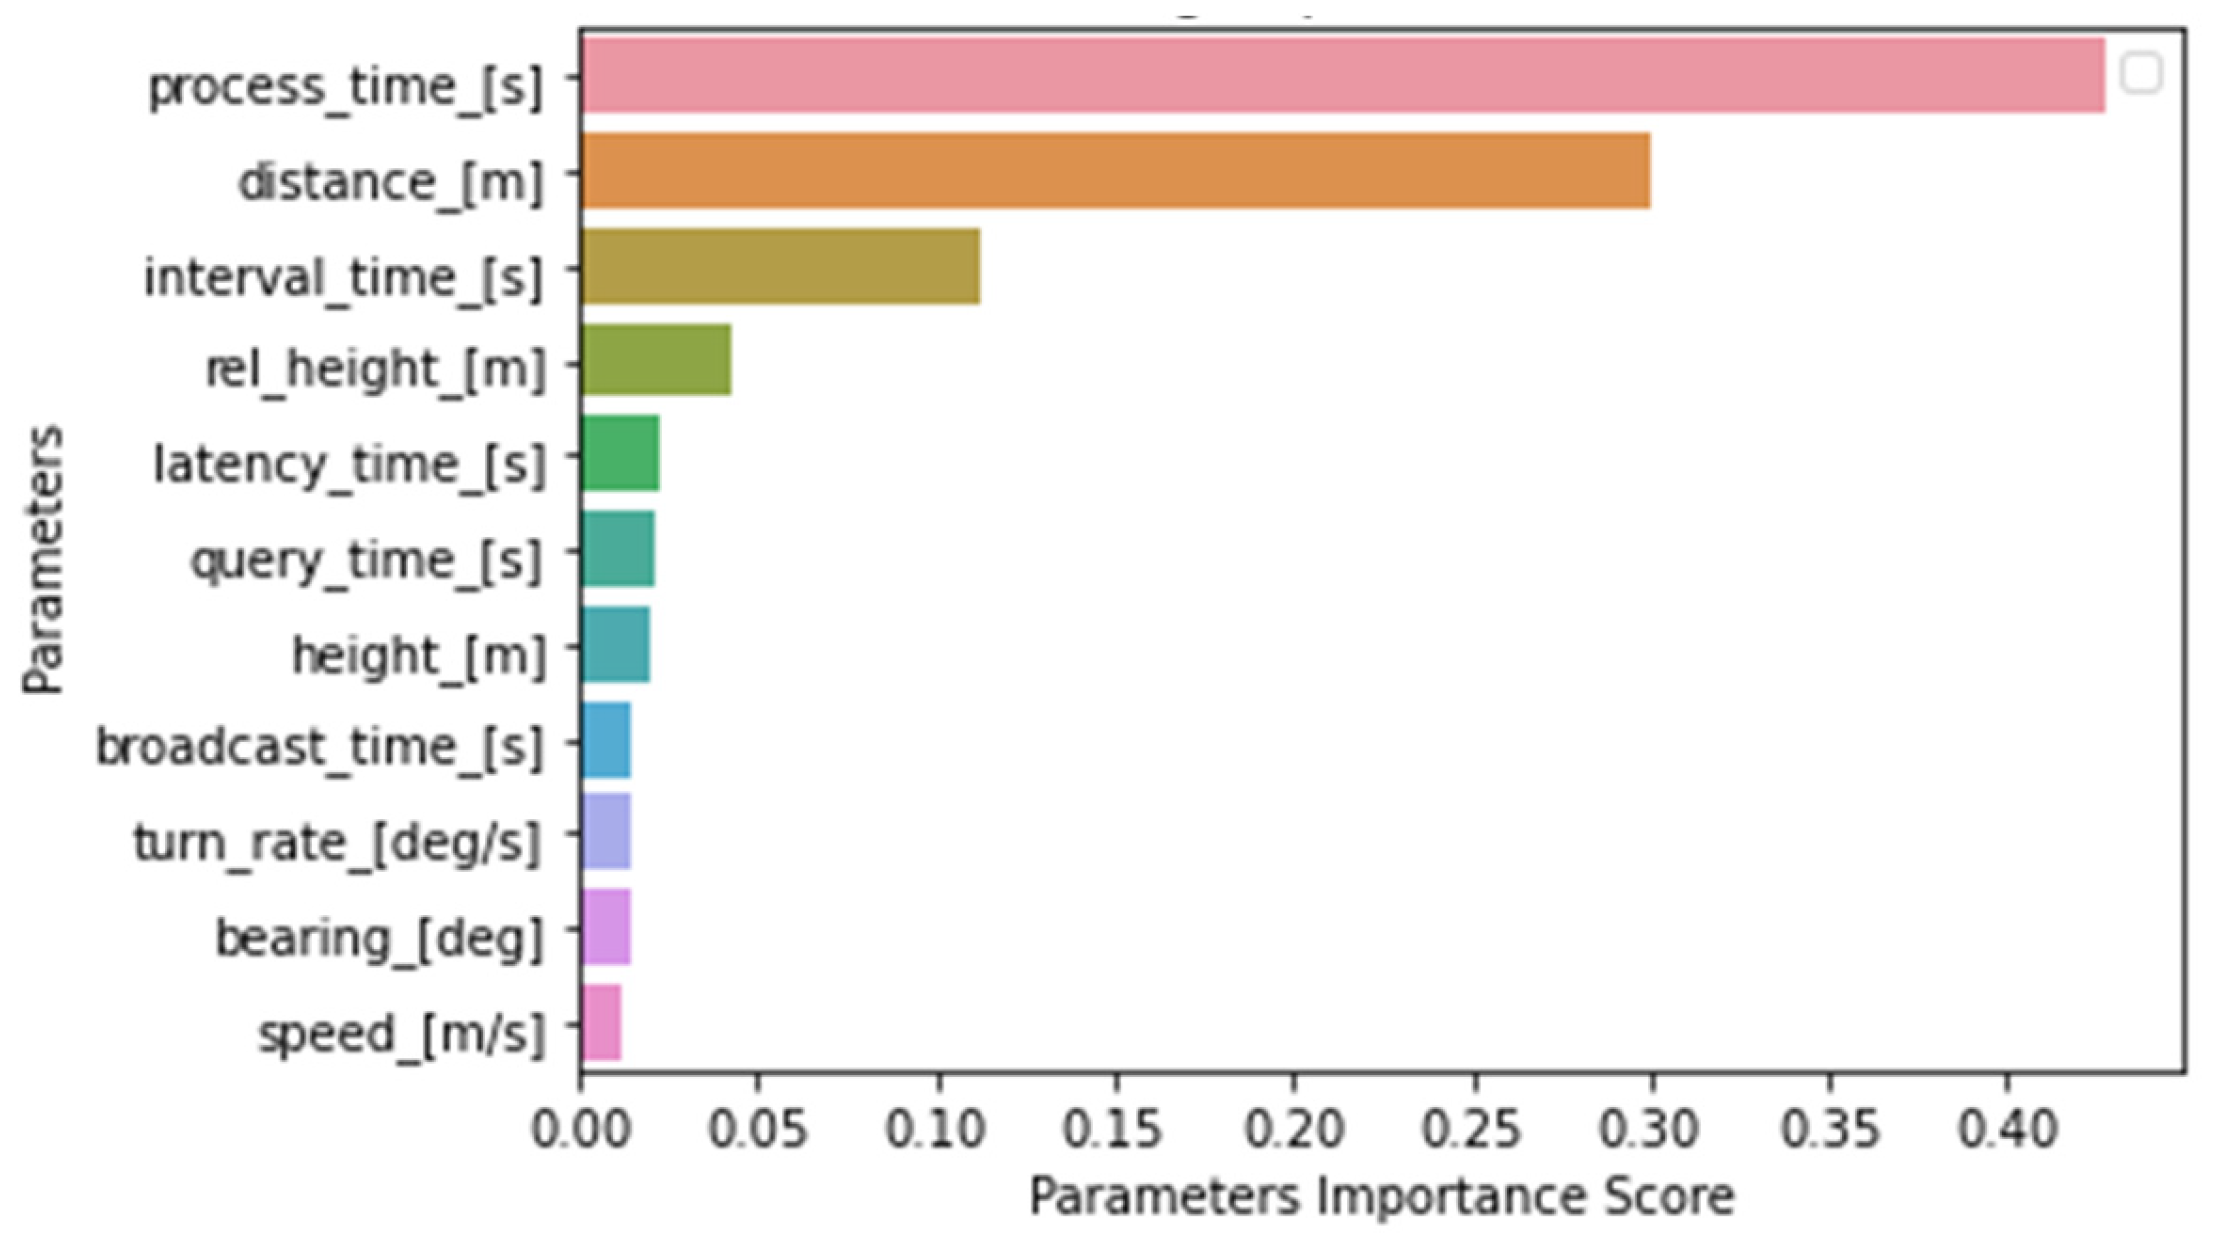
The random forest classifier algorithm was used to analyze the detection warning parameters because the algorithm was suitable for classifying discrete parameters. The result of the analysis is plotted in Figure 17, with the top four important parameters being the process time (42.95%), the distance between UAVs (31.28%), the interval time (9.74%), and the relative height between UAVs (3.9%). Meanwhile, the other parameters had a less than 2.5% effect on the detection warning.
The number of estimators or trees used was 1000 because this number could produce good validation metrics that represented the performance of the model. The results of the validation metrics values were MSE = 0.0226, RMSE = 0.1503, MAE = 0.0226, and R-squared = 0.8905, which indicates that the model had a good fit to the data or high validation. Moreover, the model provided an accuracy score of 0.9774, which means that the correctness of the model prediction was 97.74%.
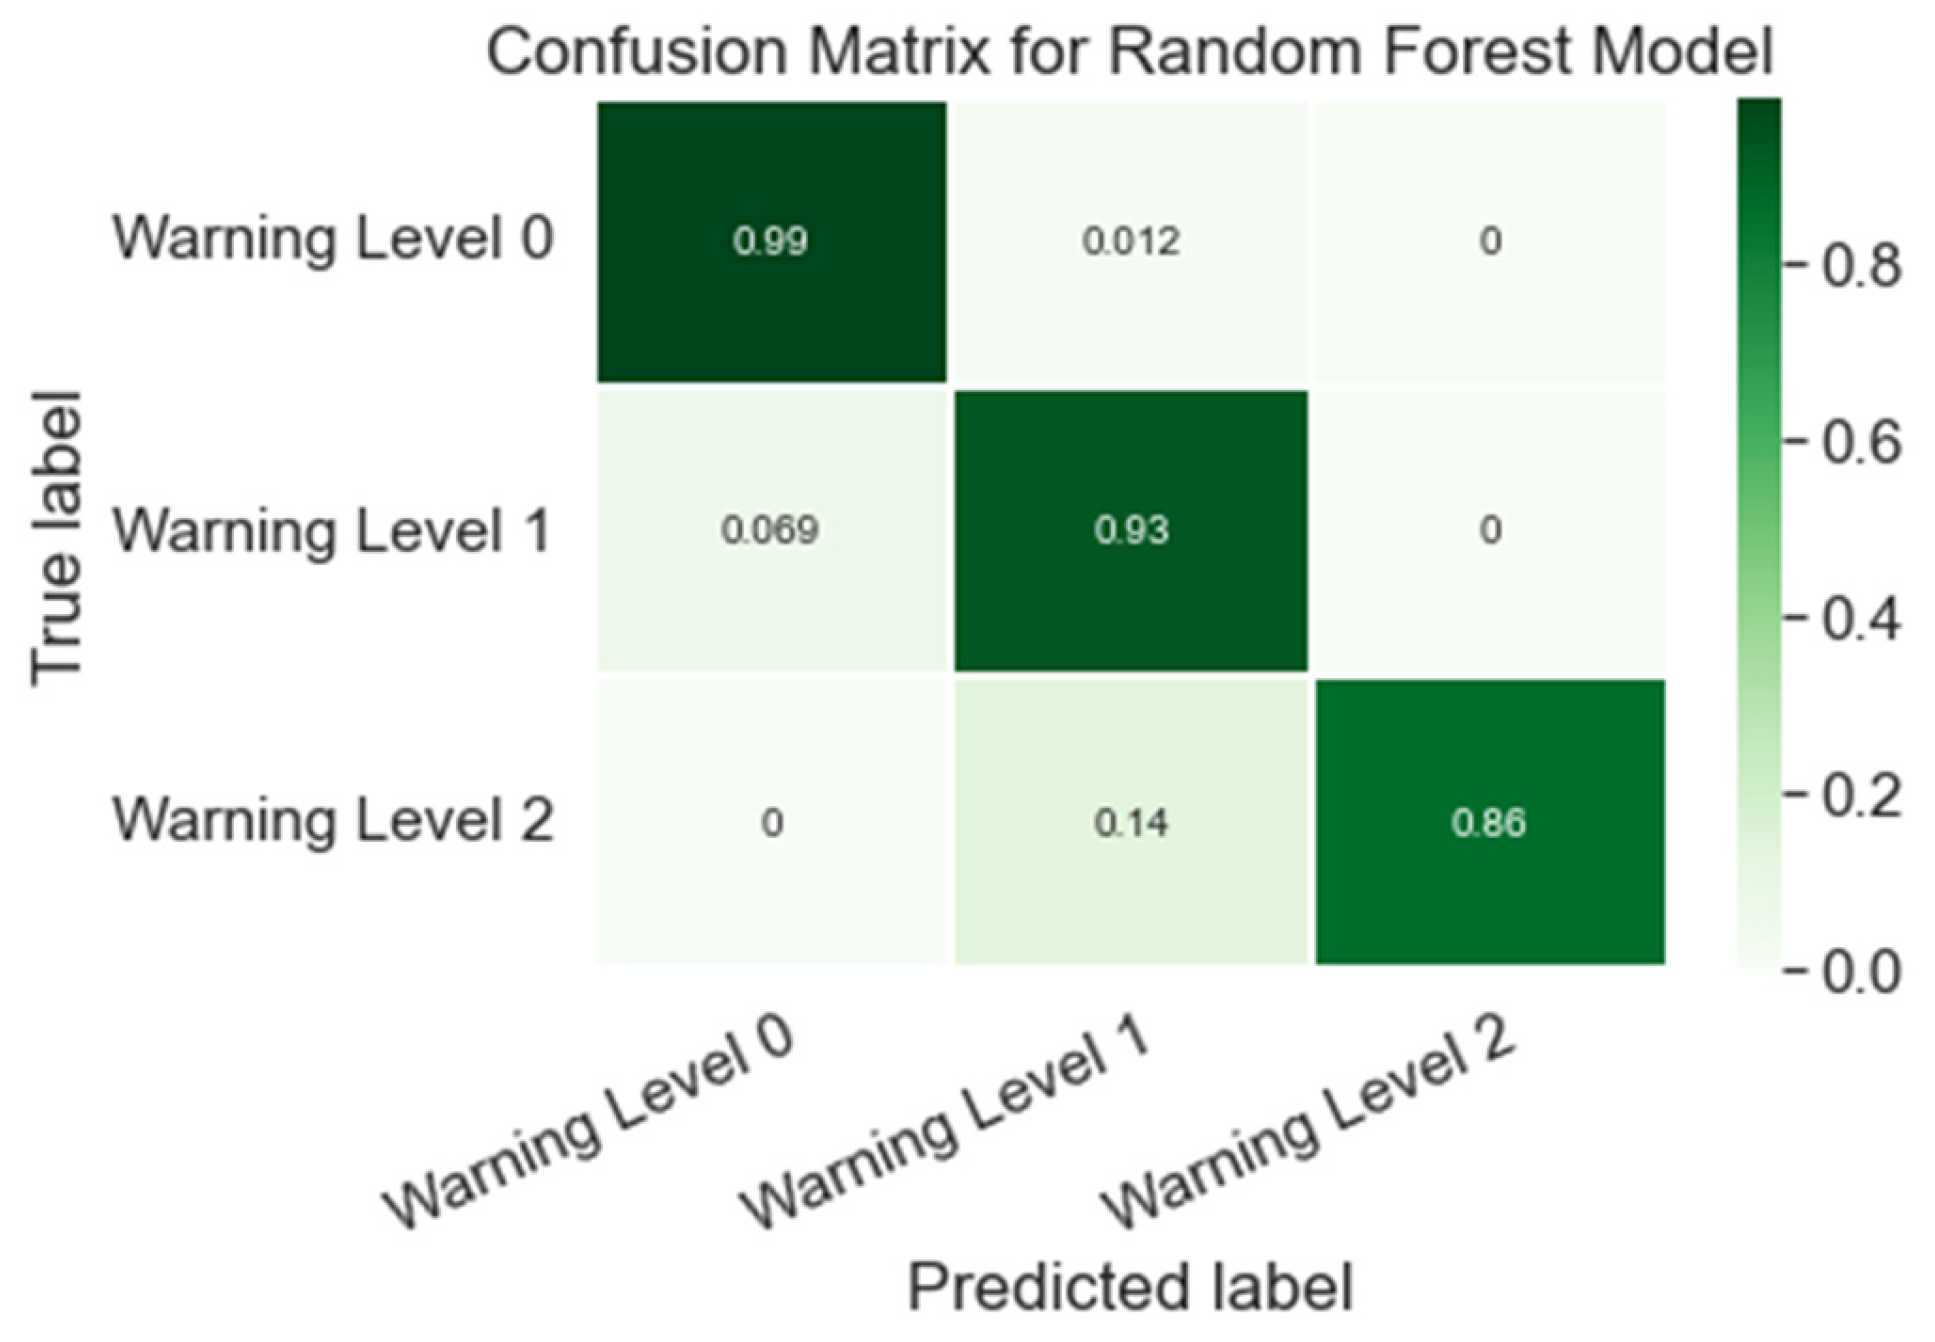
Another important performance parameter of the random forest classifier is a confusion matrix. This matrix represents a measurement of how many of a classifier’s predictions were correct and incorrect [37]. The resulting confusion matrix for the detection warning is shown in Figure 18.
The matrix’s main diagonal cells represent the correctness of the prediction and other matrix cells represent the incorrectness. Since the matrix’s diagonal cells had very high numbers compared with other cells, this indicates that the resulting classifier model had high accuracy in predicting the result.
For the uncertainty of the prediction model, an error bar plot of the predicted warning values is shown in Figure 19. The length of the error bars indicates the magnitude of the uncertainty.
Since warning 2 had the shortest error bar, it had the lowest uncertainty confidence level. Meanwhile, warning 0 had the longest error bar, which represents the highest uncertainty. This means that the model’s predictions for value 2 were more reliable and consistent, while its predictions for value 0 were less reliable and more variable. However, the warning 1 error bar length was somewhere between warning 2 and warning 0. This means that the model’s predictions for warning 1 had a moderate level of uncertainty or variability.
The presence of an outlier data point at a high instance within the error bar of predicted value 1 suggests that the model encountered a particular instance where its prediction for value 1 deviated significantly from the expected trend or pattern. This outlier data point might be related to a few outlier data in warning 1, as shown in Figure 14.
In comparison with the result from Figure 14 in Section 4.3, the relative distance and relative height were two of the dominant parameters for the resulting warning level. However, the result from the machine learning technique mentioned that the process time was the most significant parameter, and the interval time was in third position.
This result is not a surprise since the UTM monitoring conducts more calculations when a conflict was detected. Furthermore, when an interval time is large, the possibility of a higher warning level increases. Thus, this result highlights the advantage of machine learning analysis for complex and large datasets compared with classical statistical analysis. For the future development of the UTM monitoring application, the use of a higher computational capability and more efficient coding is highly recommended to improve the process time and interval time.

5. Conclusions and Recommendations

This research aimed to develop the UTM monitoring application based on network Remote ID communication, which included a conflict detection algorithm using an inverted teardrop detection shape. Several flight tests were conducted to evaluate the UTM monitoring application using some small fixed-wing UAVs in rural and suburban areas. The flight test results were analyzed in terms of the communication latency, flight parameters, and their effects on the UTM monitoring performance using statistical and random forest machine learning algorithms. The conclusions and recommendations of this research are as follows.

5.1. Conclusions

Based on the analysis of the flight test data, we concluded that the UTM application functioned well in monitoring the UAV’s flight and provided sufficient warning levels to the UAV pilot when a conflict was detected. Since the conflict detection algorithm employed was based on a distance measurement, the warning level of conflict detection was opposite to the relative distance and height between UAVs. This result was confirmed by the result from the machine learning analysis that placed the relative distance and the relative height as the second and fourth most important parameters for warning detection. In addition, the machine learning technique results show that the most significant parameter of the warning level was the processing time.
Moreover, due to the differences in livelihood level of the flight locations, the data latency increased with the distance from urban areas. Furthermore, the latency time was higher for the data transmitted from the Remote ID module in the flying condition than the ground condition. This result relates to the characteristic of the current 4G communication that focuses on urban locations and ground users. Interestingly, the machine learning analysis results indicate that the latency time was affected mostly by the query time.

5.2. Recommendations

Since the processing time was the most significant parameter for the warning level, it is recommended for a UTM application development to reduce the processing time, such as using a higher computing processor and more efficient programming coding. Moreover, because the query time depends on the internet connection between a cloud server and the computer application, a more stable internet connection and a faster query mechanism are recommended.
As we believe that the latency time is something that cannot be avoided in some situations, an additional delay warning mechanism or trajectory prediction should be explored in future research.

Author Contributions

Conceptualization, N.R. and C.-Y.L.; methodology, N.R.; software, N.R.; validation, N.R., C.-Y.L. and W.-L.G.; formal analysis, N.R., C.-Y.L. and W.-L.G.; investigation, N.R.; resources, N.R.; data curation, N.R.; writing—original draft preparation, N.R.; writing—review and editing, C.-Y.L. and W.-L.G.; visualization, N.R.; supervision, C.-Y.L. All authors have read and agreed to the published version of the manuscript.

Funding

This research and the paper were supported by the National Science and Technology Council, Taiwan, through the project The System Integrating and Manufacturing of Flight Test Airframe System for Long Endurance Solar UAV (109-2221-E-150-024-MY3, 2020~2023).

Data Availability Statement

The data is available upon request to the correspondence author.

Conflicts of Interest

The authors declare no conflict of interest.

Appendix A

  • Flight test data of record number 1
Figure A1. Flight test data from Remote ID module 1 of record number 1: (a) flight parameters, (b) detection parameters, and (c) time parameters.
Drones 07 00436 g0a1
Figure A2. Flight test data from Remote ID module 2 of record number 1: (a) flight parameters, (b) detection parameters, and (c) time parameters.
Drones 07 00436 g0a2
2.
Flight test data of record number 2
Figure A3. Flight test data from Remote ID module 1 of record number 2: (a) flight parameters, (b) detection parameters, and (c) time parameters.
Drones 07 00436 g0a3
Figure A4. Flight test data from Remote ID module 2 of record number 2: (a) flight parameters, (b) detection parameters, and (c) time parameters.
Drones 07 00436 g0a4
3.
Flight test data of record number 3
Figure A5. Flight test data from Remote ID module 1 of record number 3: (a) flight parameters, (b) detection parameters, and (c) time parameters.
Drones 07 00436 g0a5
Figure A6. Flight test data from Remote ID module 2 of record number 3: (a) flight parameters, (b) detection parameters, and (c) time parameters.
Drones 07 00436 g0a6
4.
Flight test data of record number 4
Figure A7. Flight test data from Remote ID module 1 of record number 4: (a) flight parameters, (b) detection parameters, and (c) time parameters.
Drones 07 00436 g0a7
Figure A8. Flight test data from Remote ID module 2 of record number 4: (a) flight parameters, (b) detection parameters, and (c) time parameters.
Drones 07 00436 g0a8
5.
Flight test data of record number 5
Figure A9. Flight test data from Remote ID module 1 of record number 5: (a) flight parameters, (b) detection parameters, and (c) time parameters.
Drones 07 00436 g0a9
Figure A10. Flight test data from Remote ID module 2 of record number 5: (a) flight parameters, (b) detection parameters, and (c) time parameters.
Drones 07 00436 g0a10
6.
Flight test data of record number 6
Figure A11. Flight test data from Remote ID module 1 of record number 6: (a) flight parameters, (b) detection parameters, and (c) time parameters.
Drones 07 00436 g0a11
Figure A12. Flight test data from Remote ID module 2 of record number 6: (a) flight parameters, (b) detection parameters, and (c) time parameters.
Drones 07 00436 g0a12
7.
Flight test data of record number 7
Figure A13. Flight test data from Remote ID module 1 of record number 7: (a) flight parameters, (b) detection parameters, and (c) time parameters.
Drones 07 00436 g0a13
Figure A14. Flight test data from Remote ID module 2 of record number 7: (a) flight parameters, (b) detection parameters, and (c) time parameters.
Drones 07 00436 g0a14
8.
Flight test data of record number 8 is shown in Figure 9 and Figure 10 in Section 4.1.
9.
Flight test data of record number 9
Figure A15. Flight test data from Remote ID module 1 of record number 9: (a) flight parameters, (b) detection parameters, and (c) time parameters.
Drones 07 00436 g0a15
Figure A16. Flight test data from Remote ID module 2 of record number 9: (a) flight parameters, (b) detection parameters, and (c) time parameters.
Drones 07 00436 g0a16
10.
Flight test data of record number 10
Figure A17. Flight test data from Remote ID module 1 of record number 10: (a) flight parameters, (b) detection parameters, and (c) time parameters.
Drones 07 00436 g0a17
Figure A18. Flight test data from Remote ID module 2 of record number 10: (a) flight parameters, (b) detection parameters, and (c) time parameters.
Drones 07 00436 g0a18

References

  1. Moshref-Javadi, M.; Winkenbach, M. Applications and Research avenues for drone-based models in logistics: A classification and review. Expert Syst. Appl. 2021, 177, 114854. [Google Scholar] [CrossRef]
  2. Gallacher, D. Drone Applications for Environmental Management in Urban Spaces: A Review. Int. J. Sustain. Land Use Urban Plan. 2017, 3, 1–14. [Google Scholar] [CrossRef]
  3. Orusa, T.; Viani, A.; Moyo, B.; Cammareri, D.; Borgogno-Mondino, E. Risk Assessment of Rising Temperatures Using Landsat 4–9 LST Time Series and Meta® Population Dataset: An Application in Aosta Valley, NW Italy. Remote Sens. 2023, 15, 2348. [Google Scholar] [CrossRef]
  4. Abdulridha, J.; Batuman, O.; Ampatzidis, Y. UAV-based remote sensing technique to detect citrus canker disease utilizing hyperspectral imaging and machine learning. Remote Sens. 2019, 11, 1373. [Google Scholar] [CrossRef] [Green Version]
  5. Dilshad, N.; Hwang, J.Y.; Song, J.S.; Sung, N.M. Applications and Challenges in Video Surveillance via Drone: A Brief Survey. In Proceedings of the International Conference on Information and Communication Technology Convergence (ICTC), Jeju, Republic of Korea, 21–23 October 2020; pp. 728–732. [Google Scholar] [CrossRef]
  6. Simic Milas, A.; Cracknell, A.P.; Warner, T.A. Drones—The third generation source of remote sensing data. Int. J. Remote Sens. 2018, 39, 7125–7137. [Google Scholar] [CrossRef]
  7. Kuchar, J.K.; Yang, L.C. A Review of Conflict Detection and Resolution Modeling Methods. IEEE Trans. Intell. Transp. Syst. 2000, 1, 179–189. [Google Scholar] [CrossRef] [Green Version]
  8. Baum, M.S. Unmanned Aircraft Systems Traffic Management: UTM; CRC Press: Boca Raton, FL, USA, 2022; ISBN 9780367644734. [Google Scholar]
  9. Hu, J.; Yang, X.; Wang, W.; Wei, P.; Ying, L.; Liu, Y. UAS Conflict Resolution in Continuous Action Space using Deep Reinforcement Learning. In Proceedings of the AIAA Aviation 2020 Forum, Virtual, 15–19 June 2020. [Google Scholar] [CrossRef]
  10. Guo, Q.; Zhang, J.; Guo, S.; Ye, Z.; Deng, H.; Hou, X.; Zhang, H. Urban Tree Classification Based on Object-Oriented Approach and Random Forest Algorithm Using Unmanned Aerial Vehicle (UAV) Multispectral Imagery. Remote Sens. 2022, 14, 3885. [Google Scholar] [CrossRef]
  11. Arteaga, R.; Dandachy, M.; Truong, H.; Aruljothi, A.; Vedantam, M.; Epperson, K.; Mccartney, R.; Systems, V.A.; City, O.; Aerospace, V.; et al. µADS-B Detect and Avoid Flight Tests on Phantom 4 Unmanned Aircraft System. In Proceedings of the AIAA Infotech @ Aerospace Conference, Kissimmee, FL, USA, 8–12 January 2018. [Google Scholar]
  12. Mitchell, T.; Hartman, M.; Jacob, J.D. Testing and Evaluation of UTM Systems in a BVLOS Environment. In Proceedings of the AIAA Aviation Forum, Virtual, 15–19 June 2020. [Google Scholar]
  13. Schelle, A.; Völk, F.; Schwarz, R.T.; Knopp, A.; Stütz, P. Evaluation of a Multi-Mode-Transceiver for Enhanced UAV Visibility and Connectivity in Mixed ATM/UTM Contexts. Drones 2022, 6, 80. [Google Scholar] [CrossRef]
  14. Rymer, N.; Moore, A.J.; Young, S.; Glaab, L.; Smalling, K.; Consiglio, M. Demonstration of Two Extended Visual Line of Sight Methods for Urban UAV Operations. In Proceedings of the AIAA Aviation Forum, Virtual, 15–19 June 2020; pp. 1–14. [Google Scholar]
  15. Wang, C.H.J.; Ng, E.M.; Low, K.H. Investigation and Modeling of Flight Technical Error (FTE) Associated With UAS Operating With and Without Pilot Guidance. IEEE Trans. Veh. Technol. 2021, 70, 12389–12401. [Google Scholar] [CrossRef]
  16. Dolph, C.; Glaab, L.; Allen, B.; Consiglio, M.; Iftekharuddin, K. An Improved Far-Field Small Unmanned Aerial System Optical Detection Algorithm. In Proceedings of the IEEE/AIAA 38th Digital Avionics Systems Conference (DASC), San Diego, CA, USA, 8–12 September 2019. [Google Scholar] [CrossRef]
  17. Huang, Z.; Lai, Y. Image-Based Sense and Avoid of Small Scale UAV Using Deep Learning Approach. In Proceedings of the International Conference on Unmanned Aircraft Systems (ICUAS), Athenes, Greece, 1–4 September 2020. [Google Scholar]
  18. Loffi, J.M.; Vance, S.M.; Jacob, J.; Spaulding, L.; Dunlap, J.C. Evaluation of Onboard Detect-and-Avoid System for sUAS BVLOS Operations. Int. J. Aviat. Aeronaut. Aerosp. 2022, 9, 9. [Google Scholar] [CrossRef]
  19. Consiglio, M.; Duffy, B.; Balachandran, S.; Glaab, L.; Muñoz, C. Sense and avoid characterization of the independent configurable architecture for reliable operations of unmanned systems. In Proceedings of the 13th USA/Europe Air Traffic Management Research and Development Seminar (ATM2019), Vienna, Austria, 17–21 June 2019. [Google Scholar]
  20. Szatkowski, G.N.; Kriz, A.; Ticatch, L.A.; Briggs, R.; Coggin, J.; Morris, C.M. Airborne Radar for sUAS Sense and Avoid. In Proceedings of the IEEE/AIAA 38th Digital Avionics Systems Conference (DASC), San Diego, CA, USA, 8–12 September 2019. [Google Scholar] [CrossRef]
  21. Duffy, B.; Balachandran, S.; Peters, A.; Smalling, K.; Consiglio, M.; Glaab, L.; Moore, A.; Muñoz, C. Onboard Autonomous Sense and Avoid of Non-Conforming Unmanned Aerial Systems. In Proceedings of the AIAA/IEEE Digital Avionics Systems Conference, San Antonio, TX, USA, 11–15 October 2020. [Google Scholar]
  22. Marques, M.; Brum, A.; Antunes, S. Sense and Avoid implementation in a small Unmanned Aerial Vehicle. In Proceedings of the 13th APCA International Conference on Control and Soft Computing, CONTROLO 2018, Ponta Delgada, Portugal, 4–6 June 2018; pp. 395–400. [Google Scholar]
  23. Murrell, E.; Walker, Z.; King, E.; Namuduri, K. Remote ID and Vehicle-to-Vehicle Communications for Unmanned Aircraft System Traffic Management. In Proceedings of the International Workshop on Communication Technologies for Vehicles, Bordeaux, France, 16–17 November 2020; pp. 194–202. [Google Scholar]
  24. Peters, A.; Balachandran, S.; Duffy, B.; Smalling, K.; Consiglio, M.; Munoz, C. Flight test results of a distributed merging algorithm for autonomous UAS operations. In Proceedings of the AIAA/IEEE 39th Digital Avionics Systems Conference (DASC), San Antonio, TX, USA, 11–15 October 2020. [Google Scholar] [CrossRef]
  25. Lopez, J.G.; Ren, L.; Meng, B.; Fisher, R.; Markham, J.; Figard, M.; Evans, R.; Spoelhof, R.; Edwards, S. Integration and Flight Test of Small UAS Detect and Avoid on A Miniaturized Avionics Platform. In Proceedings of the IEEE/AIAA 38th Digital Avionics Systems Conference (DASC), San Diego, CA, USA, 8–12 September 2019; pp. 1–5. [Google Scholar]
  26. Moore, A.J.; Balachandran, S.; Young, S.; Dill, E.; Logan, M.J.; Glaab, L.; Munoz, C.; Consiglio, M. Testing enabling technologies for safe UAS urban operations. In Proceedings of the Aviation Technology, Integration, and Operations Conference, Atlanta, GA, USA, 25–29 June 2018; pp. 1–12. [Google Scholar] [CrossRef] [Green Version]
  27. F3411-19; Standard Specification for Remote ID and Tracking. ASTM: West Conshohocken, PA, USA, 2019; pp. 1–67.
  28. FAA. CFR 14 Part 89: Remote Identification of Unmanned Aircraft; FAA: Washington, DC, USA, 2021.
  29. Weinert, A.; Alvarez, L.; Owen, M.; Zintak, B. Near Midair Collision Analog for Drones Based on Unmitigated Collision Risk. J. Air Transp. 2022, 30, 37–48. [Google Scholar] [CrossRef]
  30. Weinert, A.; Campbell, S.; Vela, A.; Schuldt, D.; Kurucar, J. Well-clear recommendation for small unmanned aircraft systems based on unmitigated collision risk. J. Air Transp. 2018, 26, 113–122. [Google Scholar] [CrossRef] [Green Version]
  31. Raheb, R.; James, S.; Hudak, A.; Lacher, A. Impact of Communications Quality of Service (QoS) on Remote ID as an Unmanned Aircraft (UA) Coordination Mechanism. In Proceedings of the IEEE/AIAA 40th Digital Avionics Systems Conference (DASC), San Antonio, TX, USA, 3–7 November 2021. [Google Scholar]
  32. Wikipedia. Field of View. Available online: https://en.wikipedia.org/wiki/Field_of_view (accessed on 20 January 2023).
  33. Tan, C.Y.; Huang, S.; Tan, K.K.; Teo, R.S.H.; Liu, W.Q.; Lin, F. Collision Avoidance Design on Unmanned Aerial Vehicle in 3D Space. Unmanned Syst. 2018, 6, 277–295. [Google Scholar] [CrossRef]
  34. Community, E. Distance on a Sphere: The Haversine Formula. 2017. Available online: https://community.esri.com/t5/coordinate-reference-systems-blog/distance-on-a-sphere-the-haversine-formula/ba-p/902128 (accessed on 16 July 2022).
  35. DroneTag. All-in-One Solution for Safe Drone Flights. 2020. Available online: https://dronetag.cz/en/product/ (accessed on 7 March 2022).
  36. Wu, Q.; Sun, P.; Boukerche, A. Unmanned Aerial Vehicle-Assisted Energy-Efficient Data Collection Scheme for Sustainable Wireless Sensor Networks. Comput. Netw. 2019, 165, 106927. [Google Scholar] [CrossRef]
  37. Lee, H.K.; Madar, S.; Sairam, S.; Puranik, T.G.; Payan, A.P.; Kirby, M.; Pinon, O.J.; Mavris, D.N. Critical parameter identification for safety events in commercial aviation using machine learning. Aerospace 2020, 7, 73. [Google Scholar] [CrossRef]
  38. Mbaabu, O. Introduction to Random Forest in Machine Learning. Section. Available online: https://www.section.io/engineering-education/introduction-to-random-forest-in-machine-learning/#:~:text=Arandomforestisamachinelearningtechniquethat’sused,consistsofmanydecisiontrees (accessed on 20 June 2023).
  39. Duangsuwan, S.; Maw, M.M. Comparison of path loss prediction models for UAV and IoT air-to-ground communication system in rural precision farming environment. J. Commun. 2021, 16, 60–66. [Google Scholar] [CrossRef]
  40. Schott, M. Random Forest Algorithm for Machine Learning. Capital One Tech. 2019. Available online: https://medium.com/capital-one-tech/random-forest-algorithm-for-machine-learning-c4b2c8cc9feb (accessed on 24 January 2023).
  41. AliExpress. SKYSURFER X9-II 1400mm Wingspan FPV RC Plane Glider. Available online: https://www.aliexpress.com/i/33027340643.html (accessed on 17 January 2023).
  42. AliExpress. 2018 Most New 2000mm Wingspan FPV SkySurfer RC Glider Plane. Available online: https://www.aliexpress.com/item/32869734504.html (accessed on 17 January 2023).
  43. AliExpress. X-UAV Upgraded Fat Soldier Talon Pro 1350mm Wingspan EPO Fixed Wing Aerial Survey FPV Carrier Model Building RC Airplane Drone. Available online: https://www.aliexpress.com/item/1005001870155187.html (accessed on 17 January 2023).
  44. AliExpress. Balsa Radio Controlled Airplane Lanyu 1540 mm E-Fair P5B RC Glider Avion Model. Available online: https://www.aliexpress.com/item/1005002417625454.html (accessed on 17 January 2023).
  45. Akselrod, M.; Becker, N.; Fidler, M.; Lübben, R. 4G LTE on the road—What impacts download speeds most? In Proceedings of the IEEE 86th Vehicular Technology Conference (VTC-Fall), Toronto, ON, Canada, 24–27 September 2017; pp. 1–6. [Google Scholar] [CrossRef]
  46. Mohd Kamal, N.L.; Sahwee, Z.; Norhashim, N.; Lott, N.; Abdul Hamid, S.; Hashim, W. Throughput Performance of 4G-based UAV in a Sub-Urban Environment in Malaysia. In Proceedings of the IEEE International Conference on Wireless for Space and Extreme Environments (WiSEE), Vicenza, Italy, 12–14 October 2020; pp. 49–53. [Google Scholar] [CrossRef]
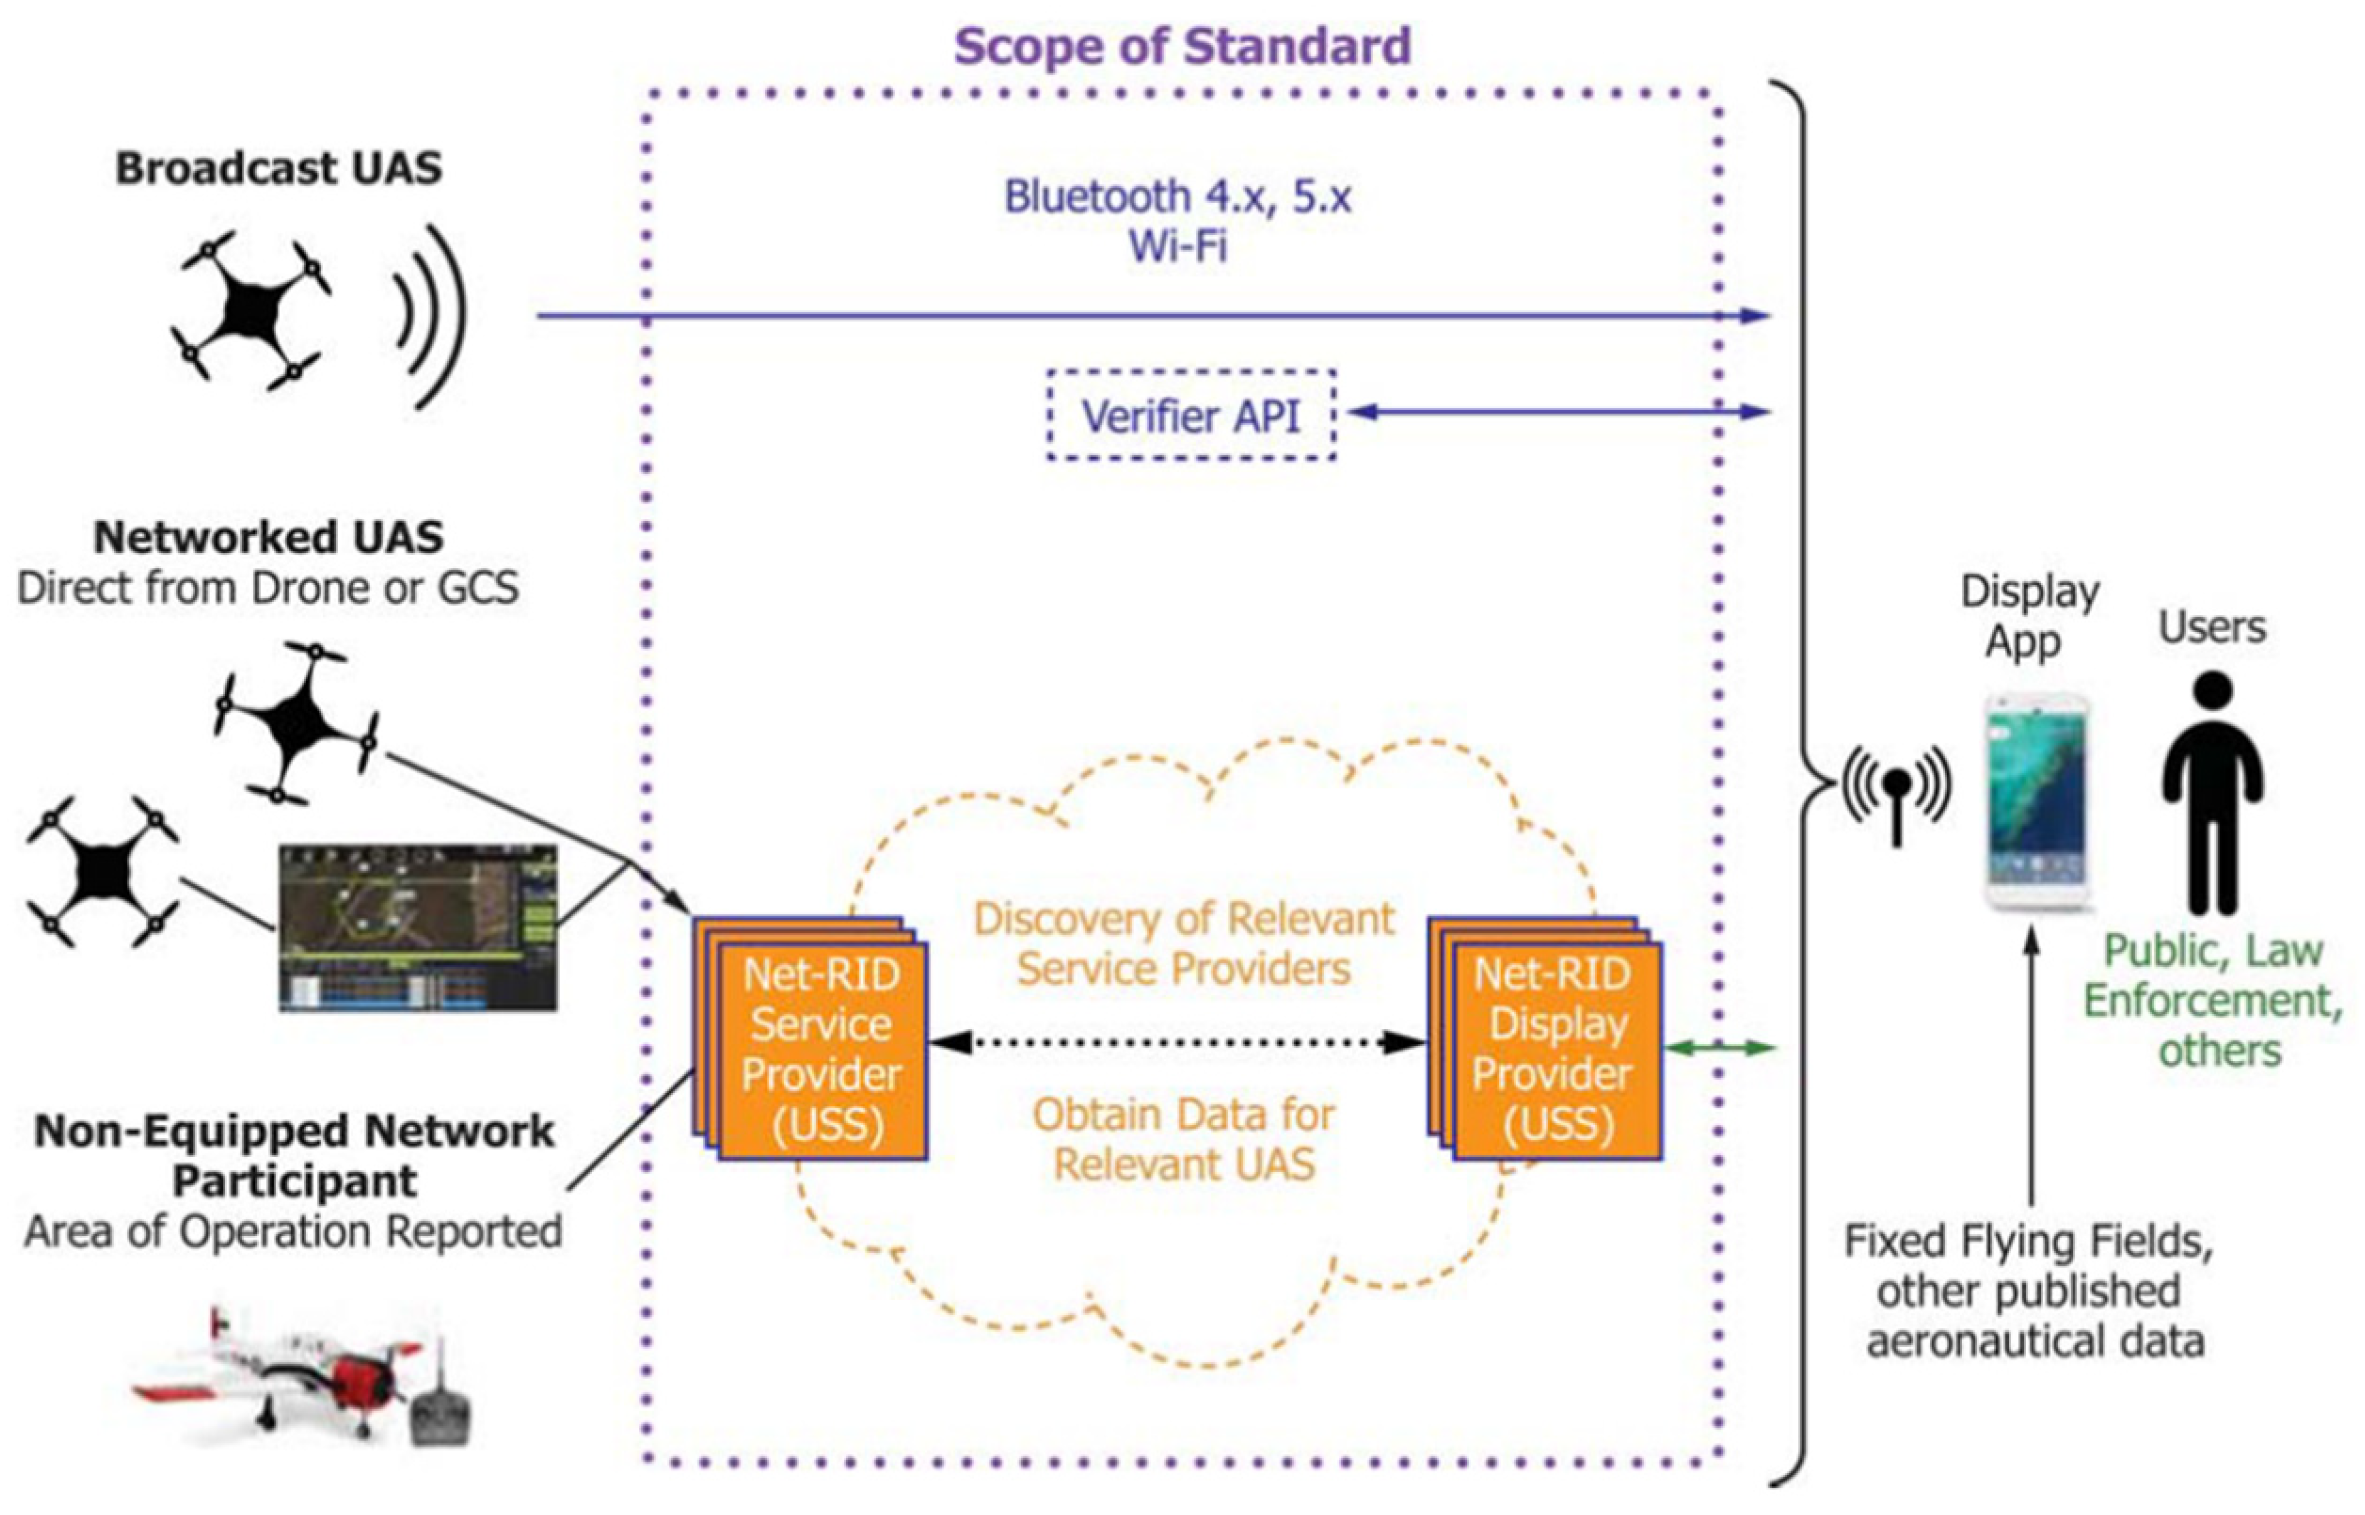
Figure 1. Remote ID conceptual overview [27].
Drones 07 00436 g001
Figure 2. Inverted teardrop detection volume in 3D space with the big arrows as UAV symbols: black is the own UAV and red is the intruder UAV.
Drones 07 00436 g002
Figure 3. Conflict detection algorithm based on the inverted teardrop shape.
Drones 07 00436 g003
Figure 4. UTM monitoring application based on the network Remote ID architecture.
Drones 07 00436 g004
Figure 5. Random Forest classifier algorithm description [38].
Drones 07 00436 g005
Figure 6. UTM monitoring application user interface (Note: Chinese characters are the road names and numbering).
Drones 07 00436 g006
Figure 7. Fixed-wing UAVs used in the flight test with a Remote ID attached (red circle): (a) Sky Surfer 1, (b) Sky Surfer 2, (c) Mini Talon 1, (d) Mini Talon 2, and (e) Lanyu E-Fair with the Remote ID inset.
Drones 07 00436 g007
Figure 8. Two flying locations of the flight tests: (a) near Yunlin HSR station (blue icon) and (b) NFU Agriculture campus (red icon).
Drones 07 00436 g008
Figure 9. Flight test trajectory of record number 8 plotted on Google Earth: module 1 flying in the Sky Surfer 1 (red line) and module 2 on the ground (blue line).
Drones 07 00436 g009
Figure 10. Flight test data from Remote ID module 1 of record number 8 in subplots with the sequence discussed above: (a) flight parameters, (b) detection parameters, and (c) time parameters.
Drones 07 00436 g010aDrones 07 00436 g010b
Figure 11. Flight test data from Remote ID module 2 of record number 8 in subplots with the sequence discussed above: (a) flight parameters, (b) detection parameters, and (c) time parameters.
Drones 07 00436 g011
Figure 12. Boxplots of the latency time analysis based on the livelihood condition (rural and suburban area): (a) broadcast time [s], (b) process time [s], (c) query time [s], (d) latency time [s], and (e) interval time [s].
Drones 07 00436 g012aDrones 07 00436 g012b
Figure 13. Boxplots of the latency time analysis based on the flying condition (fly in UAV or stay on the ground): (a) broadcast time [s], (b) process time [s], (c) query time [s], (d) latency time [s], and (e) interval time [s].
Drones 07 00436 g013
Figure 14. Boxplots of the warning parameters analysis based on the UAV flight parameters: (a) height [m], (b) relative height [m], (c) course angle [deg], (d) yawing rate [deg/s], (e) relative distance [m], and (f) speed [m/s].
Drones 07 00436 g014
Figure 15. Important parameters for latency time.
Drones 07 00436 g015
Figure 16. Uncertainty plot of the regression model.
Drones 07 00436 g016
Figure 17. Important parameters for detection warnings.
Drones 07 00436 g017
Figure 18. Confusion matrix of the detection warning.
Drones 07 00436 g018
Figure 19. Uncertainty plot of the classifier model.
Drones 07 00436 g019
Table 1. Fixed-wing UAVs used in the flight tests.
UAV ParametersSky Surfer 1
[41]
Sky Surfer 2
[42]
Mini Talon 1
[43]
Mini Talon 2
[43]
Lanyu E-Fair
[44]
TypeGliderFPV gliderV-tailV-tailGlider
Wingspan1420 mm2000 mm1350 m1350 m1540 mm
Length960 mm1350 mm828 mm828 mm980 mm
Kit weight690 g1350 g400 g400 g545 g
MaterialEPOEPOEPOEPOBalsa wood
Table 2. Flight test records.
NoDate [YYYY-MM-DD]Time [UTC]LocationScenarioUAV 1UAV 2
12022-10-2902:55:35–02:57:15NFU Agriculture 2Sky Surfer 1Lanyu E-Fair
22022-10-2902:59:00–03:02:00NFU Agriculture2Sky Surfer 1Lanyu E-Fair
32022-11-1102:59:00–03:02:00Yunlin HSR1Mini Talon 1On ground
42022-11-2102:24:45–02:33:00Yunlin HSR1Mini Talon 1On ground
52022-11-2402:19:00–02:29:00Yunlin HSR1Mini Talon 1On ground
62022-11-2402:45:00–03:04:00Yunlin HSR1Mini Talon 1On ground
72022-12-0203:26:00–03:34:30NFU Agriculture1Sky Surfer 2On ground
82022-12-0902:14:30–02:20:00NFU Agriculture1Sky Surfer 1On ground
92022-12-0902:44:15–02:50:15NFU Agriculture2Lanyu E-FairMini Talon 2
102022-12-2303:03:00–03:10:00NFU Agriculture2Sky Surfer 1Mini Talon 2
Disclaimer/Publisher’s Note: The statements, opinions and data contained in all publications are solely those of the individual author(s) and contributor(s) and not of MDPI and/or the editor(s). MDPI and/or the editor(s) disclaim responsibility for any injury to people or property resulting from any ideas, methods, instructions or products referred to in the content.