1. Introduction
We define disaster situation awareness as the ability of the authorities to effectively and efficiently detect the negative effects of disasters so that aid operations can be planned and executed in a timely manner. In general, the objective is twofold: to understand the type and magnitude of the damage caused and to determine the conditions and locations of the persons that need help.
The concept of
situation awareness has been studied extensively and applied in several areas [
1] such as disaster management [
2]. Unmanned aerial vehicles (UAVs) (also known as drones), for example, can be used to detect the effect of disasters [
3]. UAVs flying over a disaster area can take, compare and analyze images obtained before and after the disaster. Although UAVs can be considered adequate for some purposes, they may fall short of detecting certain facts such as the location of persons under rubble. Moreover, UAVs may take a considerable amount of time before their missions are completed. Nevertheless, during the last decade, we have observed the introduction of the concept of so-called
advanced air mobility (AAM) and its implementation by unmanned aerial systems (UASs), where swarms of UAVs cooperate together for a common mission [
4]. All these new technologies help in creating more effective disaster management systems.
Additionally to the use of UAVs, disaster-related data can be gathered from various sources. For example, dedicated sensors can be attached to physical objects such as residences, bridges, and roads to detect if the corresponding structure is damaged [
5]. Base stations of mobile network providers may supply information about the location and use of mobile phones [
6]. Dedicated systems can be brought to the disaster area, such as microwave radars to determine if there are living persons under rubble [
7]. Official registration databases can be consulted to estimate the possible victims of the collapsed residences. For brevity, in this article, such devices and systems are abstracted as data sources.
Emergency control centers aim at minimizing the negative effects of disasters by detecting and monitoring disaster situations and by carrying out aid operations accordingly [
8,
9]. The success of these centers depends on the accuracy and timeliness of the gathered data. There is a large set of possible data sources, each with its advantages and shortcomings.
Data fusion [
10] is a promising technique to get the best out of multiple data sources. Due to high investment costs, before designing and implementing data fusion systems, it may be beneficial to estimate the optimal set of data sources that give the best combined effectiveness, cost, and timing values of sensor fusion. This requires a set of tools for the analysis and/or synthesis of heterogeneous data fusion systems before they are installed. Implementation alternatives of data sources and fusion techniques are considered out of the scope of this article.
Unfortunately, there are almost no publications devoted to analysis and synthesis of prospective data fusion configurations in disaster/earthquake management. Moreover, most proposed solutions are problem- and/or system-specific. What is needed is a framework which enables us to define models for a large category of data fusion alternatives. These models can for example be formed manually by an expert or be computed by synthesis algorithms. The framework should be extensible to introduce new models of geographical elements, data sources, and analysis and synthesis algorithms.
The contributions/novelties of this article are as follows. First, to detect disaster situations, a novel domain model is defined for representing the relevant data sources. In this article, earthquakes are chosen as an example of disaster. Second, to represent geographical areas, an object-oriented model is defined. In addition, dedicated queries are introduced to create models of data fusion associated with a selected set of geographical entities. Third, a model-based framework is introduced to specify the candidate data sources for a given geographical area. Fourth, with the help of the framework, the effect of various alternatives of data fusion can be estimated. Last, to synthesize the optimal set of data sources within specified constraints, algorithms are defined. To the best of our knowledge, such a framework has not been proposed by the research community before.
This article is organized as follows. The following
Section 2 introduces the background and related work.
Section 3 presents the problem statement, the research questions, and the method adopted.
Section 4 describes the model base for data sources, presents the domain model, and gives examples of a selected set of data sources. The architecture of the framework and the associated object-oriented models are explained in
Section 5.
Section 6 defines the objectives of data fusion and presents formulas to calculate a selected set of quality values of the user-defined data fusion models. Two synthesis algorithms are presented in
Section 7.
Section 8 describes how the proposed framework can be extended to support UAS-based data fusion systems.
Section 9 discusses the threats of validity of the assumptions made in this article.
Section 10 presents our research plans. Finally,
Section 11 gives the results and conclusions. The
Appendix A and
Appendix B present the estimated characteristics of the data sources which are referred to in this article.
2. Background and Related Work
2.1. Situation Awareness
From a
systems perspective,
situation awareness can be defined as enabling systems to sense, adapt, and react, based on the environment. During the last decades, within various application domains, a considerable number of research publications has been presented on situation awareness such as military [
11,
12,
13], disaster management of different kinds [
2,
14], smart manufacturing [
15], tourism [
16], connected cars [
17], and advanced aerial mobility applications [
18]. In [
1], situation awareness is studied conceptually from the perspective of human behavior.
The publications on situational awareness can be classified from several perspectives. Although there are similarities, the application domain is the one of the determining factors in the way a system with situation awareness is designed. Most publications on situation awareness are, therefore, ‘problem specific’ [
11,
12,
13,
14,
15,
16,
17,
18]. For example, in [
13], conceptual models are presented to evaluate the quality of symbolic information, and to semantically integrate heterogeneous and dynamic environments with cyberspace exploration. The initiatives presented are interesting but are specific to defense and security domains. A considerable effort may be needed to adapt the proposed techniques to reduce disaster situation awareness problems.
Furthermore, the majority of publications propose a particular system and discuss how the system accomplishes its design objectives. These publications are ‘system specific’.
Models for representing environments are considered important in the way data are gathered and interpreted. In this context, for example, data fusion techniques are evaluated [
15]. Various analysis methods are proposed, for example, based on statistical analysis [
19], Bayesian networks [
20], and ontology-based techniques [
21]. Multiplicity of data sources, such as crowd-sourcing, sensors, UAVs, and fusion of these are also investigated [
22].
2.2. The Disaster Situation Awareness Problem
The disaster situation awareness problem is a special case of the general situational awareness problems discussed in the previous section. Immediate and accurate detection of disaster situations is crucial for an effective and efficient response. Unfortunately, depending on the kind, size, and intensity of disaster situations, emergency control centers may have difficulties in obtaining the necessary information as needed. We termed this problem the disaster situation awareness problem. There have been a considerable number of research publications on earthquake prediction, but unfortunately, on-time prediction is still a difficult problem [
23]. Although this article focuses on the data sources necessary for after an earthquake period, naturally, the necessary data fusion system must be planned, designed, and installed before a disaster occurs.
When a disaster occurs, emergency control centers try to gather information from all kinds of sources such as victimized persons, existing sensors, telephone calls, authority reports, UAVs, and satellite images [
24,
25,
26]. There are a considerable number of publications on disaster/earthquake management [
2,
8,
9,
14,
26]. To increase accuracy and efficiency of disaster situational awareness, data obtained from more than one data source must be fused and interpreted, preferably in an automated way.
One of the main problems in enhancing disaster situation awareness is the high investment costs. Firstly, to improve the awareness, it may be necessary to install many kinds and numbers of data sources within a large geographical area. Secondly, designing such a large-scale data fusion system is a challenging task due to the topological complexity of urban areas, and the multiplicity and variability of the available data sources. Therefore, automated tools are needed.
2.3. UAVs and Data Fusion Techniques
UAVs can be defined as small aircraft that can be operated remotely by pilots or programmed to operate without the assistance of humans. UAVs were originally developed for military purposes, but they are now a major focus of research in several disciplines. The technical characteristics of UAVs play a significant role in their categorization, such as technology used, level of autonomy, size, weight, and energy resources. UAVs are often equipped with a variety of sensors, including radars, television cameras, global positioning systems (GPS), satellite communications, image intensifiers, and infrared imaging technology [
27].
Nowadays, UAVs are used in many application domains, such as: precision agriculture [
28], construction and infrastructure inspection [
29,
30], and rescue of people [
31] and also in the same context of this article—disaster management. For example, a literature review on the application of drones in the disaster management context is presented in [
26]. The authors of that work have analyzed papers from 2009 to 2020 and classified them into four categories: (1) mapping or disaster management; (2) searching and rescuing; (3) transportation; and (4) training.
UAVs can be also prepared for specific missions such as face recognition. In [
32], for example, a deep neural network model is presented to improve the performance of face detection and recognition tasks when photos are taken from high altitudes. However, in the case of earthquakes, detecting living persons under the rubble is an important concern, where no face information is available. Our article does not focus on the algorithms which can be adopted in the implementation of data sources. Nevertheless, such techniques can be adopted to improve the quality of data sources suitable for certain disaster types.
There are attempts to measure the concentration of gases and aerosols in the atmosphere by installing the necessary equipment on board commercial airliners [
33]. The samples are collected with an inlet probe, which is connected to the equipment on board. This allows accurate sampling of aerosol and chemical contents. The samples are analyzed in ground-based laboratories. These data can be used, for example, in cases where forest fires have to be monitored. Such techniques can be linked to other data sources such as satellite data and to UASs ascending in situ.
It is stated that although there is a significant increase in the number of publications on use of drones in disaster cases, a limited amount of research is observed to address post-disaster healthcare situations especially with regards to disaster victim identification.
Another topic related to this paper is remote sensing [
34], which is used to describe information that is gathered from distant targets. This is usually done by satellites, aircraft, and UASs. An interesting example of remote sensing using imagery taken from commercial flights is presented by Mastelic et al. [
35].
Data fusion techniques are introduced to enhance the accuracy and reliability of multiple but related data sources [
10,
36,
37]. In [
37], for example, a survey of simultaneous localization and mapping (SLAM) and data fusion techniques for object detection and environmental scene perception in unmanned aerial vehicles (UAVs) is presented. The analysis performed by the authors revealed that a combination of data fusion and SLAM can assist in autonomous UAV navigation without having a predefined map. In this approach, raw sensor data are directly provided as an input to the SLAM algorithms. The data fusion process may be made more end-to-end using machine learning techniques. These techniques are suitable in enhancing the effectiveness and efficiency of data detection by UAVs, for example, to improve situation awareness.
Another related work is presented in [
38], in which a survey on UAV orthoimage generation technologies that focus on mainstream frameworks is presented. The authors give a detailed comparison of the important algorithms by referring to their performances and propose extending the frameworks with deep learning techniques. Our focus in this article is more on the fusion of heterogeneous data sources but not on the techniques adopted in the implementation of individual data sources.
In the literature, data fusion techniques are classified as signal fusion and information/data fusion [
39]. Signal fusion is used to combine information from multiple sources that measure the same type of physical phenomena, but with different characteristics. Information fusion combines data/information from multiple sources to provide a more accurate understanding of a situation. This article adopts information fusion techniques.
Due to the progress in sensor technologies and related systems, in addition to UAVs, it may be beneficial to adopt multiple data sources to enhance awareness of disaster situations.
None of the publications, however, propose analysis and synthesis methods for the purpose of determining the optimal set of data sources, before expensive design and implementation activities are carried out. Moreover, model-based frameworks are in general not supported, meaning that system architectures are fixed and when needed, they can not be easily extended, for example, by introducing new geographical and data source models, and different analysis and synthesis algorithms.
2.4. Advanced Air Mobility and Enhancing Disaster Situation Awareness
Recently, there has been considerable interest in the concept of
advanced air mobility (AAM), which aims to provide safe and reliable on-demand aerial transportation for customers, cargo, and packages [
4]. The UASs (unmanned aerial systems) may consist of swarms of systems with multiple UAVs, ground-stations, various data sources, autonomous vehicles, smart mobile devices, etc. [
4,
18,
40].
Research topics include a combination of challenges from many disciplines, such as design of UAVs, situation awareness from a broad perspective, autonomous navigation and coordination, and safety and reliability issues.
UASs can bring additional opportunities for improving situation awareness for disaster/earthquake management. Firstly, UAVs may not only function as data sources but also as the possible data fusion nodes. Secondly, in addition to ground-based data sources, a swarm of UAVs can dynamically cover a large area for better situation awareness. Thirdly, UAVs can share certain responsibilities among each other in lifting some heavy equipment such as radars and precision optical devices.
To the best of our knowledge, analysis/synthesis of UAS-based data fusion systems for disasters/earthquakes have not been studied sufficiently in the research media. We will elaborate on these opportunities later in this article as a future work.
4. Domain Model for Data Sources
In this section, first a model of the domain of data sources which can be used for detecting the effects of earthquakes is given. Second, a selected set of data sources is described in more detail.
4.1. A General View of the Domain
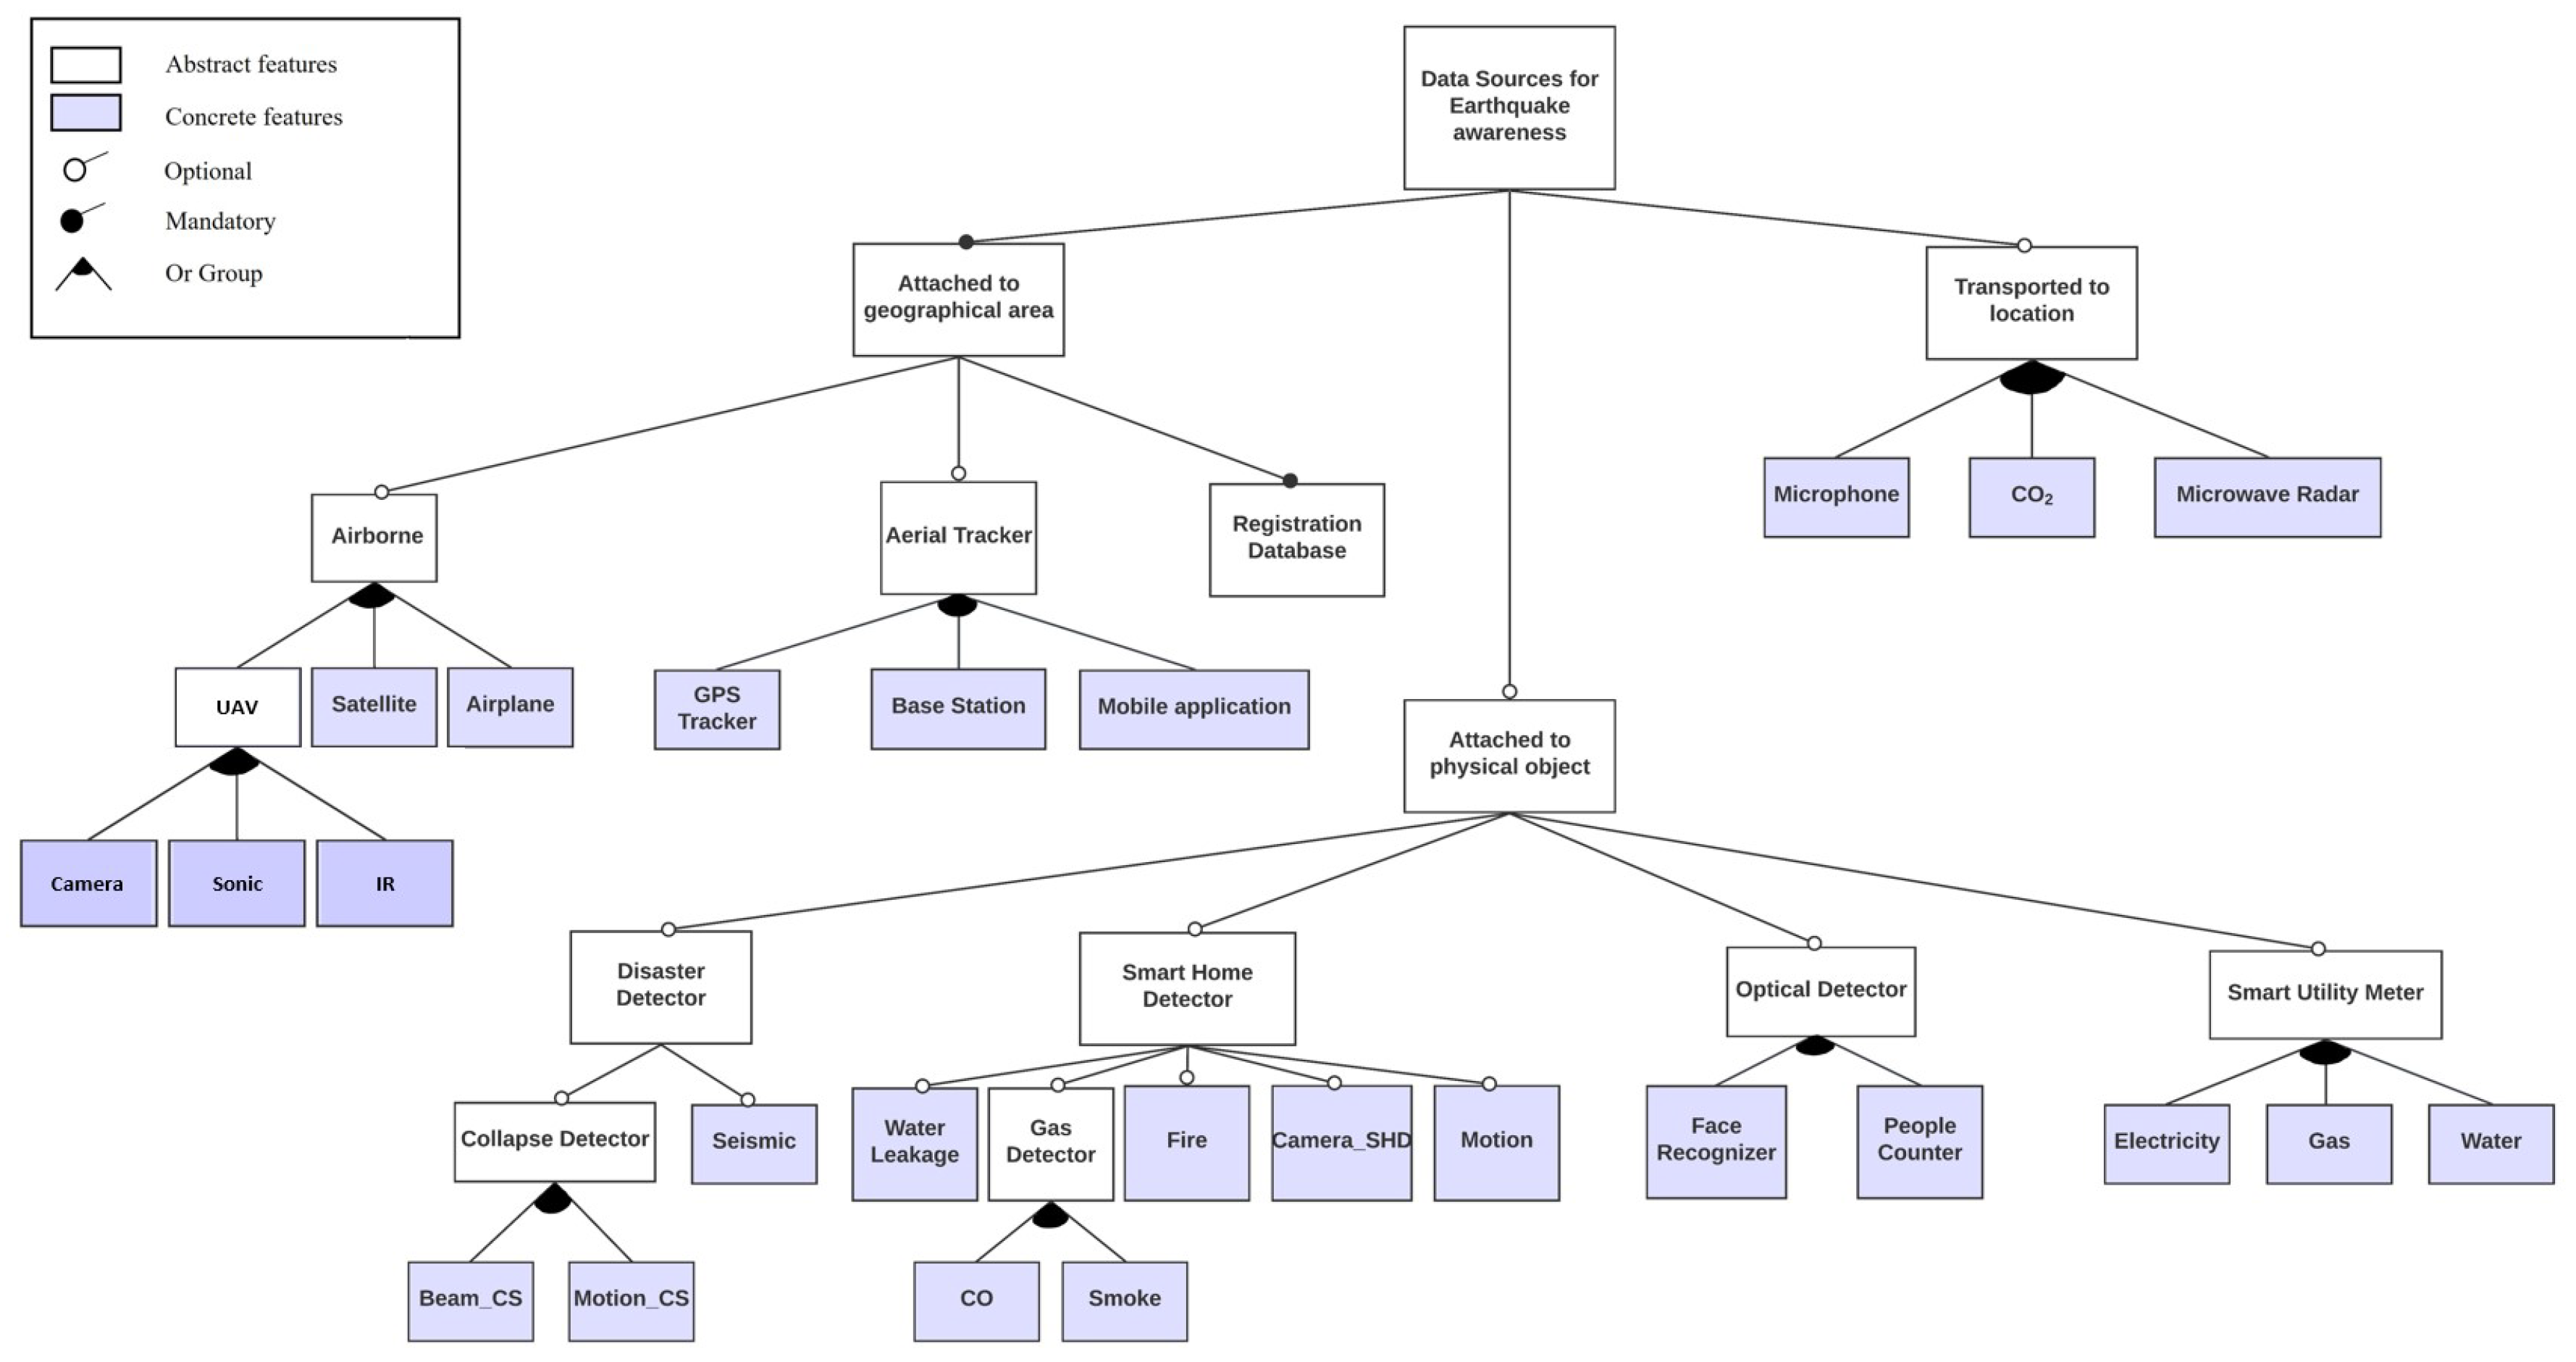
To represent the relevant data sources in a diagram, we adopt the feature diagram notation [
45]. This notation was defined to visually express the features of the domain of interest, and it consists of symbols to represent mandatory features, optional features, group, alternative group, abstract features, and concrete features. The diagram is in fact a visual representation of propositional logic formulas [
46].
In
Figure 1, depending on the attachment characteristics of the data sources, the domain is divided into three branches. The first branch represents the data sources which can be attached to geographical areas. The second branch represents the data sources which can be attached to physical objects. The third branch represents the data sources which can be transported to the locations where disasters have been effective.
The first branch consists of three sub-branches: Airborne, Aerial trackers, and Registration database. The second branch has four sub-branches: Disaster detector, Smart-home detector, Optical detector, and Smart utility meter. The third branch has three sub-branches: Microphone, Carbon dioxide meter, and Microwave radar. The gray-colored rectangles correspond to the concrete features. The white-colored rectangles must be refined into the concrete ones.
The feature model can be used to create a concrete model by using the following strategy:
Starting from the root node, select the compulsory features, if any.
Decide if the optional features must be selected, if any.
By obeying the defined semantics, refine the features which are grouped together by the logical operators of the feature model (for example OR, Alternative OR), if any.
Continue with this process from the abstract features towards the concrete ones until no optional and/or abstract feature is left unresolved.
In this strategy, it is assumed that all leaf features are concrete and no cross-tree constraints are specified. In
Figure 1, the compulsory features are ‘Attached to geographic area’ and ‘Registration database’, since registration of inhabitants is generally enforced by law.
The model given in
Figure 1 can be extended by adding new data sources or refining the existing abstract features. Additionally, there may be many commercially available data sources in the market with varying characteristics. These can be added to the figure as the leaves of the tree structure. We will now elaborate on these data sources in more detail.
4.2. Data Sources Which Can Be Attached to Geographical Areas
Airborne data sources: UAVs, airplanes, and satellites [
3,
25] are considered in this context. They can be used to observe a large area by sending images or videos of the disaster area via a communication link to a ground station.
In this diagram, we consider three data sources for UAVs: Camera, Sonic, and IR. Optical cameras are especially relevant for estimating the effect of disasters such as earthquakes. They can have a high probability of detection especially during a daytime surveillance mission. Ultrasonic sensors (Sonic) can be used at low altitudes, for example, to measure the level of floods. Infrared sensors (IR) can be used to detect living creatures and moving targets such as vehicles from altitudes of 1 to 5 km.
Cameras and infrared sensors can also be attached to satellites and airplanes. It is assumed that the gathering time with airplanes is higher than that of UAV. The response time of a satellite depends on many factors, for example, whether it is geosynchronous or not, the location of the satellite, the availability of online tracking by the base station, etc. For brevity, the sub-features of satellites and airplanes are not shown in the figure.
Aerial trackers: Within this context, we consider GPS trackers [
47], mobile phone applications [
48], and base-stations [
6]. These data sources are relevant for estimating the coordinates of persons. The accuracy of detection of positions of persons depends on where the tracked persons are located. A GPS tracker is useful in tracking position, direction, and time of movements. Mobile phone applications are also based on GPS; however, they use the internal sensors of a mobile phone and track position through an application. Base stations track positions based on online information about the registered mobile phones.
Registration database: Every well-organized municipality has a well-maintained list of inhabitants per location. This information can be used to estimate the existence of persons under the rubble after the occurrence of earthquakes. However, the probability of detection depends on many factors. In addition to a normal living pattern, a person may be living in multiple addresses, temporarily away from home, or even not living at that address at all. The probability may also depend on night- or day-time occurrences of the disaster.
4.3. Data Sources Which Can Be Attached to Physical Objects
Collapse Detector: The purpose of this data source is to determine whether a structure has been broken or not. A motion sensor detects the movement of an object at a given location. A beam sensor can measure whether the surface of a structure is straight or not.
Seismic Sensor: It may detect ground oscillation, and accordingly outputs a signal as a waveform [
49]. This sensor can be useful in estimating the effect of earthquakes. It can accurately measure the intensity of an earthquake. However, to determine whether the structure has been damaged or not, one needs precise information about the robustness of the corresponding structure and the ground mechanics of the location.
Smart home detectors: These sensors are commonly used in households for the purpose of protecting the inhabitants from incidents such as water and gas leakage, smoke and fire, and burglary [
50]. The usefulness of these data sources depends on the type of smart home detector. For example, consider the following sensors:
Carbon Monoxide sensor is designed to warn the user of any unusual build-up of CO in where it is located. Smoke sensor measures the presence of smoke and detects fire by sensing small particles in the air. Fire sensor detects fire according to the occurrence of flames by sensing light beams. Motion sensor is used for detecting motion around the sensor. Camera can detect motion, record, and give a warning.
Motion and camera detectors can be useful in estimating the presence of persons. One important issue with these sensors is that adopting them for disaster detection may interfere with the privacy of the inhabitants. We therefore assume that unless permission is given, these sensors can only be attached to open areas such as schools, shopping centers, hospitals.
Optical detectors: In this context, we consider face recognition systems [
51] and people counters [
52]. Face recognizer is a way of confirming an individual’s identity using an online face image. To this aim, images of the persons to be identified must be pre-recorded by the system. With the help of pattern recognition algorithms, the online image is classified according to the recorded images. These systems may hep in estimating the locations of persons. In addition, the camera that is used for face recognition may also function as a disaster detector, if programmed accordingly. People counters are used to count the number of persons entering or leaving a location. This sensor can help in estimating the presence of persons.
Utility meters: In this context, smart electricity, water, and gas meters are considered [
53]. These meters record information about the consumption of electrical energy, water, and/or gas. The gathered data can be used to infer the living patterns within a location and as such, they can help in estimating if anyone is present in a location just before the occurrence of an earthquake.
4.4. Data Sources Which Can Be Transported to Certain Locations
Microphone, carbon dioxide meter, and microwave radar: These data sources are generally used after earthquakes by transporting them to the location of the disaster. Microphones are brought under the rubble to detect any meaningful sounds. Carbon dioxide meters measure the breathing of living creatures [
54]. Similarly, microwave radars [
7] detect movements of persons and breathing of lungs. All these data sources are relevant for estimating the location of persons. Microwave radars are quite accurate and effective; however, they are much more expensive than the other two sensors.
Other data sources:For brevity, this article mainly focuses on data sources that can be used for earthquake detection. There are of course many more data sources which can be used for various purposes. For example, barometers and compasses are mainly used by the flight control systems of UAVs; such data sources are considered out of the scope of this article. The adoption of a mobile analysis laboratory in situ is a promising approach which is likely to be more often used in detecting the effects of disasters including earthquakes [
33].
5. Architecture of the Framework
This section describes the framework that is designed for the analysis and synthesis of the prospective data fusion alternatives. The intention of this section is not to explain the implementation of the system in detail, but rather provide an architectural view and abstract technical description so that the reader may gain an insight into its structure and the working of it.
A symbolic representation of the architecture is given in
Figure 2, using the ‘UML component diagram’ notation. Three stakeholders are shown in the figure:
Analyst,
Data source modeler, and
Geographical area digital-twin modeler in ‘actor’ notation. The stakeholder
Designer of the system, who is in charge of designing and implementing the framework, is not shown here. With the help of the component
UI, the
Analyst analyzes or synthesize the prospective sensor fusion alternatives. To this aim,
Data source modeler defines the models of the available data sources using the feature-modeling tool, as explained in the previous section.
Geographical area digital-twin modeler is responsible for creating a model of the geographical area that is considered. The
UI component retrieves data from the components
Feature-modeling tool and
OO database. The component
OO database, in turn, accesses the component
Digital-twin model of Geographical-area. An external
GIS database provides the necessary data for this purpose. The component
UI utilizes the functions offered by the component
Model evaluator for the analysis and synthesis operations. The component
Algorithms offers the necessary algorithms for both analysis and synthesis. For dynamic menu generation, the components
Simulator and
OO database use the services of the component
UI.
The proposed architecture is ‘model-based’. Without modifying the system, data source and geographic information system models can be defined and introduced into the system with the help of model management tools. In addition, UI menus, analysis and synthesis algorithms, and most system functionalities are designed as plug-ins; they can be replaced after the installation of the system without re-compilations.
The model of the geographic area is based on CityGML [
55], which is an extensible Geographic Information System (GIS) specification. The models and meta-models of CityGML can be extended by subclassing the existing classes. However, it is claimed that the current models of CityGML are not expressive enough to represent the data structures required by disaster management systems, and to this aim, an extension of CityGML is proposed [
56]. In this article, we adopt the proposed extension, where a rich set of element types are supported, such as Bridge, Factory, Financial Center, Firefighter Station, Historical Buildings, Hospital, Logistic Center, Residence, Restaurant, Road, School, and Shopping Center. In addition, disaster-specific data types are defined such as Emergency Control Center, Collapse, Fire, Flood, Landslide, and Tsunami.
Figure 3 shows a snippet of class Residence. The attributes of class Residence are grouped in three categories marked with the stereotypes constant, dynamic, and derived.
The attributes tagged with the stereotype <<constant>> are those whose values are set during the instance creation phase, when a digital-twin model [
57] of an urban area is defined. Regarding the attribute
robustnessFactor, it is defined by experts depending on the earthquake resilience properties of the construction and the ground mechanics of the construction site [
58]. The value of this attribute can be set as ‘undefined’, or be defined within the range of 0 to 5.
The dynamic attributes are those whose values may change in time. For example, the attribute nOfPersons can be estimated, set, or modified by a simulator, or it can be based on an estimated number, derived from the relevant data sources.
The dynamic attributes whose names begin with the word attached, are responsible for storing the data sources that are attached to the corresponding instance of class Residence. As we are dealing with a modeling environment, the values of these attributes are objects that represent the data sources. They are also used for calculating the effectiveness, timing, and cost factors of the corresponding instance.
The dynamic attribute queries contain a set of ‘command-query objects’ which can be executed on the instances of this class. Each element class, such as class Residence, may have a dedicated set of queries, which can be stored and retrieved by calling on the corresponding ‘setter and getter’ methods. This provides run-time extensibility in the kinds of queries a class may provide.
The Analysis Process
The analyst may utilize the system, for example, in the following way:
Let us assume that a number of instances of class Residence has been created which represents a selected set of actual residences of an urban area under consideration. In this process, the constant attributes of these instances have been initialized as well.
Additionally, for the instances of class Residence, a set of dedicated ‘command-query objects’ has been defined and stored in the attribute queries.
At this stage, these instances are now ready for use to analyse a model of a prospective sensor fusion system. First, a fusion model must be defined.
With the help of the user interface (UI), the analyst observes these queries, which are displayed at the UI as menu items. An implementation of Command pattern [
44] provides a dynamic menu generation mechanism.
To simulate the attachment of the prospective data sources, an appropriate query is selected by activating the corresponding menu item. The data source objects are also selected by using the feature-modeling tool as defined in
Section 4.
With the help of an object-oriented database, and depending on its definition, the selected query item is executed over one or more instances of class Residence.
While executing the query, the database calls on the necessary ‘setter methods’ of the corresponding instances. To this aim, class Residence provides the necessary method interface.
Depending on the query, the selected data source objects are stored in one or more instances of class Residence.
In contrast to the constant attributes, the derived attributes are computed. Consider the following process as a follow-up step of the previous example:
- 9.
When the data source objects are stored in an instance of class Residence, the method calculateEffectiveness() is called on ‘self’.
- 10.
This method retrieves the properties of the stored data source objects, and by using the formulas presented in this article, it computes the values of the derived attributes.
- 11.
If a new set of data source objects is stored, the derived attributes are computed in the same way again.
- 12.
Now assume that the analyst executes another menu item for attaching a UAV as a data source on the corresponding geographical area.
- 13.
In our system, a geographical area is represented as an instance of class GeographicArea. The method
notifyAttach() is automatically called on the corresponding instances of class Residence, when a data source, such as a UAV is attached to the corresponding geographical area. An implementation of Observer pattern [
44] provides an ‘event propagation’ mechanism.
- 14.
When called, this method reads the characteristics of this new data source, registers its identity, and calculates the derived attributes again. Similarly, the method notifyDetach() is used when the corresponding data source is removed from the geographical area.
The other implementation-related attributes and methods of class Residence are not shown for brevity. Of course, the process given in this section has the intention to clarify a possible usage of the instances of class Residence. In the implementation phase, depending on the language adopted, different coding alternatives may be used.
Class Residence is not the only modelled element in the system. All physical objects share certain properties such as constant, dynamic and derived attributes, a number of ‘setter and getter’ methods, methods to calculate the derived attributes, and methods which are used for notification purposes. Adopting a standard interface for all physical objects enables interfacing with the object-oriented database smoothly. The query objects per class may differ considerably from each other. Nevertheless, these objects have a uniform interface with the UI and the database. For brevity, we do not show the other class diagrams in this article.
Example 1. Assume that the prospective data sources for sensor fusion are selected as follows:
Face recognizer: This is attached to the corresponding physical instance.
Collapse detector: This is attached to the corresponding physical instance.
UAV camera: This is attached to the corresponding geographical area.
The data sources Face Recognizer and Collapse Detector are attached to the instances of class Residence using the following queries:
Q1
ATTACH_ENTRANCE WHERE
physical_object == ‘Residence’ AND data_source == ‘FaceRecognizer’
Q2
ATTACH_BASEMENT WHERE
physical_object == ‘Residence’ AND data_source == ‘CollapseDedector’
Q3
ATTACH_ENTRANCE WHERE
physical_object == ‘Residence’ AND data_source == ‘FaceRecognizer’
AND physical_object.id == ‘instance’
Q4
ATTACH_ENTRANCE WHERE
physical_object == ‘Residence’ AND data_source == ‘FaceRecognizer’
AND physical_object.robustness_factor ‘<3’
Q5
ATTACH WHERE
physical_object == ‘GeographicRegion’
AND physical_object.coordinates == ‘coordinates’
AND data_source == ‘UAV-camera’)
In Q1, ‘ATTACH_ENTRANCE WHERE’ is the query command, ‘physical_object’ denotes to one or more target objects of the query, and ‘data_source’ specifies the data source to be attached. This query selects all the instances of class Residence. Q2 is similar to Q1; however, as a data source, ‘CollapseDedector’ is attached. In Q3, with the help of the statement “physical_object.id == ‘instance’” only one instance is selected. The word ‘instance’ here is used as a pseudo variable and must be replaced with a real instance defined in the simulation environment. Q4 selects all the instances of class Residence provided that their robustness factors are less than 3. Q5 selects a geographical region identified with the specified coordinate values and attaches a UAV camera as a data source.
The query specifications Q1 to Q5 are so-called ‘write’ queries. The system also supports ‘read’ queries which are embedded into certain menu items. These queries are called in the implementation of the menu items for analysis purposes, for example, to display the effectiveness, cost, and timing values of certain data fusion compositions. For brevity, these are not shown here.
6. Objectives and the Effects of Data Fusion
This section first defines the objectives of data fusion under five items. Second, based on the objectives, the combined effect of data fusion is presented.
6.1. Quality Objectives of Data Fusion
This section delineates the calculation of the individual effectiveness, cost, and timing values of the data sources that are introduced in the previous section.
In the Cambridge dictionary [
59], effectiveness is defined as “achieving the result that you want”. In our context, the effectiveness value is considered from the perspective of the following three objectives:
Objective 1: The accuracy of estimating the effects of disasters is represented as a probabilistic variable. This value must be sufficiently high for a given purpose;
Objective 2: The accuracy of estimating the horizontal coordinates of a (living) person after a disaster as a probabilistic variable. This value must be sufficiently high for a given purpose;
Objective 3: The accuracy of estimating the vertical coordinates of a (living) person after a disaster as a probabilistic variable; this value must be sufficiently high for a given purpose.
For each data source, the effectiveness values can be taken from the related product catalogs and/or computed by experimentation. The effectiveness values must be computed per objective and assumed to be between 0 and 1, where 1 is the maximum possible effectiveness.
For each objective, different data sources can be selected and used. In case of adoption of multiple data sources for a given objective, the total effectiveness value is computed according to the data fusion formulas, which are given in
Section 6.2.
The cost and timing values are considered by the objectives 4 and 5:
Objective 4: The estimated cost value of a data fusion per element which is represented as a probabilistic distribution function. This value must not exceed the budgeting constraints;
Objective 5: The estimated timing value of a data fusion per element which is represented as a probabilistic distribution function. This value must not exceed the deadline constraints.
In
Appendix A, three tables are defined that contain the estimated parameters for the effectiveness, cost, and timing values of the prospective data sources.
6.2. Calculating the Effect of Data Fusion
The estimated effect of fusion of a set of data sources depends on the contribution of each data source if they are attached to the same element. The effect must be estimated according to one of the objectives defined in the previous section.
For determining the effectiveness values, depending on the characteristics of the geographical elements, prospective data sources, and the size and structure of the fusion, one may use different models of computation. Arithmetical formulas, statistical methods [
19], Bayesian networks [
20], Markov models, [
60] etc., are typical examples. We observe, however, three determining factors: First, the model of computation must match the physical properties of the fusion. Second, it must be computationally efficient since these computations may need to be carried out many times especially during a synthesis process. Third, a library of alternative algorithms must be available if desired. This will give flexibility to the user in deciding the best algorithm for a particular case.
In this article, the unit of calculation is based on one of the element types within a geographical area such as a residence.
Basically, there are two cases:
In the following, we define three alternative formulas; Weak, Average, and Strong Contributions:
Weak contribution: Per effectiveness objective, the selected
N data sources are ranked according to their effectiveness value from
, where 1 represents the data source with the highest effectiveness value and
N is the lowest. The effectiveness of data fusion of the element
which is denoted as
with respect to objective
which is denoted as
is calculated using the following formula:
where,
is the estimated effectiveness value of the data fusion computed as a series of contributions of the ranked data sources,
is the effectiveness value of the first data source in ranking,
and
are the effectiveness values of the
and
data sources in ranking, respectively.
Medium contribution: This formula uses the same parameters as the Equation (
1). The only difference is, in Equation (
2),
the component of the formula is not squared.
Strong contribution: This formula uses the same parameters as the Equation (
2). The only difference is, in Equation (
3), the
component of the formula is not squared.
The effects of the three formulas are illustrated in the
Figure 4. Here, the green, orange, and blue lines display the weak, medium, and strong contributions, respectively. This figure is drawn with the assumption that every additional data source has the effectiveness value 0.5. It can be seen that green contribution has an upper bound of approximately 0.6.
Example 2. Let us assume that the following data sources are to be considered for the residence R:
A UAV-camera is dispatched to the geographical area.
There is a base station in the geographical area.
One collapse detector is installed at the ground floor.
There exists a registration database.
There is a face recognizer at the entrance of the building.
The camera of the face recognizer is used also as a collapse detector.
Objective 1 (effectiveness): To estimate the effectiveness value for this objective, using the
Table A1 and
Table A2 from
Appendix A and based on the mean values of the distribution functions, the data sources under consideration are ranked:
The data sources 4, 5, and 6 do not contribute to the considered effectiveness objective.
The data sources 1, 2, and 3 contribute strongly to each other.
The estimated effectiveness value of the residence
R with respect to objective 1 can be computed using Equation (
3):
Objective 2 (effectiveness): To calculate the estimated effectiveness value of this objective, using the
Table A1 and
Table A2 and based on the mean values of the distribution functions, the data sources under consideration are ranked:
The data sources 3, 4, 5, and 6 do not contribute to the considered effectiveness objective.
The data sources 1 and 2 strongly contribute to each other.
The estimated effectiveness value of the residence
R with respect to objective 2 can be computed using Equation (
3):
Objective 3 (effectiveness): This estimated effectiveness value of objective 3 is the same as the one of objective 2.
Objective 4 (total cost value): The total cost value is estimated by adding up the cost values of the attached data sources for each element. Assuming the following five data sources are utilized:
Face recognizer: 12.5 K.
Collapse detector: 5.5 K.
UAV-camera: This cost value is not included.
Base station: This cost value is not included.
Registration database: This cost value is not included.
Total cost of (R) = 18 K
Objective 5 (total timing value): The total timing value is estimated as follows: Assuming the following five data sources are utilized, the data sources are ranked according to their timing values:
Compared to the UAV, the timing values of the other data sources are negligible. As depicted in the following
Figure 5, the estimated timing value, for example, with respect to objective 1, is computed in two steps:
7. Algorithms for Synthesizing the Optimal Data Fusion Configuration
The proposed approach in this article consists of two phases:
Forming a model of a geographical area with a set of data sources attached.
Calculating the effectiveness, cost, and timing properties of the model.
In the previous sections, forming a model is exemplified as a set of manual actions carried out by the analyst. Although manual steps may be feasible in small scales, it may become intractable if the model becomes too large. This article proposes two algorithms for automated synthesis:
Best-fit and
Optimal-fit [
41].
7.1. Best-Fit
This is a ‘greedy’ algorithm that builds up a search space of possible element/data-source compositions step by step. At each step, the data source which has the best effectiveness value is kept. The other alternatives are discarded. This process terminates until all prospective data sources are considered and/or the cost and timing constraints are violated. According to this approach, the data sources which are selected until the termination phase give the optimal composition for fusion.
The Algorithm 1 is implemented by the function CALCULATE_BEST_FIT. The parameters used in this algorithm are instance, time_limit, and cost_limit, which represent an instance of a physical object, timing and cost constraints, respectively. Lines (2) to (4) are used to create the initial setting of the search tree, which represents the possible alternatives of the data sources attached to a given instance. Here, instance represents a geographical element such as an instance of class Residence. Selecting the best data source at each step is realized by calling on the function BEST_APPLICABLE_SOURCE in line (5). This function returns the best data source at a given step. This data source is appended to the design tree as a mode. The total cost and timing values are calculated and updated. This process continues until the time or cost limits are violated or all data sources are considered (line 12).
The function
BEST_APPLICABLE_SOURCE searches for all possible data sources for the given context of the instance and the related tree structure. It accepts the parameters
ds-_tree, instance, time_limit, and
cost_limit and returns the data source that has the maximum contribution to the effectiveness value. The function
CALCULATE_EFFECTIVENESS implements the formulas given in
Section 6.2.
Example 3. Let us assume that the best data fusion composition must be found for an instance of class Residence. The following characteristics are assumed:
| Algorithm 1 CALCULATE_BEST_FIT(instance, time_limit, cost_limit) returns list of data sources |
- 1:
function CALCULATE_BEST_FIT(instance, time_limit, cost_limit) - 2:
- 3:
- 4:
empty tree - 5:
time,cost ← ds_tree.add_root(BEST_APPLICABLE_SOURCE(ds_tree,instance,time_limit,cost_limit)) - 6:
while constraints are met do - 7:
t,c ← ds_tree.add_child(prev_element,BEST_APPLICABLE_SOURCE(ds_tree,instance,time_limit, cost_limit)) - 8:
if new data_source attached then - 9:
- 10:
- 11:
else - 12:
break - 13:
end if - 14:
end while - 15:
return - 16:
end function -
- 17:
function BEST_APPLICABLE_SOURCE(ds_tree, instance, time_limit, cost_limit) - 18:
empty data_source object - 19:
false - 20:
available data sources for the instance, length N - 21:
empty list with length N used for comparison - 22:
for index from 0 to N do - 23:
- 24:
if and then - 25:
- 26:
true - 27:
end if - 28:
end for - 29:
if found then - 30:
- 31:
end if - 32:
return - 33:
end function
|
The effectiveness values of the available data sources are estimated as follows:
Smart home ();
Face recognizer ();
Collapse detector ();
Camera of face recognizer();
Seismic detector ();
People counter ().
For brevity, the cost and timing values of these data sources are not shown here. In the first iteration, smart home is selected since it has the highest estimated effectiveness value. The total cost is calculated as 2.5 K units of currency and the total time value is 0.1 s. In the second iteration, the contributions of the remaining data sources are calculated. The face recognizer is selected because it has the highest contribution value: ().
The total cost is estimated as 15 K and the total time as 0.655 s. The algorithm reaches its cost limit and therefore terminates.
In this example, we assume that only one data source of the same type can be attached to an residence. For illustration purposes, to explain the algorithm, a relatively simple example is chosen. In a real case, however, there may be many geographical elements to be considered with a large number of alternatives and variations of data sources.
The running time of the algorithm can be calculated as follows: If the number of data sources in the output is
N, and the number of available data sources is
M, then the running time can be computed by (
4), where t represents the running time in each allocation step (corresponds to the function
).
7.2. Optimal-Fit
Similar to the previous one, this Algorithm 2 builds up a search space of possible element/data-source compositions step by step. Contrary to the previous one, at each step, for all data source compositions, the effectiveness, time, and cost values are calculated and the alternatives with higher effectiveness values are appended to the search tree. This process terminates if all data sources are considered or the timing and cost constraints are violated. The branch with the highest effectiveness value is considered as the optimal data source composition.
The Algorithm 2 is implemented by the function CALCULATE_OPTIMAL_FIT. The parameters used in this algorithm, same as the previous Algorithm 1, are instance, time_limit, and cost_limit, which represent an instance of a physical object, timing and cost constraints, respectively. In line (2), the function OPTIMAL_APPLICABLE_SOURCES is called, which returns a tree whose leaves refer to a set of data source alternatives that have the maximum contribution to the effectiveness on their path with respect to timing and cost constraints.
| Algorithm 2 CALCULATE_OPTIMAL_FIT(instance, time_limit, cost_limit) returns list of data sources |
- 1:
function CALCULATE_OPTIMAL_FIT(instance, time_limit, cost_limit) - 2:
- 3:
while constraints are met do - 4:
- 4:
- 5:
if each leaf of is then - 6:
break - 7:
end if - 8:
end while - 9:
- 10:
for each leaf in do - 11:
▹ returns subtree - 12:
if then - 13:
- 14:
end if - 15:
end for - 16:
return - 17:
end function -
- 18:
function OPTIMAL_AVAILABLE_SOURCES() - 19:
▹ 2D list that returns available data sources for each subtree - 20:
for all in do - 21:
- 22:
- 23:
▹ Get N maximum effectiveness values - 24:
for all in do - 25:
- 26:
- 27:
end for - 28:
if not then - 29:
- 30:
end if - 31:
end for - 32:
return - 33:
end function
|
In the specification of the function
OPTIMAL_APPLICABLE_SOURCES, two functions play an important role: The function
GET_MAX_N implements the formulas defined in
Section 6.2. For each leaf node, the function
GETPATH searches for the paths to the root node and calculates the total effectiveness, cost, and timing values of the branch. According to this approach, the path that has the highest effectiveness value is selected as the representation of the optimal data fusion.
The running time of the algorithm can be calculated as follows: If the tree length in the output is
, and the number of available data sensors is
M, and the number of children nodes created is
, then the running time is lower than the value showed in (
5). Here, t represents the running time in each allocation step (corresponds to the function
). An exact running time cannot be calculated, because the level of leaf nodes is variable depending on the cost limit.
Example 4. Consider the following data sources where the optimal data fusion option must be determined:
The effectiveness values of the available data sources are estimated as follows:
GPS trackers ();
Mobile phone apps ();
Base station ();
Registration database ();
UAV-camera ().
In this example, we only consider the effectiveness values. In the first iteration step, the data sources with highest effectiveness values are (GPS trackers, mobile phone apps, and base stations). In the second iteration, the best three data sources must be found for each data source that has been selected in the previous step. The result of the second iteration is given below:
GPS Trackers Mobile Phones, Base Stations, Registration Database;
Mobile Phone apps GPS Trackers, Base Stations, Registration Database;
Base Stations GPS Trackers, Mobile Phones, Registration Database.
Here, the sign denotes to appended sub-nodes. Assume that the algorithm is now terminated. The final step is to determine the best path from the nine paths. There are two paths with the same value: (). The data sources in each path are: {GPS Trackers, Mobile Phone apps} and {Mobile Phone apps, GPS Trackers}.
8. Generalization of the Analysis and Synthesis Approach to UAS-Based Data Fusion
In
Section 2.4, it was stated that the concept of AAM and its implementation as UAS can bring new opportunities for improving situation awareness in disaster/earthquake management.
A UAV, together with many other system components such as ground-based stations and data sources of many kinds, provides much better coverage. They can form all together so-called systems of systems, in which swarm of UAVs or even swarm UASs can dynamically exchange data and information, and cooperate with each other for a common set of goals. In addition to generic ones, UASs can also be designed for specific missions such as disaster management. They may also share the heavy load such as radars and precision optical devices.
Such a geography-based system consisting of static and dynamic parts can offer effective decision making. In addition, life data can be provided to emergency control centers. UASs, in short, offer the perspective of creating a more dynamic and self-adapting and responsive system architecture for the purpose of dealing with the unforeseen disaster conditions.
In the following, we therefore elaborate on the possibilities of extending our analysis and design framework for supporting UASs.
AAM-based data fusion systems can be introduced to the analysis and synthesis framework in the following way:
UAV must be introduced as an element of a geographical model. If necessary, a new class must be introduced in CityGML.
A set of queries must be defined for UAVs so that data sources can be attached for fusion. In this case, an instance of a UAV can function as a data source and and as a fusion node (element of a geographical area).
In addition to cost and timing values, a new quality attribute weight must be introduced.
The analysis and synthesis algorithms must take care of this new attribute as well.
UAVs may cooperate together during their mission by sharing some of their tasks.
To analye and synthesize models with cooperating UAVss, the computation of the efficiency values must take care of a group of elements. In addition, time-dependent properties of UAVs must be taken into account. The analysis and synthesis algorithms must be defined accordingly, possibly by using network-based evaluation models.
The steps described in this section illustrate how the framework can be adapted to cope with substantial change demands. These are our future plans for research.
11. Results and Conclusions
After the occurrence of a disaster such as an earthquake, emergency control centers need to accurately and promptly determine the effect of the disaster so that aid operations can be carried out effectively. To this aim, a data fusion system consisting of multiple data sources must be designed and installed before a disaster occurs. Unfortunately, designing a cost-effective system for this purpose is a challenging task. Firstly, the kinds of possible data sources can be too large. Secondly, each data source may have its relative advantages and shortcomings. Moreover, in case of data fusion, mutual effects of data sources on each other must be considered. Finally, data sources may need to be installed in a large geographical area.
We will now elaborate on this article from the perspective of the contributions/novelties by referring to the research questions formulated in
Section 3.
A novel model-based analysis and synthesis framework is introduced to address the research questions ‘What is a suitable architectural style of the desired model-based framework?’ and ‘How can this architecture be extended to deal with the (future) UAS?’. In
Section 8, we have outlined an approach for extending the proposed framework so that it can be utilized in designing UASs.
Through an extensive domain analysis work and by organizing the identified domain concepts under a feature diagram, a new domain model is proposed to address the research question ‘How to define a domain model of the data sources suitable for detecting the effects of earthquakes?’. Furthermore, a detailed specification of the relevant data sources from the perspective of data fusion is presented in
Appendix A and
Appendix B.
A novel set of extensible object-oriented models and queries is introduced to give an answer to the research question ‘How to compute the combined effectiveness, cost and timing values as a result of data fusion?’. These can be used for simulating the prospective data fusion alternatives. In addition, formulas are defined to determine whether the quality objectives are fulfilled or not.
Novel automatic synthesis algorithms for data fusion are proposed to address the research question ‘What kind of algorithms can be defined for automated synthesis of the optimal data fusion?’.
The utility of the proposed approach is illustrated by a set of examples.
Overall, the proposed approach may eliminate the risks of designing and installing irrelevant or less effective data fusion systems. We consider that the research questions presented in
Section 3 are adequately addressed within the limits of the assumptions, as discussed in the previous section.


