Firefighting Drone Configuration and Scheduling for Wildfire Based on Loss Estimation and Minimization
Abstract
1. Introduction
- We present a mathematical model of wildfire spreading that simulates dynamic fire development and propagation, and, at the same time, estimates the economic losses caused by the fire.
- We propose a heuristic optimization method for configuring and scheduling firefighting drones to minimize the expected total wildfire loss.
- We conduct expensive computational experiments to validate the effectiveness and efficiency of the proposed method on real-world instances.
2. Wildfire Spread Modeling and Loss Estimation
2.1. Fire Dynamics and Heat Release
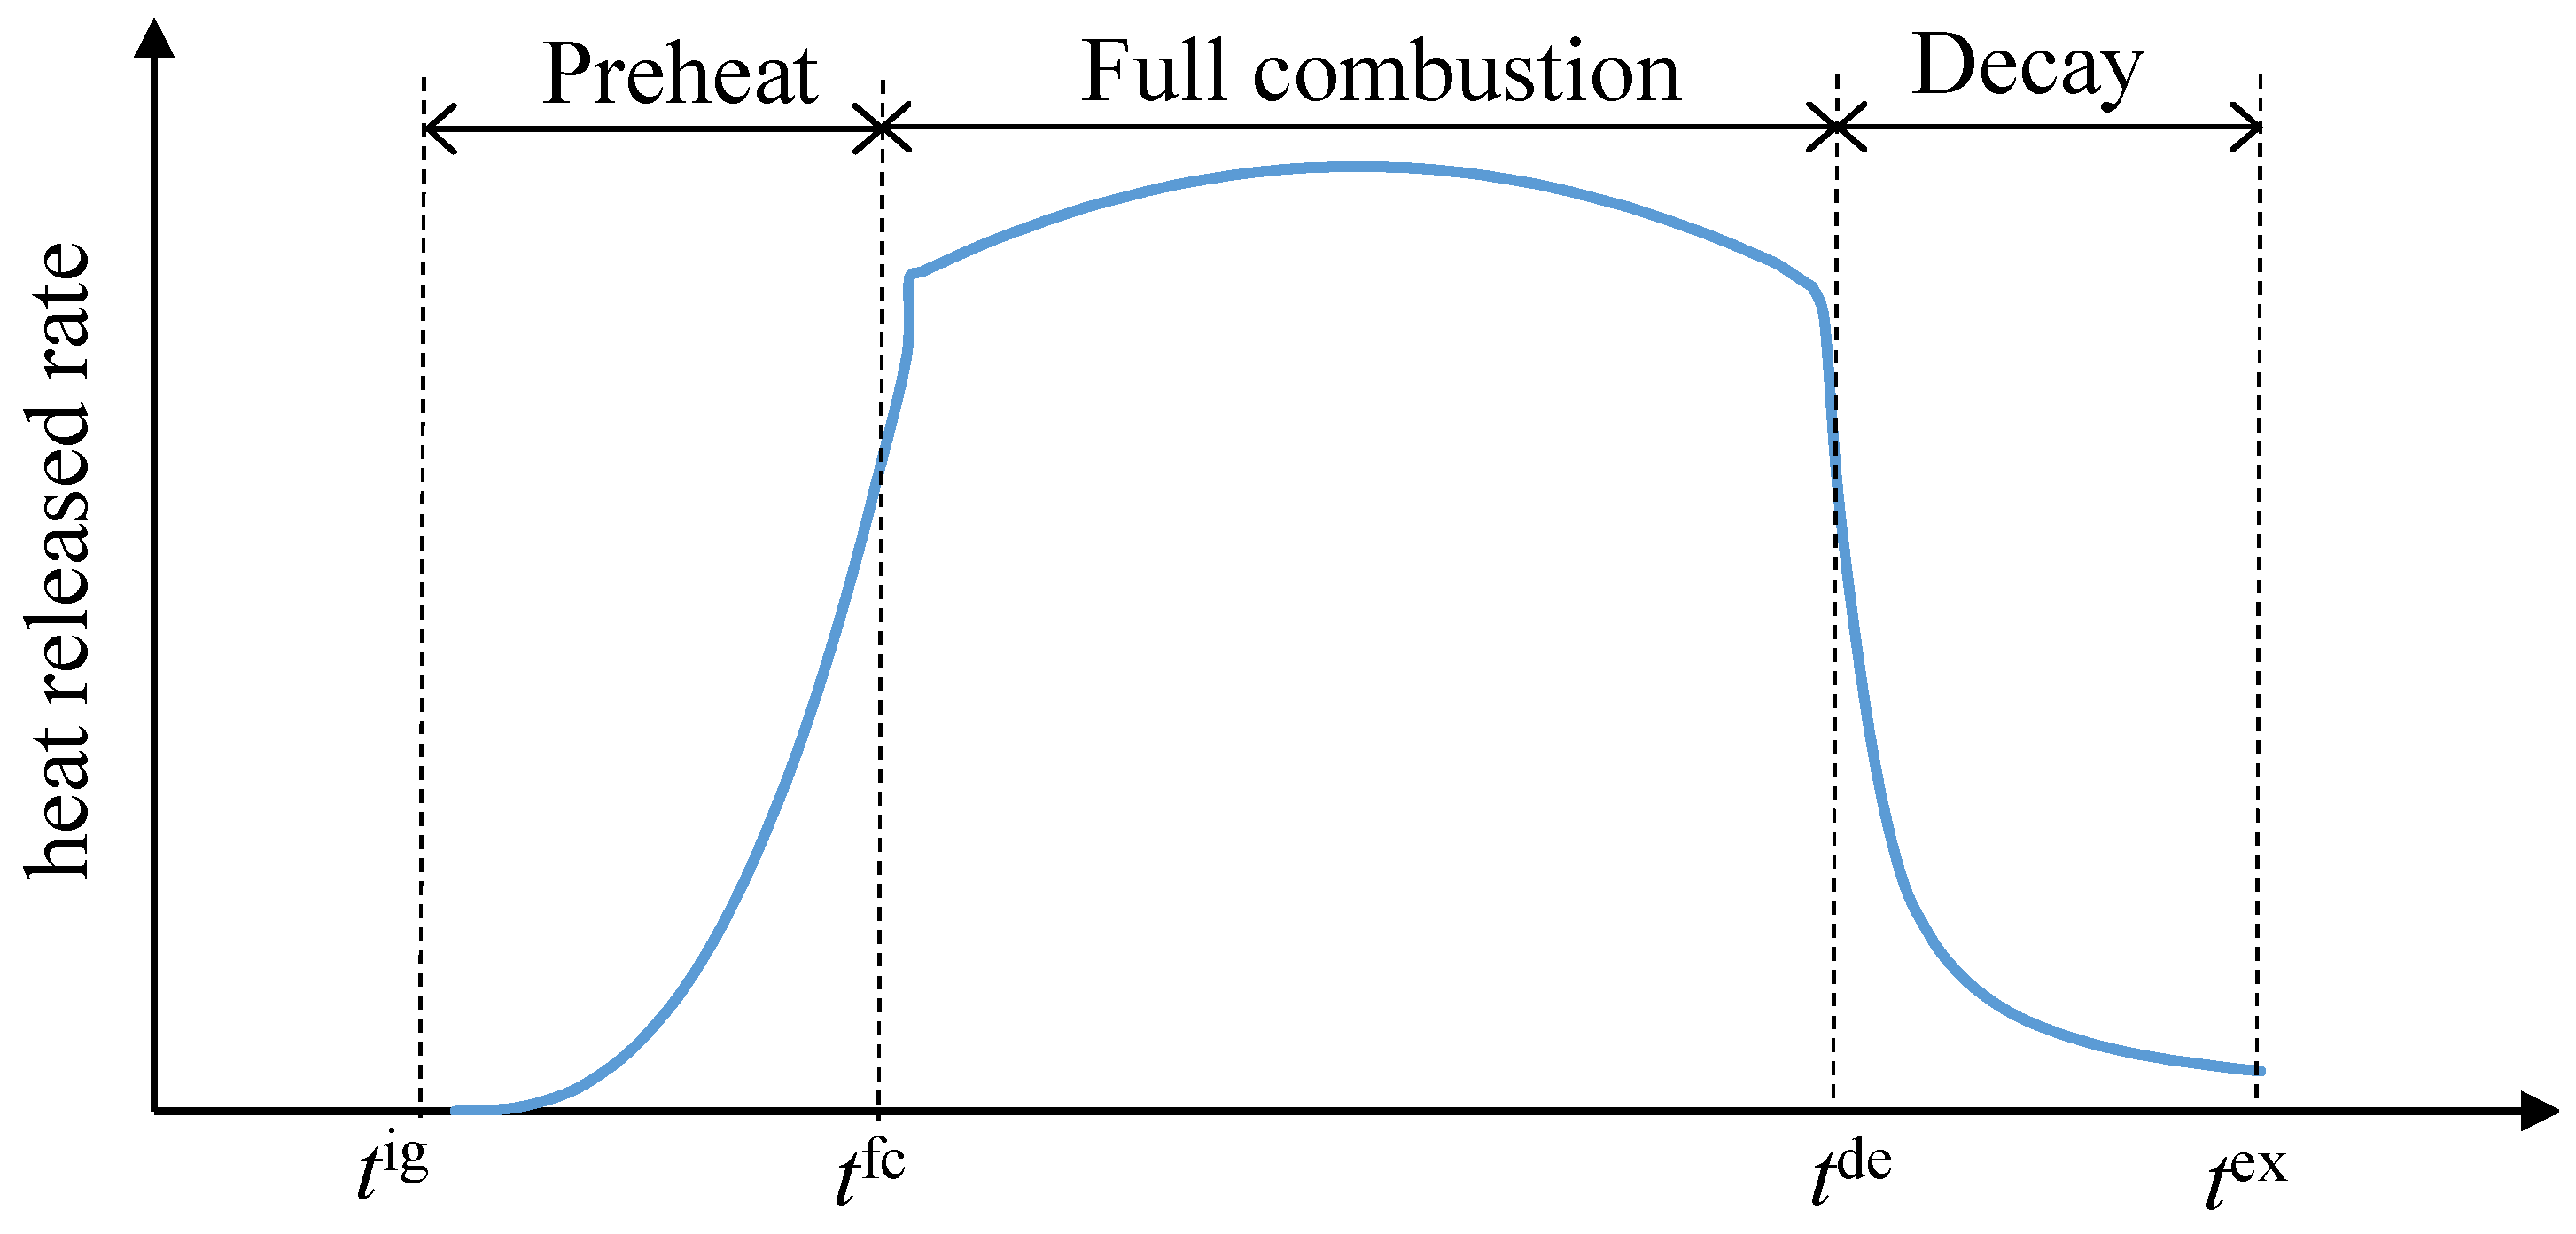
- Preheat stage. After the ignition time , the heat release rate continuously grows with time t, and its growth rate depends on the combustible vegetation density of the subarea, temperature , humidity , and the wind force :where is a function of temperature and humidity, and is a function of wind force. Currently, we define only on the temperature range from to , which covers the temperature ranges in most of East China and South China. For convenience, we simply define on ten levels of wind force (wind force above level 10 rarely occurs on the mainland), as shown in the function in Table 2.
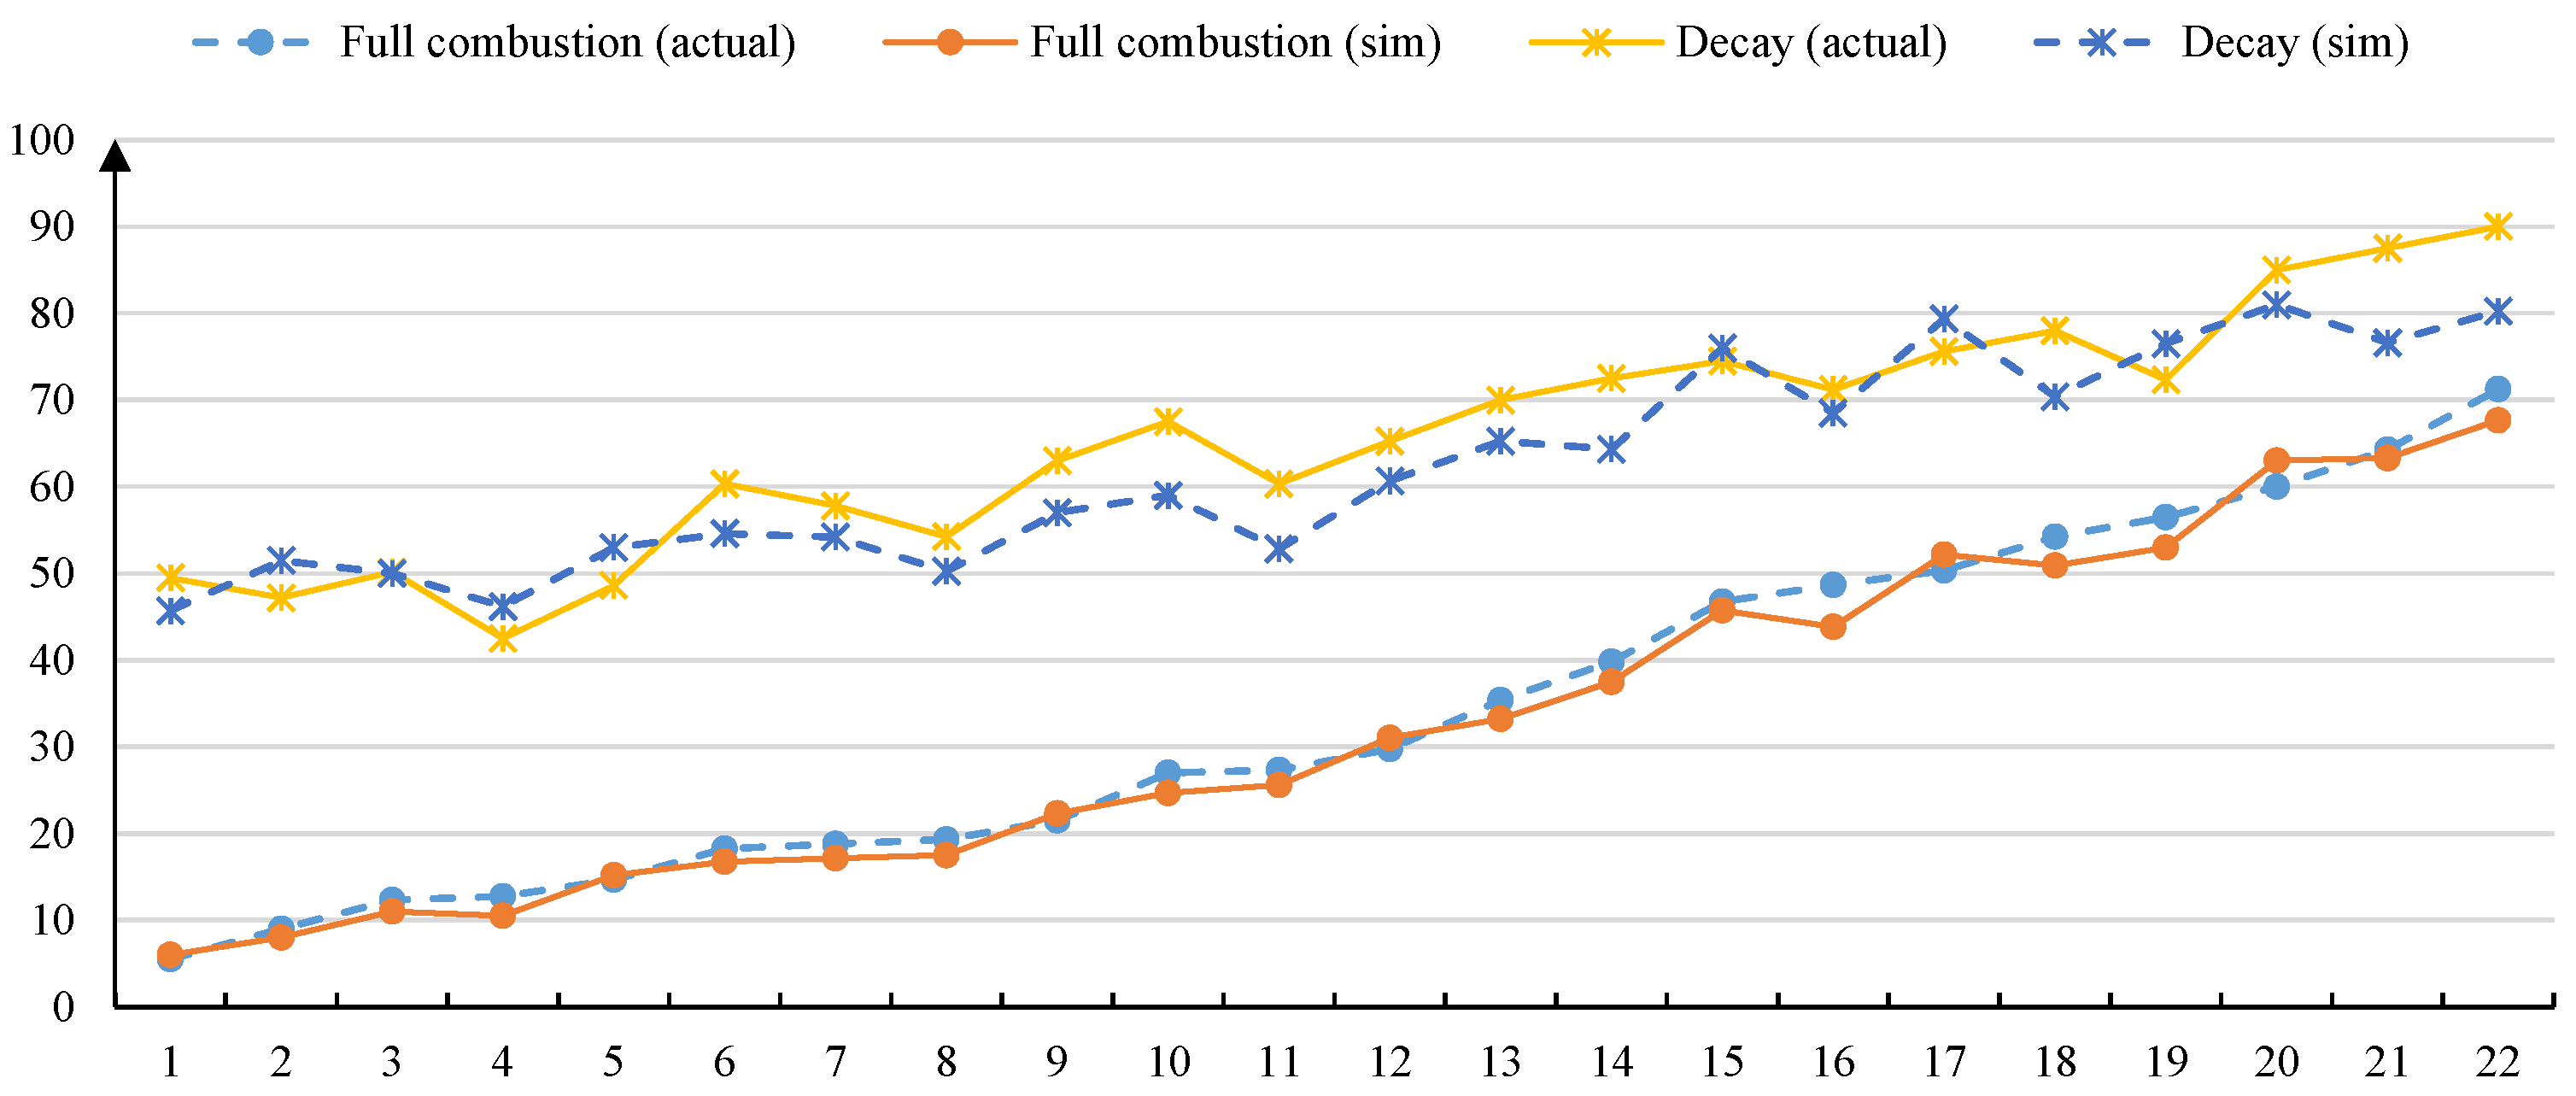
- Full combustion stage, in which gas combustion is dominant. Whenever the heat release rate reaches a threshold , i.e., , the fire in the subarea enters into the full combustion stage, the time at which is denoted as :The heat release rate during this stage is relatively stable:where is a constant, and is a function of the wind force, the values of which is shown in the third row of the function in Table 2.
- The decay stage, in which charcoal combustion is dominant. Whenever the ratio of the total released heat to the total combustible heat of the vegetation in the subarea reaches a threshold , the fire in the subarea enters into the decay stage, the time at which is denoted as :The heat release rate during this stage decreases with time:where is a constant and is a function of the wind force, the values of which is shown in the fourth row of the function in Table 2. Note that will cause a division-by-zero in Equation (5); at this time, the heat release rate should be calculated according to in Equation (3).Whenever the heat release rate decreases to a lower limit (or the total released heat reaches the total combustible heat), the fire is extinguished, the time at which is denoted as :
2.2. Loss Estimation
2.3. Fire Propagation
2.4. Simulation Process
- Let ; for each subarea , initialize its accumulated ignition probability .
- Set ; if , then exit.
- For each subarea :
- (a)
- Initialize the non-ignition probability .
- (b)
- For each subarea that is adjacent to :
- i
- Calculate according to Equation (12).
- ii
- Update the non-ignition probability as
- (c)
- For each subarea that is adjacent to while having :
- i
- Calculate the probability of the propagation from to aswhere is the expected heat release rate of at time t, which is calculated as
- ii
- Update the non-ignition probability according to Equation (14).
- (d)
- Set .
- (e)
- If (where is a small value, which is set to 0.001 in this study), then add to ;
- (f)
- Otherwise, update the accumulated probability of ignition in asIf , then add to .
- Go to step 2.
3. Drone Configuration and Scheduling
3.1. Minimum Number of Firefighting Drones in Preparation for Wildfire
3.2. Optimization Problem of Firefighting Drone Scheduling
- Let , be the initial number of available drones.
- Calculate according to Equation (21) and select the candidate set of subareas satisfying , which are sorted in the same order as in .
- For each subarea :
- (a)
- Calculate according to Equation (18).
- (b)
- If , then assign drones to subarea , whose fire will be extinguished at time , and these drones will be available at the station at time , and then set .
- (c)
- If , then go to step 4.
- Set .
- Check whether there is any burning subarea whose fire will be extinguished at time t; if so, set the extinguish time to t and heat release rate to zero and remove it from .
- If there is no burning subareas, calculate the total loss and exit.
- Use steps 3 to 5 described in Section 2.4 to update the states of the other subareas at time t; if there is any subarea entering into the full combustion stage, add it to ; if there is any burning subarea whose fire is naturally extinguished at time t, remove it from .
- Check whether there are some drones returning to the station at time t; if so, update the value of .
- Go to step 2.
3.3. Optimization Algorithms
- GA using order-based solution representation, partial mapping crossover, and swap mutation [42].
- Particle swarm optimization (PSO) using discrete sequence-based particle representation [43], where velocity trail values are used as the probabilities of the components being placed in certain positions of the sequence. We also incorporate a comprehensive learning strategy [44,45] and an adaptive parameter control mechanism [46].
- Differential evolution (DE) adapted for permutation optimization based on floating-to-integer mapping [47], where solutions are encoded as floating vectors and evolved via standard DE mutation and crossover, then decoded to integer sequences based on the order of floating values.
- Biogeography-based optimization (BBO) for permutation optimization based on subsequence migration [48,49]. The migration operator selects a subsequence from the emigrating solution and uses it to replace the corresponding part in the immigrating solution while using the original components in the part to substitute the corresponding components in the other part to avoid duplication.
| Algorithm 1: WWO algorithm for firefighting drone scheduling. |
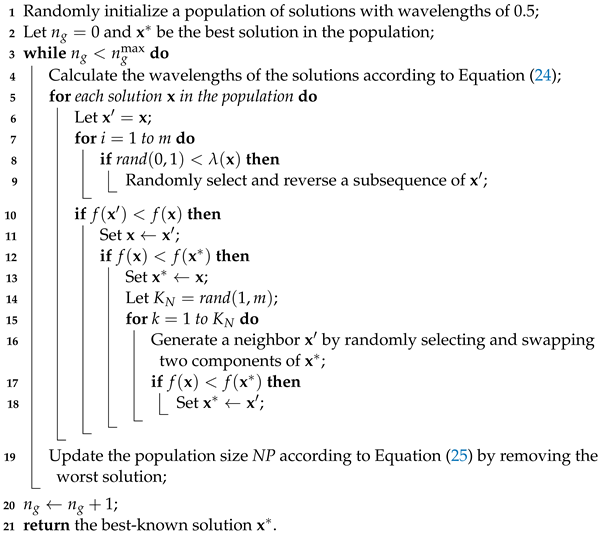 |
| Algorithm 2: WWO breaking using self-adaptive local search. |
 |
3.4. Drone/Staff Configuration and Preplanning
4. Computational Experiments
5. Conclusions
Author Contributions
Funding
Informed Consent Statement
Data Availability Statement
Conflicts of Interest
References
- Gabbert, B. A 9-Year USFS Aerial Firefighting Study Left Many Questions Unanswered. Wildfiretoday. 2021. Available online: https://wildfiretoday.com/2021/04/16/a-9-year-usfs-aerial-firefighting-study-left-many-questions-unanswered/ (accessed on 16 December 2023).
- Restas, A. Examining the effectiveness of aerial firefighting with the components of firebreak requirements and footprint geometry—Critics of the present practice. Fire 2023, 6, 351. [Google Scholar] [CrossRef]
- Qin, H.; Cui, J.Q.; Li, J.; Bi, Y.; Lan, M.; Shan, M.; Liu, W.; Wang, K.; Lin, F.; Zhang, Y.F.; et al. Design and implementation of an unmanned aerial vehicle for autonomous firefighting missions. In Proceedings of the IEEE International Conference on Control and Automation, Kathmandu, Nepal, 1–3 June 2016; pp. 62–67. [Google Scholar] [CrossRef]
- Alon, O.; Rabinovich, S.; Fyodorov, C.; Cauchard, J.R. Drones in firefighting: A user-centered design perspective. In Proceedings of the 23rd International Conference on Mobile Human-Computer Interaction, Toulouse, France, 27 September–1 October 2021; ACM: New York, NY, USA, 2021. MobileHCI’21. [Google Scholar] [CrossRef]
- Roldán-Gómez, J.J.; González-Gironda, E.; Barrientos, A. A survey on robotic technologies for forest firefighting: Applying drone swarms to improve firefighters’ efficiency and safety. Appl. Sci. 2021, 11, 363. [Google Scholar] [CrossRef]
- Laszlo, B.; Agoston, R.; Xu, Q. Conceptual approach of measuring the professional and economic effectiveness of drone applications supporting forest fire management. In Proceedings of the 8th International Conference on Fire Science and Fire Protection Engineering, Nanjing, China, 27–29 October 2017; Procedia Engineering. 2018; Volume 211, pp. 8–17. [Google Scholar] [CrossRef]
- Aydin, B.; Selvi, E.; Tao, J.; Starek, M.J. Use of fire-extinguishing balls for a conceptual system of drone-assisted wildfire fighting. Drones 2019, 3, 17. [Google Scholar] [CrossRef]
- Kataeva, L.Y.; Ilicheva, M.N.; Loshchilov, A.A. Mathematical modeling for extinguishing forest fires using water capsules with a thermoactive shell. J. Appl. Mech. Tech. Phy. 2022, 63, 1227–1242. [Google Scholar] [CrossRef]
- Beijing ZhongHangZhi Technology Co., Ltd. TD220 Coaxial Unmanned Helicopter. Available online: https://www.zhz.com/en (accessed on 23 October 2023).
- Viegas, C.; Chehreh, B.; Andrade, J.; Lourenço, J. Tethered UAV with combined multi-rotor and water jet propulsion for forest fire fighting. J. Intell. Robot. Syst. 2021, 104. [Google Scholar] [CrossRef]
- Śmigielski, G.; Dygdała, R.; Zarzycki, H.; Lewandowski, D. Real-time system of delivering water-capsule for firefighting. In Hard and Soft Computing for Artificial Intelligence, Multimedia and Security; Kobayashi, S.Y., Piegat, A., Pejaś, J., El Fray, I., Kacprzyk, J., Eds.; Springer: Cham, Switzerland, 2017; pp. 102–111. [Google Scholar] [CrossRef]
- Zheng, L.; Quan, W. Experimental study of explosive water mist extinguishing fire. In Proceedings of the 5th Conference Performance-based Fire and Fire Protection Engineering, Guangzhou, China, 7–9 December 2010; Procedia Engineering. 2011; Volume 11, pp. 258–267. [Google Scholar] [CrossRef]
- Śmigielski, G.; Toczek, W.; Dygdała, R.; Stefański, K. Metrological analysis of precision of the system of delivering a water capsule for explosive production of water aerosol. Metrol. Measure. Syst. 2016, 23, 47–58. [Google Scholar] [CrossRef][Green Version]
- Czerniak, J.; Śmigielski, G.; Ewald, D.; Paprzycki, M.; Dobrosielski, W. New proposed implementation of ABC method to optimization of water capsule flight. In Proceedings of the Federated Conference on Computer Science and Information Systems, Lodz, Poland, 13–16 September 2015; pp. 489–493. [Google Scholar] [CrossRef]
- Czerniak, J.M.; Ewald, D.; Śmigielski, G.; Dobrosielski, W.T.; Apiecionek, Ł. Optimization of fuel consumption in firefighting water capsule flights of a helicopter. In Recent Advances in Computational Optimization: Results of the Workshop on Computational Optimization; Fidanova, S., Ed.; Springer: Cham, Switzerland, 2016; pp. 39–49. [Google Scholar] [CrossRef]
- Wang, X.; Liu, H.; Tian, Y.; Chen, Z.; Cai, Z. A fast optimization method of water-dropping scheme for fixed-wing firefighting aircraft. IEEE Access 2021, 9, 120815–120832. [Google Scholar] [CrossRef]
- Zheng, Y.J.; Du, Y.C.; Sheng, W.G.; Ling, H.F. Collaborative human-UAV search and rescue for missing tourists in nature reserves. INFORMS J. Appl. Analy. 2019, 49, 371–383. [Google Scholar] [CrossRef]
- Du, Y.; Zhang, M.; Ling, H.; Zheng, Y. Evolutionary planning of multi-UAV search for missing tourists. IEEE Access 2019, 7, 73480–73492. [Google Scholar] [CrossRef]
- Kiani, F.; Seyyedabbasi, A.; Aliyev, R.; Gulle, M.U.; Basyildiz, H.; Shah, M.A. Adapted-RRT: Novel hybrid method to solve three-dimensional path planning problem using sampling and metaheuristic-based algorithms. Neural Comput. Appl. 2021, 33, 15569–15599. [Google Scholar] [CrossRef]
- Kiani, F.; Seyyedabbasi, A.; Nematzadeh, S.; Candan, F.; Çevik, T.; Anka, F.A.; Randazzo, G.; Lanza, S.; Muzirafuti, A. Adaptive metaheuristic-based methods for autonomous robot path planning: Sustainable agricultural applications. Appl. Sci. 2022, 12, 943. [Google Scholar] [CrossRef]
- Zheng, Y.J.; Chen, S.Y.; Ling, H.F. Evolutionary optimization for disaster relief operations: A survey. Appl. Soft Comput. 2015, 27, 553–566. [Google Scholar] [CrossRef]
- Luo, Z.; Zhang, Y.; Mu, L.; Huang, J.; Xin, J.; Liu, H.; Jiao, S.; Xie, G.; Yi, Y. A UAV path planning algorithm based on an improved D* Lite algorithm for forest firefighting. In Proceedings of the Chinese Automation Congress, Shanghai, China, 6–8 November 2020; pp. 4233–4237. [Google Scholar] [CrossRef]
- Harikumar, K.; Senthilnath, J.; Sundaram, S. Multi-UAV oxyrrhis marina-inspired search and dynamic formation control for forest firefighting. IEEE Trans. Autom. Sci. Eng. 2019, 16, 863–873. [Google Scholar] [CrossRef]
- Hong, L.; Wang, Y.; Du, Y.; Chen, X.; Zheng, Y. UAV search-and-rescue planning using an adaptive memetic algorithm. Front. Inf. Technol. Electron. Eng. 2021, 22, 1477–1491. [Google Scholar] [CrossRef]
- Zheng, Y.; Du, Y.; Ling, H.; Sheng, W.; Chen, S. Evolutionary collaborative human-UAV search for escaped criminals. IEEE Trans. Evol. Comput. 2020, 24, 217–231. [Google Scholar] [CrossRef]
- Zheng, Y.J.; Du, Y.C.; Su, Z.L.; Ling, H.F.; Zhang, M.X.; Chen, S.Y. Evolutionary human-UAV cooperation for transmission network restoration. IEEE Trans. Ind. Informat. 2021, 17, 1648–1657. [Google Scholar] [CrossRef]
- Wang, C.; Liu, P.; Zhang, T.; Sun, J. The adaptive vortex search algorithm of optimal path planning for forest fire rescue UAV. In Proceedings of the IEEE 3rd Advanced Information Technology, Electronic and Automation Control Conference, Chongqing China, 12–14 October 2018; pp. 400–403. [Google Scholar] [CrossRef]
- Xiang, A.; Wang, L. Research on path planning of UAV forest fire fighting based on improved ant colony algorithm. In Proceedings of the 2021 7th International Conference on Computing and Artificial Intelligence, Tianjin, China, 23–26 April 2021; ACM: New York, NY, USA, 2021; pp. 289–295. [Google Scholar] [CrossRef]
- Xu, Y.; Li, J.; Zhang, F. A UAV-based forest fire patrol path planning strategy. Forests 2022, 13, 1952. [Google Scholar] [CrossRef]
- Alsammak, I.L.H.; Mahmoud, M.A.; Gunasekaran, S.S.; Ahmed, A.N.; AlKilabi, M. Nature-inspired drone swarming for wildfires suppression considering distributed fire spots and energy consumption. IEEE Access 2023, 11, 50962–50983. [Google Scholar] [CrossRef]
- Xavier Viegas, D. Forest fire propagation. Philos. Trans. Royal Soc. London. Series A 1998, 356, 2907–2928. [Google Scholar] [CrossRef]
- Li, J.; Li, X.; Chen, C.; Zheng, H.; Liu, N. Three-dimensional dynamic simulation system for forest surface fire spreading prediction. Int. J. Pattern Recogn. Artif. Intell. 2018, 32, 1850026. [Google Scholar] [CrossRef]
- Alexandridis, A.; Vakalis, D.; Siettos, C.; Bafas, G. A cellular automata model for forest fire spread prediction: The case of the wildfire that swept through Spetses Island in 1990. Appl. Math. Comput. 2008, 204, 191–201. [Google Scholar] [CrossRef]
- Rui, X.; Hui, S.; Yu, X.; Zhang, G.; Wu, B. Forest fire spread simulation algorithm based on cellular automata. Nat. Hazards 2018, 91, 309–319. [Google Scholar] [CrossRef]
- Mutthulakshmi, K.; Wee, M.R.E.; Wong, Y.C.K.; Lai, J.W.; Koh, J.M.; Acharya, U.R.; Cheong, K.H. Simulating forest fire spread and fire-fighting using cellular automata. Chin. J. Physics 2020, 65, 642–650. [Google Scholar] [CrossRef]
- Wu, Z.; Wang, B.; Li, M.; Tian, Y.; Quan, Y.; Liu, J. Simulation of forest fire spread based on artificial intelligence. Ecol. Ind. 2022, 136, 108653. [Google Scholar] [CrossRef]
- Cheng, H.; Hadjisophocleous, G.V. The modeling of fire spread in buildings by Bayesian network. Fire Saf. J. 2009, 44, 901–908. [Google Scholar] [CrossRef]
- Shaham, Y.; Benenson, I. Modeling fire spread in cities with non-flammable construction. Int. J. Disaster Risk Reduct. 2018, 31, 1337–1353. [Google Scholar] [CrossRef]
- Zheng, Y.J. Water wave optimization: A new nature-inspired metaheuristic. Comput. Oper. Res. 2015, 55, 1–11. [Google Scholar] [CrossRef]
- Weber, R.O. Toward a comprehensive wildfire spread model. Int. J. Wildland Fire 1991, 1, 245–248. [Google Scholar] [CrossRef]
- Cheng, H.; Hadjisophocleous, G.V. Dynamic modeling of fire spread in building. Fire Saf. J. 2011, 46, 211–224. [Google Scholar] [CrossRef]
- Wang, L.; Zhang, L.; Zheng, D.Z. A class of order-based genetic algorithm for flow shop scheduling. Int. J. Adv. Manuf. Technol. 2003, 22, 828–835. [Google Scholar] [CrossRef]
- Liao, C.J.; Tseng, C.T.; Luarn, P. A discrete version of particle swarm optimization for flowshop scheduling problems. Comput. Oper. Res. 2007, 34, 3099–3111. [Google Scholar] [CrossRef]
- Liang, J.J.; Qin, A.K.; Suganthan, P.; Baskar, S. Comprehensive learning particle swarm optimizer for global optimization of multimodal functions. IEEE Trans. Evol. Comput. 2006, 10, 281–295. [Google Scholar] [CrossRef]
- Zheng, Y.; Ling, H.; Xue, J.; Chen, S. Population classification in fire evacuation: A multiobjective particle swarm optimization approach. IEEE Trans. Evol. Comput. 2014, 18, 70–81. [Google Scholar] [CrossRef]
- Zheng, Y.J.; Ling, H.F.; Guan, Q. Adaptive Parameters for a Modified Comprehensive Learning Particle Swarm Optimizer. Math. Prob. Eng. 2012, 2012, 207318. [Google Scholar] [CrossRef]
- Chakraborty, U.K.; Turvey, K.P. Floating-point to integer mapping schemes in differential evolution for permutation flow shop scheduling. Int. J. Bio-Inspired Comput. 2010, 2, 183–204. [Google Scholar] [CrossRef]
- Zheng, Y.; Lu, X.; Zhang, M.; Chen, S. Biogeography-Based Optimization: Algorithms and Applications; Springer: Berlin/Heidelberg, Germany, 2018. [Google Scholar] [CrossRef]
- Zheng, Y.; Ling, H.; Xue, J. Disaster rescue task scheduling: An evolutionary multiobjective optimization approach. IEEE Trans. Emerg. Top. Comput. 2018, 6, 288–300. [Google Scholar] [CrossRef]
- Zheng, Y.J.; Ling, H.F.; Xue, J.Y. Ecogeography-based optimization: Enhancing biogeography-based optimization with ecogeographic barriers and differentiations. Comput. Oper. Res. 2014, 50, 115–127. [Google Scholar] [CrossRef]
- Du, Y.C.; Zhang, M.X.; Cai, C.Y.; Zheng, Y.J. Enhanced biogeography-based optimization for flow-shop scheduling. In Bio-Inspired Computing: Theories and Applications; Qiao, J., Zhao, X., Pan, L., Zuo, X., Zhang, X., Zhang, Q., Huang, S., Eds.; Springer: Singapore, 2018; pp. 295–306. [Google Scholar]
- Zheng, Y.J.; Lu, X.Q.; Du, Y.C.; Xue, Y.; Sheng, W.G. Water wave optimization for combinatorial optimization: Design strategies and applications. Appl. Soft Comput. 2019, 83, 105611. [Google Scholar] [CrossRef]
- Zheng, Y.J.; Zhang, B. A simplified water wave optimization algorithm. In Proceedings of the IEEE Congress on Evolutionary Computation, Sendai, Japan, 25–28 May 2015; pp. 807–813. [Google Scholar] [CrossRef]
- Nawaz, M.; Enscore, E.E.; Ham, I. A heuristic algorithm for the m-machine, n-job flow-shop sequencing problem. Omega 1983, 11, 91–95. [Google Scholar] [CrossRef]
- Weng, Y.Y.; Wu, R.Y.; Zheng, Y.J. Cooperative truck-drone delivery path optimization under urban traffic restriction. Drones 2023, 7, 59. [Google Scholar] [CrossRef]
- Wu, G.; Mao, N.; Luo, Q.; Xu, B.; Shi, J.; Suganthan, P.N. Collaborative truck-drone routing for contactless parcel delivery during the epidemic. IEEE Trans. Intell. Transp. Syst. 2022, 23, 25077–25091. [Google Scholar] [CrossRef]
- Siddiqui, A.B.; Aqeel, I.; Alkhayyat, A.; Javed, U.; Kaleem, Z. Prioritized user association for sum-rate maximization in UAV-assisted emergency communication: A reinforcement learning approach. Drones 2022, 6, 45. [Google Scholar] [CrossRef]

| Parameter | Description |
|---|---|
| m | Number of subareas |
| Area (m2) of subarea | |
| Time of fire ignition in subarea | |
| Combustible vegetation density of subarea | |
| Total combustible heat of the vegetation in subarea | |
| Temperature at time t | |
| Humidity at time t | |
| Wind force at time t | |
| Wind direction at time t | |
| Coefficient used in Equation (1) for calculating the heat release rate in the preheat stage | |
| Exponent used in Equation (1) for calculating the heat release rate in the preheat stage | |
| Coefficient used in Equation (3) for calculating the heat release rate in the full combustion stage | |
| Exponent used in Equation (5) for calculating the heat release rate in the decay stage | |
| Coefficient used in Equation (12) for calculating the probability of fire propagation | |
| Time at which the fire in subarea enters into the full combustion stage | |
| Time at which the fire in subarea enters into the decay stage | |
| Time at which the fire in subarea is naturally extinguished | |
| Threshold of heat release rate for the fire enters into the full combustion stage | |
| Threshold of the ratio of the total released heat to for the fire enters into the decay stage | |
| Valuation of vegetation in subarea | |
| Valuation of vulnerable assets in subarea | |
| Length of the boundary between two adjacent subareas and | |
| Threshold of boundary length for fire propagation | |
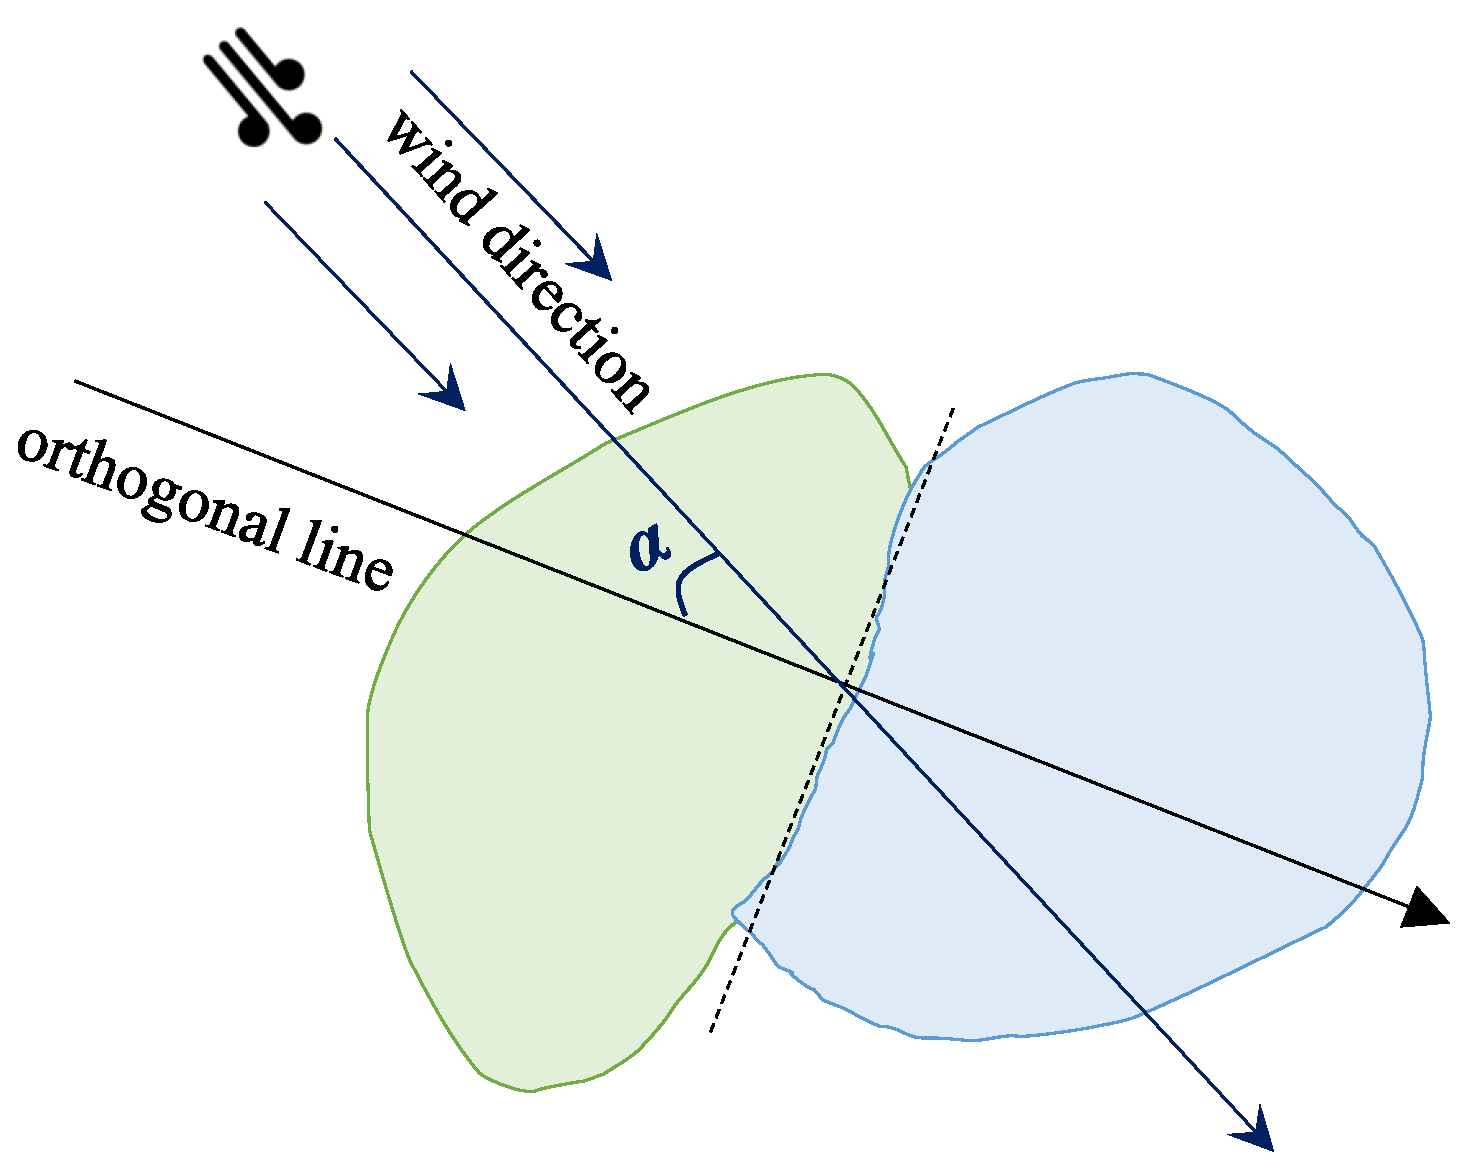
| Angle between two lines and | |
| W | Amount of water that can be carried by a drone at a time |
| D | Maximum distance of the drone |
| W | Maximum load of the drone |
| Maximum velocity of the drone | |
| Minimum velocity of the drone |
| Wind Force Level | 0 | 1 | 2 | 3 | 4 | 5 | 6 | 7 | 8 | 9 | 10 |
|---|---|---|---|---|---|---|---|---|---|---|---|
| values | 1.414 | 1.503 | 1.691 | 2.000 | 2.265 | 2.673 | 2.967 | 3.341 | 3.568 | 4.102 | 4.609 |
| values | 0.55 | 0.63 | 0.77 | 0.92 | 1.01 | 1.18 | 1.29 | 1.40 | 1.53 | 1.68 | 1.85 |
| values | 1.64 | 1.32 | 1.21 | 1.12 | 0.97 | 0.90 | 0.83 | 0.77 | 0.74 | 0.65 | 0.61 |
| values | 0.16 | 0.25 | 0.33 | 0.46 | 0.6 | 0.89 | 1 | 1 | 1 | 1 | 1 |
| Instance | Metrics | GA | PSO | DE | BBO | EBO | WWO | EWWO |
|---|---|---|---|---|---|---|---|---|
| 1 | minimum | 788 | 787 | 782 | 786 | 782 | 779 | 778 |
| median | 808 | 806 | 801 | 808 | 801 | 801 | 798 | |
| std | 17 | 11 | 15 | 12 | 8 | 15 | 16 | |
| 2 | minimum | 936 | 932 | 927 | 930 | 923 | 919 | 916 |
| median | 980 | 970 | 951 | 974 | 964 | 955 | 946 | |
| std | 29 | 27 | 15 | 35 | 21 | 31 | 25 | |
| 3 | minimum | 1059 | 1052 | 1044 | 1057 | 1051 | 1046 | 1039 |
| median | 1172 | 1139 | 1109 | 1136 | 1114 | 1096 | 1084 | |
| std | 62 | 55 | 36 | 59 | 40 | 34 | 29 | |
| 4 | minimum | 1133 | 1132 | 1118 | 1132 | 1121 | 1110 | 1108 |
| median | 1221 | 1207 | 1189 | 1203 | 1194 | 1180 | 1162 | |
| std | 79 | 53 | 43 | 45 | 46 | 50 | 28 | |
| 5 | minimum | 1256 | 1235 | 1218 | 1260 | 1225 | 1204 | 1162 |
| median | 1345 | 1345 | 1282 | 1325 | 1301 | 1253 | 1226 | |
| std | 57 | 49 | 28 | 41 | 60 | 31 | 49 | |
| 6 | minimum | 1428 | 1394 | 1356 | 1405 | 1365 | 1329 | 1290 |
| median | 1576 | 1514 | 1454 | 1564 | 1466 | 1392 | 1369 | |
| std | 67 | 78 | 51 | 75 | 74 | 46 | 54 | |
| 7 | minimum | 1640 | 1640 | 1526 | 158 | 1517 | 1428 | 1354 |
| median | 1788 | 1694 | 1641 | 1745 | 1622 | 1590 | 1428 | |
| std | 111 | 24 | 85 | 98 | 86 | 71 | 64 | |
| 8 | minimum | 1807 | 1784 | 1642 | 1752 | 1671 | 1558 | 1517 |
| median | 1980 | 1 897 | 1778 | 1889 | 1819 | 1699 | 1620 | |
| std | 97 | 50 | 84 | 90 | 110 | 75 | 70 | |
| 9 | minimum | 1921 | 1874 | 1787 | 1927 | 1778 | 1710 | 1610 |
| median | 2201 | 2135 | 1984 | 2193 | 2036 | 1852 | 1729 | |
| std | 230 | 226 | 127 | 188 | 219 | 127 | 64 | |
| 10 | minimum | 675 | 674 | 672 | 674 | 672 | 667 | 665 |
| median | 699 | 690 | 684 | 697 | 680 | 682 | 670 | |
| std | 14 | 11 | 8 | 17 | 6 | 9 | 4 | |
| 11 | minimum | 778 | 771 | 757 | 775 | 765 | 752 | 749 |
| median | 788 | 782 | 779 | 784 | 772 | 769 | 763 | |
| std | 9 | 6 | 15 | 6 | 4 | 14 | 8 | |
| 12 | minimum | 822 | 816 | 804 | 822 | 805 | 803 | 793 |
| median | 837 | 836 | 817 | 837 | 820 | 809 | 808 | |
| std | 6 | 17 | 9 | 13 | 6 | 3 | 13 | |
| 13 | minimum | 946 | 920 | 895 | 931 | 889 | 872 | 832 |
| median | 975 | 961 | 921 | 973 | 930 | 897 | 862 | |
| std | 18 | 23 | 13 | 34 | 26 | 17 | 14 | |
| 14 | minimum | 1074 | 1062 | 992 | 1024 | 993 | 931 | 906 |
| median | 1133 | 1112 | 1047 | 1128 | 1056 | 992 | 926 | |
| std | 50 | 35 | 44 | 79 | 52 | 32 | 12 | |
| 15 | minimum | 1281 | 1243 | 1083 | 1205 | 1136 | 1115 | 990 |
| median | 1340 | 1286 | 1232 | 1316 | 1185 | 1183 | 1039 | |
| std | 42 | 36 | 130 | 67 | 20 | 28 | 24 | |
| 16 | minimum | 1468 | 1335 | 1230 | 1359 | 1264 | 1172 | 1128 |
| median | 1556 | 1435 | 1331 | 1546 | 1365 | 1275 | 1221 | |
| std | 61 | 79 | 66 | 107 | 46 | 53 | 49 | |
| 17 | minimum | 1625 | 1573 | 1356 | 1599 | 1427 | 1281 | 1251 |
| median | 1739 | 1634 | 1424 | 1755 | 1565 | 1489 | 1335 | |
| std | 62 | 41 | 36 | 85 | 103 | 178 | 34 | |
| 18 | minimum | 1891 | 1811 | 1587 | 1751 | 1591 | 1615 | 1423 |
| median | 2024 | 2024 | 1789 | 2013 | 1769 | 1668 | 1502 | |
| std | 64 | 140 | 97 | 232 | 145 | 32 | 43 | |
| 19 | minimum | 655 | 652 | 648 | 652 | 650 | 649 | 645 |
| median | 655 | 653 | 651 | 655 | 651 | 649 | 645 | |
| std | 0 | 1 | 1 | 2 | 1 | 0 | 0 | |
| 20 | minimum | 734 | 708 | 686 | 728 | 711 | 693 | 665 |
| median | 758 | 738 | 708 | 757 | 716 | 707 | 685 | |
| std | 19 | 25 | 9 | 18 | 3 | 8 | 14 | |
| 21 | minimum | 788 | 788 | 723 | 788 | 737 | 694 | 685 |
| median | 822 | 807 | 742 | 813 | 763 | 746 | 694 | |
| std | 18 | 13 | 8 | 13 | 19 | 28 | 7 | |
| 22 | minimum | 891 | 836 | 763 | 844 | 834 | 755 | 729 |
| median | 970 | 937 | 833 | 927 | 848 | 820 | 749 | |
| std | 45 | 57 | 62 | 36 | 6 | 46 | 14 | |
| 23 | minimum | 1010 | 953 | 891 | 968 | 908 | 865 | 837 |
| median | 1148 | 1085 | 991 | 1101 | 1009 | 993 | 872 | |
| std | 119 | 60 | 43 | 82 | 49 | 101 | 26 | |
| 24 | minimum | 1084 | 1043 | 1018 | 1071 | 1002 | 967 | 951 |
| median | 1300 | 1291 | 1100 | 1287 | 1152 | 1095 | 985 | |
| std | 134 | 176 | 45 | 105 | 123 | 111 | 26 | |
| 25 | minimum | 1325 | 1266 | 1201 | 1257 | 1155 | 1049 | 1015 |
| median | 1492 | 1462 | 1250 | 1449 | 1293 | 1239 | 1059 | |
| std | 125 | 103 | 32 | 166 | 84 | 89 | 22 | |
| 26 | minimum | 1586 | 1462 | 1353 | 1519 | 1405 | 1219 | 1069 |
| median | 1714 | 1603 | 1427 | 1691 | 1556 | 1249 | 1128 | |
| std | 95 | 96 | 50 | 116 | 76 | 16 | 42 | |
| 27 | minimum | 1852 | 1729 | 1381 | 1871 | 1620 | 1291 | 1207 |
| median | 2014 | 1992 | 1620 | 1947 | 1671 | 1450 | 1285 | |
| std | 90 | 188 | 213 | 42 | 24 | 137 | 41 | |
| 28 | minimum | 773 | 773 | 767 | 770 | 768 | 765 | 763 |
| median | 788 | 784 | 784 | 789 | 785 | 780 | 778 | |
| std | 6 | 6 | 11 | 14 | 10 | 8 | 10 | |
| 29 | minimum | 891 | 864 | 828 | 855 | 832 | 828 | 788 |
| median | 916 | 882 | 868 | 900 | 845 | 863 | 803 | |
| std | 11 | 8 | 28 | 27 | 11 | 30 | 13 | |
| 30 | minimum | 101 | 989 | 930 | 983 | 943 | 916 | 891 |
| median | 1054 | 1031 | 973 | 1032 | 967 | 978 | 926 | |
| std | 33 | 19 | 25 | 22 | 18 | 35 | 17 | |
| 31 | minimum | 1074 | 1028 | 993 | 1068 | 1021 | 966 | 926 |
| median | 1133 | 1089 | 1052 | 1108 | 1034 | 983 | 936 | |
| std | 34 | 35 | 41 | 31 | 9 | 7 | 8 | |
| 32 | minimum | 1246 | 1142 | 1041 | 1209 | 1066 | 1004 | 965 |
| median | 1335 | 1264 | 1179 | 1278 | 1216 | 1138 | 995 | |
| std | 49 | 86 | 64 | 31 | 131 | 112 | 13 | |
| 33 | minimum | 1404 | 1396 | 1244 | 1317 | 1285 | 1212 | 1133 |
| median | 1492 | 1441 | 1348 | 1498 | 1333 | 1297 | 1172 | |
| std | 38 | 39 | 80 | 77 | 38 | 61 | 32 | |
| 34 | minimum | 1507 | 1445 | 1369 | 1507 | 1403 | 1330 | 1226 |
| median | 1591 | 1528 | 1460 | 1582 | 1478 | 1374 | 1276 | |
| std | 62 | 66 | 69 | 56 | 54 | 26 | 22 | |
| 35 | minimum | 1630 | 1560 | 1453 | 1529 | 1534 | 1386 | 1349 |
| median | 1734 | 1675 | 1597 | 1703 | 1604 | 1541 | 1423 | |
| std | 82 | 78 | 82 | 144 | 42 | 75 | 61 | |
| 36 | minimum | 1881 | 1722 | 1551 | 1894 | 1726 | 1622 | 1463 |
| median | 1965 | 1880 | 1746 | 1957 | 1834 | 1667 | 1542 | |
| std | 38 | 86 | 175 | 47 | 85 | 30 | 46 | |
| 37 | minimum | 896 | 896 | 894 | 895 | 893 | 893 | 891 |
| median | 906 | 906 | 900 | 906 | 902 | 897 | 896 | |
| std | 7 | 7 | 4 | 7 | 7 | 2 | 4 | |
| 38 | minimum | 985 | 970 | 962 | 969 | 959 | 955 | 936 |
| median | 101 | 995 | 976 | 1001 | 983 | 975 | 951 | |
| std | 12 | 18 | 7 | 200 | 16 | 11 | 6 | |
| 39 | minimum | 1019 | 1015 | 995 | 998 | 998 | 984 | 960 |
| median | 1044 | 1028 | 1004 | 1033 | 1005 | 993 | 965 | |
| std | 13 | 8 | 7 | 14 | 6 | 7 | 3 | |
| 40 | minimum | 1064 | 1051 | 1035 | 1054 | 1046 | 1031 | 1024 |
| median | 1093 | 1077 | 1054 | 1074 | 1066 | 1054 | 1034 | |
| std | 23 | 20 | 14 | 15 | 15 | 20 | 7 | |
| 41 | minimum | 1305 | 1228 | 1188 | 1239 | 1167 | 1111 | 1039 |
| median | 1428 | 1368 | 1282 | 1410 | 1232 | 1247 | 1069 | |
| std | 86 | 105 | 51 | 83 | 37 | 77 | 19 | |
| 42 | minimum | 1497 | 1494 | 1339 | 1481 | 1286 | 1253 | 1167 |
| median | 1571 | 1546 | 1397 | 1571 | 1383 | 1347 | 1197 | |
| std | 35 | 27 | 44 | 80 | 85 | 56 | 25 | |
| 43 | minimum | 1556 | 1524 | 1441 | 1459 | 1406 | 1373 | 1261 |
| median | 1645 | 1572 | 1523 | 1661 | 1514 | 1460 | 1325 | |
| std | 54 | 37 | 33 | 99 | 87 | 49 | 51 | |
| 44 | minimum | 1847 | 1847 | 1595 | 1821 | 1582 | 1469 | 1413 |
| median | 1985 | 1895 | 1789 | 2004 | 1741 | 1636 | 1507 | |
| std | 118 | 39 | 89 | 92 | 91 | 73 | 42 | |
| 45 | minimum | 2029 | 1898 | 1679 | 2040 | 1827 | 1537 | 1482 |
| median | 2197 | 2083 | 1907 | 2191 | 2001 | 1696 | 1571 | |
| std | 141 | 98 | 119 | 107 | 110 | 94 | 75 | |
| 46 | minimum | 749 | 749 | 749 | 749 | 749 | 749 | 749 |
| median | 754 | 754 | 752 | 753 | 751 | 750 | 749 | |
| std | 4 | 4 | 2 | 3 | 1 | 0 | 0 | |
| 47 | minimum | 788 | 787 | 783 | 788 | 785 | 781 | 778 |
| median | 818 | 816 | 811 | 816 | 806 | 805 | 803 | |
| std | 14 | 14 | 23 | 13 | 14 | 12 | 20 | |
| 48 | minimum | 906 | 902 | 874 | 896 | 863 | 847 | 837 |
| median | 960 | 956 | 901 | 950 | 904 | 914 | 877 | |
| std | 31 | 45 | 19 | 28 | 21 | 37 | 28 | |
| 49 | minimum | 1182 | 1169 | 1102 | 1142 | 1082 | 1047 | 1000 |
| median | 1271 | 1223 | 1194 | 1236 | 1150 | 1130 | 1069 | |
| std | 78 | 48 | 81 | 79 | 57 | 73 | 62 | |
| 50 | minimum | 1458 | 1393 | 1325 | 1433 | 1257 | 1204 | 1148 |
| median | 1566 | 1527 | 1417 | 1580 | 1372 | 1282 | 1207 | |
| std | 64 | 66 | 40 | 69 | 54 | 53 | 28 | |
| 51 | minimum | 1566 | 1456 | 1420 | 1529 | 1417 | 1301 | 1261 |
| median | 1694 | 1631 | 1464 | 1694 | 1500 | 1476 | 1325 | |
| std | 99 | 121 | 23 | 147 | 5 | 152 | 53 | |
| 52 | minimum | 1660 | 1600 | 1529 | 1632 | 1585 | 1540 | 1473 |
| median | 1773 | 1695 | 1627 | 1731 | 1701 | 1610 | 1556 | |
| std | 84 | 74 | 52 | 46 | 73 | 39 | 73 | |
| 53 | minimum | 1872 | 1798 | 1604 | 1795 | 1681 | 1597 | 1537 |
| median | 1990 | 1983 | 1704 | 1986 | 1755 | 1765 | 1615 | |
| std | 55 | 75 | 44 | 140 | 53 | 104 | 63 | |
| 54 | minimum | 2049 | 1919 | 1903 | 2041 | 1864 | 1694 | 1655 |
| median | 2157 | 2057 | 2007 | 2104 | 1993 | 1875 | 1748 | |
| std | 84 | 99 | 90 | 36 | 68 | 147 | 62 | |
| 55 | minimum | 857 | 855 | 836 | 851 | 837 | 822 | 818 |
| median | 882 | 867 | 850 | 882 | 865 | 848 | 832 | |
| std | 15 | 9 | 7 | 23 | 14 | 15 | 6 | |
| 56 | minimum | 965 | 946 | 911 | 940 | 937 | 925 | 896 |
| median | 995 | 973 | 970 | 981 | 941 | 940 | 926 | |
| std | 14 | 14 | 41 | 21 | 2 | 10 | 18 | |
| 57 | minimum | 1251 | 1243 | 1181 | 1256 | 1171 | 1122 | 1098 |
| median | 1310 | 1276 | 1224 | 1302 | 1227 | 1172 | 1133 | |
| std | 28 | 21 | 32 | 23 | 47 | 21 | 18 | |
| 58 | minimum | 1522 | 1442 | 1280 | 1485 | 1378 | 1286 | 1216 |
| median | 1591 | 1518 | 1348 | 1604 | 1430 | 1358 | 1276 | |
| std | 37 | 50 | 47 | 92 | 45 | 57 | 29 | |
| 59 | minimum | 1660 | 1647 | 1449 | 1540 | 1504 | 1416 | 1335 |
| median | 1783 | 1727 | 1567 | 1794 | 1618 | 1570 | 1423 | |
| std | 87 | 45 | 68 | 197 | 80 | 127 | 69 | |
| 60 | minimum | 1995 | 1937 | 1883 | 1886 | 1825 | 1729 | 1675 |
| median | 2142 | 2066 | 2004 | 2056 | 1942 | 1918 | 1768 | |
| std | 104 | 74 | 62 | 92 | 67 | 116 | 71 | |
| 61 | minimum | 2197 | 2083 | 2092 | 2194 | 2037 | 1932 | 1896 |
| median | 2325 | 2275 | 2129 | 2278 | 2165 | 2023 | 1970 | |
| std | 54 | 149 | 25 | 69 | 77 | 81 | 44 | |
| 62 | minimum | 2448 | 2332 | 2217 | 2336 | 2300 | 2141 | 2049 |
| median | 2610 | 2489 | 2382 | 2579 | 2384 | 2333 | 2162 | |
| std | 138 | 80 | 119 | 166 | 67 | 103 | 60 | |
| 63 | minimum | 2837 | 2652 | 2363 | 2819 | 2584 | 2369 | 2221 |
| median | 3058 | 2860 | 2648 | 3043 | 2774 | 2486 | 2325 | |
| std | 157 | 171 | 252 | 99 | 161 | 85 | 57 | |
| 64 | minimum | 650 | 650 | 650 | 650 | 650 | 650 | 650 |
| median | 660 | 659 | 654 | 659 | 654 | 654 | 650 | |
| std | 7 | 6 | 3 | 7 | 3 | 2 | 0 | |
| 65 | minimum | 773 | 772 | 771 | 772 | 771 | 770 | 768 |
| median | 803 | 790 | 791 | 801 | 786 | 773 | 768 | |
| std | 26 | 11 | 17 | 13 | 7 | 3 | 0 | |
| 66 | minimum | 975 | 952 | 878 | 948 | 911 | 872 | 852 |
| median | 1024 | 1019 | 967 | 1024 | 956 | 925 | 867 | |
| std | 21 | 46 | 63 | 48 | 30 | 35 | 13 | |
| 67 | minimum | 1281 | 1254 | 1187 | 1254 | 1238 | 1164 | 1152 |
| median | 1345 | 1325 | 1252 | 1336 | 1293 | 1215 | 1212 | |
| std | 56 | 59 | 27 | 42 | 27 | 43 | 46 | |
| 68 | minimum | 1409 | 1392 | 1314 | 1392 | 1307 | 1284 | 1236 |
| median | 1502 | 1463 | 1361 | 1487 | 1376 | 1376 | 1285 | |
| std | 55 | 29 | 30 | 79 | 60 | 45 | 38 | |
| 69 | minimum | 1670 | 1595 | 1552 | 1631 | 1544 | 1533 | 1463 |
| median | 1788 | 1730 | 1632 | 1788 | 1655 | 1599 | 1532 | |
| std | 101 | 87 | 53 | 114 | 84 | 46 | 34 | |
| 70 | minimum | 1975 | 1853 | 1818 | 1940 | 1769 | 1741 | 1625 |
| median | 2108 | 2026 | 1937 | 2036 | 1894 | 1884 | 1704 | |
| std | 111 | 110 | 98 | 47 | 76 | 78 | 33 | |
| 71 | minimum | 2098 | 2032 | 1978 | 2047 | 1938 | 1893 | 1832 |
| median | 2231 | 2153 | 2089 | 2227 | 2064 | 1964 | 1916 | |
| std | 104 | 107 | 66 | 135 | 60 | 33 | 56 | |
| 72 | minimum | 2197 | 2128 | 1996 | 2197 | 2042 | 1965 | 1921 |
| median | 2369 | 2275 | 2067 | 2326 | 2146 | 2044 | 2004 | |
| std | 126 | 130 | 48 | 52 | 54 | 46 | 43 |
| Metrics | GA | PSO | DE | BBO | EBO | WWO | EWWO |
|---|---|---|---|---|---|---|---|
| AVG(Minimum) | 1348 | 1303.5 | 1227.6 | 1318 | 1246.7 | 1187.3 | 1140.7 |
| RANK(Minimum) | 68 | 54 | 33 | 56 | 37 | 22 | 11 |
| AVG(Median) | 1436.5 | 1391.8 | 1307.3 | 1420.3 | 1321.4 | 1265.9 | 1189.7 |
| RANK(Median) | 68 | 52 | 32 | 60 | 36 | 23 | 10 |
Disclaimer/Publisher’s Note: The statements, opinions and data contained in all publications are solely those of the individual author(s) and contributor(s) and not of MDPI and/or the editor(s). MDPI and/or the editor(s) disclaim responsibility for any injury to people or property resulting from any ideas, methods, instructions or products referred to in the content. |
© 2024 by the authors. Licensee MDPI, Basel, Switzerland. This article is an open access article distributed under the terms and conditions of the Creative Commons Attribution (CC BY) license (https://creativecommons.org/licenses/by/4.0/).
Share and Cite
Wu, R.-Y.; Xie, X.-C.; Zheng, Y.-J. Firefighting Drone Configuration and Scheduling for Wildfire Based on Loss Estimation and Minimization. Drones 2024, 8, 17. https://doi.org/10.3390/drones8010017
Wu R-Y, Xie X-C, Zheng Y-J. Firefighting Drone Configuration and Scheduling for Wildfire Based on Loss Estimation and Minimization. Drones. 2024; 8(1):17. https://doi.org/10.3390/drones8010017
Chicago/Turabian StyleWu, Rong-Yu, Xi-Cheng Xie, and Yu-Jun Zheng. 2024. "Firefighting Drone Configuration and Scheduling for Wildfire Based on Loss Estimation and Minimization" Drones 8, no. 1: 17. https://doi.org/10.3390/drones8010017
APA StyleWu, R.-Y., Xie, X.-C., & Zheng, Y.-J. (2024). Firefighting Drone Configuration and Scheduling for Wildfire Based on Loss Estimation and Minimization. Drones, 8(1), 17. https://doi.org/10.3390/drones8010017


