Article

Energy Consumption Performance of a VTOL UAV In and Out of Ground Effect by Flight Test

1
Department of Mechanics and Aerospace Engineering, Southern University of Science and Technology, Shenzhen 518055, China
2
Institute for Advanced Study, BNU-HKBU United International College, Zhuhai 519087, China
*
Author to whom correspondence should be addressed.
Drones 2024, 8(11), 625; https://doi.org/10.3390/drones8110625
Submission received: 23 September 2024 / Revised: 24 October 2024 / Accepted: 29 October 2024 / Published: 30 October 2024

Abstract

:
Current research on ground-effect unmanned aerial vehicles (UAVs) predominantly centers on numerical aerodynamic optimization and stability analysis in the ground effect, leaving a significant gap in the thorough examination of flight performance through flight tests. This study presents the design of a vertical takeoff and landing (VTOL) ground-effect UAV, featuring a vector motor configuration. The control system utilizes a decoupled strategy based on position and attitude, enabling stable altitude control in the low-altitude ground-effect region. Comprehensive flight tests were conducted to evaluate the UAV’s flight stability and energy consumption in the ground-effect region. The results reveal that the ground-effect UAV successfully performed rapid takeoff maneuvers and maintained stable forward flight in the designated ground-effect region. In the span-dominated ground-effect region, a significant 33% reduction in flight current was observed, leading to a corresponding 33% decrease in total power consumption compared to flight conditions outside the ground effect. These findings highlight a substantial improvement in flight performance under the influence of ground effect. The real-time flight data produced by this system provides valuable insights for optimizing the design of VTOL ground-effect UAVs.

1. Introduction

The ground-effect phenomenon in fixed-wing aircraft becomes apparent when a small gap exists between the aircraft’s undersurface and the ground or water surface [1,2]. Extensive studies have demonstrated a significant increase in lift and a concurrent reduction in drag when operating in the ground effect, predominantly influenced by ram ground effect and span-dominated ground effect [3,4]. In span-dominated ground effect, the height-to-span ratio ( H / b ) is of primary importance, while the height-to-chord ratio ( H / c ) is the key factor in ram ground effect [5]. Yang and Yang investigated the span-dominated ground effect by employing the standard k-ω turbulence model to solve the steady and incompressible Navier–Stokes equations using a commercial computational fluid dynamics platform [6]. Their research indicated that, with a constant wing area and ground clearance, increasing the aspect ratio of a three-dimensional wing leads to simultaneous increases in both lift and lift-to-drag ratio. Additionally, researchers have examined ground effects using wind-tunnel models with varying ground clearances. The ground boundary conditions were simulated through a combination of moving belts and fixed plates [7,8,9,10]. The study highlighted the significant impact of ground boundary conditions on aerodynamic characteristics across different ground clearances. The influence of ground effect on the drag reduction exists across different Reynolds numbers under varying operating conditions, with values applicable to small UAVs [11], ranging from 0.01 × 10 6 to 0.02 × 10 6 [9], and from 0.022 × 10 6 to 0.11 × 10 6 [10], reaching up to 2 × 10 6 [8].
Despite the attractive aerodynamic advantages of ground effect, designing unmanned Wing-in-Ground (WIG) vehicles presents technical challenges in achieving inherent stability in ground effect [2]. Earlier researchers, including Irodov [12] and Staufenbiel and Schlichting [13,14], derived a general criterion for height stability by solving the nonlinear dynamic equations of WIG vehicles, expressed as HS = C L h C m h / C m α C L α < 0 . However, the assumptions made during the derivation limit the criterion’s applicability. Subsequent studies by researchers such as Lee et al., Yang and Yang, and Yang et al. examined the effects of different configurations on longitudinal static and dynamic stability through numerical analysis. They found that inherent stability tends to deteriorate in the ram-ground-effect region [15,16,17]. Chun and Chang conducted a longitudinal stability analysis of a 20-seat WIG vehicle based on wind-tunnel tests. They utilized eigenvalue analysis to evaluate both the longitudinal static and dynamic stability of various aerodynamic configurations of the WIG vehicle [18].
Current research on WIG vehicle stability has primarily focused on the ram-ground-effect region. Su et al. performed a stability analysis of ground-effect phenomena, specifically investigating the variations in stability modes in the span-dominated and ram-ground-effect regions [19]. Span-dominated ground effect occurs in the region where H / c ranges from 10 to 1. In this region, drag is significantly reduced and there is a modest increase in lift (see Figure 1a). In contrast, ram ground effect occurs when H / c is less than 1, leading to a substantial increase in lift (see Figure 1b). As the height further decreases into the ram-ground-effect region, the phugoid mode tends to become unstable (see Figure 1c,d). Variations in aerodynamic derivatives across different ground-effect regions result in distinct inherent stability characteristics. While WIG vehicles typically require larger dimensions to maintain flight in ground-effect, small-sized WIG vehicles with large aspect-ratio wings perform effectively in the span-dominated ground effect, leveraging aerodynamic benefits and inherent longitudinal stability.
Current research on ground-effect UAVs mainly emphasizes numerical aerodynamic optimization and stability analysis in ground effect. However, there is a significant gap in the comprehensive exploration of flight performance through flight testing.
Traditional military and commercial ground-effect vehicles typically employ skimming takeoff and landing procedures on water or the ground [2,20,21]. To expand the application scenarios and enhance the flight maneuverability of ground-effect vehicles, VTOL capability is essential. Conventional VTOL UAVs with three rotors offer a compromise between the characteristics of bi-rotor and quad-rotor configurations [22,23]. Notably, compared to quad-rotor VTOL UAVs, the tri-rotor variant is lighter while offering greater stability than bi-rotor VTOL UAVs [23,24]. This configuration involves placing two rotors forward of the main wing and positioning the third rotor near the tail. Mathematical models for various tri-tilt-rotor UAVs have been developed [25,26,27].
Given the imperative requirement for height control in the ground-effect region, this study introduces the design of a tri-tilt-rotor VTOL ground-effect UAV, named Egretta30. The initial step involves deriving the rotational dynamic equations relevant to the tri-tilt-rotor UAV. Subsequently, a sophisticated control strategy, which decouples position and attitude, is implemented to ensure stable altitude control within the ground effect. This control framework is carefully designed to be universally applicable across various flight modes typical of fixed-wing UAVs with vertical takeoff and landing capabilities. Finally, comprehensive flight tests will be conducted to assess flight stability in ground effect and overall flight performance both in and out of this region.

2. The VTOL UAV in Ground Effect

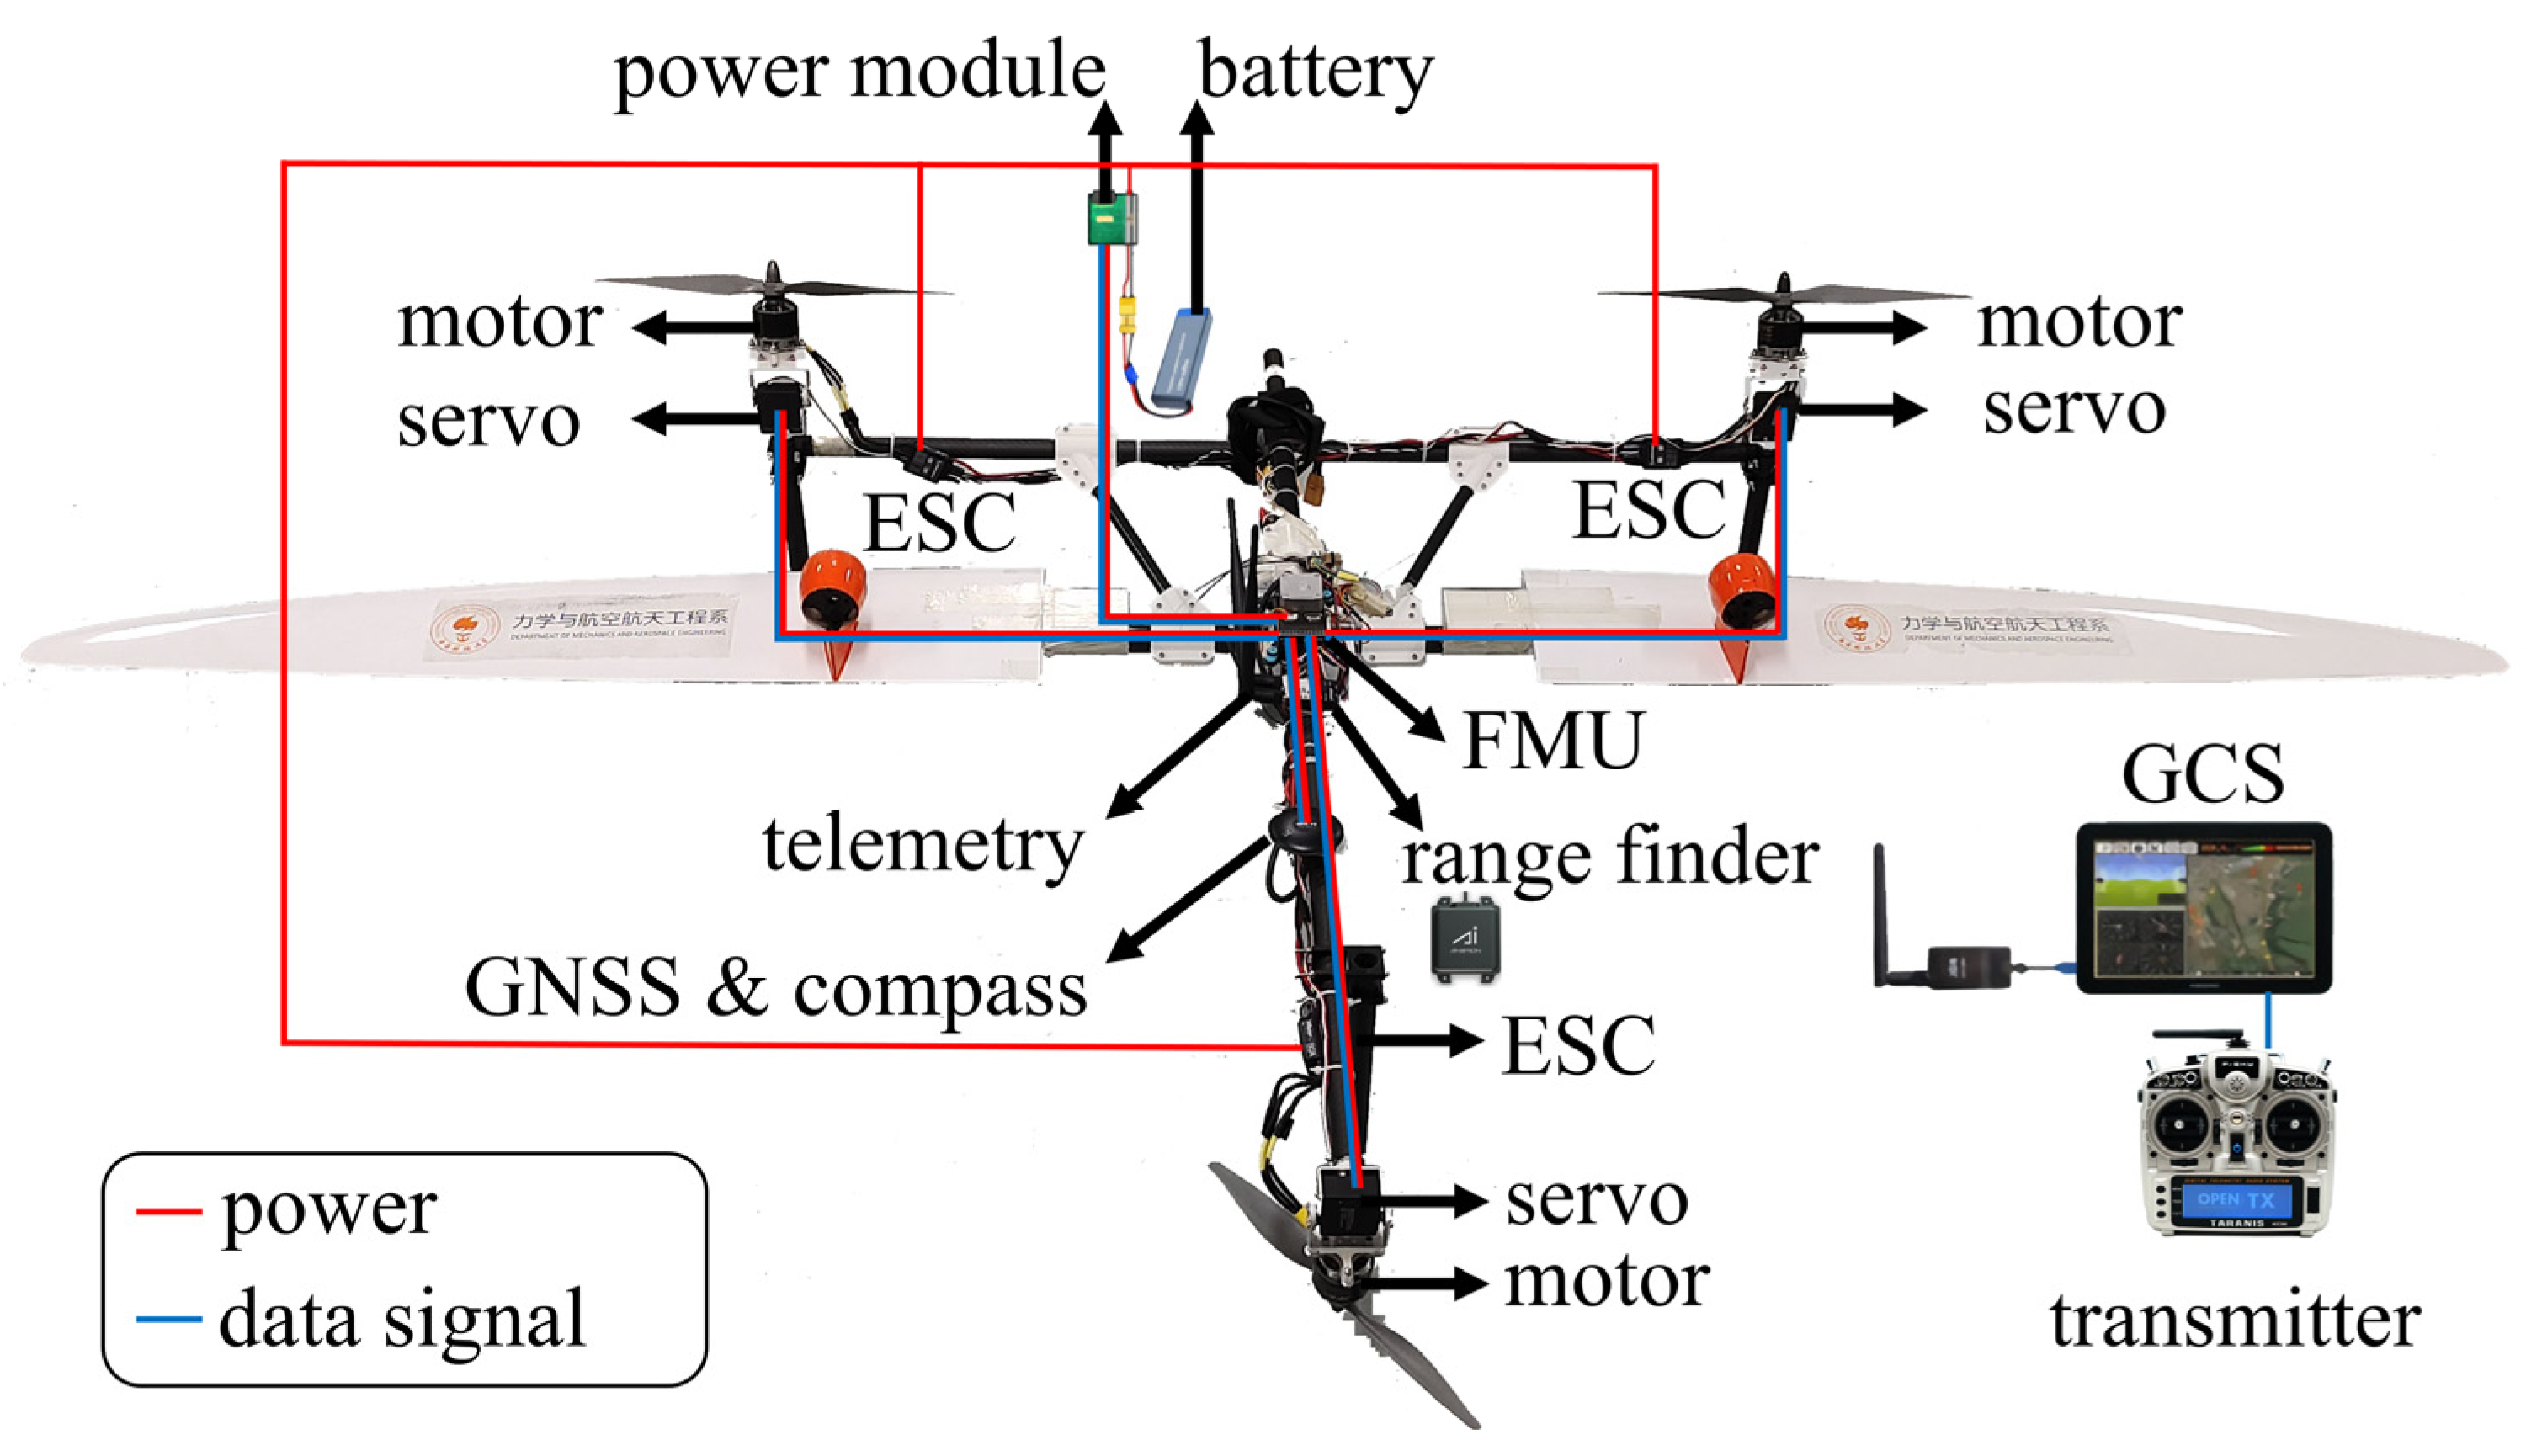
2.1. Testing Vehicle and Control Framework

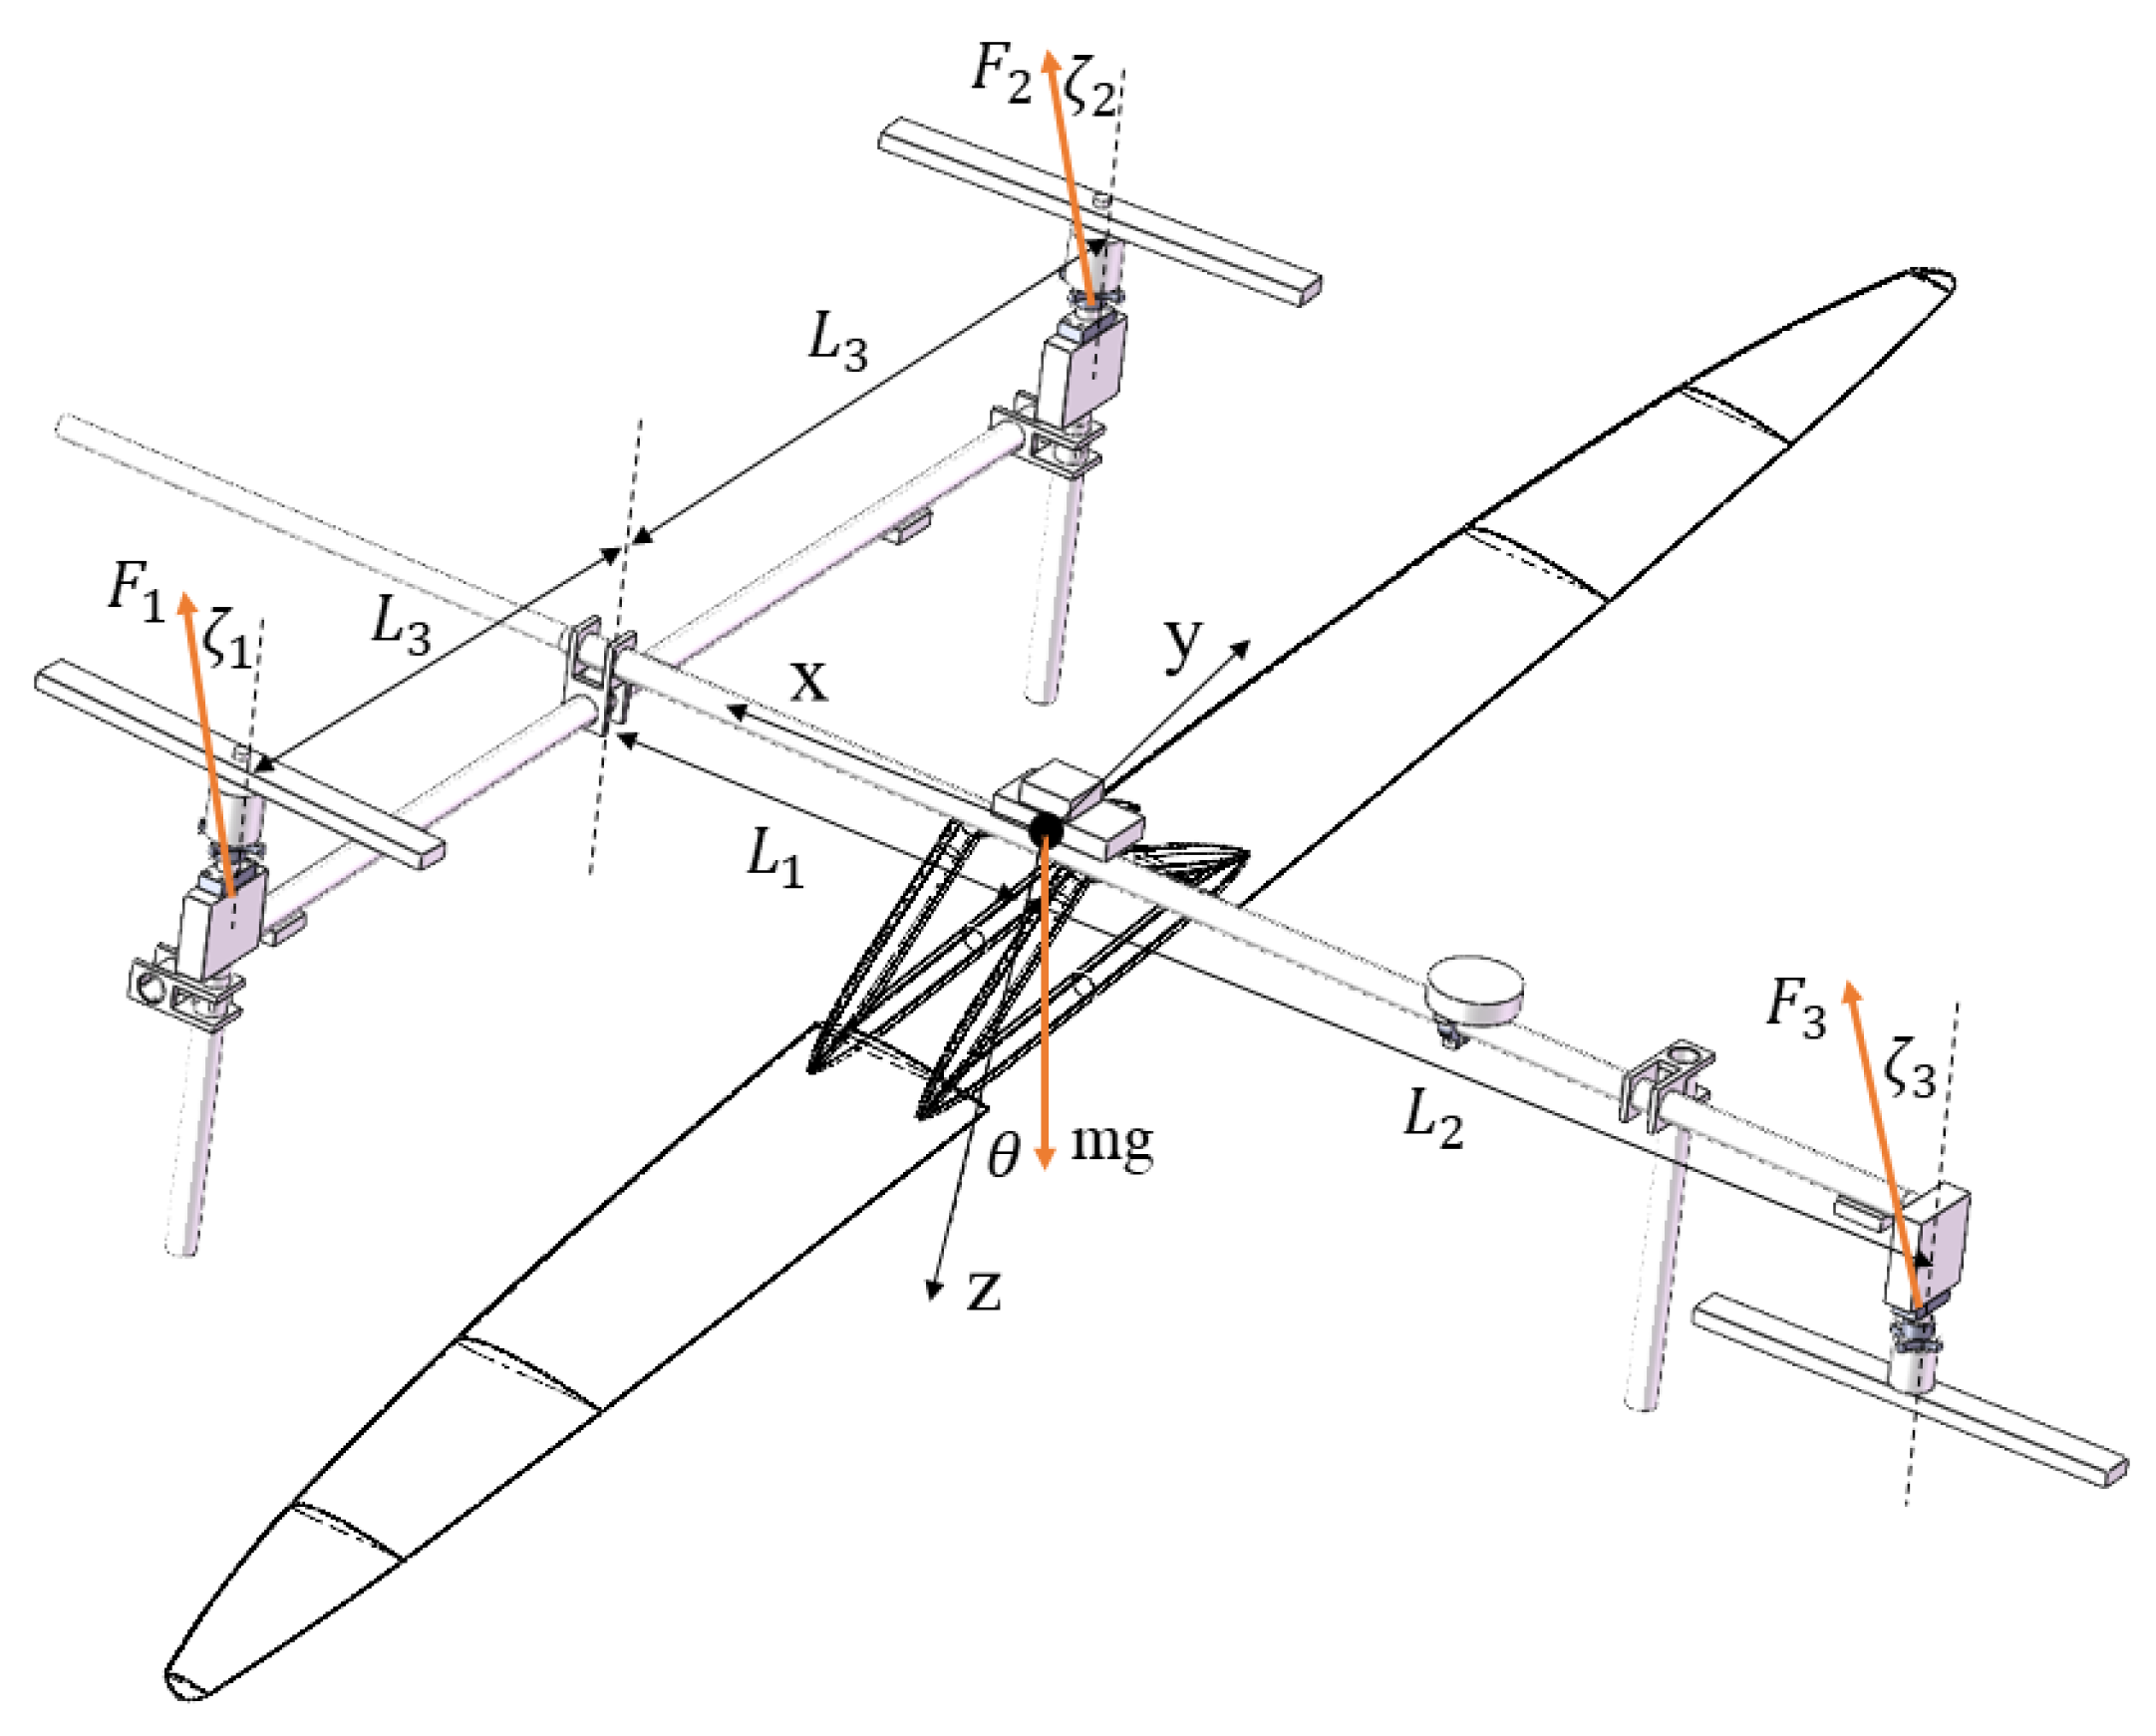
2.1.1. Testing Vehicle

To achieve stable flight in the ground-effect region, the tri-rotor tilting VTOL UAV, Egretta30, has been designed. Figure 2 presents the vector propulsive frame and module diagram, while Figure 3 illustrates the data transmission system of Egretta30. The basic parameters of Egretta30 are listed in Table 1. The translational and rotational movements of the UAV are controlled by the thrust and tilt angles of its three rotors positioned at the front and rear. To achieve forward translation, a slight tilt along the Y-axis is applied to the front rotor along with an increase in thrust from the rear rotor. The front rotors rotate in opposite directions to offset torque, with one rotating clockwise and the other counterclockwise. Pitch control is achieved by varying the rotational speed of the rear rotor relative to the front two rotors that tilt in the same direction along the Y-axis. Yaw control is accomplished by differentially tilting and adjusting the speeds of the first two rotors along the Y-axis. Clockwise and counterclockwise roll maneuvers are executed by increasing the rotational speeds of the left and right rotors, respectively. The UAV’s altitude is regulated by adjusting the thrusts of the three rotors.
The onboard data acquisition system comprises various sensors, including accelerometers, gyroscopes, GNSS, and height sources (barometers and range finder), systematically summarized in Table 2. To accurately measure altitude above ground, the US-D1 Radar Altimeter utilizes radio detection and ranging (RADAR) principles to determine the UAV’s altitude. The altimeter functions by transmitting a microwave signal from the sensor that reflects off the terrain and is received back by the sensor. The altitude is determined by calculating the time difference between the signal’s transmission and its reception. This calculated altitude represents the distance between the sensor and the terrain, offering a precise measurement of the UAV’s height above ground level.

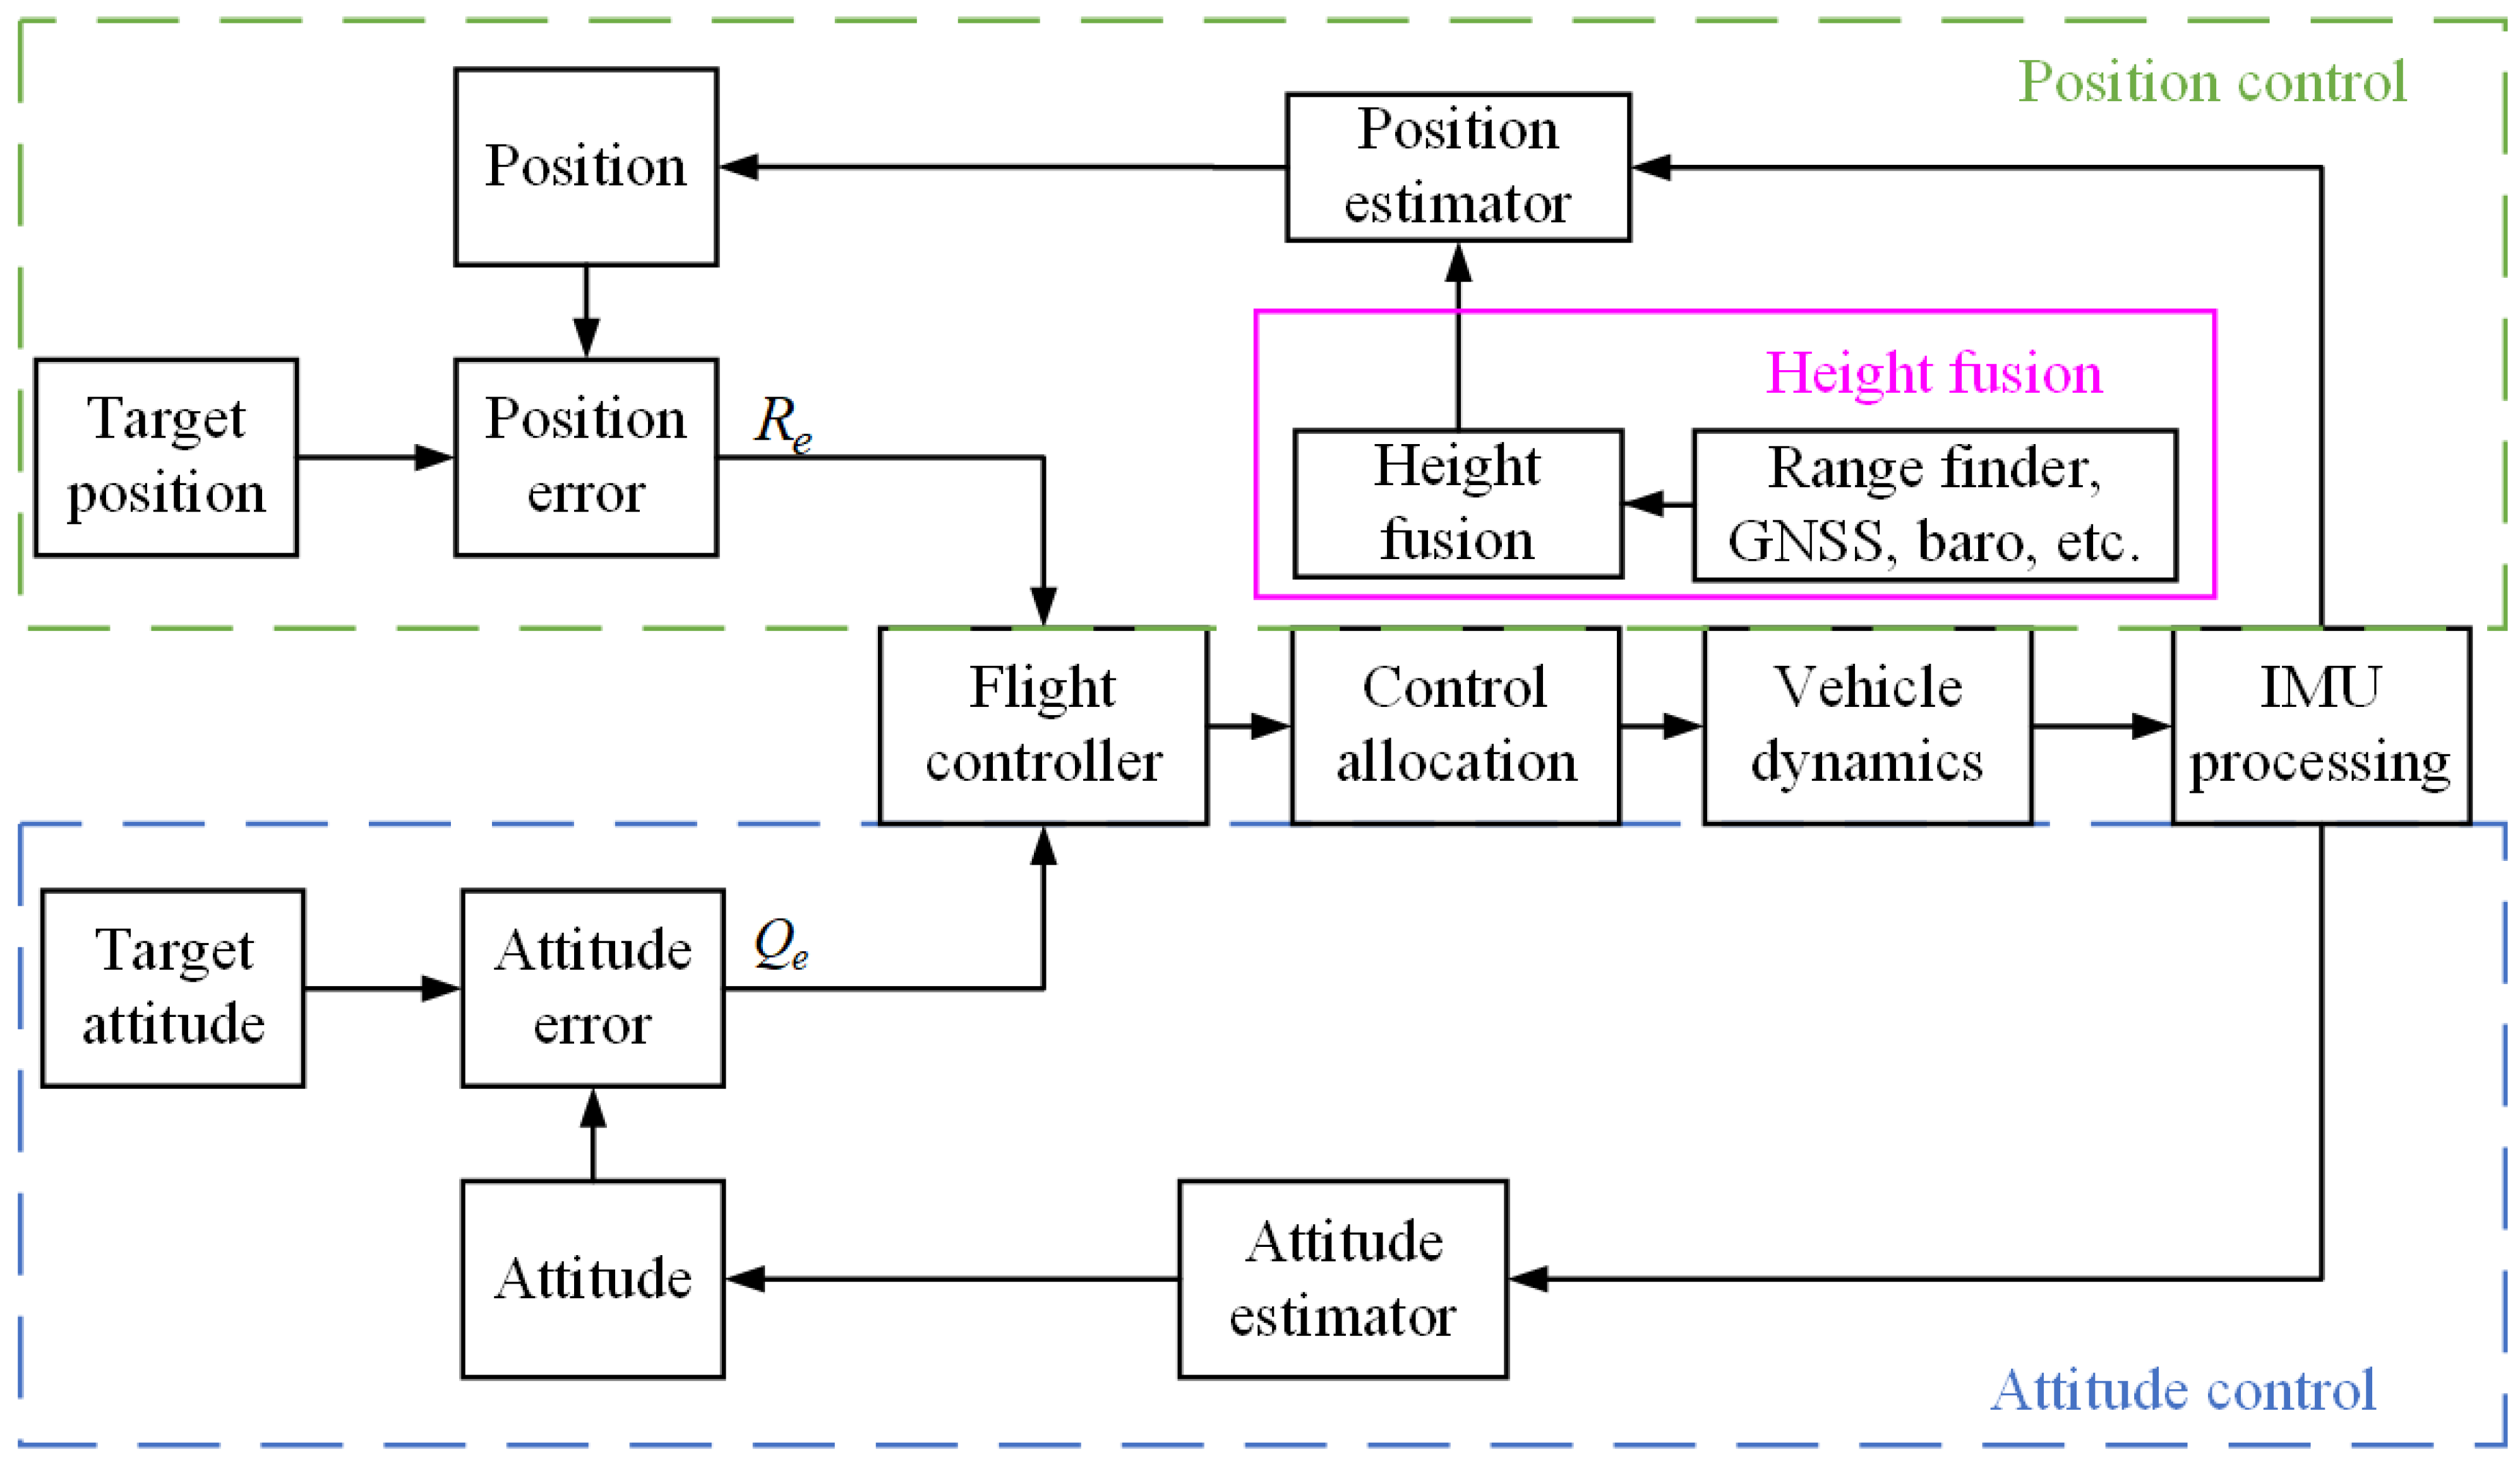
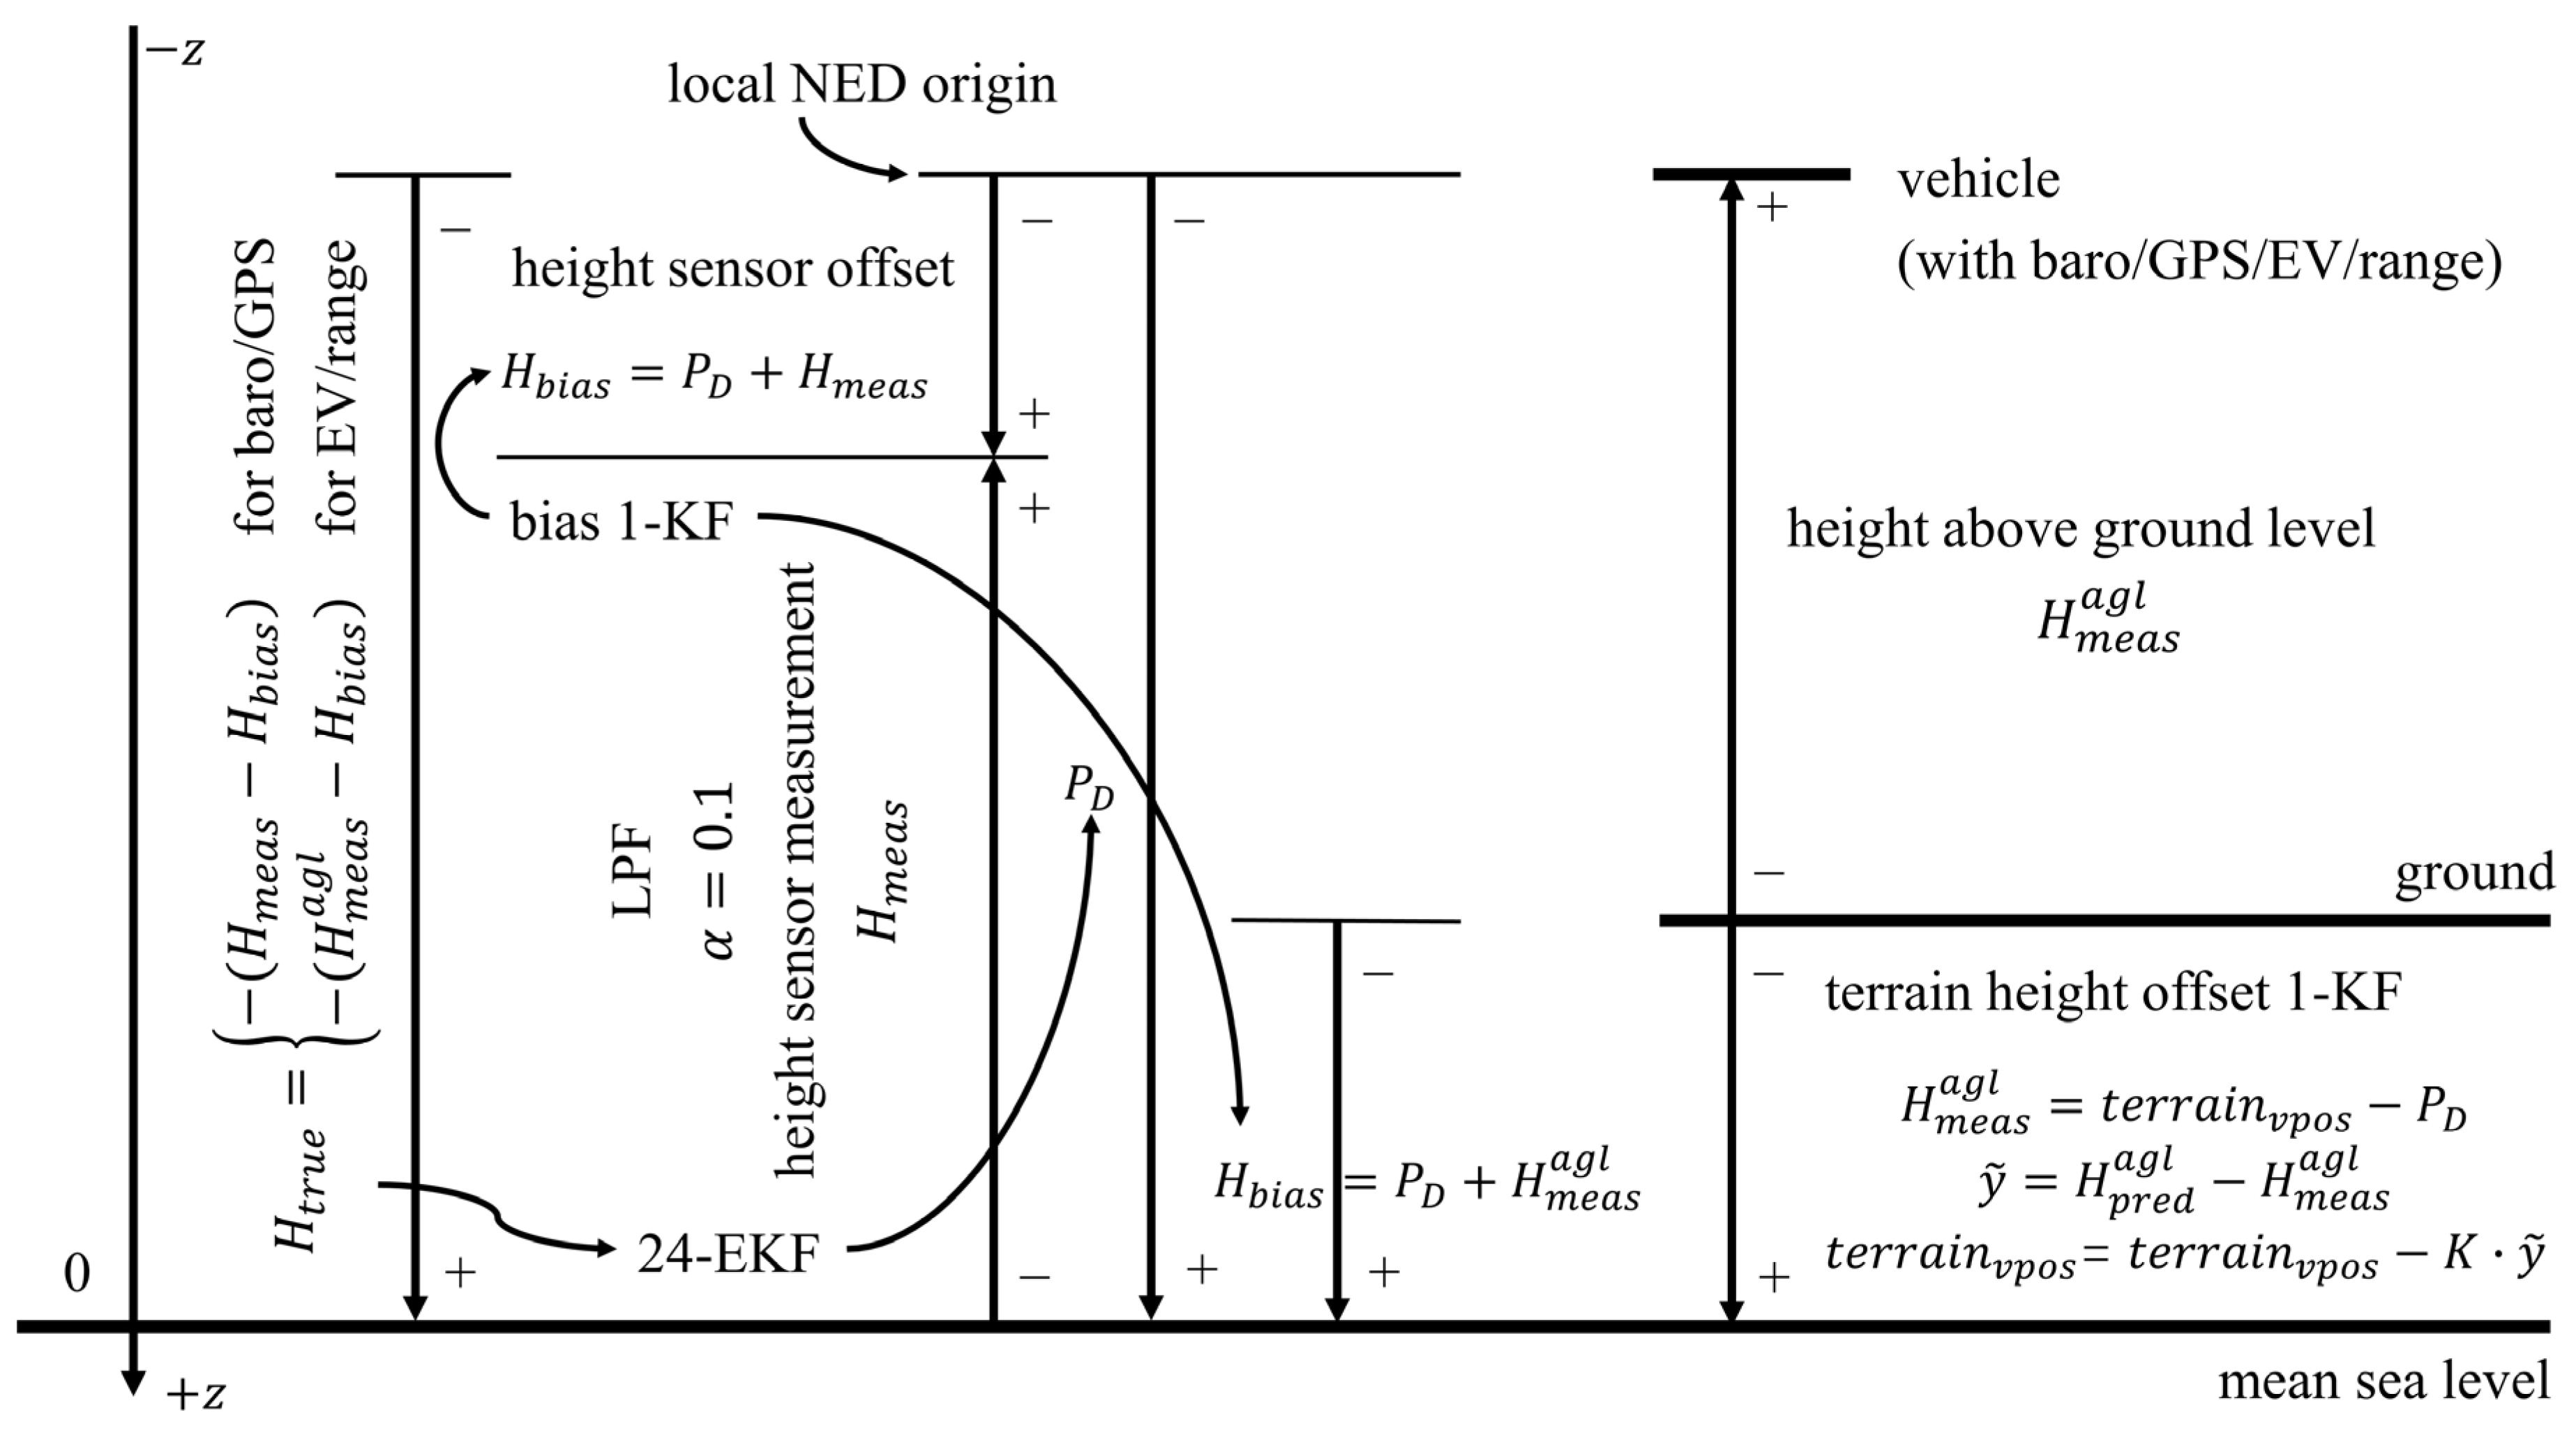
2.1.2. Control Framework

During flight in the conventional ground-effect region, the tri-tilt-rotor UAV, Egretta30, is modeled as a rigid body. The six-degree-of-freedom nonlinear motion equations used are derived from Newton’s second law for translational dynamics and Euler’s equations for rotational dynamics.
The force analysis diagram of the Egretta30 frame is shown in Figure 4.
The forces and torques acting on Egretta30 are classified into propulsive forces generated by the propellers, aerodynamic forces, and other forces and torques, such as gravity. In hover mode, the effects of aerodynamic forces and torques are considered negligible and are, therefore, excluded from the analysis. The propulsive force and torque primarily depend on the thrust, angles, and torque produced by each motor.
  • Propulsive force
    F X p = F 1 sin ζ 1 + F 2 sin ζ 2
    F Y p = F 3 sin ( ζ 3 )
    F Z p = F 1 cos ζ 1 F 2 cos ζ 2 F 3 cos ( ζ 3 )
  • Propulsive torque
    L p = F 1 cos ζ 1 L 3 F 2 cos ζ 2 L 3 + F 3 sin ( ζ 3 ) L a f t z + t ^ 2 sin ζ 2 t ^ 1 sin ζ 1
    M p = F 1 cos ζ 1 L 1 + F 2 cos ζ 2 L 1 F 3 cos ( ζ 3 ) L 2 F 1 sin ζ 1 L f o r e z F 2 sin ζ 2 L f o r e z t ^ 3 sin ( ζ 3 )
    N p = F 1 sin ζ 1 L 1 F 2 sin ζ 2 L 1 F 3 sin ( ζ 3 ) L 2 + t ^ 2 cos ζ 2 t ^ 1 cos ζ 1 + t ^ 3 cos ( ζ 3 )
In the flight controller, force and torque signals are mapped as system input variables that participate in the position and attitude control loop.
Figure 5 illustrates the framework of the proposed controller. The error signals, obtained by summing and processing real-time feedback data of the target position and orientation, are processed and allocated through a parallel P-PID controller. This process generates output signals for the directional control force of the vector servo and the thrust signal for the motor, enabling independent control of both attitude (roll, pitch, yaw) and position (X, Y, Z in the ground coordinate system). For ground-effect UAVs, particular emphasis is placed on controlling the altitude above the ground. Effective altitude control is achieved by fusing rangefinder altitude measurements with barometer and GNSS data, followed by real-time feedback signal processing and filtering. Figure 6 illustrates the estimation and control of altitude signals derived from the PX4. Multiple sources of height data, each with differing baselines and biases, necessitate harmonization to eliminate measurement biases. This process allows for calculating height innovation and innovation variance under uniform specifications, subsequently feeding into the 24-EKF algorithm for optimal height estimation.
When the UAV operates at low altitudes or during takeoff and landing, using atmospheric pressure as the altitude data source can result in significant fluctuations in altitude estimation. This occurs due to transient changes in positive static pressure caused by the interaction between the rotor and the ground, leading to erroneous negative vertical position information. In contrast, a rangefinder effectively mitigates ground-effect impacts, providing precise altitude measurements.

2.2. Test Arrangement

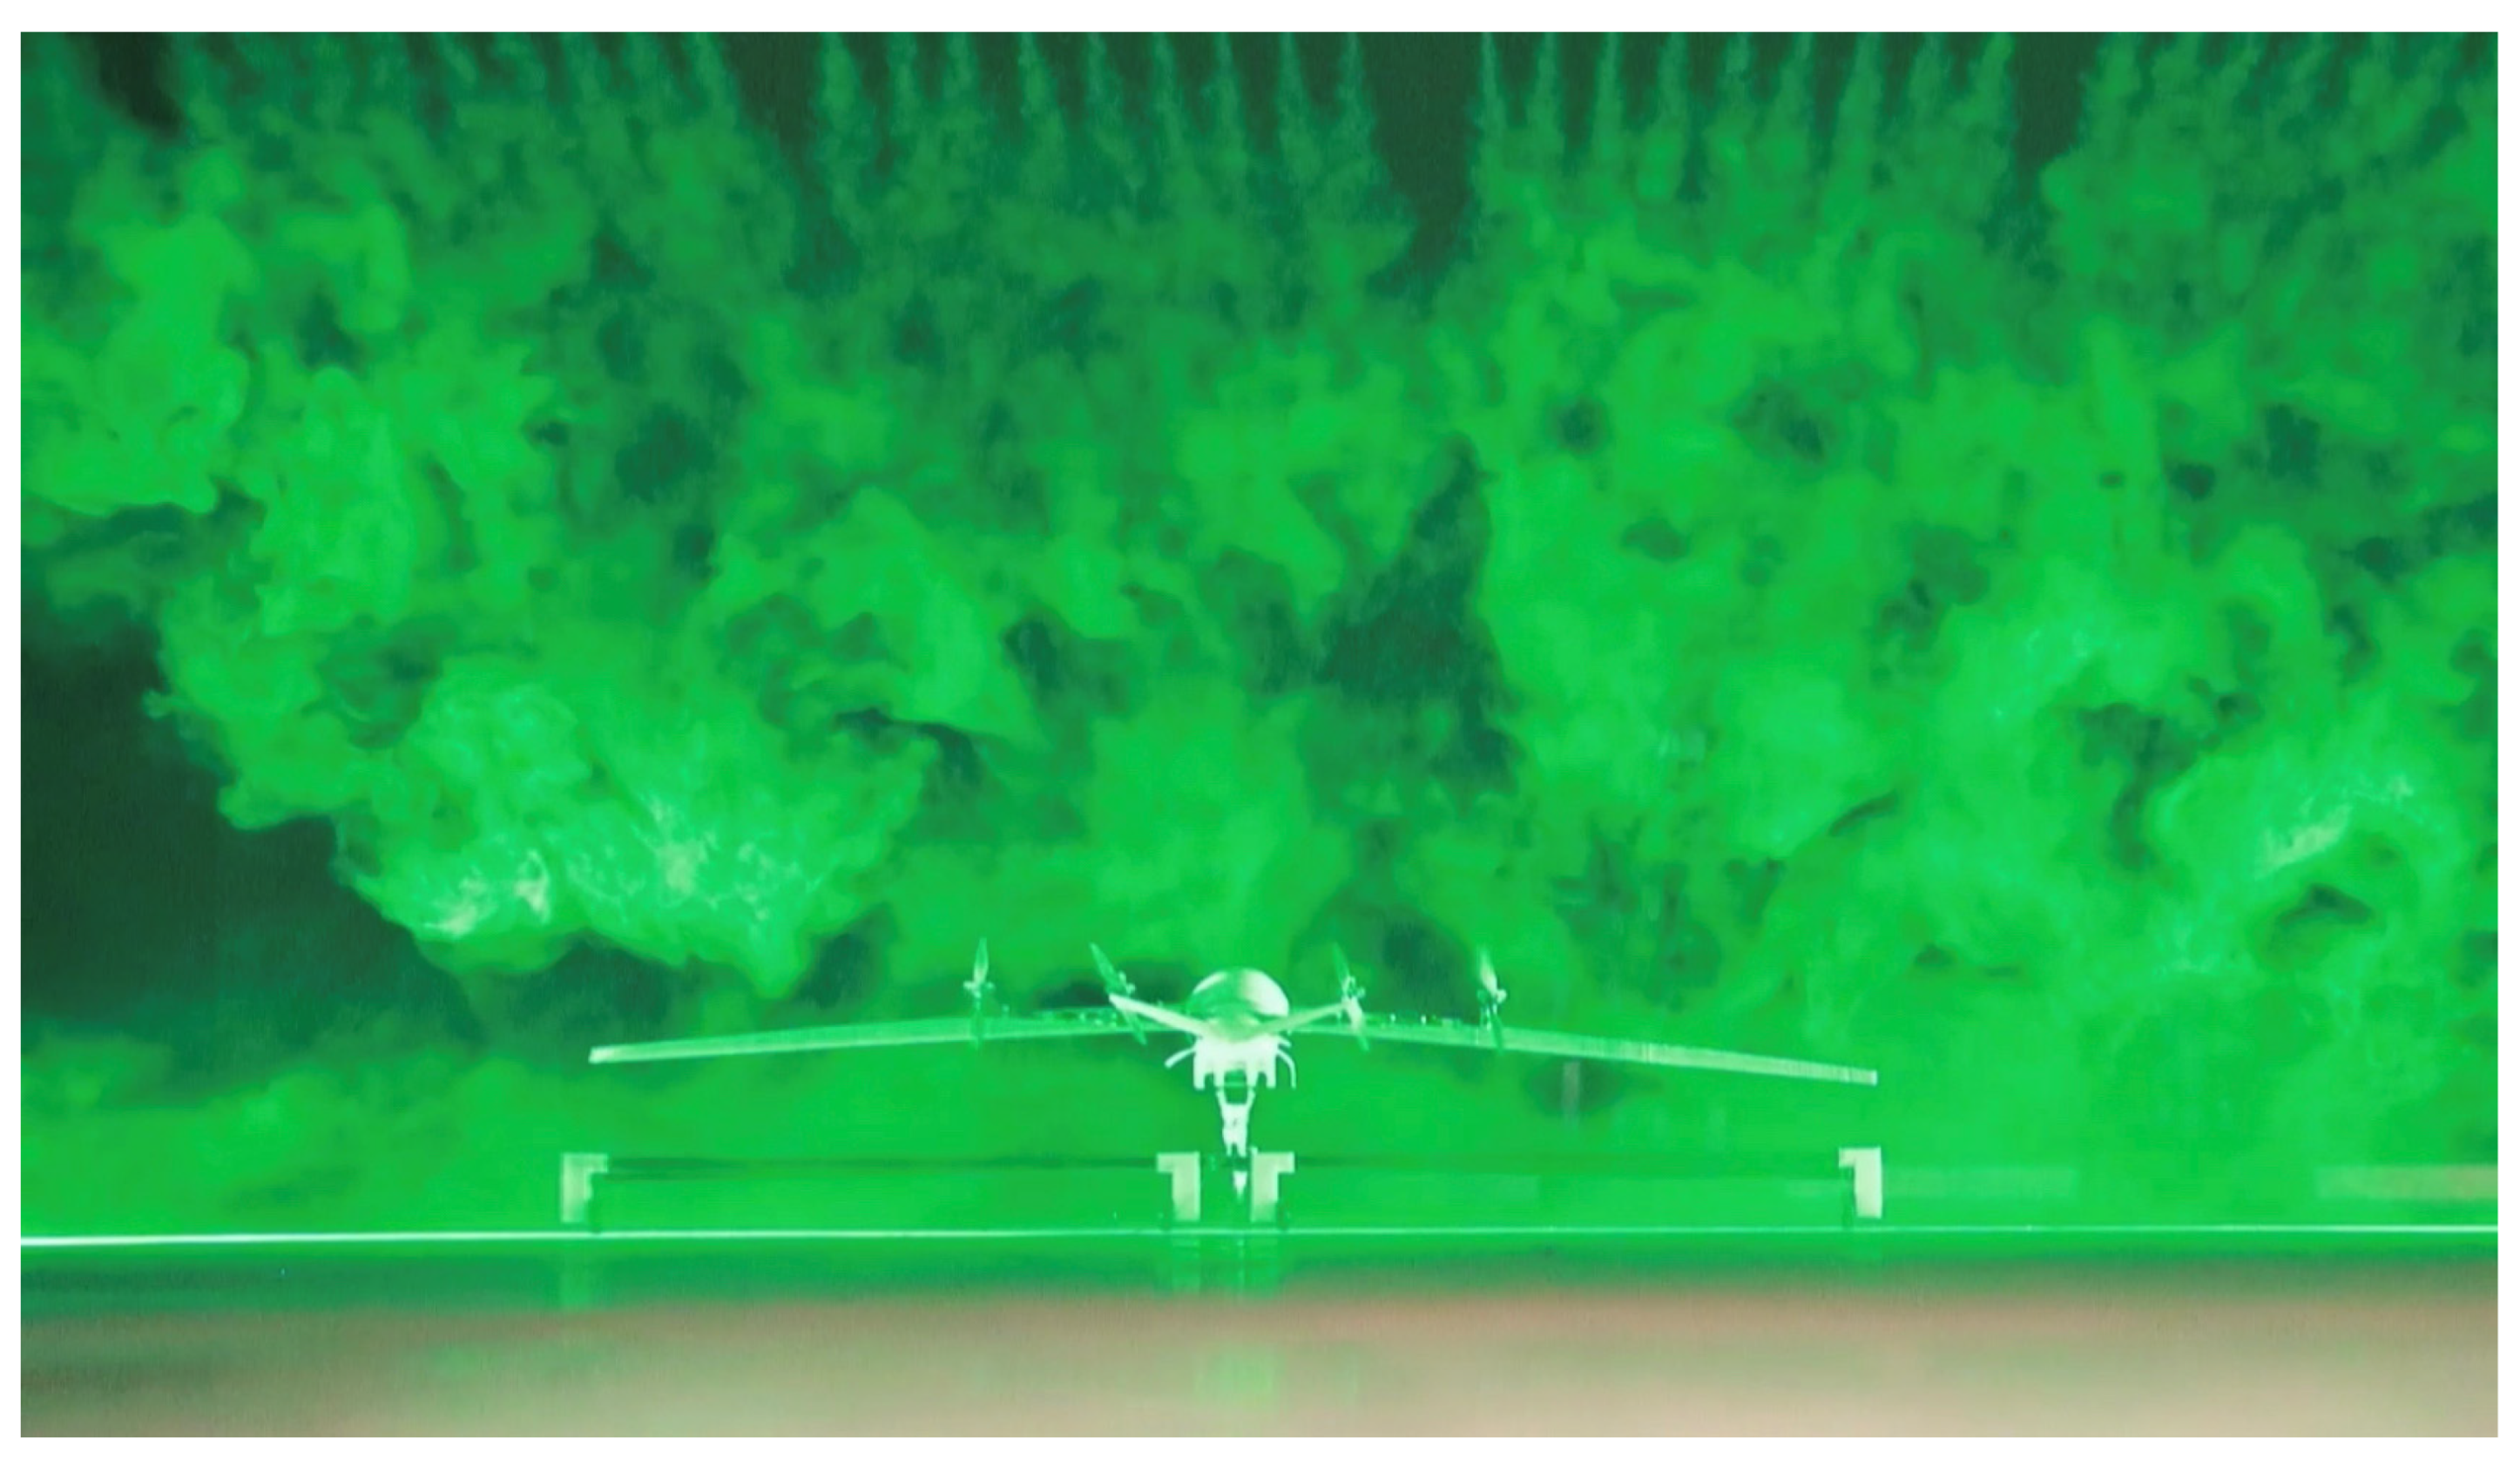
2.2.1. Flow Visualization

For a finite-length wing, airflow beneath the lower surface circumvents the wingtip and flows toward the upper surface, forming vortices. The strength of these wingtip vortices increases with augmented lift, which consequently leads to an increase in induced drag. Scholars have observed that the span-dominated ground-effect region can effectively balance aerodynamic efficiency and inherent stability. Therefore, this research includes a smoke flow visualization experiment in the ground effect to observe variations in wingtip vortices at different heights above the ground. To clearly visualize wingtip vortices without interference from rotor downwash, the propeller is turned off.
A smoke generation device is employed to produce visible water vapor in the air, with the flight height controlled by a fixed pulley stand, as shown in Figure 7. To enhance vortex strength, tests are conducted at a geometric angle of attack of 12°. The objective is to observe vortex variations at specific heights of 1.0 m, 0.6 m, and 0.2 m, corresponding to span-dominated ground effect with H / b values of 0.5, 0.3, and 0.1, respectively.

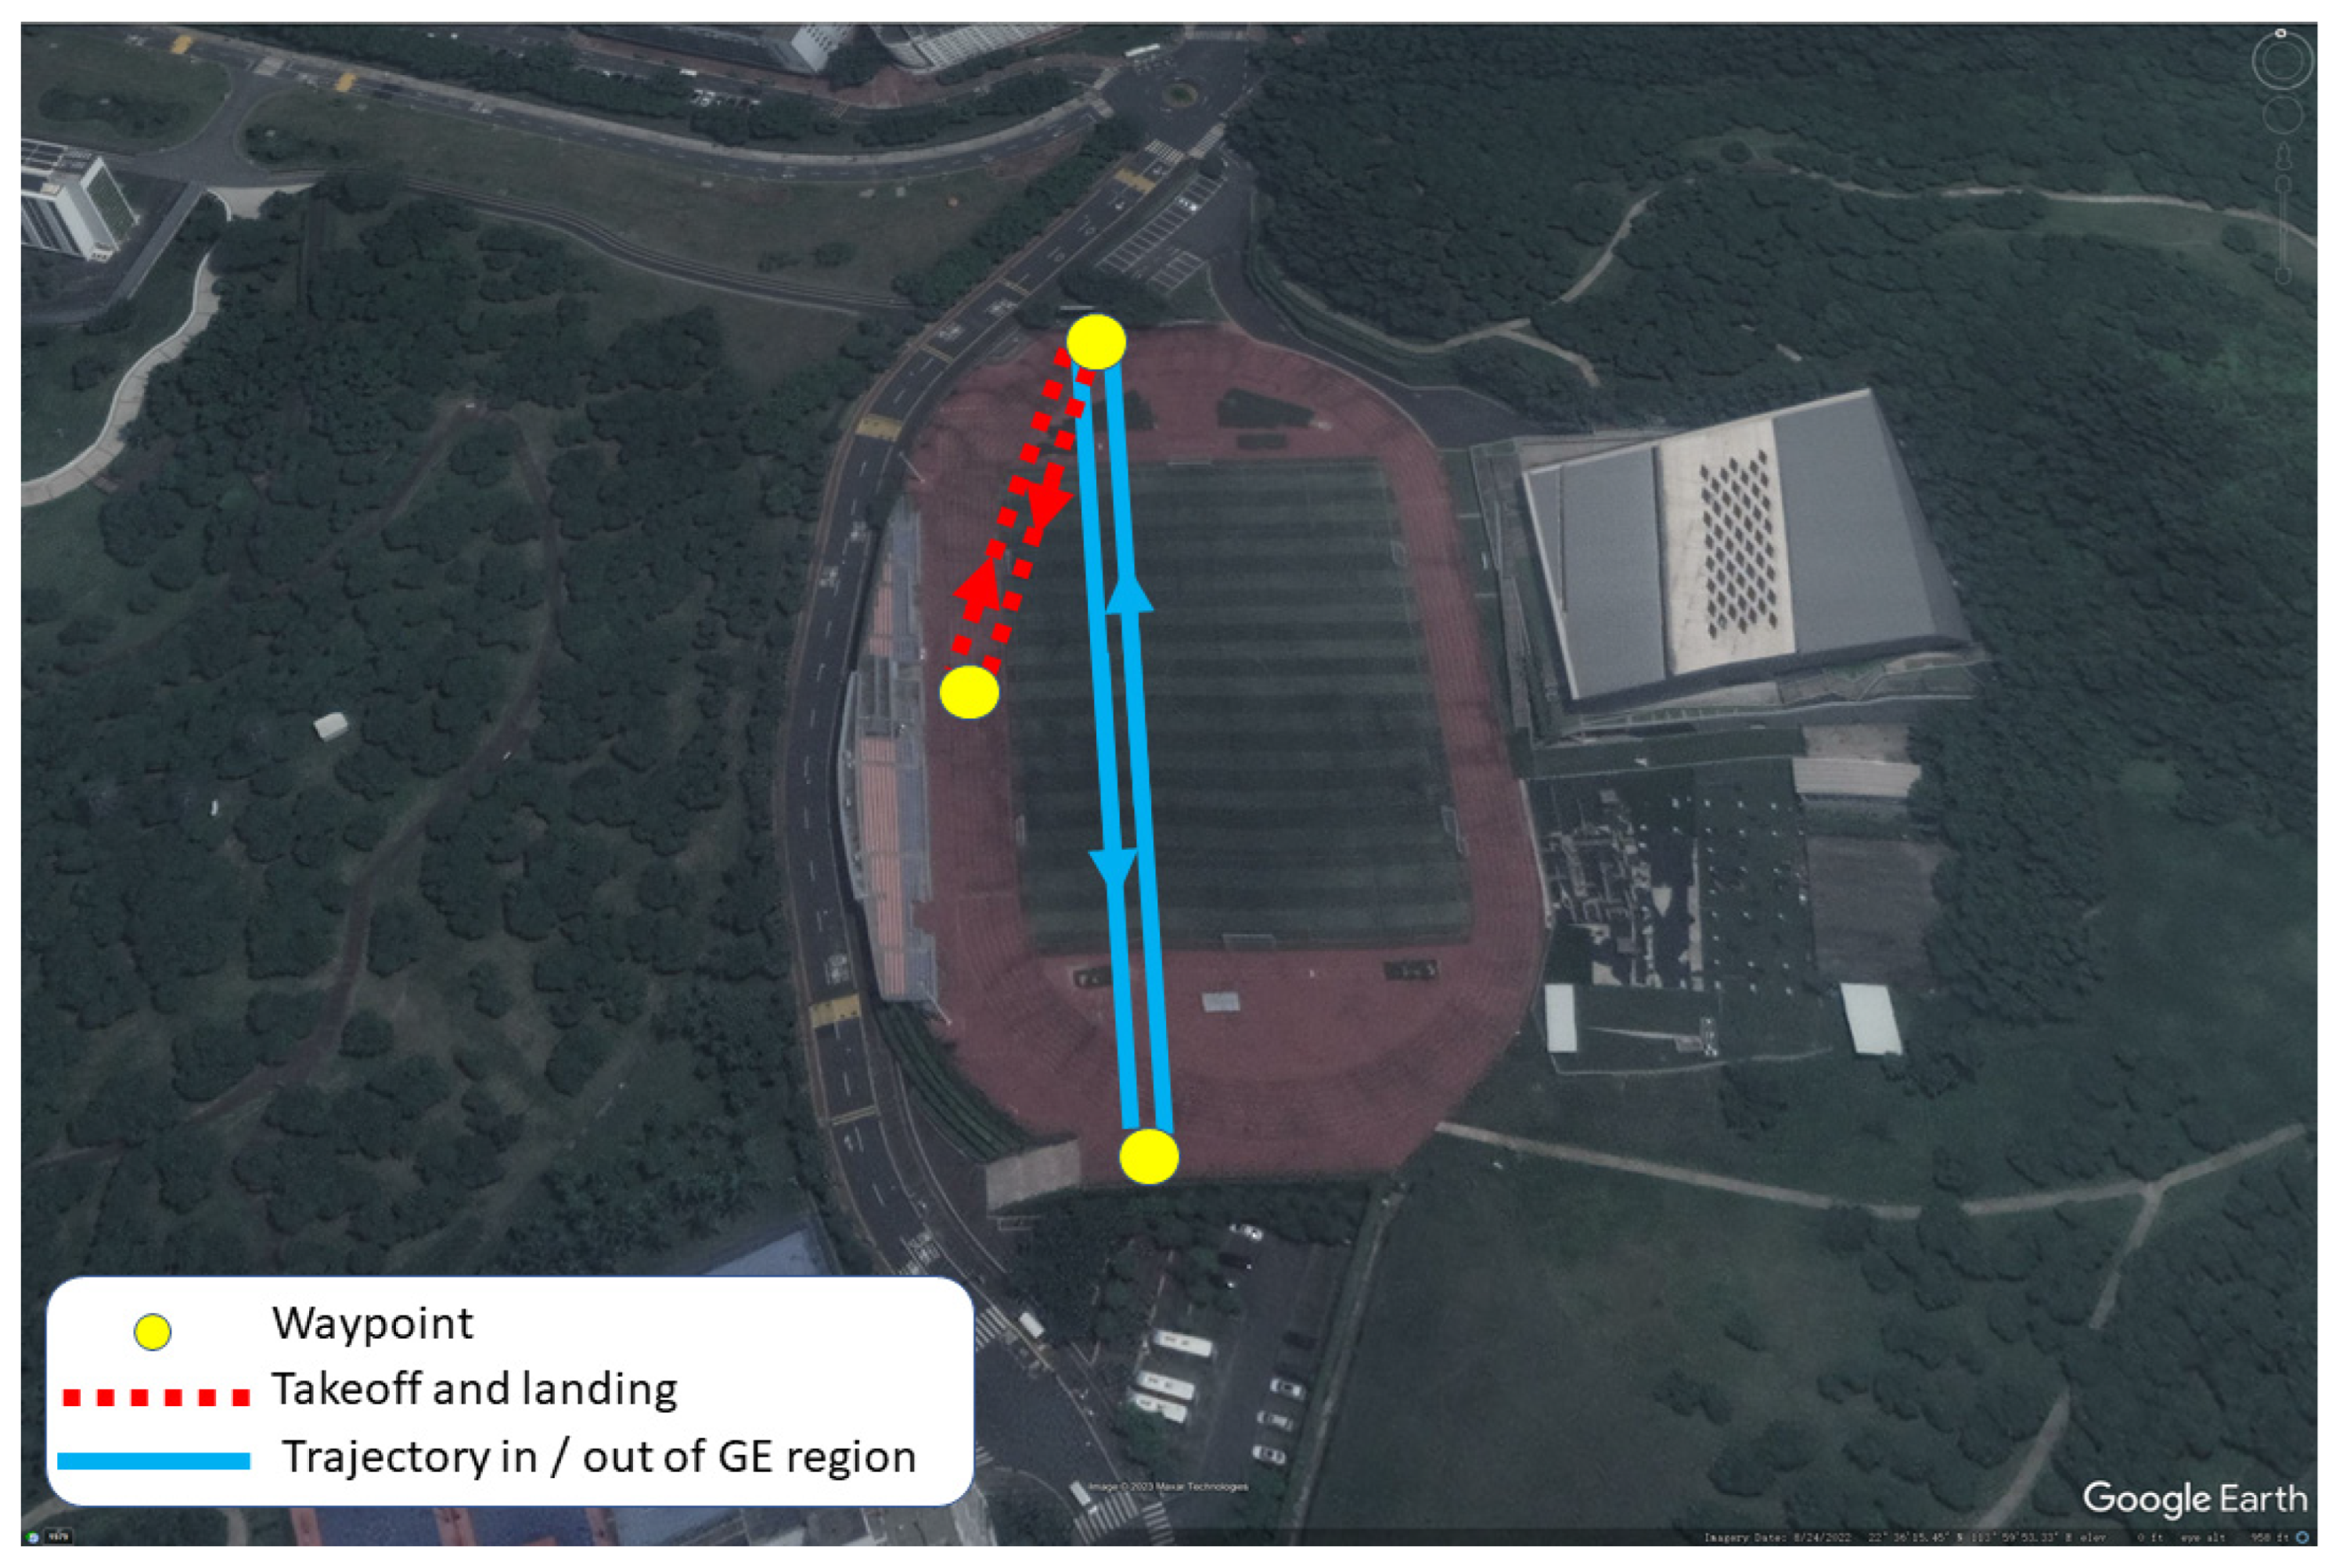
2.2.2. Flight Test Arrangement

The flight control system used during the experimental flight phase is based on the open-source PX4 platform and has been customized for this study. This system incorporates both manual control and autonomous navigation capabilities. The integrated navigation system, which includes a rangefinder, GPS, and IMU, enables the tri-tilt rotorcraft to autonomously execute various flight tasks, such as automatic takeoff and landing, trajectory tracking, and the recording of flight status for subsequent analysis.
The initial phase involves conducting control performance tests to verify the stability and controllability, particularly in the span-dominated ground-effect region ( H / b from 0.1 to 1).
The flight environment is depicted in Figure 8 using Google Maps. Experimental testing of the tri-tilt-rotor UAV will be conducted at various ground clearances with specific pitch angles. To ensure rigorous quantitative analysis, all experiments will be carried out under light wind conditions. Subsequently, flight test data, including IMU, GNSS, altitude, attitude, voltage, and current, will be recorded for detailed analysis.

3. Results and Discussion

3.1. Ground-Effect Visualization

Figure 9 illustrates the effects of wingtip vortices at various heights during the flow visualization experiment. At a flight height of H / b = 0.5 , a substantial vortex forms at the wingtip, gradually moving downward and expanding progressively over time. At H / b = 0.3 , the vortices appear more concentrated, with no significant enlargement. As time progresses, the vortex center slowly moves downward and outward. At a flight height of H / b = 0.1 , significant changes in wingtip vortices are observed compared to other heights. Following the vortex formation, it rapidly disperses outward, dissipating more quickly than at the previous two heights. The dynamic evolution of wingtip vortices in ground effect can be observed in Video S1 in Supplementary Materials. In the span-dominated ground-effect region, the ground effect causes the wingtip vortices to expand outward, thereby increasing the effective wingspan of the UAV. A larger aspect ratio results in increased lift. Additionally, the ground boundary effectively restrains the development of vortices, reducing induced downwash and, consequently, increasing the effective angle of attack while decreasing induced drag.

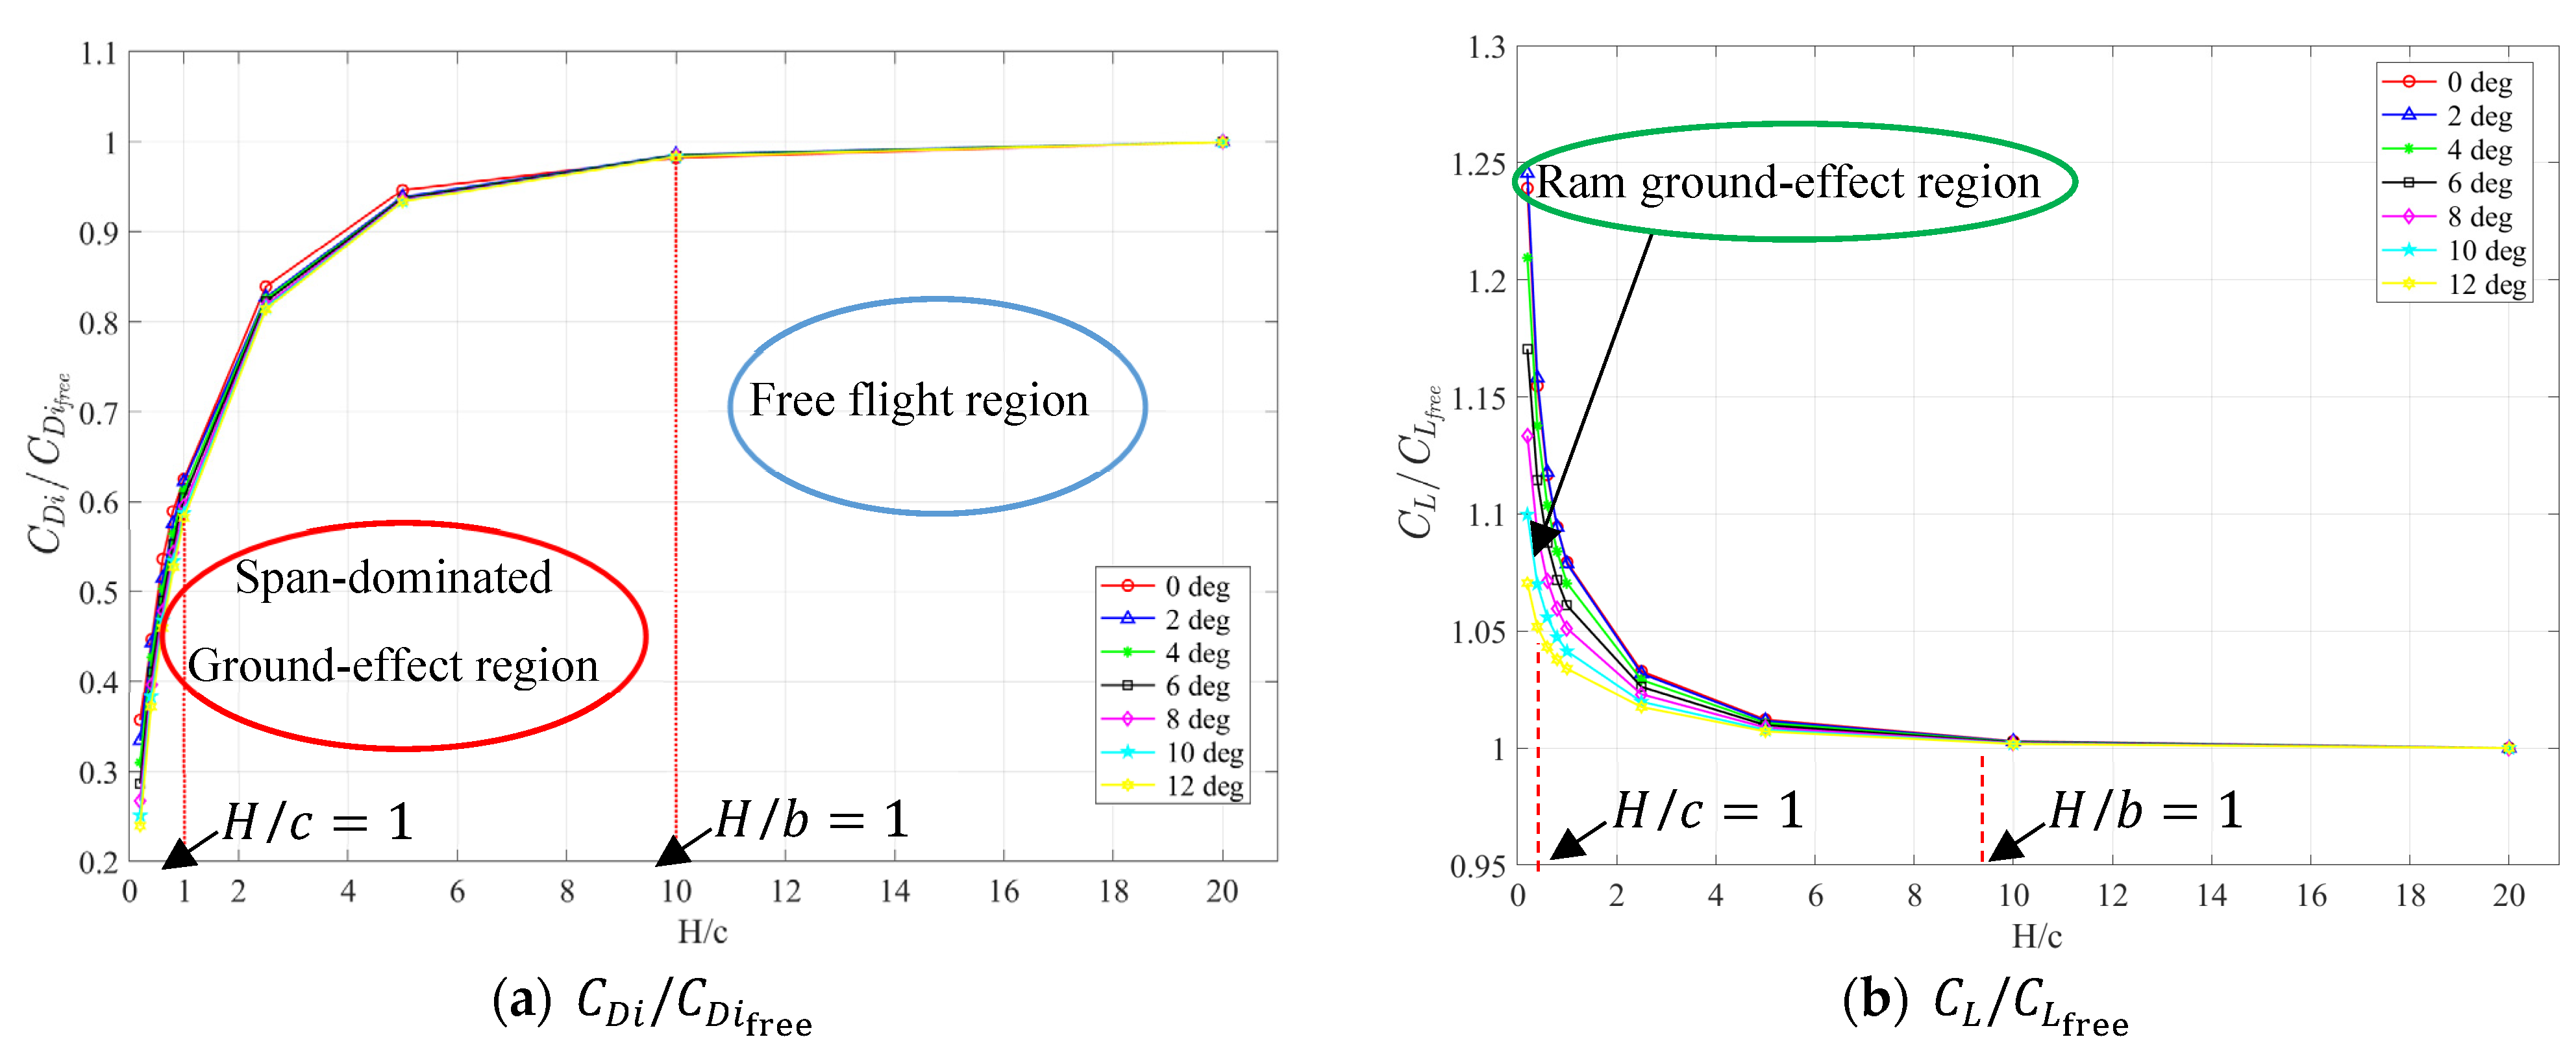
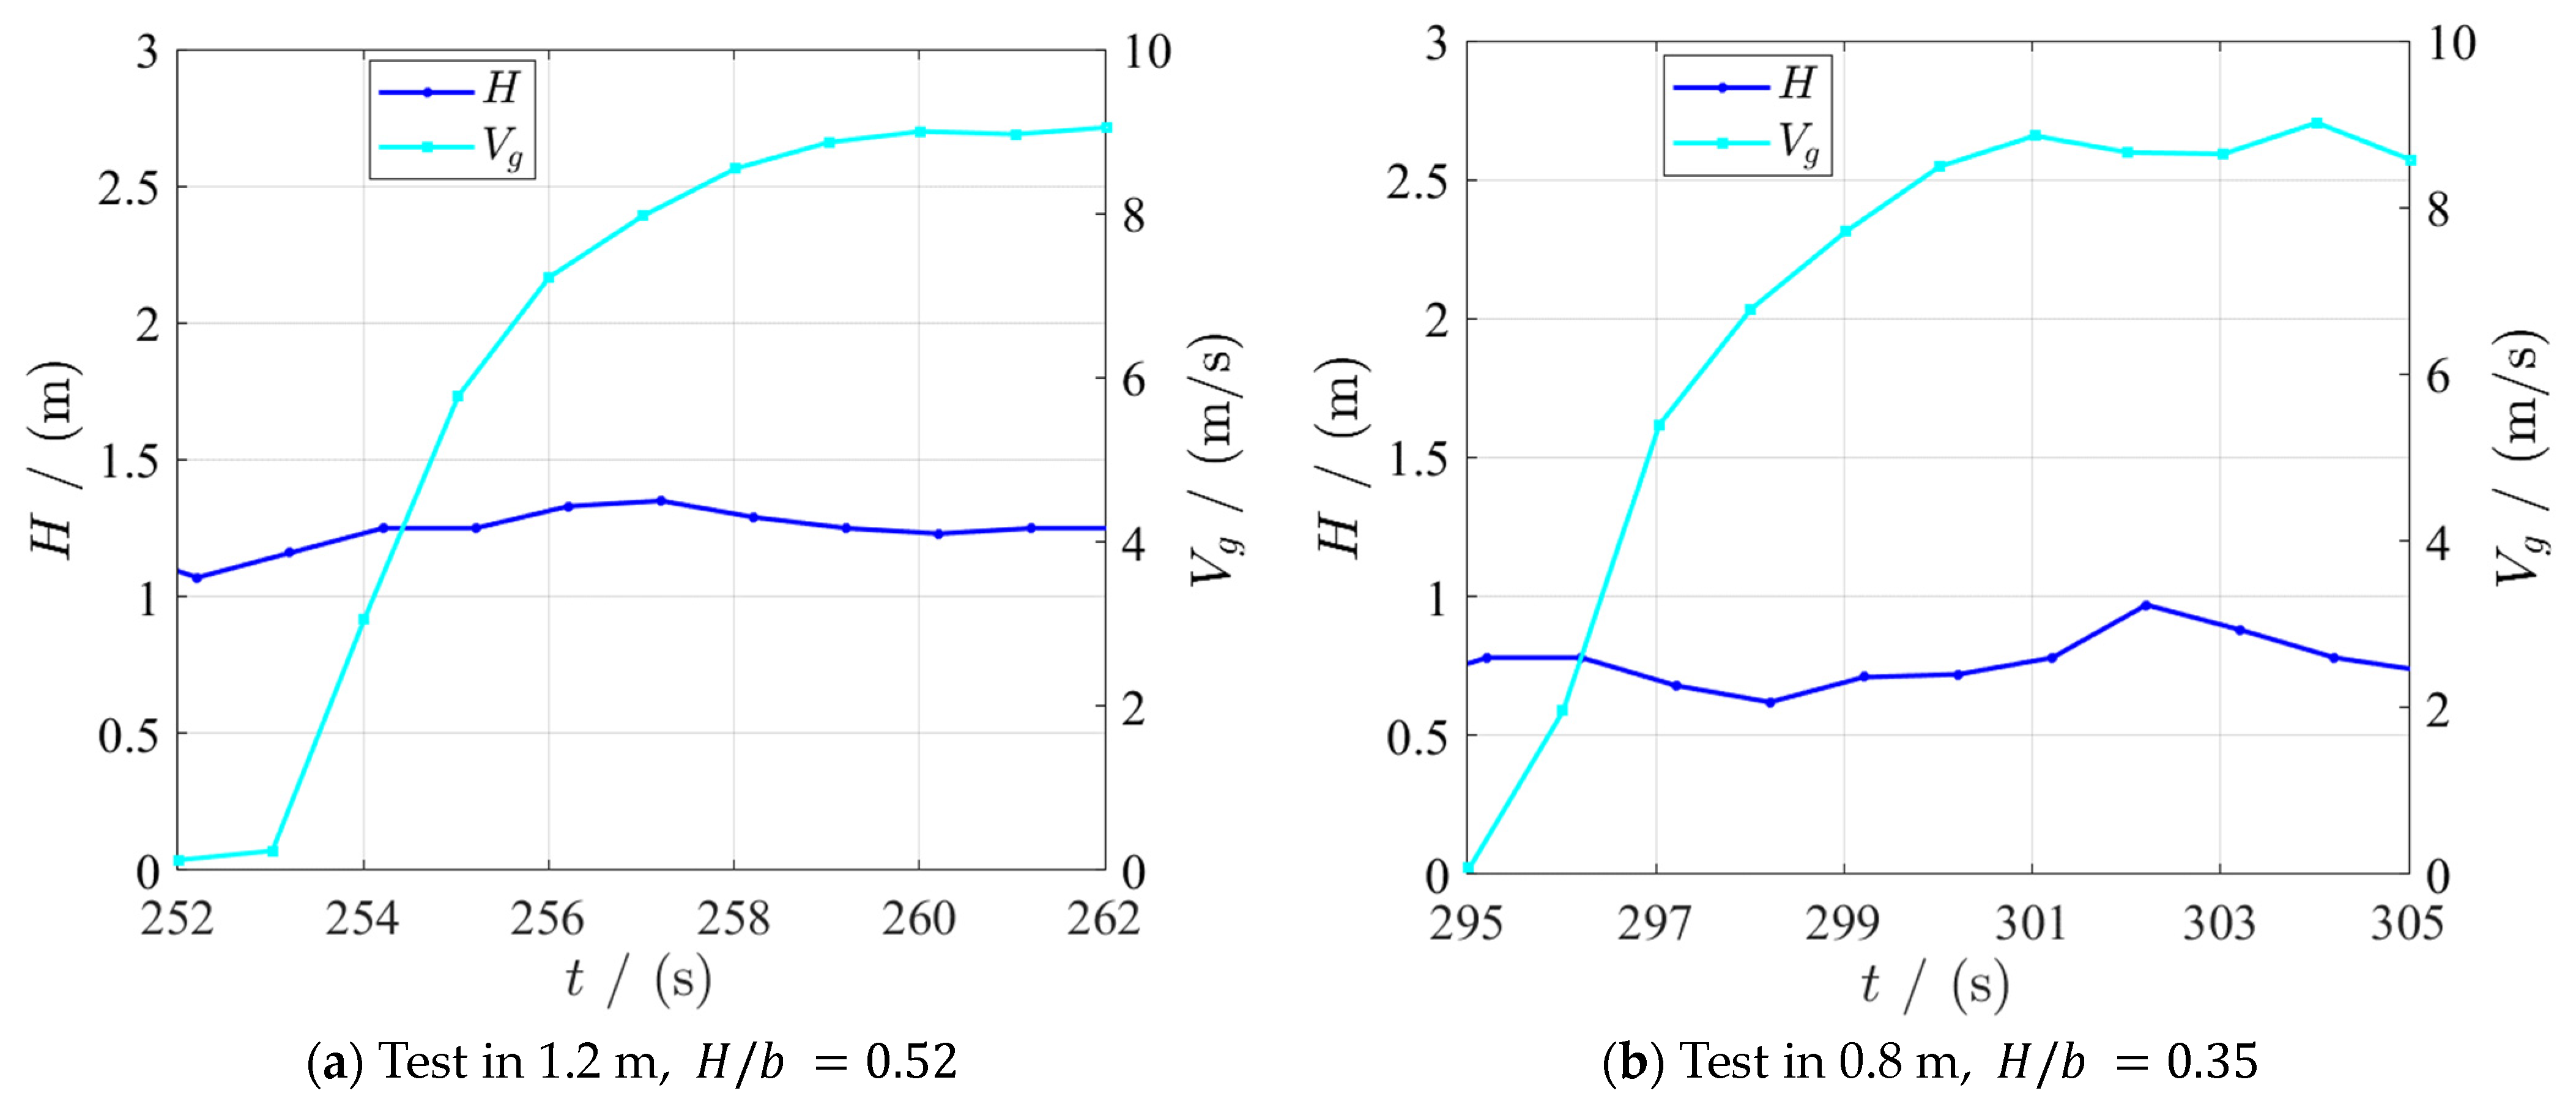
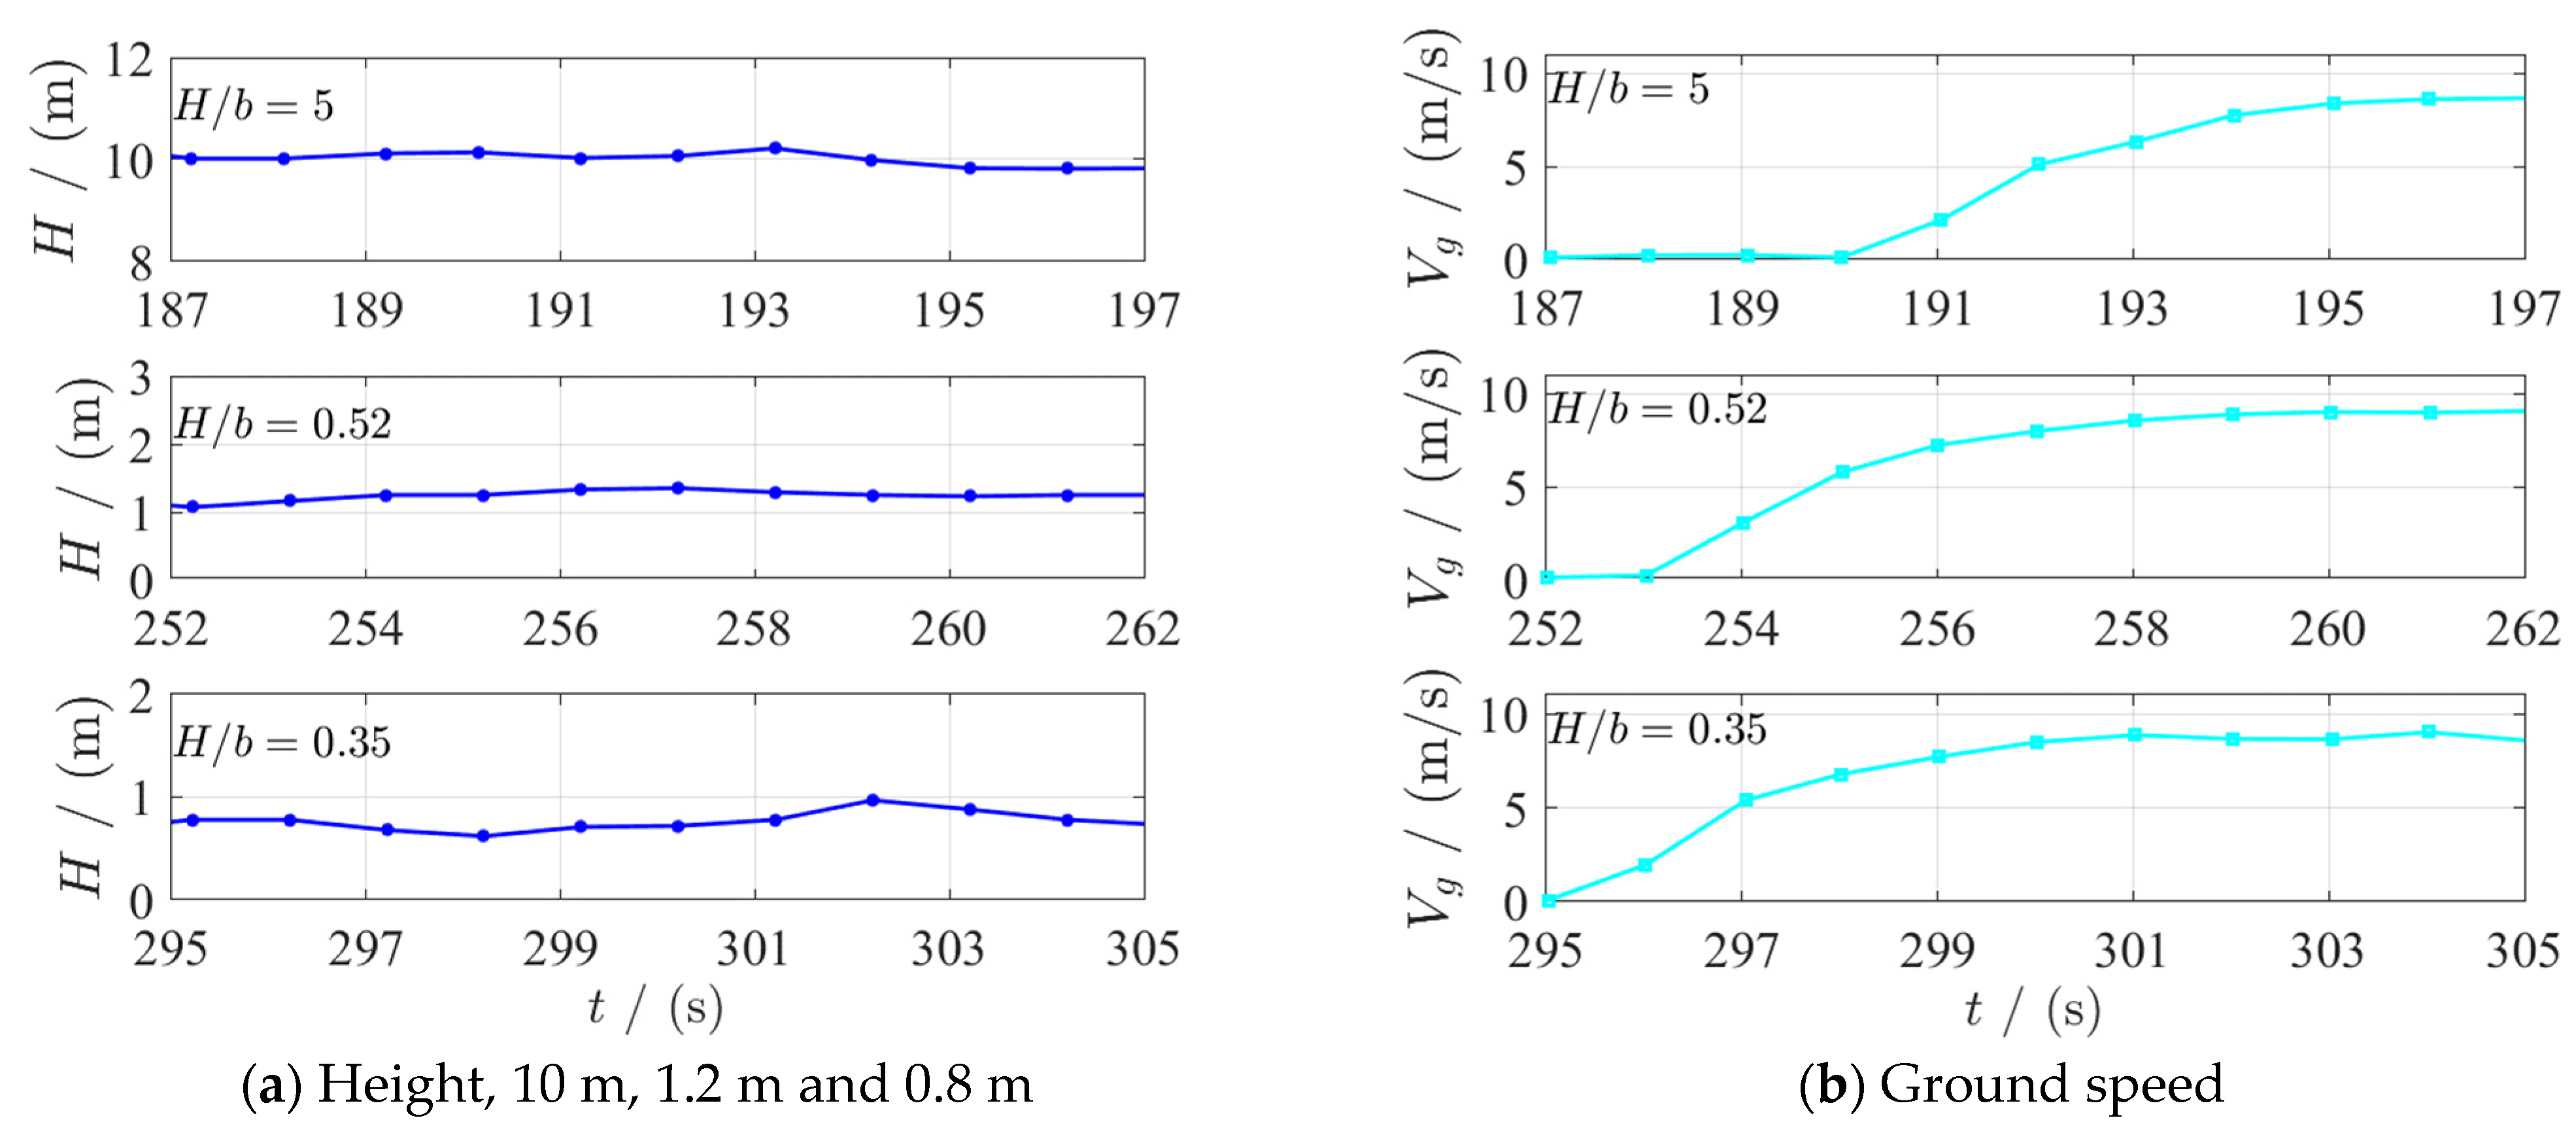
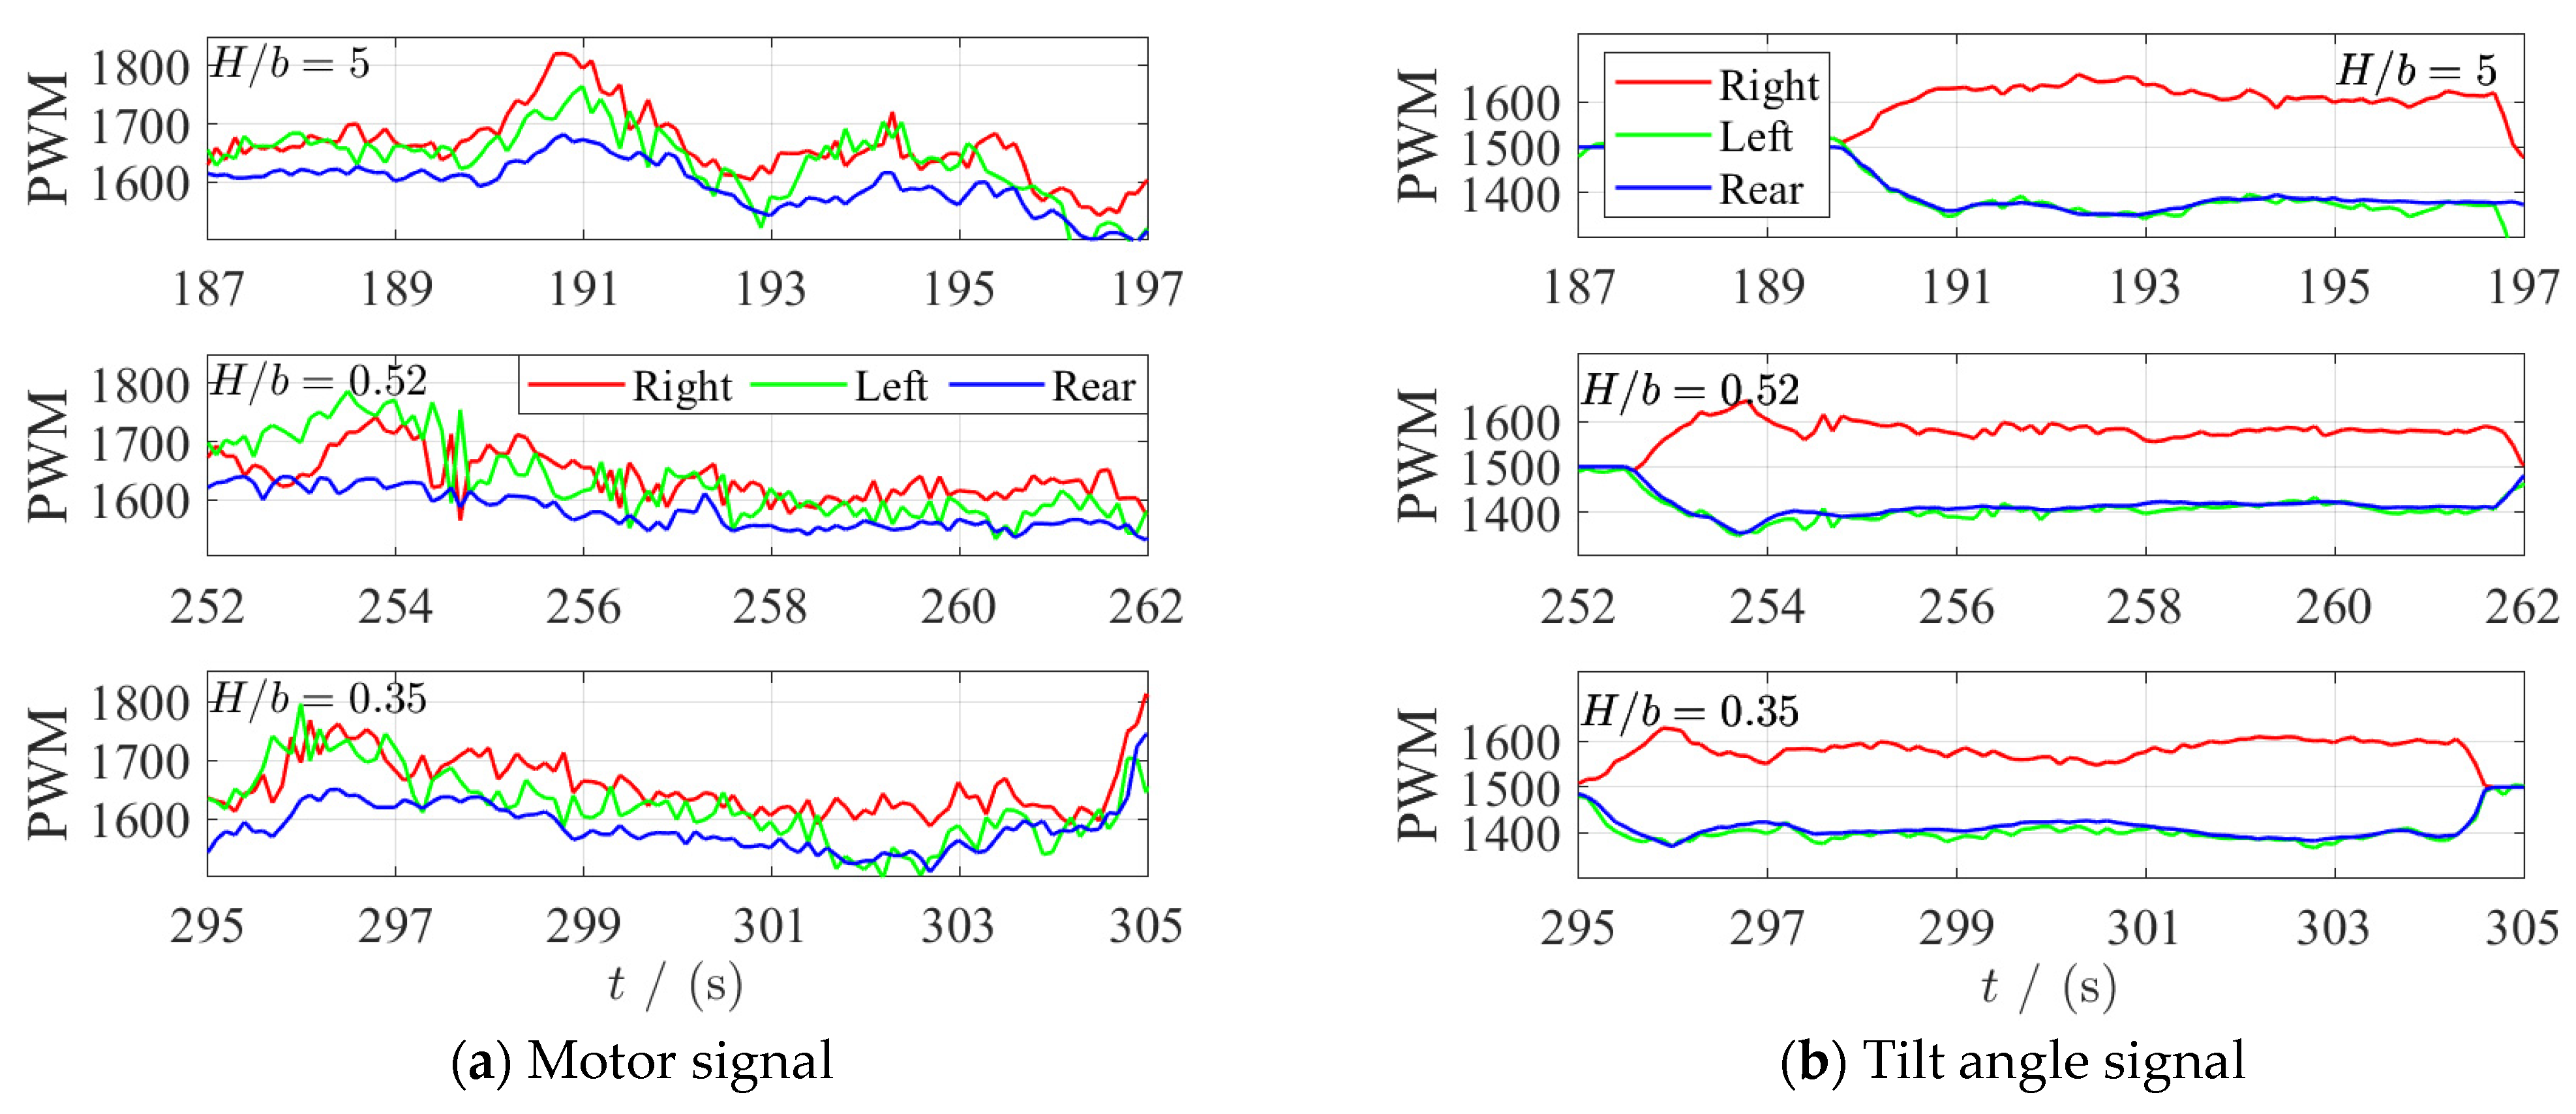
3.2. Flight Performance

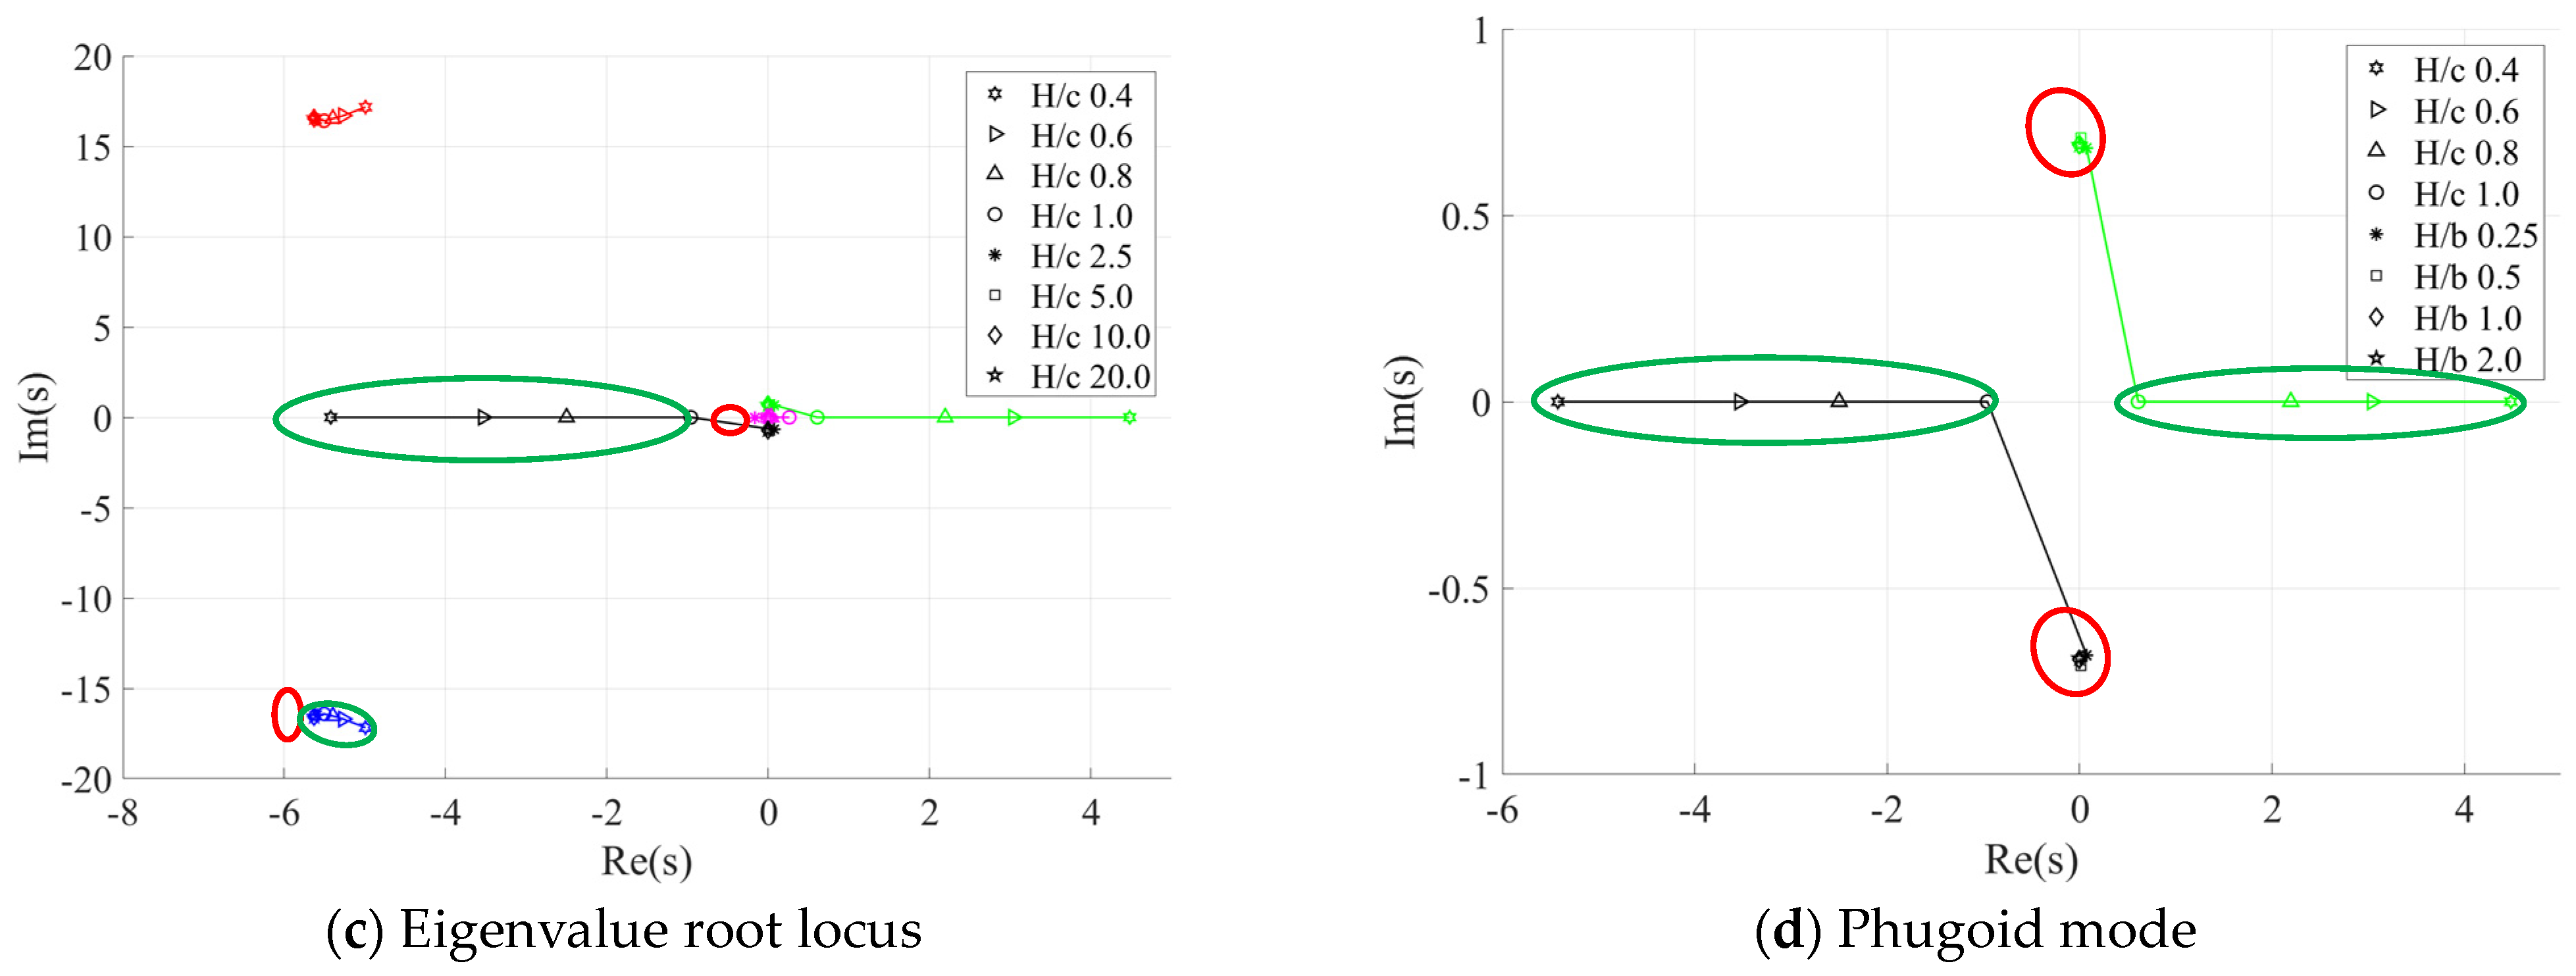
3.2.1. Flight Stability and Control

A preliminary control performance test is conducted to verify the stability and controllability of Egretta30, establishing the foundation for subsequent flight performance evaluations in the ground-effect region.
During the performance test, the flight airspeed is intentionally kept below 15 m/s, with the additional aerodynamic forces and torques generated by the lifting wing treated as external disturbances. Egretta30 is equipped with a flight controller that allows independent control of position and attitude, showing excellent performance in stability flight tests. Figure 10 illustrates the desired and actual attitude angles in the roll and pitch directions during the stability test. The flight scenario involves a horizontal round-trip straight flight with a 180-degree yaw angle steering maneuver, incorporating perturbations in the roll and pitch directions. The attitude angles are accurately tracked.
Figure 11 shows the effect of Egretta30’s height control in the ground-effect region. During the height control test, Egretta30 transitions quickly from a hovering state to straight and level flight, reaching a maximum speed of 9.05 m/s. It then transitions back into level flight following a 180-degree yaw turn. The altitudes for the two level flights were 1.2 m ( H / b = 0.52 ) and 0.8 m ( H / b = 0.35 ). Throughout the two accelerated level flights, Egretta30 maintains a stable altitude, demonstrating the robustness of altitude control in the ground-effect region. The corresponding visual flight test for height control is provided in Video S2 in Supplementary Materials.

3.2.2. Energy Consumption Comparison

Figure 12, Figure 13, Figure 14 and Figure 15 provide comprehensive flight test data across various ground-effect regions, including altitude, ground speed, attitude, vector control signals, current, voltage, and associated power consumption. Egretta30 initiates linear flight from a hover at three different ground clearances—10 m, 1.2 m, and 0.8 m—representing free flight and span-dominated ground effect. The UAV undergoes controlled acceleration and deceleration before returning to a hover. At each altitude, the UAV consistently achieves a speed of 9 m/s, as shown in Figure 12. During straight flight in the ground-effect region, the independent control logic for attitude and position maintains roll, pitch, and yaw angles at 0 degrees, as depicted in Figure 13. The vector actuation mechanism operates based on control allocation signals. During horizontal flight in ground effect, each of the three tilt mechanisms independently controls the directional forces (depicted as Pulse Width Modulation (PWM) signals in Figure 14b), while the thrust output to the motors decreases (shown as PWM signals in Figure 14a), ensuring stability in flight.
As shown in Figure 15, during forward flight at a constant speed of 9 m/s, the average current decreases by 27.88%, from 62.05 A to 44.75 A, as the flight altitude transitions from the free-flight region to the ground-effect region. Correspondingly, the associated power consumption witnesses a 32.25% reduction, decreasing from 1386.66 W to 953.34 W. Detailed numerical values are provided in Table 3. This analysis highlights a significant improvement in UAV efficiency during straight flight in the span-dominated ground-effect region while maintaining flight stability. According to previous studies on rotor ground-effect performance, the influence of ground effect becomes significantly weaker when the height-to-rotor radius ratio, Z / R , exceeds 1.5, with the thrust ratio T I G E / T dropping below 1.05 [29,30]. While Z / R is greater than 2, the cushioning effect of the rotor is insignificant. In the height ranges relevant to the present flight tests (with a minimum Z / R of 4.5 at a flight altitude of 0.8 m and a rotor radius of 7 in), the aerodynamic influence of the ground boundary on rotor thrust performance is considered negligible. Thus, the observed drag reduction on the main wing leads to a significant improvement in UAV efficiency within the span-dominated ground-effect region. However, it is acknowledged that the complex interaction between the rotor slipstream and the main wing introduces some degree of coupling, particularly as the UAV operates closer to the ground. A more detailed experimental setup is needed in future work to investigate this interaction further.

4. Conclusions

This paper presents the design of a VTOL ground-effect UAV with vector motors. To evaluate the UAV’s flight stability and energy consumption performance both in and out of the ground-effect region, the control architecture employs a decoupled independent control strategy based on position and attitude control allocation.
(1) Smoke flow visualization experiments show that aerodynamic performance is significantly enhanced in the span-dominated ground-effect region, with faster dissipation of vortices at lower ground clearance.
(2) The designed VTOL ground-effect UAV performs rapid take-offs and stable forward flights, demonstrating effective altitude control across various ground-effect regions.
(3) At equivalent flight speeds, the flight current in the span-dominated ground-effect region decreases by 27.88%, leading to a 31.25% reduction in total power consumption compared to conditions outside the ground effect. These findings indicate a substantial improvement in flight performance in ground effect.
The VTOL capability with a tilt-vector structure expands the application scenarios for ground-effect vehicles. The flight test data collected in the ground-effect region will aid in the optimized design of various ground-effect vehicles.

5. Patents

There are two patents resulting from the work reported in this manuscript.
  • A Wing-in-Ground (WIG) craft with precisely controllable flight altitude. Patent NO.: CN202220155446.1, China.
  • A high wind resistance control system and method based on vector control. Patent NO.: CN202121723944.3, China.

Supplementary Materials

The following supporting information can be downloaded at: https://www.mdpi.com/article/10.3390/drones8110625/s1, Video S1: Flow Visualization Test of WIG craft, Video S2: Egretta30 flight test in ground effect.

Author Contributions

Conceptualization, S.S., X.S. and H.W.; methodology, S.S. and H.W.; validation, S.S. and H.W.; formal analysis, S.S. and H.W.; investigation, S.S. and H.W.; data curation, S.S. and H.W.; writing—original draft preparation, S.S.; writing—review and editing, S.S. and H.W.; visualization, H.W.; supervision, X.S. and P.Y.; project administration, X.S. and P.Y.; funding acquisition, X.S., P.Y. and H.W. All authors have read and agreed to the published version of the manuscript.

Funding

This research was funded by the National Science and Technology Major Project of China grant number J2019-II-0006-0026, 2020B1212030001, and 2023B1212060001; the Department of Science and Technology of Guangdong Province grant number 2023B1212060001, 2020B1212030001, and 2019B121203001; and the Shenzhen Science and Technology Program, grant number KCXFZ20211020174803005 and SGDX20230116091648011.

Data Availability Statement

The data used in this analysis are not public but are available upon request.

Acknowledgments

The authors disclose receipt of the following financial support for the research of this paper: This study was supported by the National Science and Technology Major Project of China (J2019-II-0006-0026), the Department of Science and Technology of Guangdong Province (2023B1212060001, 2020B1212030001, 2019B121203001), and the Shenzhen Science and Technology Program (KCXFZ20211020174803005, SGDX20230116091648011). The authors thank Xizhi Qiu, Yan Zhou, and Yihan Mei, our indispensable pilots and ground crew, for their full support and dedication in the ground handling and flight test work.

Conflicts of Interest

The authors declare no conflicts of interest. The funders had no role in the design of the study; in the collection, analyses, or interpretation of data; in the writing of the manuscript; or in the decision to publish the results.

Nomenclature

a acceleration, m/s2
C D drag coefficient
C L lift coefficient
C m pitch moment coefficient
b wingspan, m
c mean chord length, m
gacceleration due to gravity, m/s2
H height, m
h dimensionless height of ground clearance, h
H / c
I current, A; specially moment of inertia in Σ M = I ( d H / d t )
K Kalman gain
L ,   M ,   N roll, pitch, and yaw moment, N·m
L projected length in x axis or y axis, refers to center of gravity, m
L z projected length in z axis, refers to center of gravity, m
mmass, kg
P power consumption, W
P D position of vehicle in down axis
p ,   q ,   r angular velocity about the x, y, and z axes, deg/s
Q quaternion
R position
s reference area, m2
T thrust, N
t ^ torque, N·m
U voltage, V
u , v , w velocity components along the x, y, and z axis, m/s
V velocity, m/s
W weight, N
y ˜ innovation of height, m
α angle of attack, deg
ϕ ,   θ ,   φ Euler angle, deg
ζ tilt angle of motor, deg
ρ density, kg/m3
I x ,   I x ,   I z moment of inertia, kg·m2

References

  1. Rozhdestvensky, K. Ekranoplans-The GEMs of fast water transport. Int. Marit. Technol. 1997, 109, 47–74. [Google Scholar]
  2. Rozhdestvensky, K.V. Wing-in-Ground Effect Vehicles. Prog. Aerosp. Sci. 2006, 42, 211–283. [Google Scholar] [CrossRef]
  3. Qu, Q.; Agarwal, R.K. Chord-dominated Ground-effect Aerodynamics of Fixed-wing UAVs. In Advanced UAV Aerodynamics, Flight Stability and Control; Wiley: Hoboken, NJ, USA, 2017; pp. 201–254. [Google Scholar]
  4. Shi, X.; Qu, Q.; Liu, P.; Hu, T.; Xun, Y.; Bu, C.; Chen, H. Feasibility analysis of fixed plates in chord-dominated dynamic ground effect wind tunnel experiment. Aerosp. Sci. Technol. 2023, 137, 108262. [Google Scholar] [CrossRef]
  5. Abramowski, T. Numerical investigation of airfoil in ground proximity. J. Theor. Appl. Mech. 2007, 45, 425–436. [Google Scholar]
  6. Yang, W.; Yang, Z. Numerical simulation on span-dominated ground effect of 3D wing in ground effect. Comput. Aided Eng. 2008, 17, 13–17. [Google Scholar]
  7. Tofa, M.M.; Maimun, A.; Ahmed, Y.M.; Jamei, S.; Priyanto, A.; Rahimuddin. Experimental investigation of a wing-in-ground effect craft. Sci. World J. 2014, 2014, 489308. [Google Scholar] [CrossRef]
  8. Zerihan, J.; Zhang, X. Aerodynamics of a Single Element Wing in Ground Effect. J. Aircr. 2000, 37, 1058–1064. [Google Scholar] [CrossRef]
  9. Tumse, S.; Karasu, I.; Sahin, B. Experimental Investigation of Ground Effect on the Vortical Flow Structure of a 40° Swept Delta Wing. J. Aerosp. Eng. 2022, 35, 04022055. [Google Scholar] [CrossRef]
  10. Shirsath, R.A.; Mukherjee, R. Experimental Investigations of the Aerodynamic Characteristics of a Finite Rectangular Wing in Ground Effect. In Proceedings of the AIAA SCITECH 2022 Forum, San Diego, CA, USA, 3–7 January 2022. [Google Scholar]
  11. Lee, T.; Lin, G. Review of experimental investigations of wings in ground effect at low Reynolds numbers. Front. Aerosp. Eng. 2022, 1, 975158. [Google Scholar] [CrossRef]
  12. Irodov, R. Criteria of longitudinal stability of ekranoplan. Uchenive Zaposki TSAGI 1970, 1, 63–74. [Google Scholar]
  13. Staufenbiel, R. Some Nonlinear Effects in Stability and Control of Wing-in-Ground Effect Vehicles. J. Aircr. 1978, 15, 541–544. [Google Scholar] [CrossRef]
  14. Staufenbiel, R.W.; Schlichting, U.-J. Stability of airplanes in ground effect. J. Aircr. 1988, 25, 289–294. [Google Scholar] [CrossRef]
  15. Yang, W.; Yang, Z.; Ying, C. Effects of design parameters on longitudinal static stability for WIG craft. Int. J. Aerodyn. 2010, 1, 97–113. [Google Scholar] [CrossRef]
  16. Lee, J.; Han, C.-s.; Bae, C.-H. Influence of wing configurations on aerodynamic characteristics of wings in ground effect. J. Aircr. 2010, 47, 1030–1040. [Google Scholar] [CrossRef]
  17. Yang, W.; Yang, Z. Schemed power-augmented flow for wing-in-ground effect craft in cruise. Chin. J. Aeronaut. 2011, 24, 119–126. [Google Scholar] [CrossRef]
  18. Chun, H.H.; Chang, C.H. Longitudinal stability and dynamic motions of a small passenger WIG craft. Ocean Eng. 2002, 29, 1145–1162. [Google Scholar] [CrossRef]
  19. Su, S.; Shan, X.; Yu, P.; Wang, H. The inherent stability characteristics of a Wing-in-Ground (WIG) craft in various ground effect regions. In Proceedings of the AIAA AVIATION 2022 Forum, San Diego, CA, USA, 3–7 January 2022; p. 3598. [Google Scholar]
  20. Wigetworks. AIRFISH 8. Available online: https://wigetworks.com/ (accessed on 1 December 2019).
  21. Regent. Viceroy. Available online: https://www.regentcraft.com/seagliders/viceroy (accessed on 1 December 2019).
  22. Yildiz, Y.; Unel, M.; Demirel, A.E. Nonlinear hierarchical control of a quad tilt-wing UAV: An adaptive control approach. Int. J. Adapt. Control Signal Process. 2017, 31, 1245–1264. [Google Scholar] [CrossRef]
  23. Apkarian, J. Pitch-decoupled VTOL/FW aircraft: First flights. In Proceedings of the 2017 Workshop on Research, Education and Development of Unmanned Aerial Systems (RED-UAS), Linköping, Sweden, 3–5 October 2017; pp. 258–263. [Google Scholar]
  24. Chen, C.; Zhang, J.; Zhang, D.; Shen, L. Control and flight test of a tilt-rotor unmanned aerial vehicle. Int. J. Adv. Robot. Syst. 2017, 14, 1729881416678141. [Google Scholar] [CrossRef]
  25. Hartmann, P.; Meyer, C.; Moormann, D. Unified Velocity Control and Flight State Transition of Unmanned Tilt-Wing Aircraft. J. Guid. Control Dyn. 2017, 40, 1348–1359. [Google Scholar] [CrossRef]
  26. Yayla, M.; Kutay, A.T.; Senipek, M.; Gungor, O. An Adaptive Flight Controller Design for a Tilt-Prop Fixed Wing UAV for All Flight Modes. In Proceedings of the AIAA Scitech 2020 Forum, Orlando, FL, USA, 6–10 January 2020. [Google Scholar]
  27. Bautista, J.A.; Osorio, A.; Lozano, R. Modeling and analysis of a tricopter/flying-wing convertible UAV with tilt-rotors. In Proceedings of the 2017 International Conference on Unmanned Aircraft Systems (ICUAS), Miami, FL, USA, 13–16 June 2017; pp. 672–681. [Google Scholar]
  28. PX4. PX4-ECL. Available online: https://github.com/PX4/PX4-ECL (accessed on 6 December 2020).
  29. He, X.; Leang, K.K. Quasi-Steady In-Ground-Effect Model for Single and Multirotor Aerial Vehicles. AIAA J. 2020, 58, 5318–5331. [Google Scholar] [CrossRef]
  30. Lin, H.-H.; Wu, S.-J.; Liu, T.-L.; Pan, K.-C. Construction of the Operating Limits Diagram for a Ship-Based Helicopter Using the Design of Experiments with Computational Intelligence Techniques. Int. J. Aeronaut. Space Sci. 2021, 22, 1–16. [Google Scholar] [CrossRef]
Figure 1. Aerodynamic performance and eigenvalue root locus distribution as a function of height [19].
Drones 08 00625 g001aDrones 08 00625 g001b
Figure 2. Egretta30 flight system.
Drones 08 00625 g002
Figure 3. Data transmission system.
Drones 08 00625 g003
Figure 4. Force analysis diagram.
Drones 08 00625 g004
Figure 5. Framework of the proposed controller.
Drones 08 00625 g005
Figure 6. Estimation and control of altitude [28].
Drones 08 00625 g006
Figure 7. The smoke generation device for flow visualization.
Drones 08 00625 g007
Figure 8. Reference trajectory for one flight test mission in the ground-effect region.
Drones 08 00625 g008
Figure 9. Flow visualization of the wingtip vortices at various ground-effect heights. The time points t1 and t2 represent the instances when the wingtip vortex is most pronounced and when it enters the dissipation phase, respectively.
Drones 08 00625 g009
Figure 10. Attitude tracking of flight stability test.
Drones 08 00625 g010
Figure 11. Altitude-holding test in span-dominated ground-effect regions.
Drones 08 00625 g011
Figure 12. Corresponding altitude holding and ground speed.
Drones 08 00625 g012
Figure 13. Attitude-tracking performance in various ground-effect regions.
Drones 08 00625 g013
Figure 14. Propulsive control inputs in various ground-effect regions.
Drones 08 00625 g014
Figure 15. Power consumption in various ground-effect regions.
Drones 08 00625 g015
Table 1. Basic parameters of Egretta30.
ParameterMagnitude
b2.3 m
AR12
c ¯ 0.2 m
Length1.17 m
Payload weight0.5 kg
MTOW4.5 kg
Table 2. The model and accuracy of the applied onboard sensors.
SN DescriptionModelAccuracy
1Barometer MS5611±1.5 mbar
2GNSSNEO V3±0.5–2 m
3Accelerometer and GyroscopeICM-20689±2%, ±2%
ICM-20602±1%, ±1%
BMI055±2%, ±2%
4MagnetometerIST8310±0.3 uT
5Range finderUS-D10.04 m
Table 3. Power consumption in and out of ground effect.
H (m) H / b V g (m/s) I ¯ (A) I % P ¯ (W) P %
1059.0562.05100%1386.66100%
1.20.529.0550.2580.98%1073.0677.38%
0.80.359.0244.7572.12%953.3468.75%
Disclaimer/Publisher’s Note: The statements, opinions and data contained in all publications are solely those of the individual author(s) and contributor(s) and not of MDPI and/or the editor(s). MDPI and/or the editor(s) disclaim responsibility for any injury to people or property resulting from any ideas, methods, instructions or products referred to in the content.

