Article

Multiple-Target Matching Algorithm for SAR and Visible Light Image Data Captured by Multiple Unmanned Aerial Vehicles

1
School of Software, Northwestern Polytechnical University, Xi’an 710072, China
2
Science and Technology on Complex System Control and Intelligent Agent Cooperation Laboratory, Beijing 100074, China
*
Author to whom correspondence should be addressed.
Drones 2024, 8(3), 83; https://doi.org/10.3390/drones8030083
Submission received: 8 January 2024 / Revised: 20 February 2024 / Accepted: 20 February 2024 / Published: 27 February 2024
(This article belongs to the Special Issue Intelligent Recognition and Detection for Unmanned Systems)

Abstract

:
Unmanned aerial vehicle (UAV) technology has witnessed widespread utilization in target surveillance activities. However, cooperative multiple UAVs for the identification of multiple targets poses a significant challenge due to the susceptibility of individual UAVs to false positive (FP) and false negative (FN) target detections. Specifically, the primary challenge addressed in this study stems from the weak discriminability of features in Synthetic Aperture Radar (SAR) imaging targets, leading to a high false alarm rate in SAR target detection. Additionally, the uncontrollable false alarm rate during electro-optical proximity detection results in an elevated false alarm rate as well. Consequently, a cumulative error propagation problem arises when SAR and electro-optical observations of the same target from different perspectives occur at different times. This paper delves into the target association problem within the realm of collaborative detection involving multiple unmanned aerial vehicles. We first propose an improved triplet loss function to effectively assess the similarity of targets detected by multiple UAVs, mitigating false positives and negatives. Then, a consistent discrimination algorithm is described for targets in multi-perspective scenarios using distributed computing. We established a multi-UAV multi-target detection database to alleviate training and validation issues for algorithms in this complex scenario. Our proposed method demonstrates a superior correlation performance compared to state-of-the-art networks.

1. Introduction

The development of deep learning technology has greatly improved the accuracy of multi-target recognition algorithms employed in a wide variety of fields, including public surveillance. Multi-target matching for multiple unmanned aerial vehicles (UAVs) has important applications in military, production, multimedia and other fields. However, surveillance algorithms in multi-target associations for multiple unmanned aerial vehicles (UAVs) are still subject to a number of deficiencies and still challenging. There still exist technical challenges, especially in the collaborative perception tasks between drone swarms and external sensors such as satellites. This is because it involves the mutual coordination of the two processes of multi-target detection and matching (as shown in Figure 1).
The process of multi-target matching for multiple UAVs can be considered a process of association or correlation, whereby the same targets in the images captured by a surveilling group of UAVs within a given environment are properly associated for all image data captured by the UAVs in the group. Most research focused on the multi-target correlation problem formulates the decision-making strategy of UAVs as a regional monitoring problem, in which the applied correlation objective function usually requires UAVs to reduce their target tracking error by covering all targets over a large monitoring area. It is generally possible for UAVs to track all targets over a large coverage area when the number of UAVs is less than the number of targets [1,2,3,4,5]. Moreover, the guidance target function applied in multi-target tracking usually seeks to minimize the uncertainty of the current observation of a target, which is represented according to information entropy. However, it is inevitable that some targets will not be observable by all UAVs at a given time [6,7,8,9,10]. Therefore, the possibility that some targets will not be detected by all UAVs in the area must be considered when constructing the correlation objective function. One way to address this possibility is to add a multiplier to the correlation objective function representing the detection probability. In addition, the multi-target association task involving multiple UAVs still suffers from a number of problems, including a reliable means of determining the occurrence of FP and FN target detections and a method for improving the consistency of multi-target association for multiple UAVs [11].
This paper investigates the target association problem in the context of collaborative detection involving multiple unmanned aerial vehicles (UAVs). The challenge of this problem lies in the weak discriminability of features for Synthetic Aperture Radar (SAR) imaging targets, leading to a high false alarm rate in SAR target detection. Compared to optical sensors, SAR sensors have a lower imaging quality. However, due to their ability to cover large areas, they often become a crucial means for detecting and searching for specific targets in designated regions of interest. Simultaneously, the uncontrollable false alarm rate during electro-optical proximity detection results in a high false alarm rate as well. Consequently, the cumulative error propagation problem arises when SAR and electro-optical observations of the same target from different perspectives occur at different times. This paper proposes a neural network-based approach to address the problems of multi-target association and tracking.
The main contributions include the following:
  • An improved triplet loss function was constructed to effectively assess the similarity of targets detected by multiple UAVs.
  • A consistency discrimination algorithm is proposed for targets from multiple perspectives based on distributed computing. On UAVs equipped with optical sensors, the algorithm utilizes optical image features and the relative relationships between targets to achieve consistency discrimination in scenarios with a high false alarm rate. On UAVs equipped with SAR sensors, the algorithm employs SAR-detected local situational information and optical image detection for consistency judgment, effectively achieving consistency judgment from a global perspective.
  • A multi-UAV multi-target detection database is established, and an open-source core code was developed, addressing the training and validation issues for algorithms in this scenario.

2. Related Work

2.1. Object Detection Algorithms

Object detection algorithms can be divided into single-stage and two-stage algorithms. Single-stage object detection algorithms are mainly divided into two types: anchor based and anchor free. Typical anchor-based algorithms include you only look once (YOLO) and single-shot detector (SSD). YOLO divides the input image into cells, and a bounding box prediction is performed for each cell [12,13,14,15]. Similarly, SSD predicts the confidence and offset of a set of anchor targets of different sizes using a Feature Pyramid Network (FPN) structure [16]. However, such anchor-based object detection algorithms require a reasonable anchor hyperparameter, which is often not suitable. Therefore, anchor-free object detection algorithms have been designed to avoid this issue by detecting objects through the prediction of key points instead of bounding boxes. Representative anchor-free models include CornerNet, CenterNet, FCOS, NanoDet, ExtremeNet, and TTFNet. In contrast to single-stage object detection algorithms, two-stage algorithms apply a region proposal network (RPN) for foreground–background classification [17,18,19,20,21,22]. The features extracted from the region of interest (ROI) proposed in the RPN are passed to a classification head to determine the class label, and to a regression head to determine the boundary box position [16]. A representative two-stage object detection algorithm employs a region-based convolutional neural network (R-CNN) [23]. This algorithm first selects regions that may contain targets through a candidate region generation method [24]. Then, a CNN is used to extract feature representations for each region. These features are input into a classifier to determine whether the target is included in an image, and input as well into a regression head to locate the target position accurately. Finally, the target detection results are obtained through post-processing steps. The fast-RCNN object detection algorithm improves the speed of the standard R-CNN algorithm by applying a CNN to extract the features of the entire image directly, and then applying an ROI pooling layer to obtain the features corresponding to the proposed region of the image [25]. However, the real-time performance is still not ideal. In contrast, ThunderNet has achieved a two-stage object detection algorithm with real-time performance using an efficient RPN and a small backbone network [26]. However, not all algorithms can directly adapt to multi-target recognition tasks in UAV scenarios. Considering this, we combined existing modules suitable for UAV scenarios to obtain a multi-target recognition model suitable for this scenario.

2.2. Data Association for Multi-Target and Multi-Camera Tracking

Multi-target and multi-camera tracking (MTMCT) technology can be mainly divided into two categories: correlation clustering and sliding time window schemes. Correlation clustering calculates the correlation of features between different detected targets, and then produces clusters of these correlations for data association. For example, correlations in target appearance and motion have been combined to improve the data association effect. The sliding time window technique performs data association within a relatively small range associated with a window of time, while utilizing a priori knowledge that the probability of the continuous occurrence of targets within the time window considered is higher [27]. First, the bounding boxes detected over the time window are connected to form tracklets [28,29]. Then, these tracklets are associated into target trajectories for each individual camera using a shorter sliding window. Finally, a longer sliding window is applied to match these target trajectories across different cameras. For UAV scenarios, SAR data related to the target can generally be obtained. This study used SAR data and image data to jointly address the target association task and propose a more accurate UAV target association model [30].

3. Proposed Algorithm

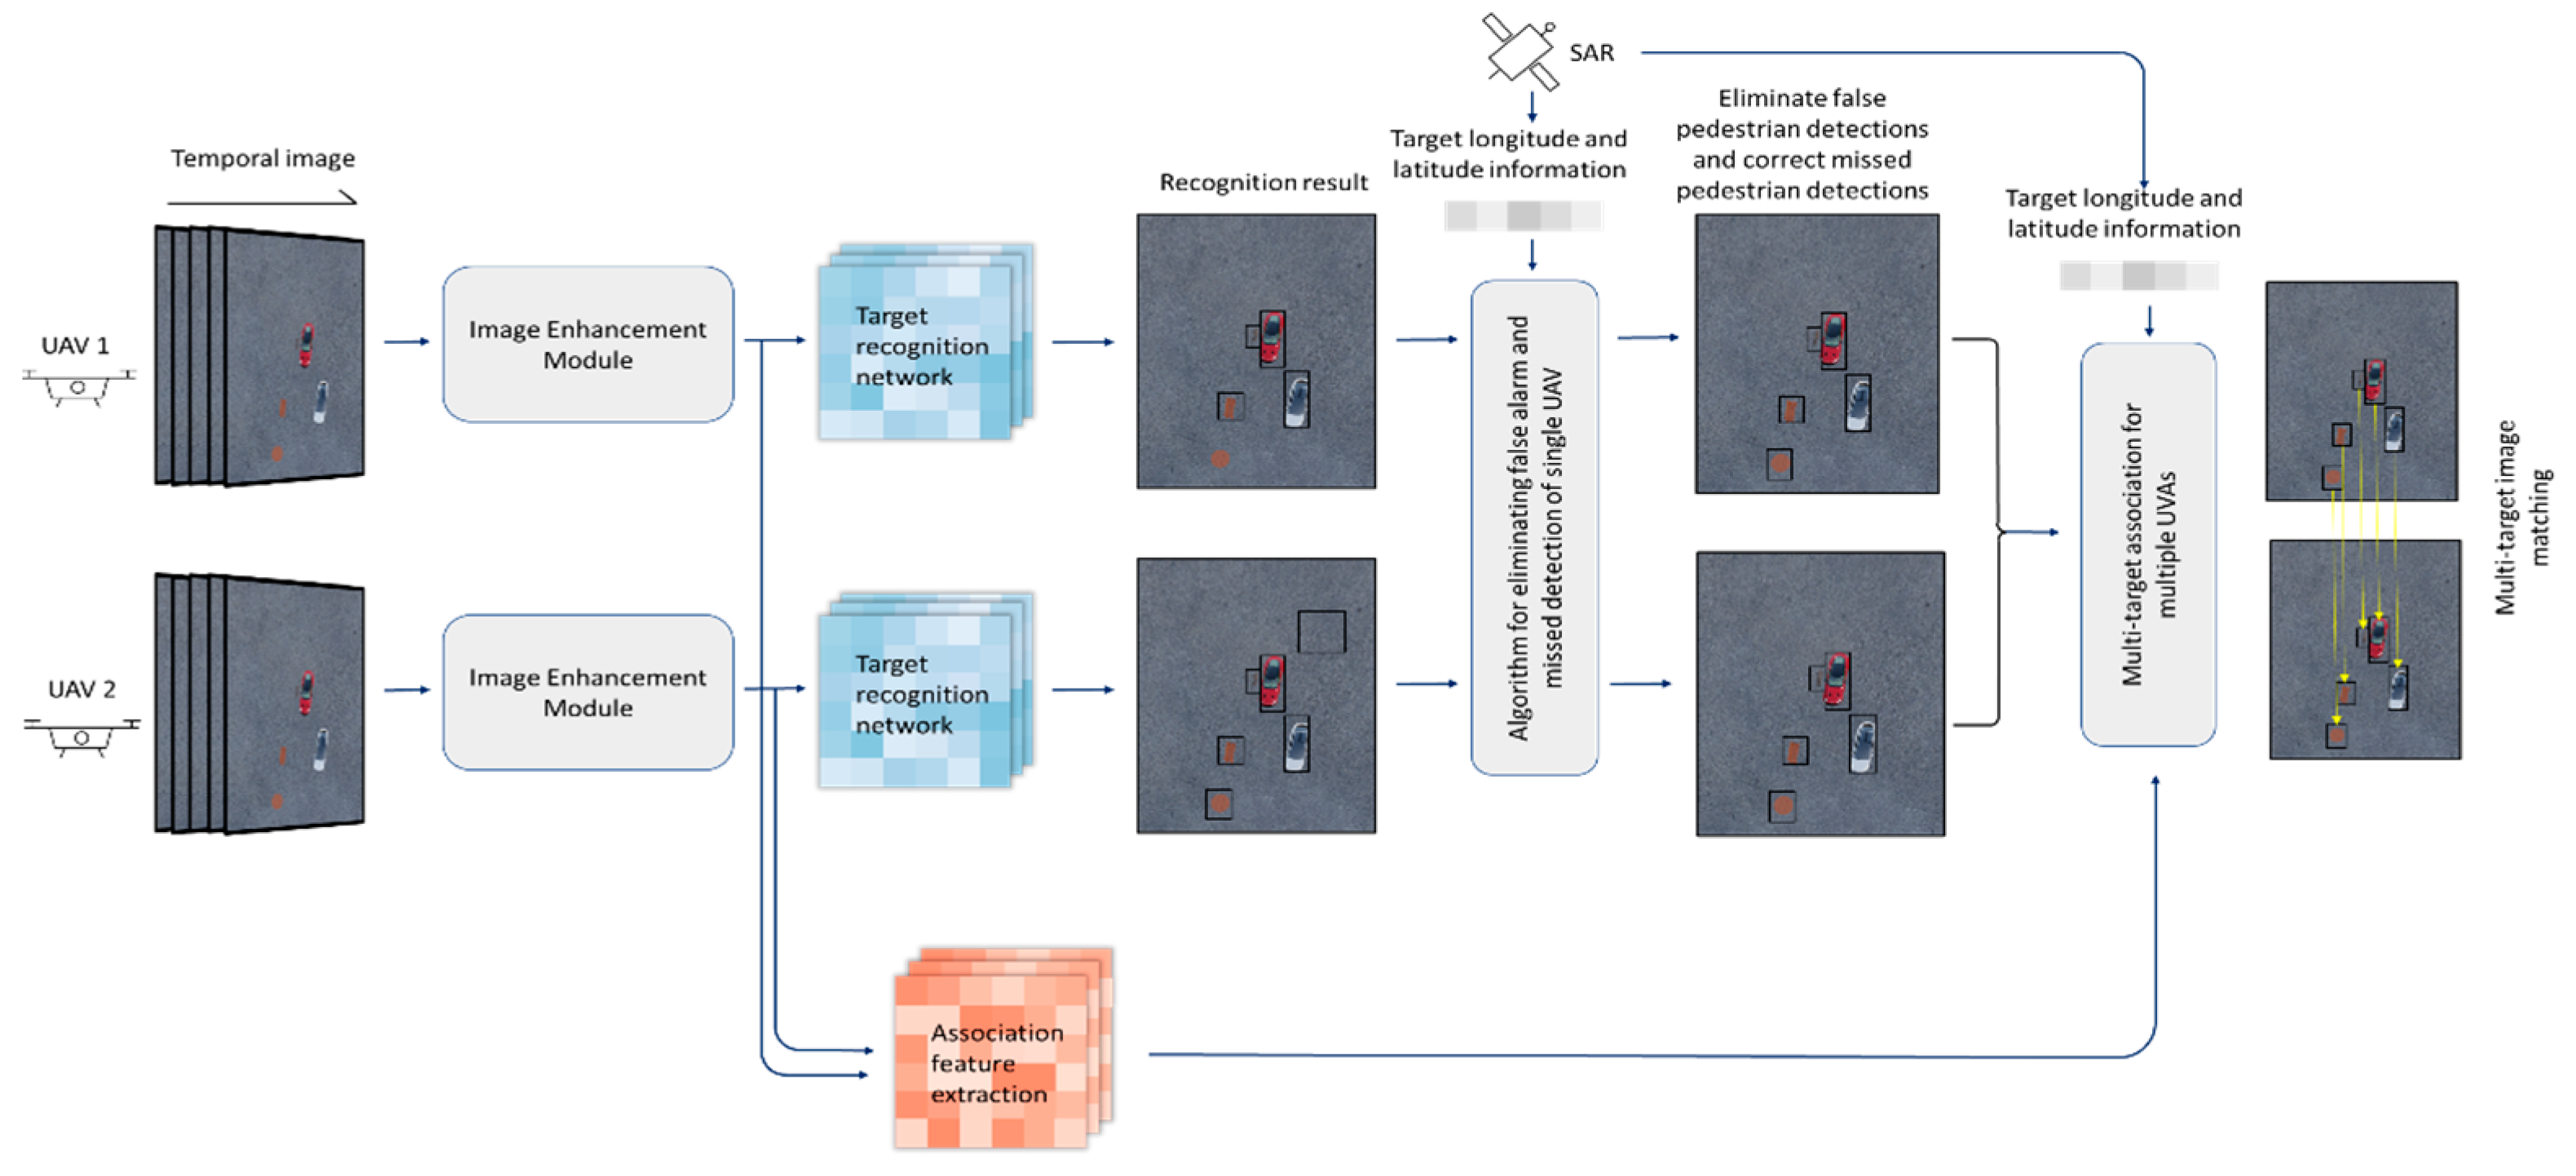
The overall multi-target association scheme proposed in this paper is illustrated in Figure 2 for two UAVs denoted as UAV 1 and UAV 2. In detail, the scheme is mainly composed of five components, including image enhancement modules and target recognition networks for the image data captured by individual UAVs, an association feature extraction network, an algorithm for eliminating false pedestrian detections and correcting missed pedestrian detections for the image data captured by individual UAVs, and an algorithm facilitating the multi-target matching of multiple UAVs.

3.1. Image Enhancement

The image enhancement module employed in the present work based on the MIRNet model is illustrated in Figure 3. As can be seen, the main body of the module consists of dual attention units (DAUs) composed of p multi-scale residual blocks (MRBs), where each MRB is mainly composed of a kernel selection feature fusion module, a dual attention unit, and a residual adjustment module. For a given image, the network first extracts its low-level feature, which is then applied to obtain deep features through N recursive residual groups (RRGs), where a cyclic residual group consists of two convolutional layers and P multi-scale residual blocks (MRB). The feature is convolved once to obtain the residual image, and the original image I is combined with R to obtain the final enhanced image. The network structure also allows information exchange across parallel streams via selective kernel feature fusion (SKFF), which helps to consolidate high-resolution features using low-resolution features, and vice versa.

3.2. Target Recognition

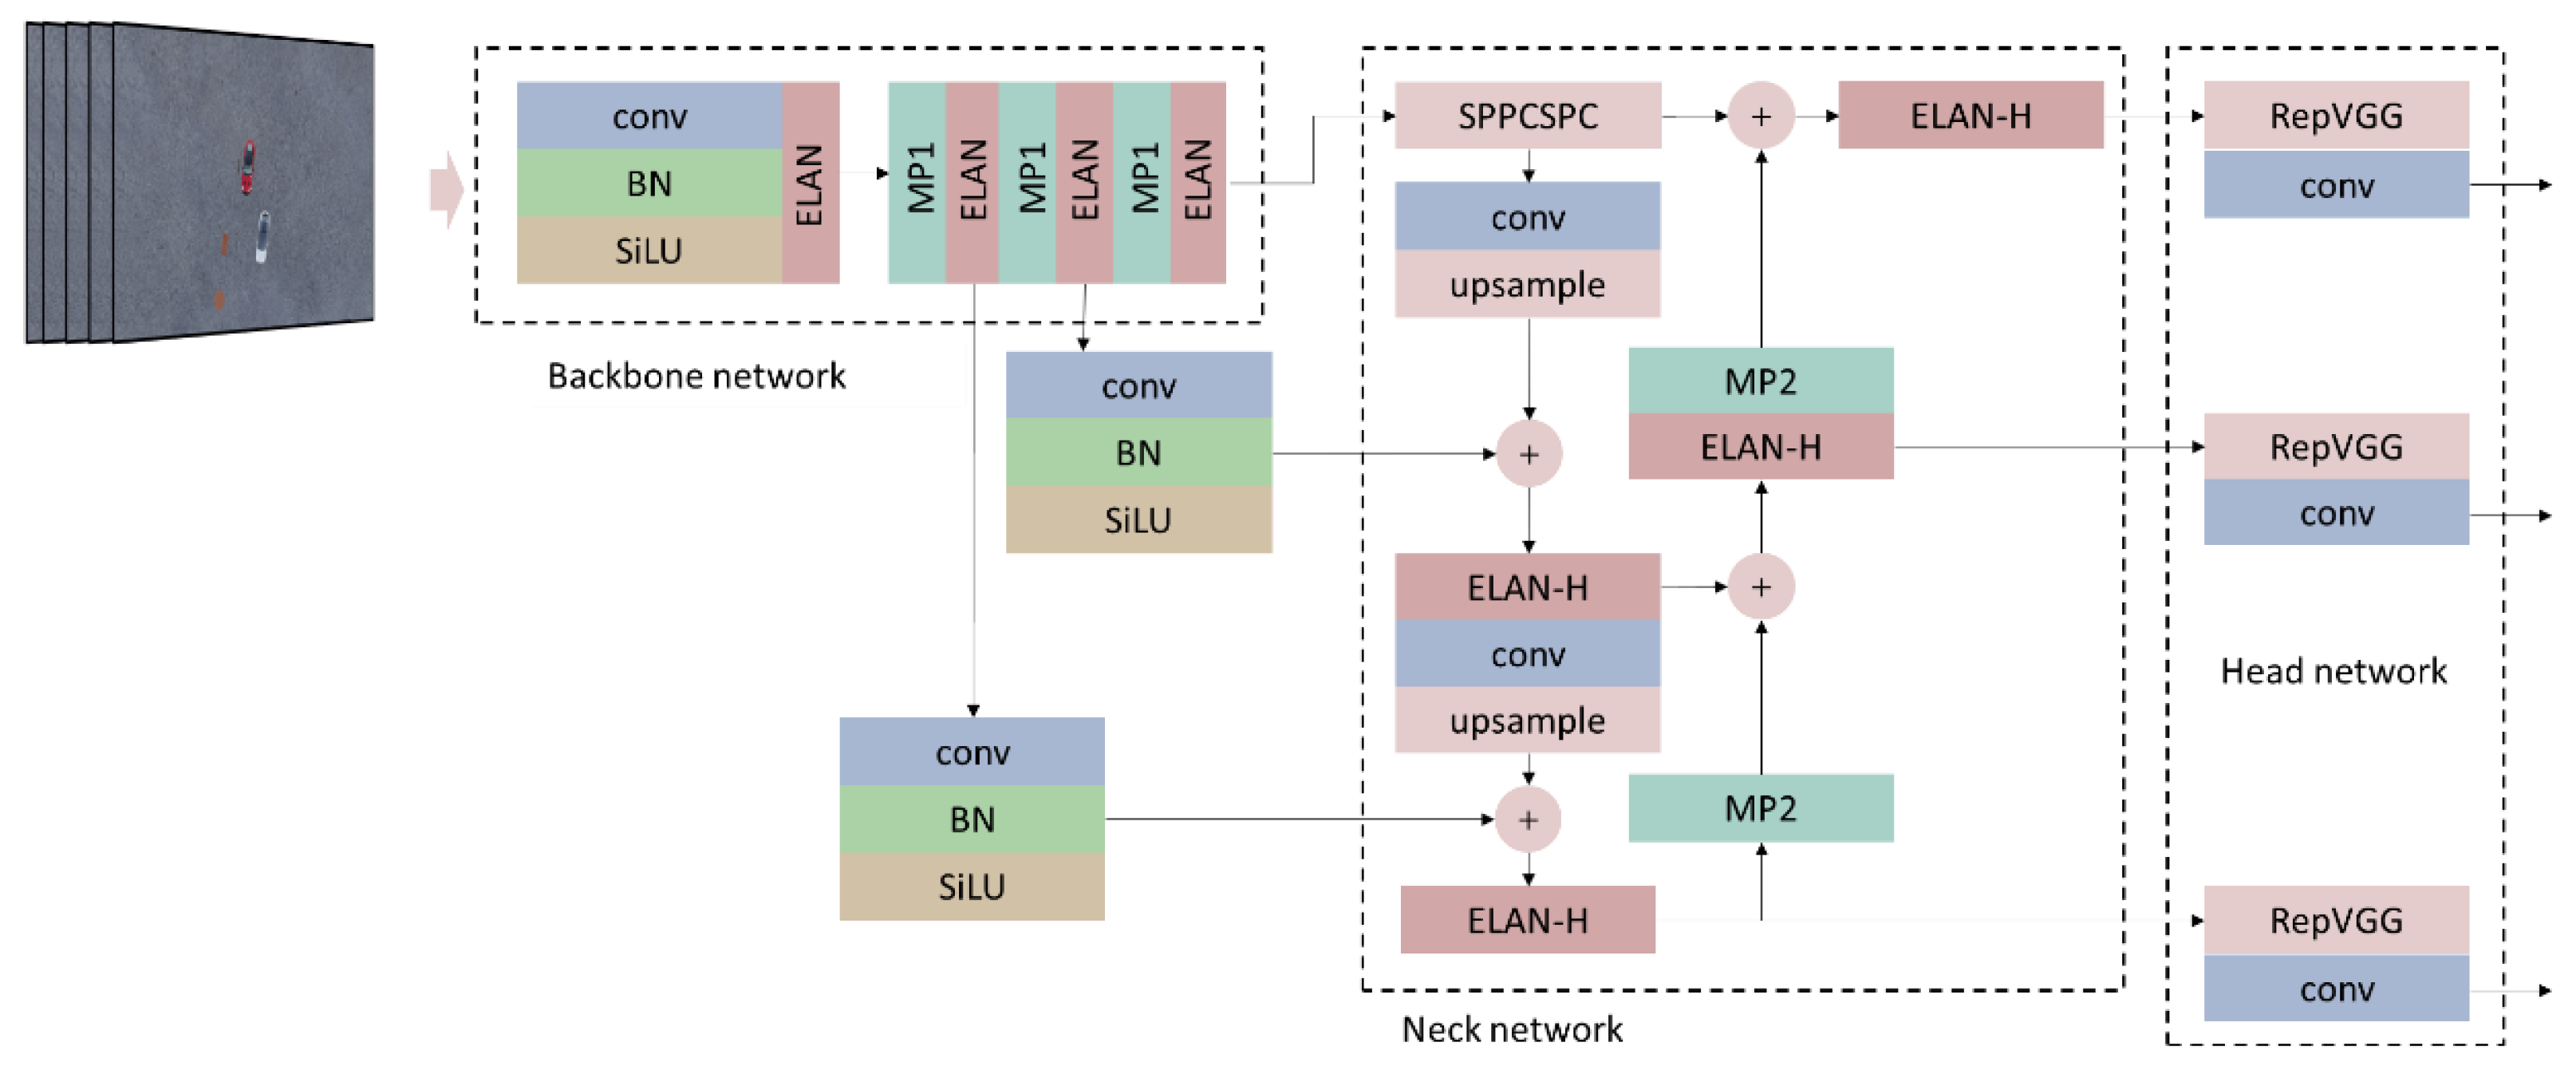
The overall target recognition network architecture is illustrated in Figure 4, and it is composed of a backbone network, neck network, and head network. The backbone network is applied for extracting features from the images. Here, ResNet-50 and Darknet-53 CNN-based architectures are typically employed for feature extraction. The neck network resides between the backbone network and the head network, and it is applied for extracting features with more complex targets or strong semantic information. The head network is mainly used to make predictions regarding the type and location of targets using the features extracted from the backbone and neck networks.

3.2.1. Backbone Network

The present work applied the new CSP-Darknet-53 architecture as a backbone network for feature extraction [31]. The standard CONV-BN-SiLU network unit is composed of a convolution (CONV) operation with convolution kernel sizes that were mostly 3 × 3 and 1 × 1, the batch normalization (BN) process, and a sigmoid weighted linear unit (SiLU) activation function. The CONV operation can reduce the number of model parameters and improve the training speed to some extent. The BN process can avoid overfitting the network model during training, prevent gradient explosion and gradient disappearance, and accelerate the convergence speed. The SiLU function is computed as SiLU(x) = x·sigmoid(x). Unlike the linear rectifier unit (ReLU) function and other commonly used activation functions, the SiLU function is not monotonically increasing. For x ≈ −1.28, the global minimum value of SiLU(x) is about −0.28. The most positive feature of the SiLU activation function is that it is self-stable. The global minimum obtained during the training process under a zero-gradient condition acts as a flexible limit in the obtained network weights, and thereby inhibits the learning of a large number of weights. As can be seen in Figure 4, the CONV-BN-SiLU units are used in conjunction with efficient layer aggregation networks (ELANs) and maximum pooling (MP) layers, and the outputs are submitted to the neck network.

3.2.2. Neck Network

While the sizes of input images have no effect on the parameters of the convolution layers, they do affect the parameters of the fully connected layers because these layers must be connected to all pixels in an input image. Therefore, the fixed length constraint was applied to the fully connected layers. Then, a spatial pyramid pooling (SPP) network, CSPnet, and a Conv-BN-LeakyReLU (SPPCSPC) structure were connected to the pyramid pooling layer of the backbone network. In this way, the network can accept input images of arbitrary sizes and generate a fixed-size output. The upsampling method applied in the neck network was nearest neighbor interpolation.
The present work applied an improved SPP network, denoted as the SPP fast (SPPF) network, which serializes the input through multiple 5 × 5 MP layers, where the calculation results obtained from two 5 × 5 MP layers in series are equivalent to those obtained from a single 9 × 9 MP layer. Similarly, the calculation results obtained from three 5 × 5 MP layers in series are equivalent to those obtained from a single 13 × 13 MP layer. Accordingly, the SPPF network involves fewer parameters, and can therefore provide greatly improved training and prediction speeds. The feature information is output to the head network after being remapped by the ELAN-Higher (ELAN-H) modules, which are an extension of the ELAN module with enhanced network learning capabilities.

3.2.3. Head Network

As can be seen, the outputs of the neck network are input into the RepVGG (REP) block, which is a VGG convolutional architecture applied in the head network. After passing through CONV operations, the head network outputs predictions based on the features extracted from the backbone and neck networks. Some recognition results are illustrated in Figure 2 as well.

3.3. Association Feature Extraction

The input images processed by the image enhancement module are also input into the association feature extraction network composed of a CNN architecture, which included standard components, such as a deep neural network for convolution calculation, MP downsampling layers, and BN processes. The loss functions applied during network training included triple loss, center loss, and category (instance) loss functions. However, the number of categories considered during testing is usually different from that considered during training because the feature vectors obtained prior to the last fully connected layer are used for prediction, and equivalent instances are determined by comparing the similarity of the corresponding feature vectors obtained for different images.

3.4. Matching Based on Individual UAVs

The different perspectives of different UAVs ensure that the number of actual targets detected by the different UAVs traversing a given area can also be different. Therefore, the present work matched the boundary boxes between the different frames of a target detected by a single UAV over time in accordance with the IoU evaluation metric. These matching results are then combined with geographical relationships to associate the target matched by an individual UAV over time with a global target. This local process for each individual UAV is summarized in Algorithm 1, and it is described in detail as follows.
We first build a global array M i to store all information N i t for a given target retained by the i-th UAV during its traversal of the monitoring area, which includes the geographical location of the target, its prediction category, category confidence, frame coordinates, number of consecutive frames, and the number of times the target is matched over some number of consecutive frames (i.e., the number of matches). The first frame in a set of consecutive frames is denoted as frame 1, and the number of matches for this target is initially set as 0. In addition, the information pertaining to a given target detected by the i-th UAV in each frame t ( t = 1 , 2 , 3 , ) is stored in another array N i t . When t = 1 , M i = N i 1 . For t > 1 , each frame is evaluated on whether the target border information stored in N i t is the same as that in M i based on the IoU calculated as follows:
I o U = A B A B ,
where A and B respectively correspond to the collection of border coordinates of the targets in N i t and M i . IoU stands for Intersection over Union. It is a key metric for assessing the reliability of object detection. A refers to the ground truth box, and B refers to the predicted box. The IoU value ranges from 0 to 1, where a higher IoU indicates greater reliability in object detection.
Target matching is based on the value of a threshold α according to the condition of IoU > α, where α was set herein as 0.6. Under a matching condition, the information of a given target in M i is updated by taking the target in M i with the largest calculated IoU value, adding 1 to the number of matches for the target, and then comparing the category confidence of the target in M i with the category confidence of the target in N i t . If the category confidence of the target in N i t is greater, the category, category confidence, border coordinates, and geographic location information of the target in M i is updated. Otherwise, the information pertaining to this target in M i is not updated. In contrast, under a condition of not matching when the IoU ≤ α, the target information in N i t is added to M i as an element.
This process is conducted for each target in M i . If the number of matches N m a t c h is greater than or equal to three in five consecutive frames, then the target is considered to be a real target, and its information is retained in M i . This process results in the collection of N real targets in M i . For each real target, we calculate the vector between this target and the remaining n targets in M i as the relative position relationship, and a total of n relative position relationships are obtained.
These relative position relationship results are compared with the corresponding points in the SAR data obtained for the area traversed by the UAVs. More specifically, we calculate the cosine similarity between these relative position relationships and the relative position relationships corresponding to the points in the SAR data. The cosine similarity S c o s between two vectors a and b is calculated as follows:
S c o s = a · b a b
We take the n targets with the largest cosine similarity and divide it by the number of remaining targets not including the target to be queried (i.e., n), which represents the cosine similarity between the current target and the target to be matched. Finally, the cosine similarity of all targets is obtained, and these values are employed to determine the occurrence of FP target detections.
To this end, if the cosine similarity of the relative position relationship between a target to be matched in the UAV image data and the corresponding target in the SAR data is less than a threshold value β, which was set as 0.8 in the present work, the target observed in the SAR data is considered a false detection. Otherwise, we find the target in the SAR data with the largest cosine similarity, take it as the final matching result of the target to be associated in the UAV data, and write its number and category into the final result of UAV target association (for example, A_2 is the second instance of object category A in the detection). If the number of matches is less than three in five consecutive frames, the target is considered a false target, and its pertinent information is removed from M i . If the number of matches is less than three but the number of consecutive frames of the target is less than five, we increment the consecutive frames by 1, and then use the same threshold and similarity calculation method in this new frame to determine whether the current target is retained.
Applying the above process to the targets detected by each UAV ensures that all legitimate target information is retained, and illegitimate information is avoided to the greatest extent possible.
Algorithm 1 Multi-target matching process for individual UAVs that eliminates false pedestrian detections and corrects missed pedestrian detections
1: Input: multi-target recognition images, and features extracted from the target recognition network and corresponding SAR data
2: Apply input to define a global array M i with all pertinent multi-target information
3: While not the last video frame captured by the i-th UAV
4: Define array N i t with information pertaining to a given target detected by the i-th UAV in each frame t (t = 1, 2, 3, …)
5: Calculate the IoU value of the target border information stored in N i t and the target border information stored in M i   s e p a r a t e l y according to Equation (1)
6: If IoU > α
7:   Take the largest calculated IoU value corresponding to the target in M i
8:   Increment N m a t c h for the corresponding target in M i by 1
9:  If the confidence of the target classification in M i is less than or equal to the corresponding confidence in N i t
10:    Update the target information in M i with the information in N i t
11: Else if IoUα
12:    Add target information in N i t   to   M i as an element
13: For each target in M i
14: If N m a t c h ≥ 3 in 5 consecutive frames
15:   Set this target as the subject of query
16:   Calculate the relative position relationships between this target and the remain-ing n targets in M i
17:   Compare these relative positions with the corresponding relative positions of the points in the SAR data based on the S c o s defined in Equation (2)
18:   If S c o s < β
19:    The target in SAR data is a false detection
20:   Else
21:    Find the target in the SAR data with the largest S c o s and use it as the final matching result of the target to be associated with the UAV image data
22: Else
23:   Remove the target from M i

3.5. Matching Based on Multiple UAVs

The different perspectives of UAVs ensure that the targets detected by different UAVs are subject to relative position relationships in space. These relative position relationships were employed in the present work to associate the targets detected by different UAVs with a single global target based on the features extracted from the association feature network and corresponding SAR data.
In terms of the system illustrated in Figure 2, the present discussion assumes that the monitoring system includes only UAV 1 and UAV 2, where the total number of targets detected by UAV 1 is n 1 , and the total number of targets detected by UAV 2 is n 2 . The proposed multi-target association algorithm for multiple UAVs is summarized in Algorithm 2. In detail, the possible values of n1 and n2 have some logical bearing on the target association process, which can be defined according to the following four conditions:
(1) When n 1 + n 1 ≤ 1, the relative position relationships cannot be matched because no relative position relationships can be obtained, and UAV target data cannot be associated with the targets in the SAR data.
(2) When n 1 = 1 and n 2 ≥ 1, we first calculate the correlation similarity S between the apparent features of all targets detected by UAV 1 and UAV 2. If S > α for the pair of targets detected by UAV 1 and UAV 2 with the largest value of S, the targets are assumed to match, and the category of the target is set according to the category with the greatest confidence among the two detection results. Then, the relative position relationships of the targets detected by UAV 2 are compared with the corresponding relative position relationships in the SAR data according to the following method, where it is assumed that n2 = 2 as an example.
We set the single target obtained by UAV 1 as the target to be queried and set its geographical location as ( x 1 , y 1 ). Similarly, we set the geographical locations of the two targets obtained by UAV 2 as ( x 2 , y 2 ) and ( x 3 , y 3 ). The relative position relationships can therefore be expressed as ( x 2 x 1 , y 2 y 1 ) and ( x 3 x 1 , y 3 y 1 ). The cosine similarity between these two relative positions and the relative position corresponding to the point of the SAR data is calculated, and it is denoted herein as S. We take the two targets with the largest cosine similarity and divide it by the number of remaining targets except the target to be queried (assumed to be 2 here), that is, the cosine similarity of the target corresponding to the target to be matched, and finally obtain the cosine similarity of the target. A false detection condition is again assessed by comparing the cosine similarity of the relative position relationship between the UAV target to be matched and the corresponding SAR target data with the threshold β. If the cosine similarity is less than or equal to β, the target in the SAR data is assumed to be a false detection. Otherwise, the matching is deemed successful, and the target in the SAR data with the largest cosine similarity is taken as the final matching result with the target to be associated in the UAV data. The corresponding number and position in the SAR data and the category obtained from the matching between the UAV and the UAV are written into the final UAV target association result.
(3) When n 1 > 1 and n 2 = 1, the condition is similar to that of the second case. Again, S is calculated for all targets detected by UAV 1 and UAV 2. If S > α for the pair of targets detected by UAV 1 and UAV 2 with the largest value of S, the targets are assumed to match, and the category of the target is set according to the category with the greatest confidence among the two detection results. However, under this condition, we set the single target obtained by UAV 2 as the target to be queried when establishing the relative position relationships and applying the cosine similarity to determine the matching condition, as discussed for condition (2) above.
(4) When n 1 > 1 and n 2 > 1, we first calculate the association similarity between the apparent features of all targets detected by UAV 1 and UAV 2, which yields a correlation similarity matrix A n 1 , n 2 of dimensions n 1 × n 2 . If the largest element in A n 1 , n 2 (i.e., A i , j = m a x { A i , * } ) is greater than a threshold γ (set as 0.8 herein), the two targets are assumed to match, and the category of the target is set according to the category with the greatest confidence among the two detection results.
However, a condition of A i , j ≤ γ requires additional processing. First, if A i , j < δ (set as 0.5 herein), the matching of the two targets is assumed to have failed, and the coordinate points are discarded. Otherwise, if δ ≥ A i , j < γ, additional verification is needed in combination with the relative position relationships between the UAV targets, where a single target obtained by either UAV 1 or UAV 2 is selected as the target to be queried depending on whether n 1 n 2 (select the UAV 1 target) or n 1 < n 2 (select the UAV 2 target). We then calculate the cosine similarity between the relative position vector obtained between the selected target and the other targets of the two UAVs, and two targets are assumed to match when the largest cosine similarity is greater than a threshold ε (set as 0.9 herein).
Algorithm 2 Multi-target association algorithm for multiple UAVs
0: Input: multi-target association features obtained from the association feature extraction network and corresponding SAR data
1: Set n 1 = number of targets detected by UAV 1
2: Set n 2 = number of targets detected by UAV 2
3: If n 1     1   and   n 2 ≤ 1
4: No positional relationship matching possible
5: If n 1 = 1   and   n 2 > 1
6: Set S = maximum { S c o s between the apparent features of all targets detected by UAV 1 and UAV 2}
7: If S > α, matching successful
8:   Set the target category according to the category with the greatest confidence among the two detection results
9:   Match the relative positions of UAV 2 targets with the corresponding targets in the SAR data one by one
10: Else
11:  No action taken
12: If n 1   >   1   and   n 2 = 1
13: S = maximum { S c o s between the apparent features of all targets detected by UAV 1 and UAV 2}
14: If S > α, matching successful
15:   Set the target category according to the category with the greatest confidence among the two detection results
16:   Match the relative positions of UAV 1 targets with the corresponding targets in the SAR data one by one
17: Else
18:    No action taken
19: If n 1   >   1   and   n 2 > 1
20: Set A n 1 , n 2   = S c o s between the apparent features of all targets detected by UAV 1 and UAV 2
21: A i , j = m a x { A i , * }
22: If A i , j > γ
23:   Set the target category according to the category with the greatest confidence among the two detection results
24: If A i , j < δ, matching has failed
25:   Discard all target information
26: If δ   <   A i , j < γ
27:   Verification based on the value of S c o s calculated for the relative position vector obtained between the selected target and the other targets of the two UAVs
28: If max { S c o s } > ε
29:   Two targets are matched. Set the target category according to the category with the greatest confidence among the two detection results

4. Experiments

4.1. Training the Model

During the training phase, the model’s loss functions include Box Loss, Objectness Loss, and Classification Loss. The curves depicting the changes in training loss and evaluation metrics during the training process are shown in Figure 5. It can be observed that with an increase in the number of training iterations, various losses on the training set exhibit a decreasing trend, gradually converging. The precision and recall on the validation set show upward trends with the number of training iterations, ultimately reaching stability.

4.2. Datasets

Few public datasets are available specifically for the multi-target association task involving multiple UAVs with vehicle targets. Therefore, we constructed an appropriate dataset for this task and made it public at http://103.30.41.98/ (accessed on 31 January 2024) The dataset displays results of target imaging by UAVs from various flight altitudes and perspectives. The spaceborne Synthetic Aperture Radar (SAR) images along with the corresponding object detection results are shown in Figure 6. The dataset is composed of 400 multi-target images in the training dataset and 200 multi-target images in the testing dataset. Each image in the dataset includes three to five targets. The images were modeled and rendered using the Blender 3D modeling tool to ensure that their characteristics are similar to what would be obtained under actual working conditions. We manually added FP and FN target detections to the training and testing datasets to facilitate a quantitative analysis of the target matching performance. An example of these conditions is illustrated in Figure 7. Here, four cases are considered with different FP and FN target detection rates for UAV 1 and UAV 2, which are presented in Table 1. The false positive detection rate in the table is based on a manually set random detection box, which can be generated via large-scale random generation employing large-range fluctuations in detection box parameters and small-scale random generation employing small-range fluctuations in detection box parameters according to the parameters listed in Table 2, where the settings of the fluctuation ranges are defined in Table 3. Modifications were made in the saved document in the target detection section to obtain the random detection box. The corresponding SAR data are also publicly available at https://github.com/TimeToLive404/sarsata.git (accessed on 31 January 2024).
Considering the process of target recognition by UAVs at different altitudes and perspectives, variations in sensor errors for target detection and localization are observed, with both large- and small-scale distributions. We separately established models for the distribution of target errors, incorporating factors such as target type, the pixel center position of the target in the image, and the length and width of the target in the image pixels. By constructing this model for sensor-based target detection and localization, we can accurately describe the high-dynamic mapping relationship between UAV clusters and targets.

4.3. Experimental Conditions

All experiments were conducted on a GeForce RTX 3090 graphic card using C++ and python. The association performance of the proposed algorithm was compared with those obtained using currently available advanced MobileNetV3 and ShuffleNetV2 network based on the accuracy rate calculated as P = T P T P + F P and the recall rate calculated as R = T P T P + F N , where TP is the true positive rate defining the proportion of correctly identified targets [32,33]. We applied the mean average precision (mAP) based on the calculated P and R values, and rank-1, rank-5, and rank-10 as accuracy evaluation metrics. The hyperparameters of the three experimental models were set as follows: using cross entropy loss, the Adam optimizer, a learning rate of 3.5 × 10⁻⁴, a weight attenuation of 5.0 × 10⁻⁴, and 100 training epochs.

4.4. Experimental Results

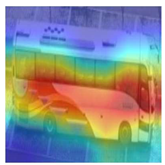
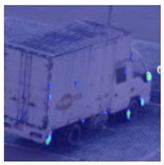
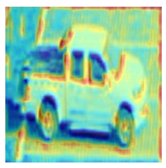
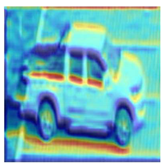
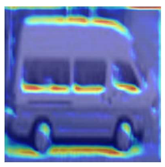
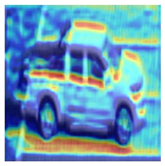
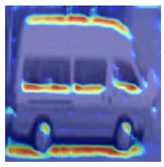
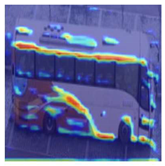
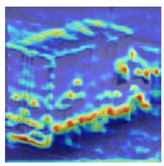
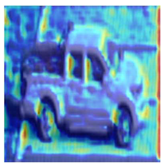
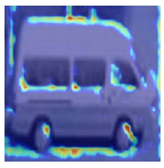
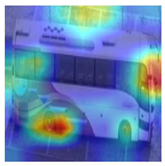
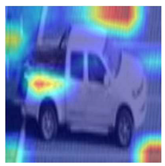
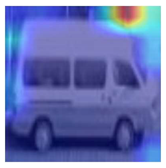
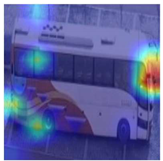
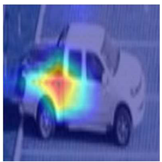
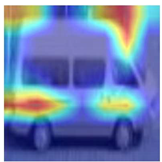
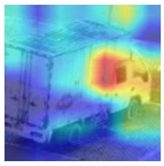
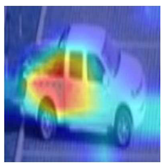
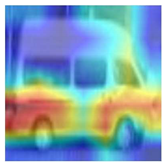
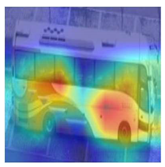
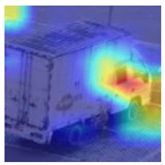
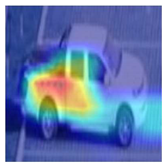
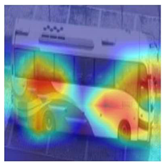
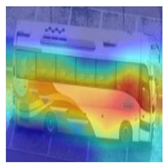
A display of heatmaps for target features can illustrate that the feature extractor obtains different points of interest under different perspectives. After visualizing the features of a cluster of aircraft from multiple angles (Table 4), this paper can demonstrate this viewpoint.
The performance metric results obtained by the three models considered for the testing dataset are listed in Table 5. As can be seen, the proposed algorithm exhibited a substantially improved matching performance over the two existing networks considered. Specifically, the mAP value obtained by the proposed algorithm was 57% and 96% greater than those obtained by the MobileNetV3 and ShuffleNetV2 networks, respectively. Moreover, the rank-1 accuracy obtained by the proposed algorithm was 3.5 times greater than those obtained by the existing networks, while the rank-5 and rank-10 accuracy values of the proposed network were 1.5 to 2 times greater than those obtained by the existing networks. Overall, the FP and FN rates obtained by the proposed algorithm were 16.67% and 0%, respectively. In fact, it is difficult to filter out the manually added recognition noise of which the position and size parameters fluctuate in a small range. In practice, this situation occurs only when the accuracy of the target recognition algorithm itself is not high. Therefore, we can conclude that the algorithm proposed herein effectively solves the multi-target association task for multiple UAVs. Finally, we note that the computation times required by all three algorithms were of the same order of magnitude, commensurate with the real-time computational performance. Accordingly, the algorithm proposed in this paper also offers a good real-time target association performance.

5. Conclusions

This paper addressed the issues associated with the high rate of FP and FN target detections obtained during the multi-target association of image data captured by multiple UAVs by proposing a high-performance multi-target matching algorithm. Two different networks and corresponding algorithms were established for (1) extracting the features of targets observed in the image data of individual UAVs over time and for (2) extracting features pertaining to associations between the targets extracted by multiple UAVs in space. The first process reduces the occurrence of FP and FN target detections, which greatly facilitates the subsequent association process. The proposed algorithm was demonstrated to provide a substantially improved association performance for vehicle targets compared with those obtained by the existing MobileNetV3 and ShuffleNetV2 networks in conjunction with a specially developed publicly available dataset comprising three to five targets in 400 multi-target images and 200 multi-target images in the training and testing datasets, respectively. The high association performance and computational performance of the proposed algorithm demonstrate its effectiveness and practicability for coordinating multiple UAVs in the identification of multiple targets.

Author Contributions

Data curation, H.Z.; Formal Analysis, H.Z.; Writing—Original Draft, H.Z.; Conceptualization, J.Z.; Resources, J.Z.; Investigation, H.Z., J.Z., and C.S.; Supervision, J.Z. and H.Z.; Project Administration, C.S.; Writing—Review and Editing, H.Z. and C.S. All authors have read and agreed to the published version of the manuscript.

Funding

This research received no external funding.

Data Availability Statement

3rd Party Data Restrictions apply to the availability of these data. Data were obtained from Northwestern Polytechnical University and are available from the authors with the permission of Northwestern Polytechnical University.

Acknowledgments

We would like to thank the School of Software, Northwestern Polytechnical University and Science and Technology on Complex System Control and Intelligent Agent Cooperation Laboratory. All authors have read and agreed to the published version of the manuscript.

Conflicts of Interest

The authors declare no conflicts of interest.

References

  1. Grocholsky, B.; Keller, J.; Kumar, V.; Pappas, G. Cooperative air and ground surveillance. IEEE Robot. Autom. Mag. 2006, 13, 16–25. [Google Scholar] [CrossRef]
  2. Sinha, A.; Kirubarajan, T.; Bar-Shalom, Y. Autonomous surveillance by multiple cooperative UAVs. Signal Data Process. Small Targets 2005, 2005, 616–627. [Google Scholar]
  3. Capitan, J.; Merino, L.; Ollero, A. Cooperative decision-making under uncertainties for multi-target surveillance with multiples UAVs. J. Intell. Robot. Syst. 2016, 84, 371–386. [Google Scholar] [CrossRef]
  4. Oh, H.; Kim, S.; Shin, H.; Tsourdos, A. Coordinated standoff tracking of moving target groups using multiple UAVs. IEEE Trans. Aerosp. Electron. Syst. 2015, 51, 1501–1514. [Google Scholar] [CrossRef]
  5. Ragi, S.; Chong, E.K.P. Decentralized guidance control of UAVs with explicit optimization of communication. J. Intell. Robot Syst. 2014, 73, 811–822. [Google Scholar] [CrossRef]
  6. Jilkov, V.P.; Rong Li, X.; DelBalzo, D. Best combination of multiple objectives for UAV search & track path optimization. In Proceedings of the 2007 10th International Conference on Information Fusion, Québec, QC, Canada, 9–12 July 2007; pp. 1–8. [Google Scholar]
  7. Pitre, R.R.; Li, X.R.; Delbalzo, R. UAV route planning for joint search and track missions—An information-value approach. IEEE Trans. Aerosp. Electron. Syst. 2012, 48, 2551–2565. [Google Scholar] [CrossRef]
  8. Ousingsawat, J.; Campbell, M.E. Optimal cooperative reconnaissance using multiple vehicles. J. Guid. Control. Dyn. 2007, 30, 122–132. [Google Scholar] [CrossRef]
  9. Hoffmann, G.; Waslander, S.; Tomlin, C. Distributed cooperative search using information-theoretic costs for particle filters, with quadrotor applications. In Proceedings of the AIAA Guidance, Navigation, and Control Conference and Exhibit, Keystone, CO, USA, 21–24 August 2006; p. 6576. [Google Scholar]
  10. Hoffmann, G.M.; Tomlin, C.J. Mobile sensor network control using mutual information methods and particle filters. IEEE Trans. Autom. Control 2010, 55, 32–47. [Google Scholar] [CrossRef]
  11. Sinha, A.; Kirubarajan, T.; Bar-Shalom, Y. Autonomous ground target tracking by multiple cooperative UAVs. In Proceedings of the 2005 IEEE Aerospace Conference, Big Sky, MT, USA, 5–12 March 2005; pp. 1–9. [Google Scholar]
  12. Redmon, J.; Divvala, S.; Girshick, R.; Farhadi, A. You only look once: Unified, real-time object detection. In Proceedings of the 2016 IEEE Conference on Computer Vision and Pattern Recognition (CVPR), Las Vegas, NV, USA, 27–30 June 2016; pp. 779–788. [Google Scholar]
  13. Redmon, J.; Farhadi, A. YOLO9000: Better, faster, stronger. In Proceedings of the 2017 IEEE Conference on Computer Vision and Pattern Recognition (CVPR), Honolulu, HI, USA, 21–26 July 2017; pp. 6517–6525. [Google Scholar]
  14. Redmon, J.; Farhadi, A. YOLOv3: An incremental improvement. arXiv 2018, arXiv:1804.02767. [Google Scholar] [CrossRef]
  15. Liu, W.; Anguelov, D.; Erhan, D.; Szegedy, C.; Reed, S.; Fu, C.-Y.; Berg, A.C. SSD: Single shot MultiBox detector. In Computer Vision—ECCV 2016; Springer: Cham, Switzerland, 2016; pp. 21–37. [Google Scholar]
  16. Lin, T.-Y.; Dollár, P.; Girshick, R.; He, K.; Hariharan, B.; Belongie, S. Feature pyramid networks for object detection. In Proceedings of the 2017 IEEE Conference on Computer Vision and Pattern Recognition (CVPR), Honolulu, HI, USA, 21–26 July 2017; pp. 936–944. [Google Scholar]
  17. Law, H.; Deng, J. CornerNet: Detecting objects as paired keypoints. Int. J. Comput. Vis. 2020, 128, 642–656. [Google Scholar] [CrossRef]
  18. Zhou, X.; Wang, D.; Krähenbühl, P. Objects as points. arXiv 2019, arXiv:1904.07850. [Google Scholar] [CrossRef]
  19. Tian, Z.; Shen, C.; Chen, H.; He, T. FCOS: Fully convolutional one-stage object detection. In Proceedings of the 2019 IEEE/CVF International Conference on Computer Vision (ICCV), Seoul, Republic of Korea, 27 October–2 November 2019; pp. 9626–9635. [Google Scholar]
  20. Liu, F.; Li, Y. NanoDet ship detection method based on visual saliency in SAR remote sensing images. J. Radars 2021, 10, 885–894. [Google Scholar] [CrossRef]
  21. Zhou, X.; Zhuo, J.; Krähenbühl, P. Bottom-up object detection by grouping extreme and center points. In Proceedings of the 2019 IEEE/CVF Conference on Computer Vision and Pattern Recognition (CVPR), Long Beach, CA, USA, 15–20 June 2019; pp. 850–859. [Google Scholar]
  22. Liu, Z.; Zheng, T.; Xu, G.; Yang, Z.; Liu, H.; Cai, D. Training-time-friendly network for real-time object detection. In Proceedings of the AAAI Conference on Artificial Intelligence, New York, NY, USA, 7–12 February 2020; Volume 34, pp. 11685–11692. [Google Scholar] [CrossRef]
  23. Arani, E.; Gowda, S.; Mukherjee, R.; Magdy, O.; Kathiresan, S.; Zonooz, B. A comprehensive study of real-time object detection networks across multiple domains: A survey. arXiv 2023, arXiv:2208.10895. [Google Scholar] [CrossRef]
  24. Girshick, R.; Donahue, J.; Darrell, T.; Malik, J. Rich feature hierarchies for accurate object detection and semantic segmentation. In Proceedings of the 2014 IEEE Conference on Computer Vision and Pattern Recognition, Columbus, OH, USA, 23–28 June 2014; pp. 580–587. [Google Scholar]
  25. Wang, X.; Shrivastava, A.; Gupta, A. A-fast-RCNN: Hard positive generation via adversary for object detection. In Proceedings of the 2017 IEEE Conference on Computer Vision and Pattern Recognition (CVPR), Honolulu, HI, USA, 21–26 July 2017; pp. 2606–2615. [Google Scholar]
  26. Qin, Z.; Li, Z.; Zhang, Z.; Bao, Y.; Yu, G.; Peng, Y.; Sun, J. ThunderNet: Towards real-time generic object detection on mobile devices. In Proceedings of the 2019 IEEE/CVF International Conference on Computer Vision (ICCV), Seoul, Republic of Korea, 27 October–2 November 2019; pp. 6717–6726. [Google Scholar]
  27. Ristani, E.; Tomasi, C. Features for Multi-target Multi-camera Tracking and Re-identification. In Proceedings of the 2018 IEEE/CVF Conference on Computer Vision and Pattern Recognition, Salt Lake City, UT, USA, 18–23 June 2018; pp. 6036–6046. [Google Scholar]
  28. Ristani, E.; Solera, F.; Zou, R.; Cucchiara, R.; Tomasi, C. Performance measures and a data set for multi-target, multi-camera tracking. In Computer Vision—ECCV 2016 Workshops; Springer: Cham, Switzerland, 2016; pp. 17–35. [Google Scholar]
  29. Tesfaye, Y.T.; Zemene, E.; Prati, A.; Pelillo, M.; Shah, M. Multi-target tracking in multiple non-overlapping cameras using fast-constrained dominant sets. Int. J. Comput. Vis. 2019, 127, 1303–1320. [Google Scholar] [CrossRef]
  30. Hou, Y.; Zheng, L.; Wang, Z.; Wang, S. Locality aware appearance metric for multi-target multi-camera tracking. arXiv 2019, arXiv:1911.12037. [Google Scholar] [CrossRef]
  31. Bochkovskiy, A.; Wang, C.-Y.; Liao, H.-Y.M. YOLOv4: Optimal speed and accuracy of object detection. arXiv 2020, arXiv:2004.10934. [Google Scholar] [CrossRef]
  32. Howard, A.; Sandler, M.; Chen, B.; Wang, W.; Chen, L.-C.; Tan, M.; Chu, G.; Vasudevan, V.; Zhu, Y.; Pang, R.; et al. Searching for MobileNetV3. In Proceedings of the 2019 IEEE/CVF International Conference on Computer Vision (ICCV), Seoul, Republic of Korea, 27 October–2 November 2019; pp. 1314–1324. [Google Scholar]
  33. Ma, N.; Zhang, X.; Zheng, H.-T.; Sun, J. ShuffleNet v2: Practical guidelines for efficient CNN architecture design. In Computer Vision—ECCV 2018; Springer: Cham, Switzerland, 2018; pp. 122–138. [Google Scholar]
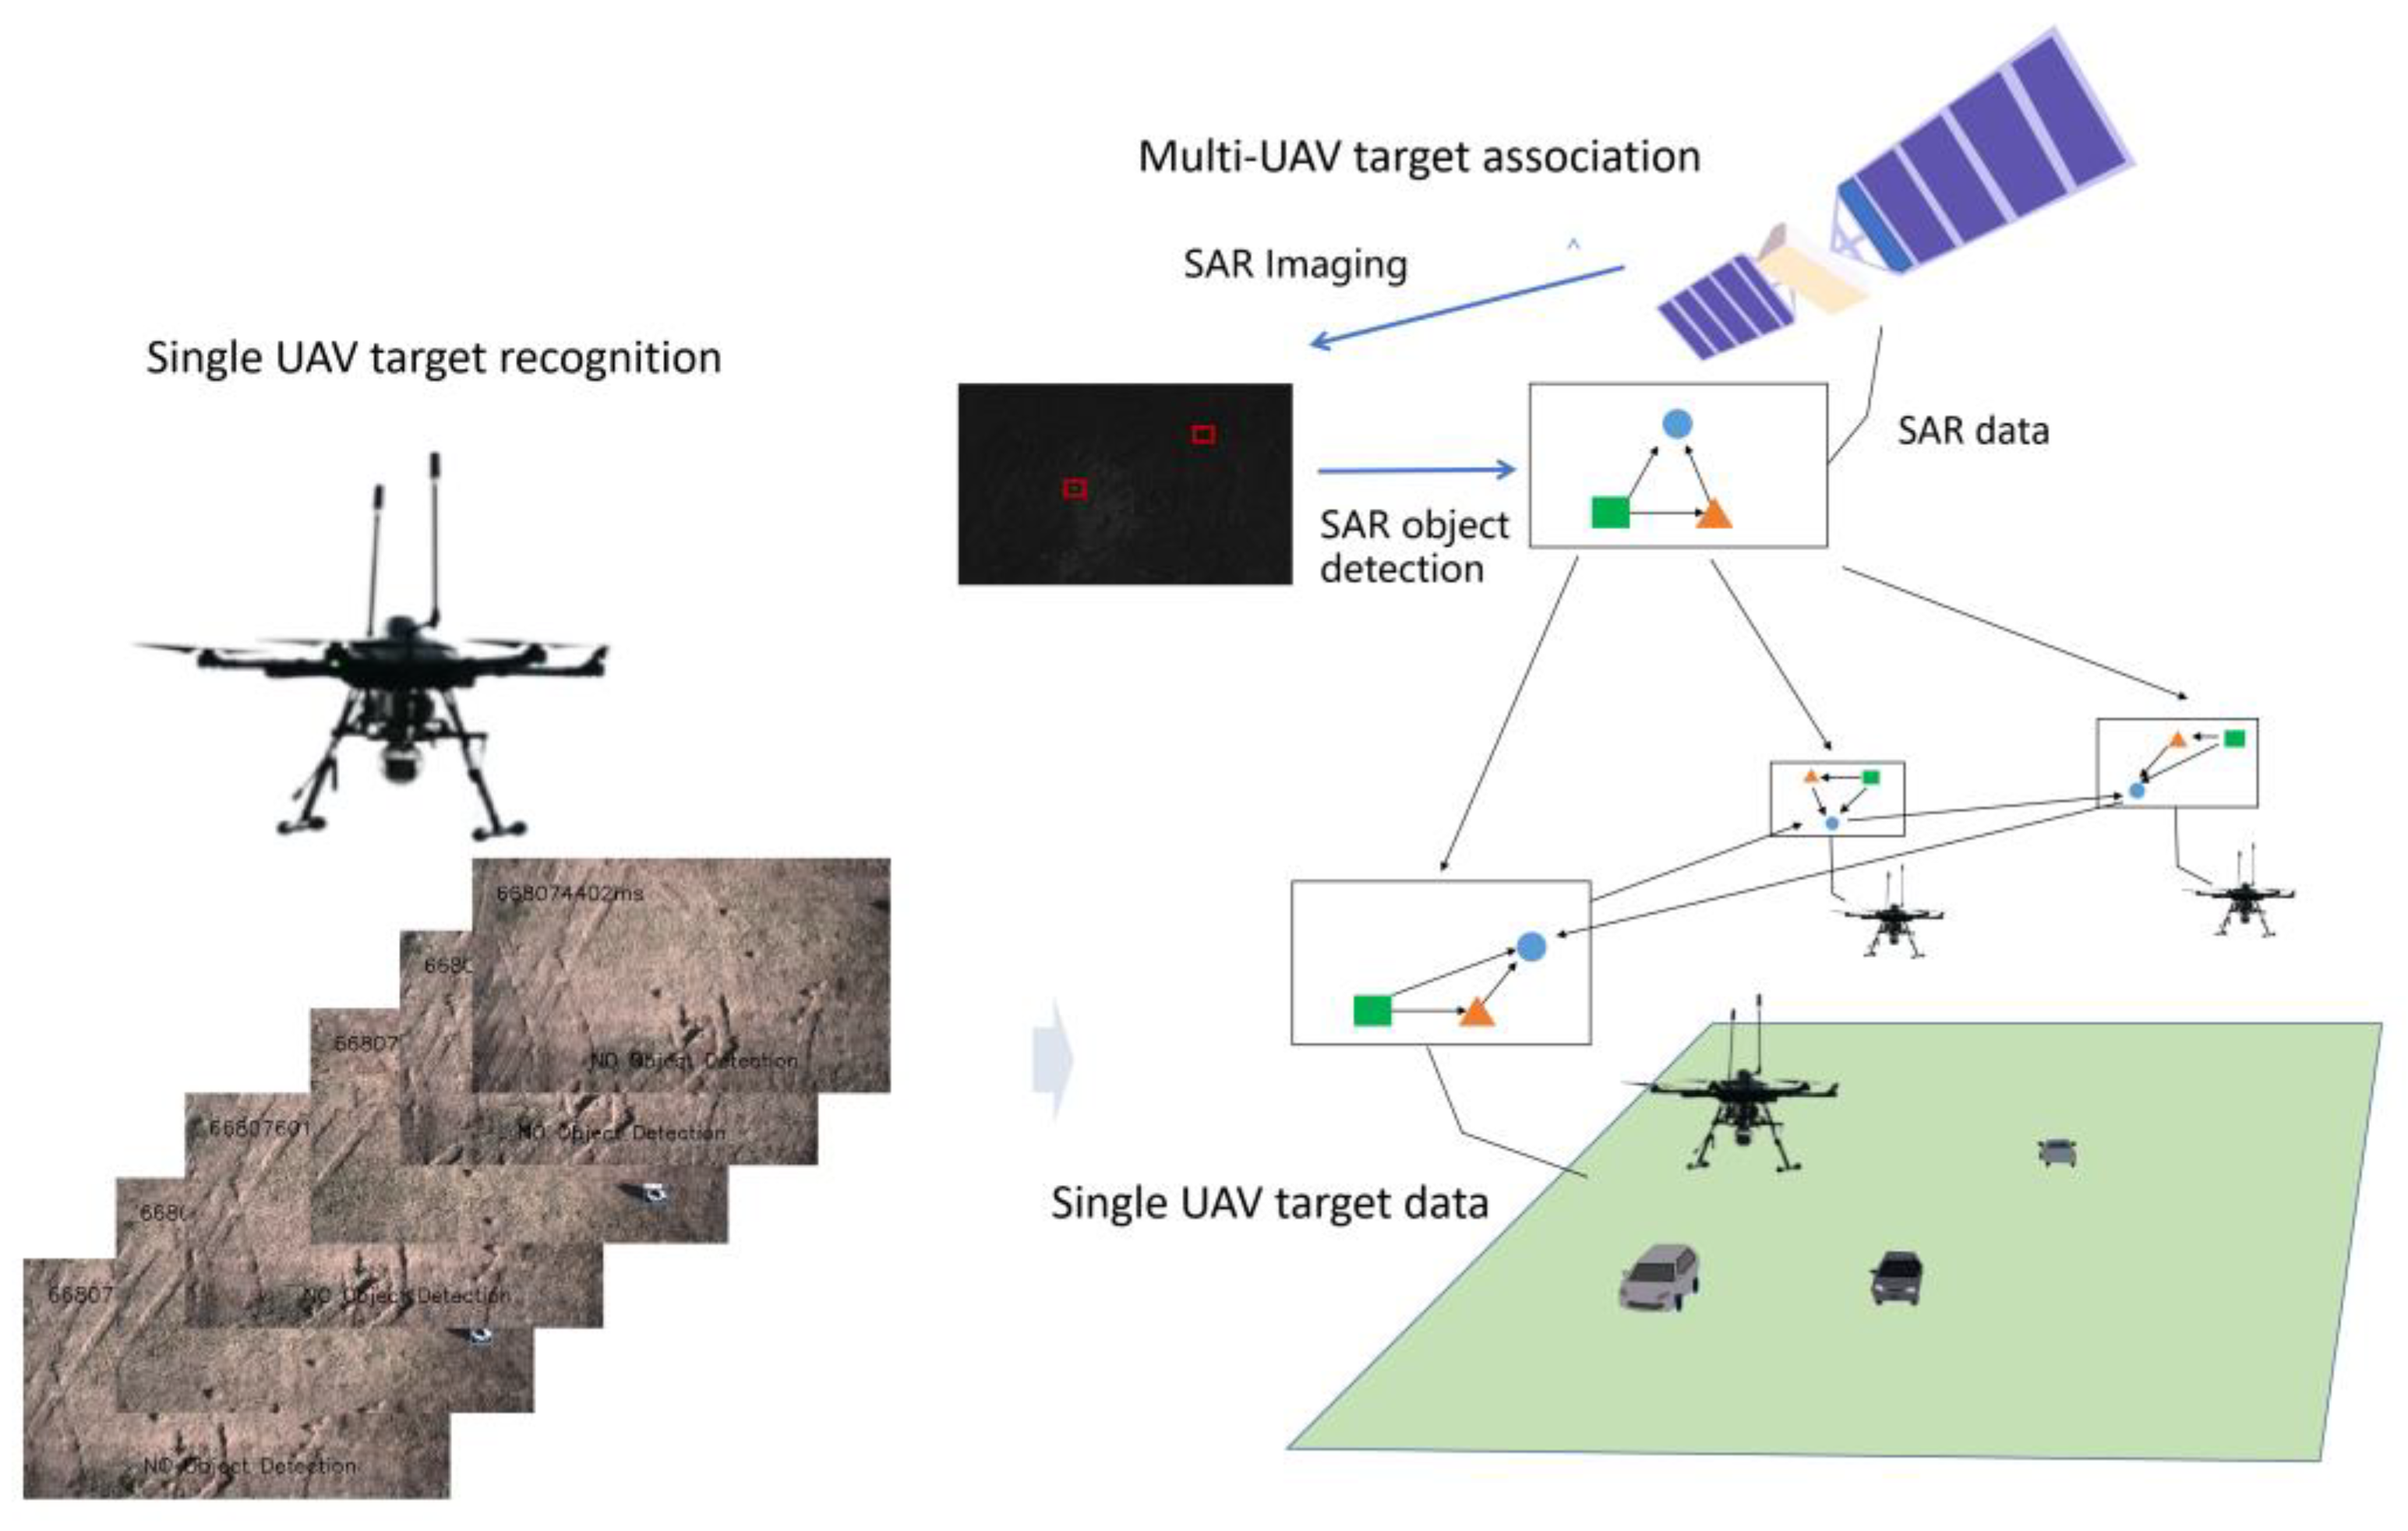
Figure 1. From single- to multi-UAV missions.
Drones 08 00083 g001
Figure 2. Overall pipeline.
Drones 08 00083 g002
Figure 3. MIRNet model employed in the image enhancement module.
Drones 08 00083 g003
Figure 4. Target recognition network architecture.
Drones 08 00083 g004
Figure 5. Model’s loss functions.
Drones 08 00083 g005
Figure 6. SAR images and the corresponding object detection results.
Drones 08 00083 g006
Figure 7. Illustrations of associated target data: (a) original multi-objective image data; (b) correct multi-target recognition data; (c) incorrect multi-target recognition data with a single FN detection; (d) incorrect multi-target recognition data with a single FP detection. (The suqre means the target has been detected).
Drones 08 00083 g007
Table 1. Cases of false positive (FP) and false negative (FN) detection rates considered.
CaseUAV 1UAV 2
FP RateFN RateFP RateFN Rate
124.000.0025.170.00
224.0016.6725.1716.67
333.500.0031.330.00
433.5016.6731.3316.67
Table 2. Random distribution of false positive detection frames in the four cases.
CaseUAV 1UAV 2
Large-Range RandomSmall-Range RandomLarge-Range RandomSmall-Range Random
130.5469.4633.7766.23
230.5469.4633.7716.67
350.2449.7630.5449.76
450.2449.7650.2449.76
Table 3. Random fluctuation range of false positive detection frames.
CategoryAbscissa Fluctuation of Center PointLongitudinal Coordinate Fluctuation of Center PointWidth FluctuationHeight Fluctuation
Large fluctuation0–410–30010–1005–405–40
Small fluctuation320–23100–10535–4035–40
Table 4. Visualizing the features of a cluster of aircraft from multiple angles (The color represents the confidence level in the image where the target is located, and the darker the color, the higher the detection probability).
BusBox TruckPickup TruckVan
Drones 08 00083 i001Drones 08 00083 i002Drones 08 00083 i003Drones 08 00083 i004
Drones 08 00083 i005Drones 08 00083 i006Drones 08 00083 i007Drones 08 00083 i008
Drones 08 00083 i009Drones 08 00083 i010Drones 08 00083 i011Drones 08 00083 i012
Drones 08 00083 i013Drones 08 00083 i014Drones 08 00083 i015Drones 08 00083 i016
Drones 08 00083 i017Drones 08 00083 i018Drones 08 00083 i019Drones 08 00083 i020
Drones 08 00083 i021Drones 08 00083 i022Drones 08 00083 i023Drones 08 00083 i024
Drones 08 00083 i025Drones 08 00083 i026Drones 08 00083 i027Drones 08 00083 i028
Drones 08 00083 i029Drones 08 00083 i030Drones 08 00083 i031Drones 08 00083 i032
Drones 08 00083 i033Drones 08 00083 i034Drones 08 00083 i035Drones 08 00083 i036
Drones 08 00083 i037Drones 08 00083 i038Drones 08 00083 i039Drones 08 00083 i040
Table 5. Comparison of test results.
ModelmAPRank-1Rank-5Rank-10
Proposed0.3840.6090.740.87
MobileNetV30.2450.1740.3480.566
ShuffleNetV20.1960.1740.3040.435
Disclaimer/Publisher’s Note: The statements, opinions and data contained in all publications are solely those of the individual author(s) and contributor(s) and not of MDPI and/or the editor(s). MDPI and/or the editor(s) disclaim responsibility for any injury to people or property resulting from any ideas, methods, instructions or products referred to in the content.