Article

Computer Vision-Based Path Planning with Indoor Low-Cost Autonomous Drones: An Educational Surrogate Project for Autonomous Wind Farm Navigation

by
Angel A. Rodriguez
,
Mohammad Shekaramiz
* and
Mohammad A. S. Masoum
Machine Learning and Drone Laboratory, Department of Engineering, Utah Valley University, Orem, UT 84058, USA
*
Author to whom correspondence should be addressed.
Drones 2024, 8(4), 154; https://doi.org/10.3390/drones8040154
Submission received: 4 March 2024 / Revised: 11 April 2024 / Accepted: 14 April 2024 / Published: 17 April 2024

Abstract

:
The application of computer vision in conjunction with GPS is essential for autonomous wind turbine inspection, particularly when the drone navigates through a wind farm to detect the turbine of interest. Although drones for such inspections use GPS, our study only focuses on the computer vision aspect of navigation that can be combined with GPS information for better navigation in a wind farm. Here, we employ an affordable, non-GPS-equipped drone within an indoor setting to serve educational needs, enhancing its accessibility. To address navigation without GPS, our solution leverages visual data captured by the drone’s front-facing and bottom-facing cameras. We utilize Hough transform, object detection, and QR codes to control drone positioning and calibration. This approach facilitates accurate navigation in a traveling salesman experiment, where the drone visits each wind turbine and returns to a designated launching point without relying on GPS. To perform experiments and investigate the performance of the proposed computer vision technique, the DJI Tello EDU drone and pedestal fans are used to represent commercial drones and wind turbines, respectively. Our detailed and timely experiments demonstrate the effectiveness of computer vision-based path planning in guiding the drone through a small-scale surrogate wind farm, ensuring energy-efficient paths, collision avoidance, and real-time adaptability. Although our efforts do not replicate the actual scenario of wind turbine inspection using drone technology, they provide valuable educational contributions for those willing to work in this area and educational institutions who are seeking to integrate projects like this into their courses, such as autonomous systems.

1. Introduction

With the increasing deployment of wind energy as a renewable power source, the maintenance and inspection of wind turbines have become crucial. It is estimated that cumulative operation and maintenance (O&M) costs can represent 75–90% of the total turbine’s investment cost [1]. Offline monitoring requires that the machinery be taken out of service for inspection by maintenance personnel, which is inefficient in most applications. Generally, these offline inspections are scheduled at regular intervals and consist of routine procedures. Research suggests that optimal inspection intervals for visual inspections should occur every three months [2], and a significant portion of inspection costs arises from the manual labor required to ascend the structure and the energy loss incurred when a turbine must be taken out of service for significant periods. Therefore, unmanned aerial vehicles (UAVs) have emerged as a promising technology for efficient and cost-effective wind turbine inspection [3,4,5]. The cost benefits of using drone technologies include decreasing injury liability risks and reducing offline time. For drone routing, path planning plays a pivotal role in the rapidly growing UAV applications [6] and is used in optimizing the inspection process, ensuring thorough coverage of a wind farm [7], and improving overall inspection efficiency. The significance of path planning in wind turbine inspection can be summarized in the following key points:
  • Maximizing inspection coverage: Path planning algorithms help determine the most efficient routes for drones to follow while ensuring complete coverage of the wind turbine farms [8]. A well-developed path planning algorithm can ensure thorough inspection and reduce the risk of undetected turbines by minimizing the overlaps and avoiding missed areas.
  • Time and cost efficiency: Proper path planning enables drones to navigate optimal routes based on relative distances and weather, minimizing unnecessary flight time and energy consumption [9]. By reducing the inspection time, path planning contributes to cost savings and increases the overall efficiency of wind turbine inspection.
  • Collision avoidance and safety: Path planning algorithms incorporate collision avoidance mechanisms to prevent accidents and ensure the safety of the drone, wind turbine, and surrounding structures [10]. By considering the physical constraints and obstacles in the environment, path planning algorithms guide drones in a safe and controlled manner.
  • Data accuracy and consistency: Well-planned inspection paths facilitate consistent data collection, ensuring uniform image and sensor data quality around the points of interest [11]. This improves data collection for machine learning (ML) model training and enables accurate results when the trained ML models are tested for crack and anomaly detection.
Currently, wind turbine inspections using drones require taking the turbine out of service to prevent damage from drones that are manually flown by pilots using controllers. Images of the turbine structure are taken and then analyzed by personnel for cracks and anomalies. Newer methods involve using ML models in collected datasets for the automated detection of surface blade cracks [12,13]. Furthermore, the latest methods are accomplished via autonomous drones, which replace human flight control for visual navigation [14,15] in conjunction with deep learning for damage inspection [16].
Drone automation is a relatively new field of research, especially when integrated with computer vision techniques to detect wind turbines [17] and track large-scale turbine blades in the aerial shooting environment [18].
Research on computer vision-based drone path planning is gaining significant interest for several reasons:
  • Indoor navigation: GPS signals are often unreliable indoors due to signal blockage or multipath effects. Computer vision allows drones to navigate indoor environments where GPS signals are weak or nonexistent [19].
  • Precision and accuracy: Computer vision enables drones to perceive their surroundings with high precision, allowing for obstacle avoidance and enhanced path planning when combined with GPS data. This is crucial for tasks that require precise movements, such as inspection of infrastructure or delivery in dense urban areas [4,15].
  • Real-time adaptability: Computer vision systems can process real-time data from cameras, enabling drones to adapt their paths on the fly, based on changing environmental conditions or unexpected obstacles. This adaptability is essential for safe and efficient drone operations [20].
  • Security: GPS signals can be susceptible to jamming or spoofing attacks, compromising the security of drone navigation [21]. Computer vision-based systems are less vulnerable to such attacks, enhancing the security of drone operations. Thus, taking advantage of the combination of GPS data and computer vision through the live camera feed of the drone is beneficial.
  • Collaborative swarm robotics: Drones often work in swarms for environmental monitoring or search and rescue missions. Computer vision enables drones to communicate and coordinate with each other, leading to more efficient swarm behavior without relying solely on GPS signals [22].
  • Research and development: Advancements in computer vision algorithms and hardware technology have opened up new avenues for research and development. Researchers are exploring innovative techniques such as simultaneous localization and mapping (SLAM) [23] and deep learning-based object recognition to enhance drone navigation capabilities.
The educational objective of our study is to provide a cheap and easily accessible manner to learn about computer vision and path planning in the area of UAVs. Thus, we simplified the problem by making a surrogate case in an indoor environment. Using a low-cost drone and pedestal fans in place of turbines, the cost of a GPS module is eliminated along with the regulations of large-scale operations. The Tello EDU drone from the educational division of DJI products was selected for the surrogate study due to its educational potential in autonomous systems, computer vision, and control engineering [24]. This drone is made by Ryze Technologies but uses a DJI flight control system and Intel processor, which allows it to be programmable by the Tello SDK. The Tello SDK gives this surrogate project the ability to provide a lot of course material and student enrichment in future courses [25].
The computer vision-aided GPS approach will become crucial when the drones undertake long-range journeys to inspect turbines within a wind farm. In such cases, while GPS coordinates assist the drone in reaching the vicinity of the turbines, they do not disclose the turbine’s yaw or the blade orientation. Such visual information is required to establish path planning in a new coordinate system originating from the hub, which is essential for inspecting turbine blades [4]. While our manuscript does not address the entire scope of this challenge, it focuses on an exploratory path-planning approach that is reliant on computer vision rather than GPS.
Previous research on autonomous drone-based wind turbine inspection [4,15] has utilized techniques such as Hough transforms and object detection for visual navigation. In our study, we employ both methods to provide feedback to the autonomous system, enabling the drone to adjust its position in real time based on visuals from both frontal and bottom-facing perspectives. In a scalable implementation, these methods could complement GPS for comprehensive and autonomous inspection. Since our approach uses object detection and Hough transform to guide the drone by comparing the center pixel to the center of detection, the scalable concept could use the same methods to guide the drone around the blades by detecting the hub and blades. Additionally, other techniques used in the paper, such as Cartesian calibration, while not a direct replacement of GPS, enable a computer vision-focused approach in an indoor environment.
A major area of focus on drone path planning is the ability to safely fly to points of interest as quickly as possible to preserve the drone’s onboard battery power. This type of problem can be referred to as the traveling salesman problem. One approach to the traveling salesman problem, as it applies to drone path planning, is the use of simulated annealing to find an optimal cyclical path, allowing the drone to traverse the area directly to the points of interest and return to the launch location while traveling the shortest possible total distance [26]. While not being the only heuristic method capable of generating an optimized path, this method is typically reliable while using accurate GPS coordinates for both the targets and the drone within the area of operation. This allows for precise positioning of the drone within the algorithm at all times. However, the approach detailed in this surrogate work will demonstrate a method to work with a small-scale drone with no onboard GPS equipment. The lack of a GPS will naturally result in the drone accumulating small amounts of drift over time that could ultimately result in the drone being off from its intended location after multiple movements.
A solution presented to the problem of drift accumulation requires occasional resetting of the drone’s current internal coordinates using image analyses of known locations. A problem with this recalibration method is that the distance between the targets and known locations must also be accounted for in the drone’s path planning optimization. Other work has shown that similar techniques have been implemented into automated drone path planning by having the drone occasionally visit refueling depots while traveling between targets [27,28]. The method being used in the study would require the drone to re-calibrate its Cartesian coordinates between every two targets, and the process may require the drone to spend significant amounts of time hovering around the vicinity of a known location (helipad in this study) if the known location is not detected immediately. The solution tested was found to be battery-intensive and less effective compared to an alternative method that utilized front-camera image analysis and QR codes attached to the pedestal fans. The alternative method has a trade-off of being less accurate in updating Cartesian coordinates yet adequate to complete the mission in significantly less time than helipad calibration. Instead of placing multiple helipads in the experiment area, only one would be used, which will reside under the drone takeoff location at the end of the defined mission where the drone detects the helipad to land on. The precise landing will be conducted using Hough transforms, used for line and shape detection in drones utilizing computer vision [29]. Hough transforms are applied to the image captured by the downward-facing camera mounted on the drone to identify the circular shape of the helipad when the drone approaches to land exactly where it took off. Notice that in the realistic wind turbine inspection, one can use RTK (real-time kinematic)-supported drones, which also replace the helipad calibration in our surrogate study. In our study, we only focus on computer vision with non-GPS-supported drones. Other approaches to address the odometry drift of GPS-denied environments include SLAM-based methods [30,31]. However, due to the use of small, low-cost Tello EDU drones, neither SLAM nor LiDAR is employed in our study. In indoor navigation, QR codes provide an advantage with real-time validation and correction capabilities.
This paper aims to optimize path planning solutions via an autonomous drone for the small-scale proof of concept that surrogates wind farm navigation. The main contributions are as follows:
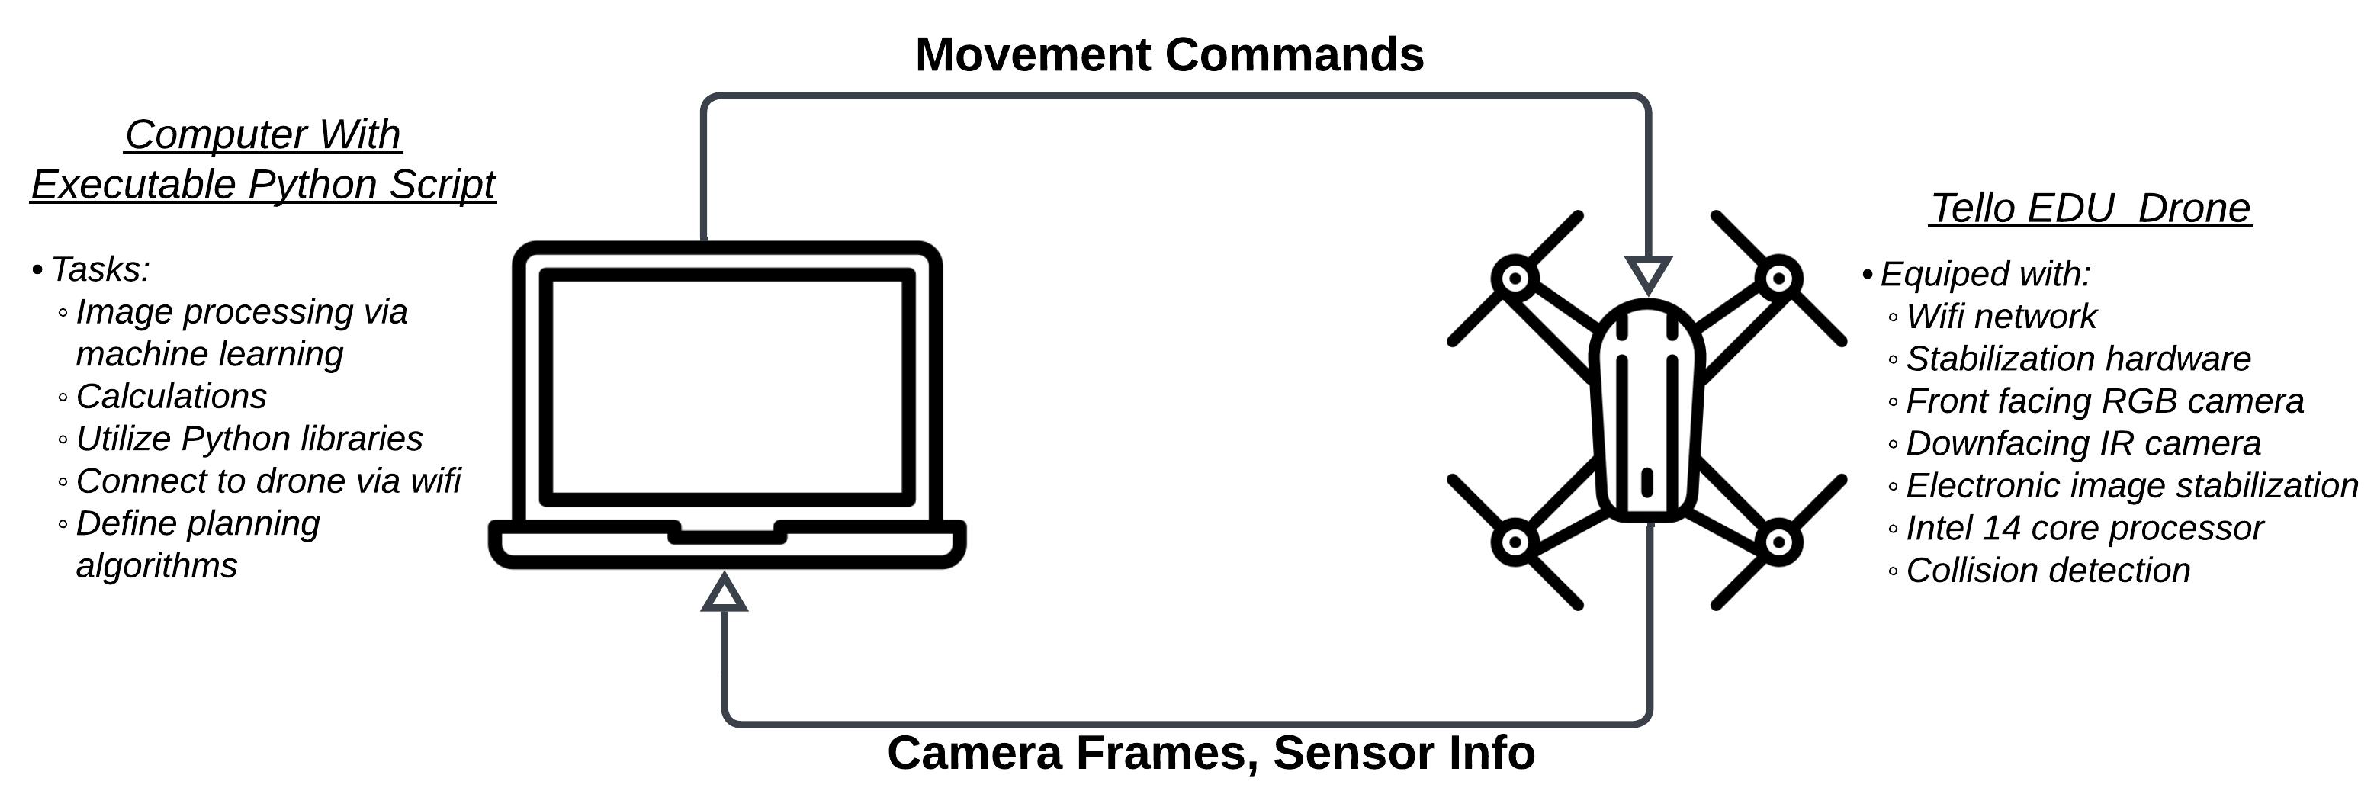
  • Computer vision-based path planning: A path planning approach for autonomous drones that relies on computer vision techniques is proposed. This approach enables drones to navigate based on front and bottom-facing visuals to aid in GPS-based inspections or where GPS signals are weak or unavailable.
  • Indoor navigation of low-cost autonomous drones: The research demonstrates that it is possible to develop low-cost autonomous drone systems that can perform complex tasks in indoor environments such as real-time decision-making, adaptability, determining real positions on the defined Cartesian coordinate system (CCS), and self-correction of its position as necessary without the use of GPS.
  • Small-scale proof of concept: The research provides a small-scale proof of concept for indoor navigation that surrogates wind farm navigation and computer vision-based adaptability.
  • Educational aspects and applications: This paper also resembles a project that can be used in machine learning and drone-related introductory courses. The GitHub repository with a README.md file showing how to use the developed autonomous drone system with functions, drone commands, images, and videos, is included. Such tools to accelerate on-boarding can be reused for various applications and lectures. In addition, the pseudo-code has been provided for implementation in Algorithms 1–4. The effectiveness of the developed computer vision-based navigation system for low-cost drones is attractive for educational purposes.
This paper is organized as follows. The previous and related works are in Section 2. Section 3 briefly discusses the simulated annealing algorithm and its implementation, creating an optimized path for the drone. Section 4 explores computer vision-based navigation using Haar-feature cascade classifiers, object detection bounding boxes for trigonometric path planning, circle detection for vision-positing system (VPS), and QR scanning for target verification. Section 5 describes the integration of simulated annealing with computer vision and path planning to create an autonomous drone with real-time adaptability. Section 6 shows the initial testing phase that reveals the results of the traveling salesman experiments where the coordinates of each fan are known, and the drone starts at either the helipad or an incorrect starting point. Section 7 depicts the results of the snake path exploration experiments where the coordinates of each fan are unknown, but the quantities of each fan are either known or unknown. Section 8 highlights the educational contributions of this work, which can be applied to smart autonomous systems and computer vision courses. Section 9 and Section 10 present the conclusion and future work.
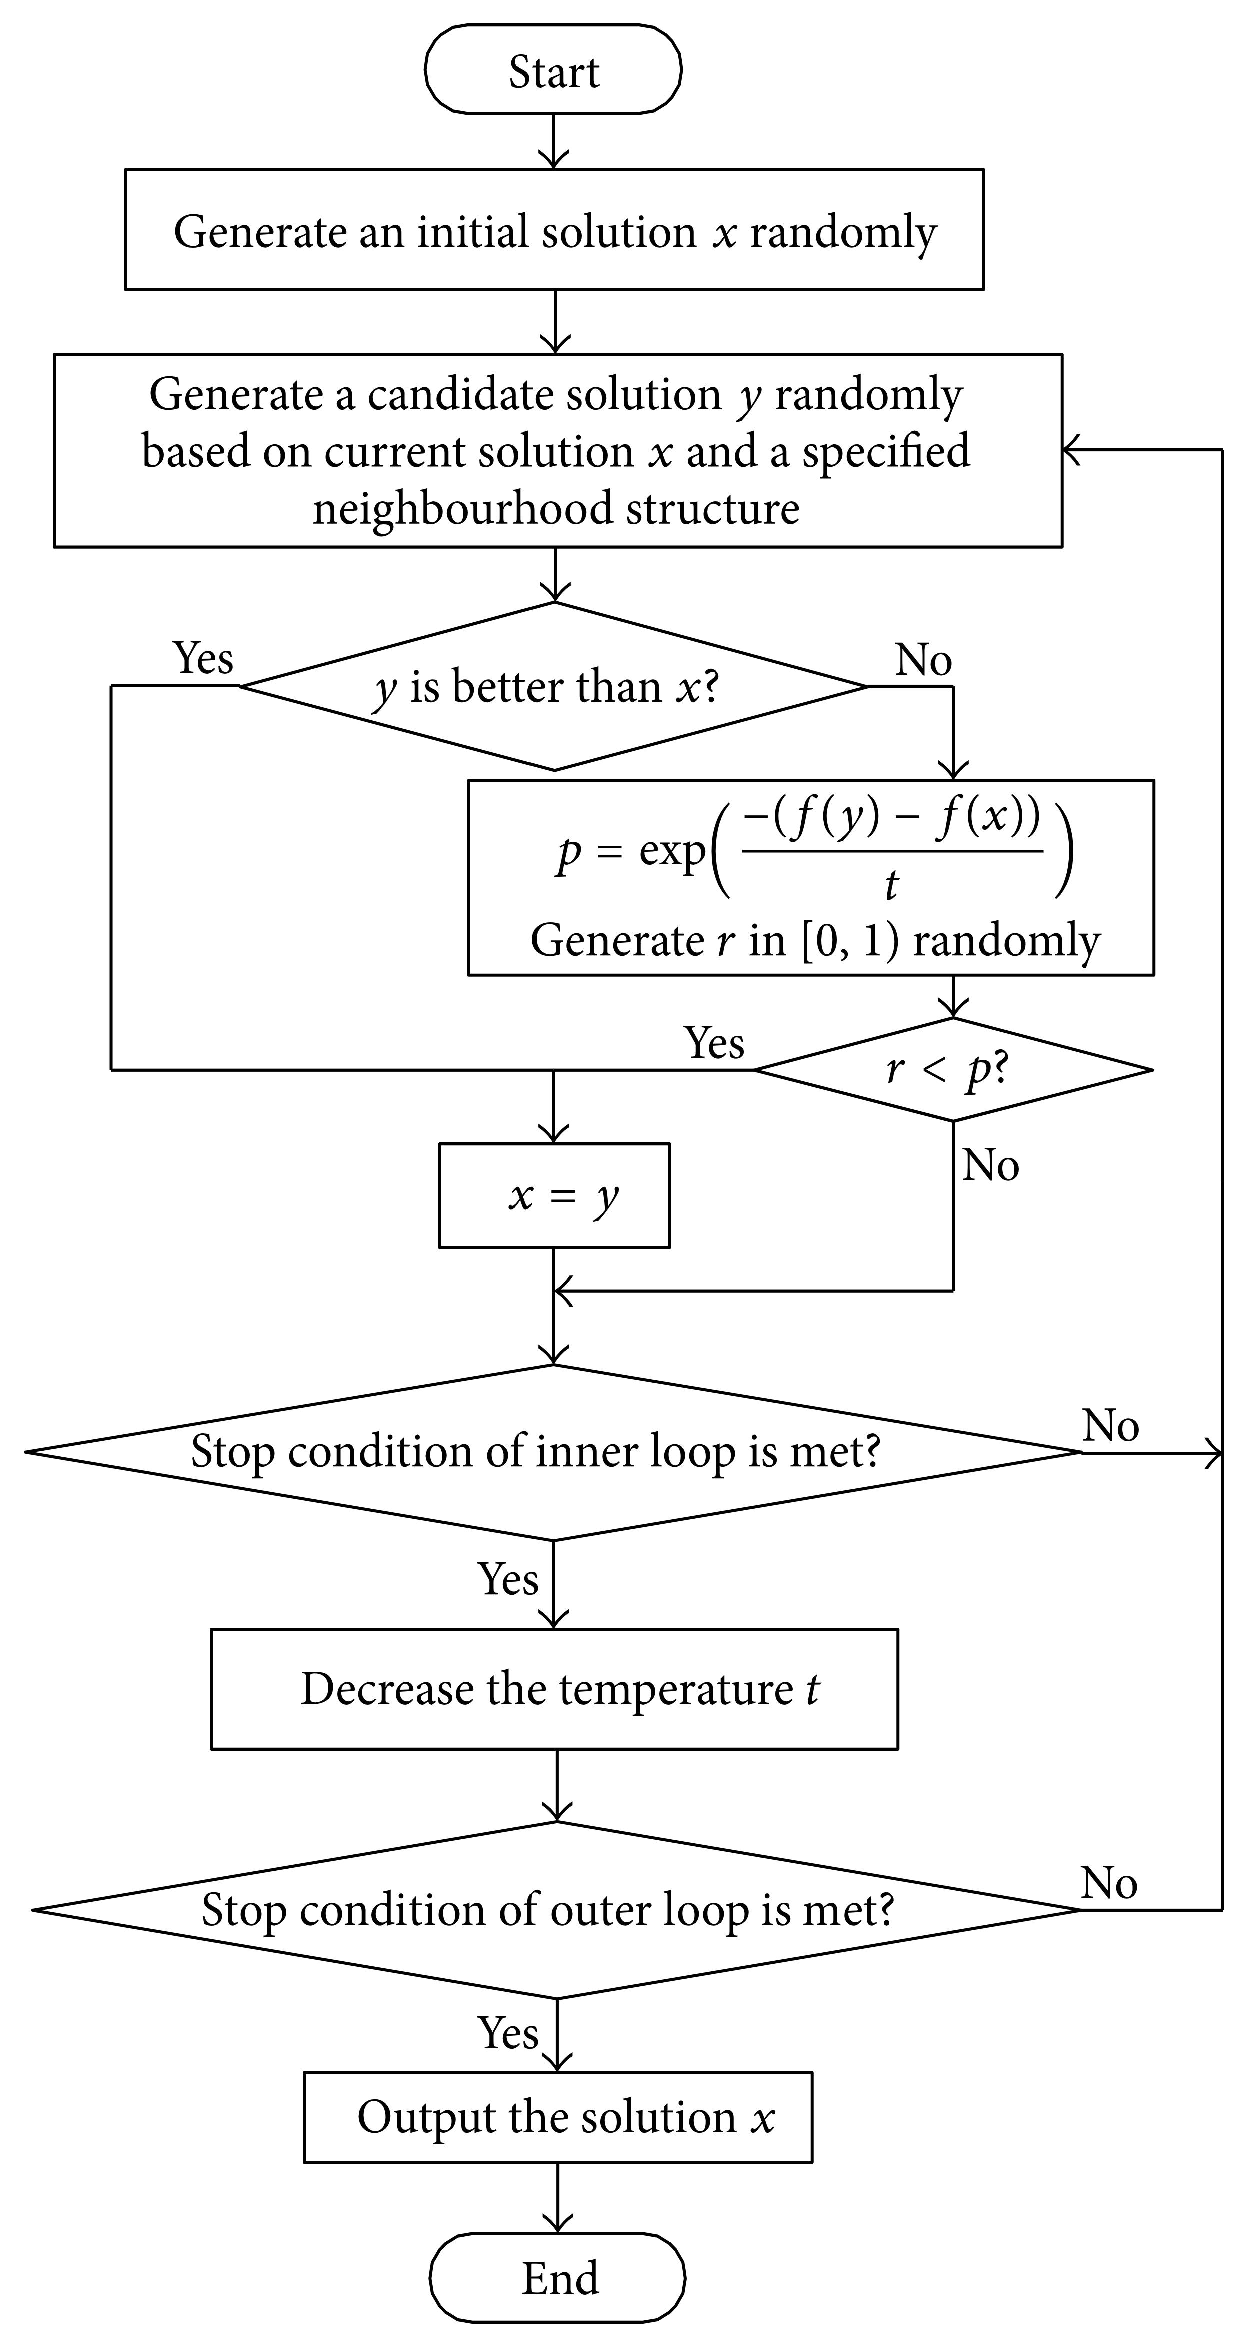
Algorithm 1 Simulated annealing traveling salesman (SATS).
Inputs: 
d a t a = Array of all target coordinates beginning and ending at the launch point, with i t e r denoting the desired number of iterations, and T denoting the starting temperature
Output: An optimized array of coordinates to minimize distance
  1:
Let s i z e be the length of the input d a t a array
  2:
Let T be the starting temperature
  3:
Let E 1 and E m i n denote the starting energy
  4:
Let p a t h m i n denote the path found with the lowest energy
  5:
Let e n e r g y _ c a l c ( ) denote an outer function that calculates the energy of an array of coordinates using the point-distance formula and return the result
  6:
while  T > 1  do
  7:
   for  i = 0 ; i < i t e r ; i + +  do
  8:
     if  E 1 < E m i n  then
  9:
          E m i n = E 1
10:
     end if
11:
      r a n d _ i n d e x = r a n d i n t ( 1 , s i z e 3 )
12:
      p a t h t e m p = p a t h m i n
13:
      p a t h t e m p [ r a n d _ i n d e x ] = p a t h m i n [ r a n d _ i n d e x + 1 ]
14:
      p a t h t e m p [ r a n d _ i n d e x + 1 ] = p a t h m i n [ r a n d _ i n d e x ]
15:
      E 2 = e n e r g y _ c a l c ( p a t h t e m p )
16:
     if  E 2 < E 1  then
17:
          E 1 = E 2
18:
          p a t h m i n = p a t h t e m p
19:
     else
20:
          m a c = exp E 2 E 1 T
21:
         if  m a c > r a n d ( )  then
22:
              E 1 = E 2
23:
              p a t h m i n = p a t h t e m p
24:
         end if
25:
     end if
26:
   end for
27:
    T = 0.99 × T
28:
end while
29:
return  p a t h m i n
Algorithm 2 Coordinate calibration algorithm (CCA).
    Inputs:
Q R = fan identification per QR code
t a r g e t _ f a n = identification of expected fan to be found
    Outputs:
d r o n e _ x _ c o o r d i n a t e = newly updated x coordinate of drone
d r o n e _ y _ c o o r d i n a t e = newly updated y coordinate of drone
  1:
Drone moves laterally to the center fan in the camera frame and moves forward to the fan stopping in front
  2:
d r o n e _ y _ c o o r d i n a t e = y coordinate of t a r g e t _ f a n
  3:
Drone lowers in front of the fan and approaches the range of reading the QR code
  4:
if  Q R = = t a r g e t _ f a n  then
  5:
    d r o n e _ x _ c o o r d i n a t e = x coordinate of t a r g e t _ f a n 122 ( c m )
  6:
else
  7:
   Move the drone to the helipad vicinity to find the helipad and land, mission failed
  8:
end if
Algorithm 3 Robust coordinate calibration algorithm (RCCA).
    Inputs:
Q R = fan identification of the QR code scanned
t a r g e t _ f a n = identification of expected fan to be found
    Outputs:
d r o n e _ x _ c o o r d i n a t e = newly updated x coordinate of drone
d r o n e _ y _ c o o r d i n a t e = newly updated y coordinate of drone
  1:
Drone moves laterally to the center fan in the camera frame and moves forward to the fan stopping in front
  2:
d r o n e _ y _ c o o r d i n a t e = y coordinate of t a r g e t _ f a n
  3:
Drone lowers in front of the fan and approaches the range of reading the QR code
  4:
if  Q R = = t a r g e t _ f a n  then
  5:
    d r o n e _ x _ c o o r d i n a t e = x coordinate of t a r g e t _ f a n 122 ( c m )
  6:
else
  7:
    d r o n e _ x _ c o o r d i n a t e = x coordinate of fan with Q R 122 ( c m )
  8:
    d r o n e _ y _ c o o r d i n a t e = y coordinate of fan with Q R
  9:
   Use updated coordinates to move the drone to the current progress in the optimized path and reattempt detection of t a r g e t _ f a n
10:
end if
Algorithm 4 Snake path flight algorithm (SPFA).
    Inputs:
x _ s t e p = Step length the drone moves forward and backward
y _ s t e p = Step length the drone moves left
x _ b o u n d a r y = x -axis boundary of experiment
y _ b o u n d a r y = y -axis boundary of experiment
    Functions:
c h e c k _ f o r _ f a n s ( )
    if there are no fans detected in the frame then
        return
    else
        Move the drone laterally to center the fan in the frame
        Move the drone forward toward the fan, stopping in close proximity
        Lower the drone and move closer to the fan to be in range to read the QR code
        Once the QR code is in a readable range and scanned, raise the drone back to the original height
    end if
  1:
Let the starting location of the drone be ( 0 , 0 )
  2:
while drone’s y coordinate y _ b o u n d a r y  do
  3:
   while drone’s x coordinate x _ s t e p + x _ b o u n d a r y  do
  4:
      c h e c k _ f o r _ f a n s ( )
  5:
     Move the drone forward by x _ s t e p
  6:
   end while
  7:
   if drone’s y coordinate + y _ s t e p y _ b o u n d a r y  then
  8:
     Move the drone left by y _ s t e p
  9:
   else
10:
     break
11:
   end if
12:
   while drone’s x coordinate x _ s t e p 0  do
13:
      t e m p _ x _ c o o r d i n a t e = drone’s x coordinate
14:
      c h e c k _ f o r _ f a n s ( )
15:
     Move the drone back to t e m p _ x _ c o o r d i n a t e
16:
     Move the drone back x _ s t e p
17:
   end while
18:
    t e m p _ x _ c o o r d i n a t e = drone’s x coordinate
19:
    c h e c k _ f o r _ f a n s ( )
20:
   Move the drone back to t e m p _ x _ c o o r d i n a t e
21:
   if drone’s y coordinate + y _ s t e p y _ b o u n d a r y  then
22:
     Move the drone left by y _ s t e p
23:
   else
24:
     break
25:
   end if
26:
end while

2. Previous Related Works

In our previous work [32], object detection of the fans via Haar feature-based cascade classifiers was used; the training included many positive and negative images of the pedestal fans, where the bounding box annotations just encompassed the circular cage around the blades. The ML model was then applied to frames received from the drone to return images of bounding boxes over each detected object in the frame, and the distance of the fans to the drone was calculated utilizing the bounding boxes obtained.
In the proceeding work [33], the drone approached fans of an area using the calculated distance before lowering the drone altitude to scan the QR code attached to the pedestal. The CCM (Cartesian coordinate movement) algorithm was developed to allow the drone to operate in the Cartesian space and update its recorded coordinates. Movements, including rotation, are determined based on the coordinates and yaw of the drone and its desired position and yaw.
The work proposed here will utilize the same object detection model, distance equation, and CCM algorithm. However, unlike the previous work on this subject, the placement of the fans will be known to the algorithm prior to the launch to facilitate the simulated annealing optimization solution to the traveling salesman problem. Python scripts are employed to capture images and videos of each fan during the flight, with the media then categorized into designated folders based on the scanned QR codes. The testing phase of this case study will first run the simulated annealing on the coordinates of all targets as a solution to the traveling salesman problem before giving the optimized route to the drone to follow. The Tello EDU will visit all target locations while recalibrating its position during flights before returning to the launch point helipad. The number of targets will increase at each stage until all targets are included within the flight path. In addition, the flight time will be reported for each stage. In addition, another testing phase will proceed in which the coordinates of all targets are unknown. Thus, the drone must complete a snake exploration path to find each target in the exploration area. To make the problem even more challenging, we further consider cases where the number of targets is either known or unknown. In the known quantity scenario, the drone will return to the takeoff helipad once all targets have been found and verified. In the unknown quantity scenario, the drone will always complete the entire exploration path, return to the helipad, and report the number of unique targets discovered. Finding targets will be achieved through object detection, and to ensure that each target is unique and not previously detected, unique QR codes will be used for each target.

3. Proposed Autonomous Path Planning for Indoor Cartesian Coordinate System

This study is a continuation of a proof of concept for navigating an autonomous drone in a field of wind turbines [32,33]. For this smaller-scale concept, the targets of wind turbines will be replaced by black pedestal fans with QR codes attached near the bottom for fan identification. The fans were randomly placed within an area of interest with parameters to prevent any fan from being too close to another. The DJI Tello EDU drone was used due to its low cost, small size, and popularity as a platform for research and education [34,35]. The coordinate system of the body frame of the drone is depicted in Figure 1.
The drone had no GPU to perform ML calculations and image analysis. Instead, a local computer connected to the drone via WiFi ran a Python script that automated the flight, requiring no human input throughout its duration. The Tello SDK was connected to the drone through a Wi-Fi UDP port. While the local computer sent movement commands to the drone, the drone sent back camera frames and sensor info for the Python script to determine which action to take next. A diagram of this communication cycle can be observed in Figure 2. Since the experiment used no human input during the flight, the flight was fully autonomous, from takeoff to landing. This autonomy was performed by the movement.py script in the following link, which contains functions that combine the lower-level functions of the Tello SDK. The functions of the movement class are described in detail in the README of the GitHub link.

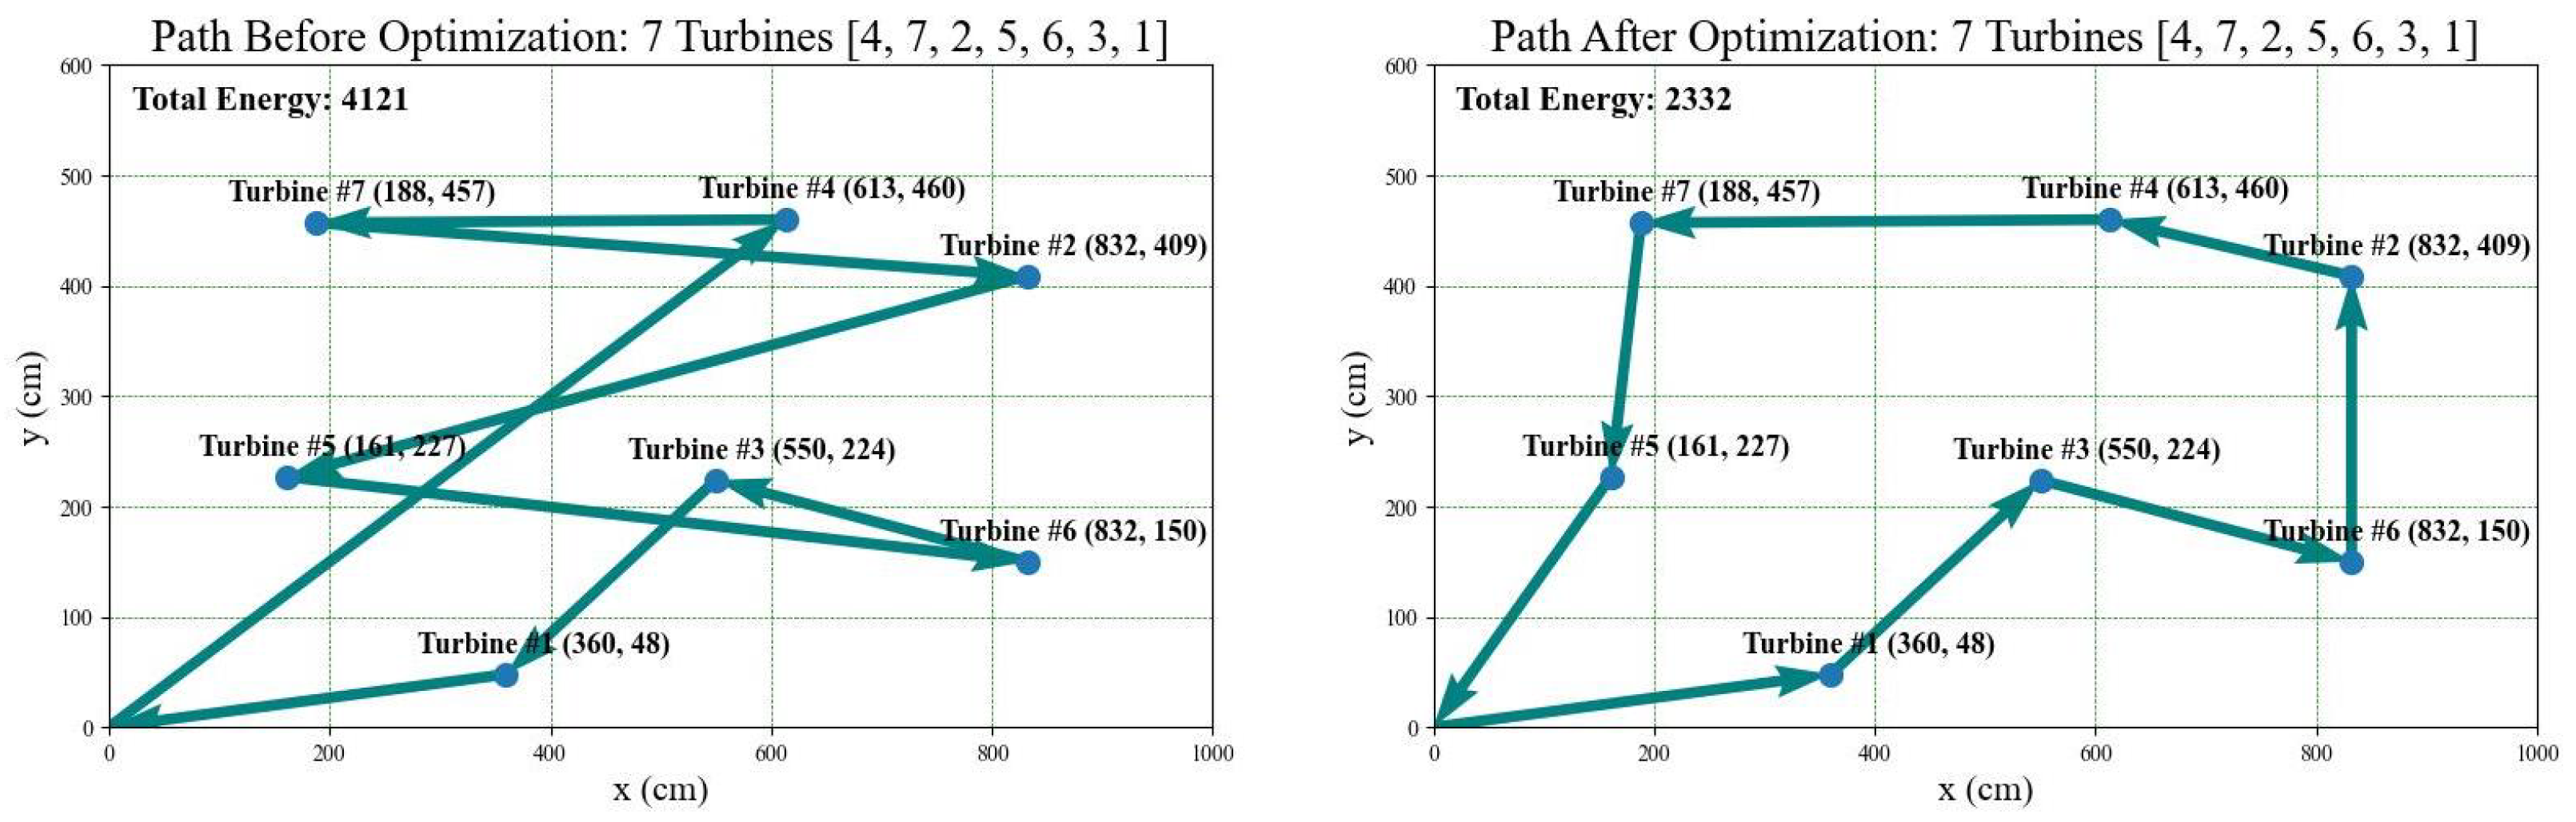
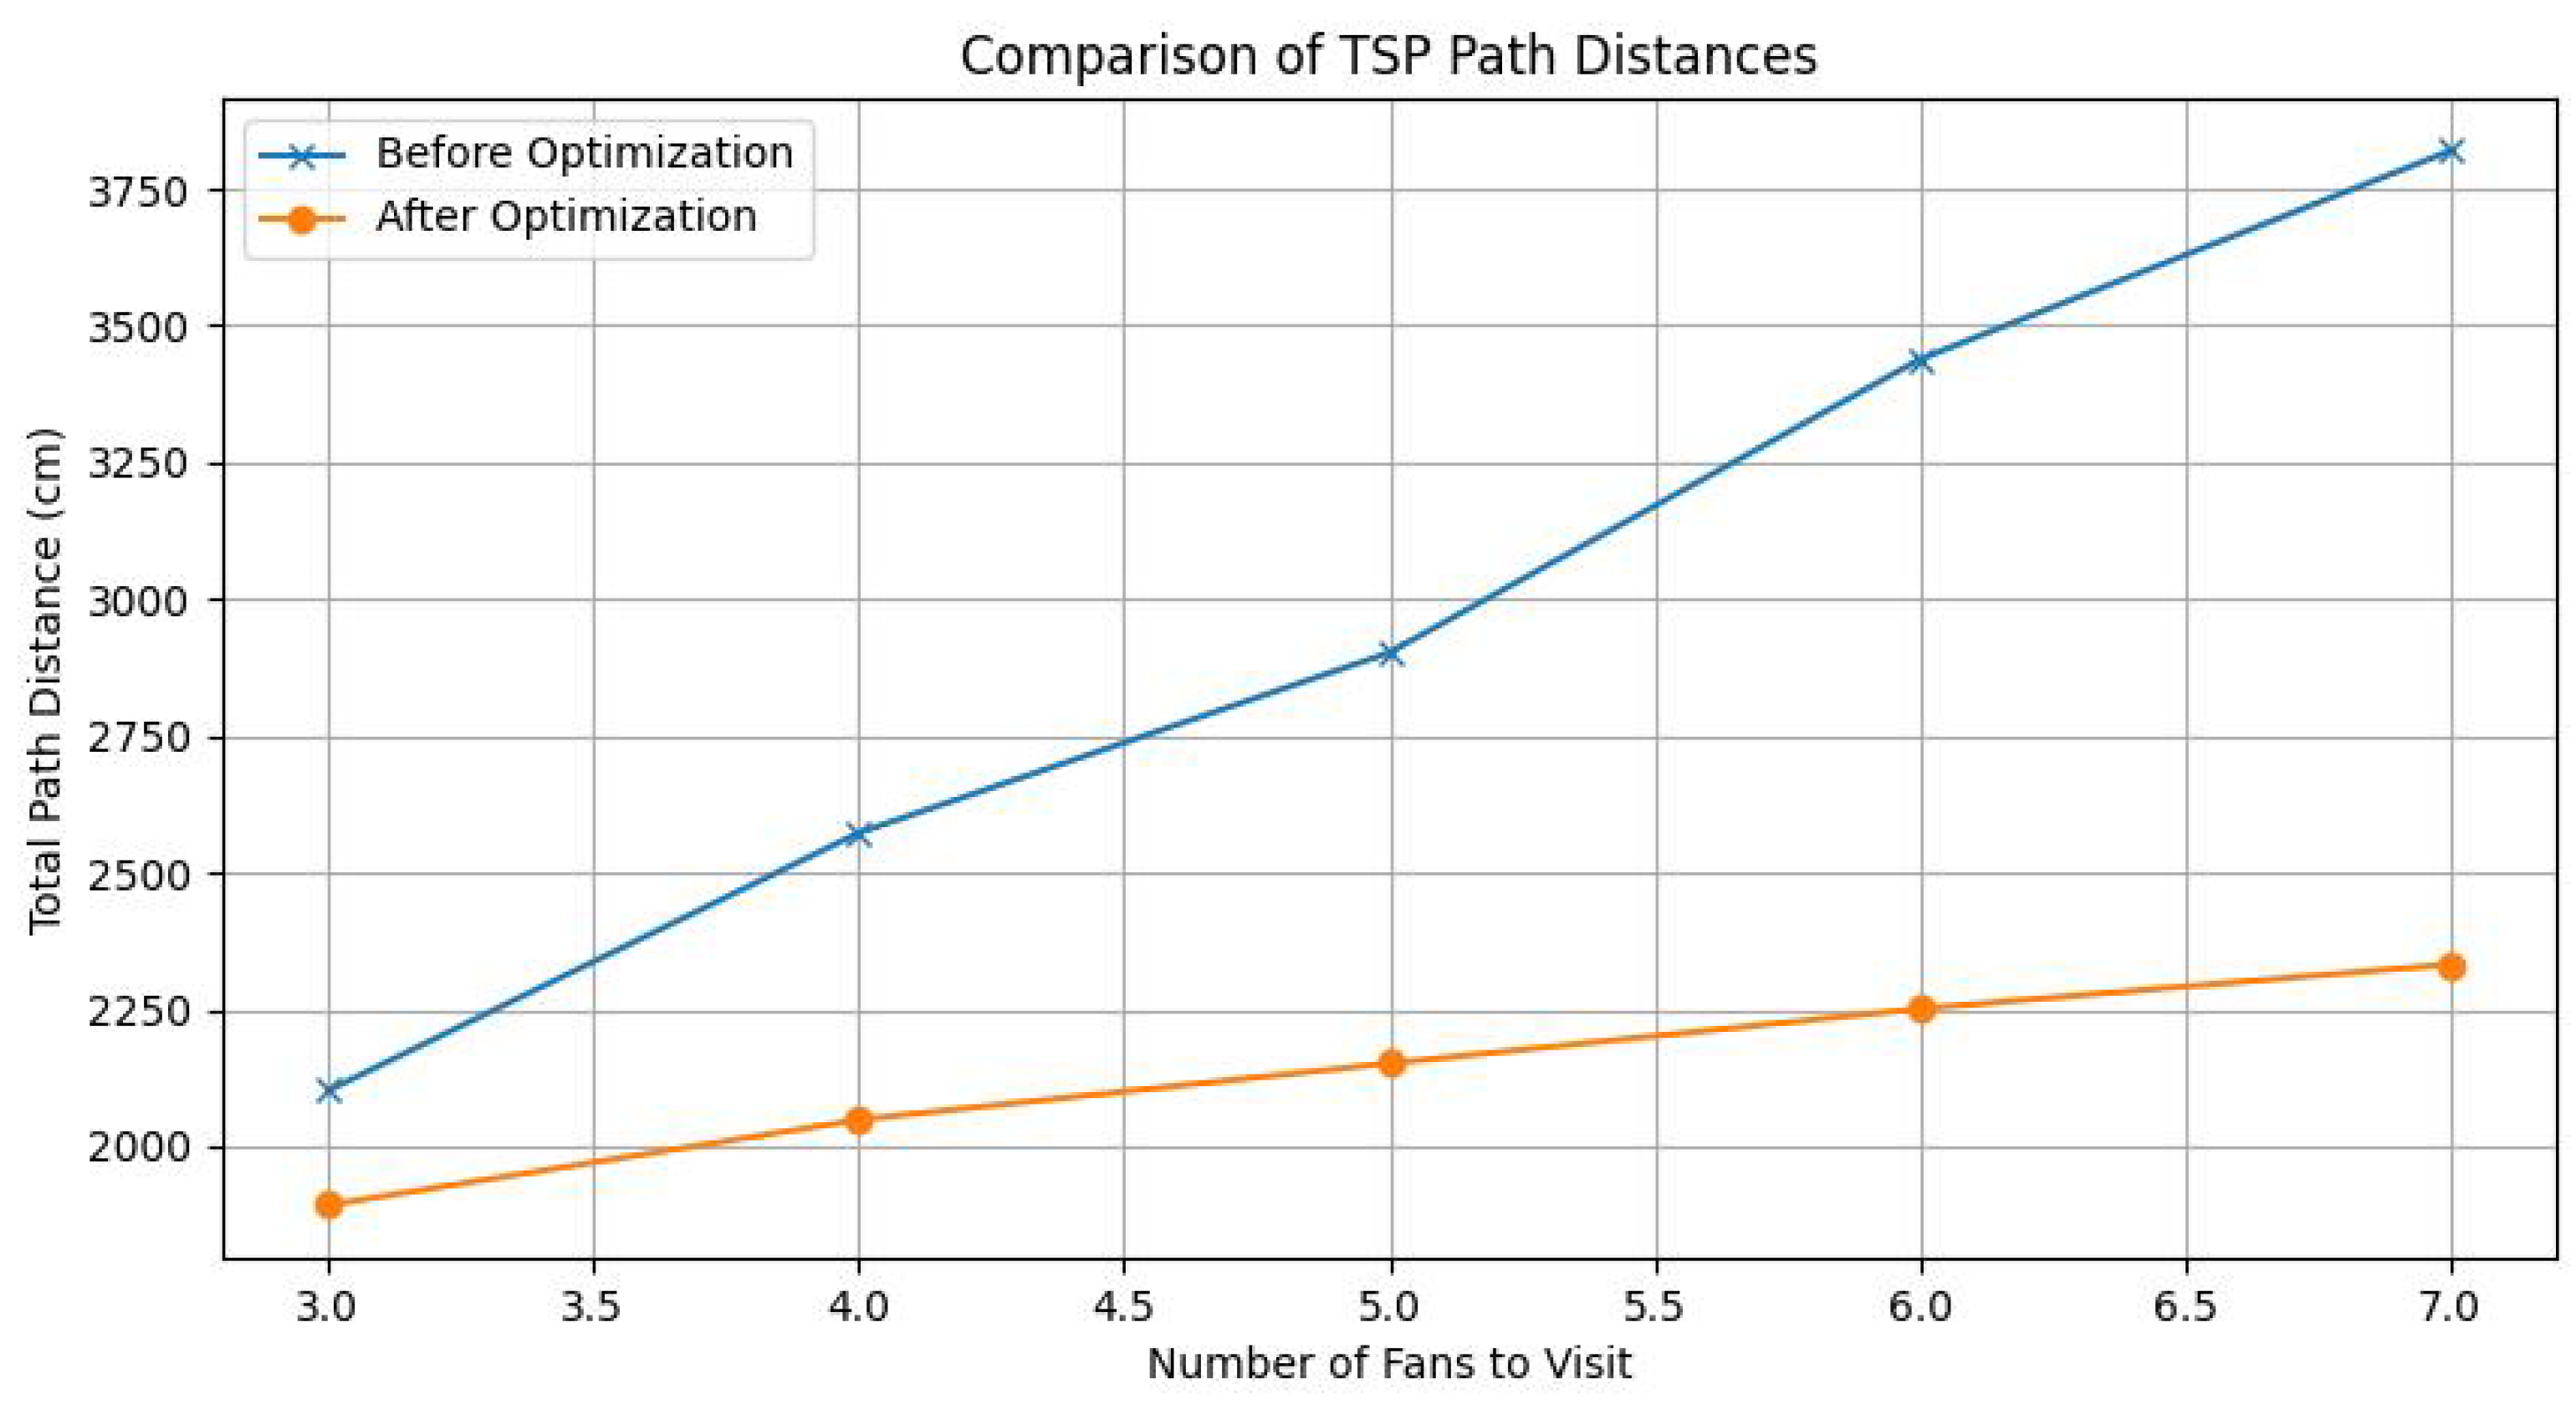
3.1. Simulated Annealing

The classic traveling salesman problem (TSP) is famous for being a deceptively simple problem in which a salesman is given a list of n cities and a means to calculate the cost of traveling between any two cities; the salesman’s route must then be planned to visit every city once while minimizing the total cost [36]. The difficulty in solving TSP stems from its computational complexity, which requires comparing every possible path permutation to find the shortest overall distance. An approach used to compute an efficient path is heuristic simulated annealing (SA), which is often compared to hill-climbing, where the algorithm accepts—within a certain probability—a neighbor worse than the current solution in an attempt to find a better overall solution, which may seem less optimized initially, similar to taking a more direct but initially more difficult approach up a hill [37].
The SA algorithm comes in varying forms, including list-based simulated annealing (LSBA), where a list-based cooling schedule schedules the decrease in temperature [38]. The LSBA is outlined in the flow chart in Figure 3. Other algorithm variations consider an array of initial temperatures and cooling schedules. A study by Nourani and Andresen considered schedules of constant thermodynamic speed, along with exponential, logarithmic, and linear cooling schedules, and found that the thermodynamic speed schedule is the most effective in reaching the lowest energies within a finite time [39]. In this study, the temperature is decreased by multiplying the current temperature by 0.99 to achieve a geometric temperature decay.

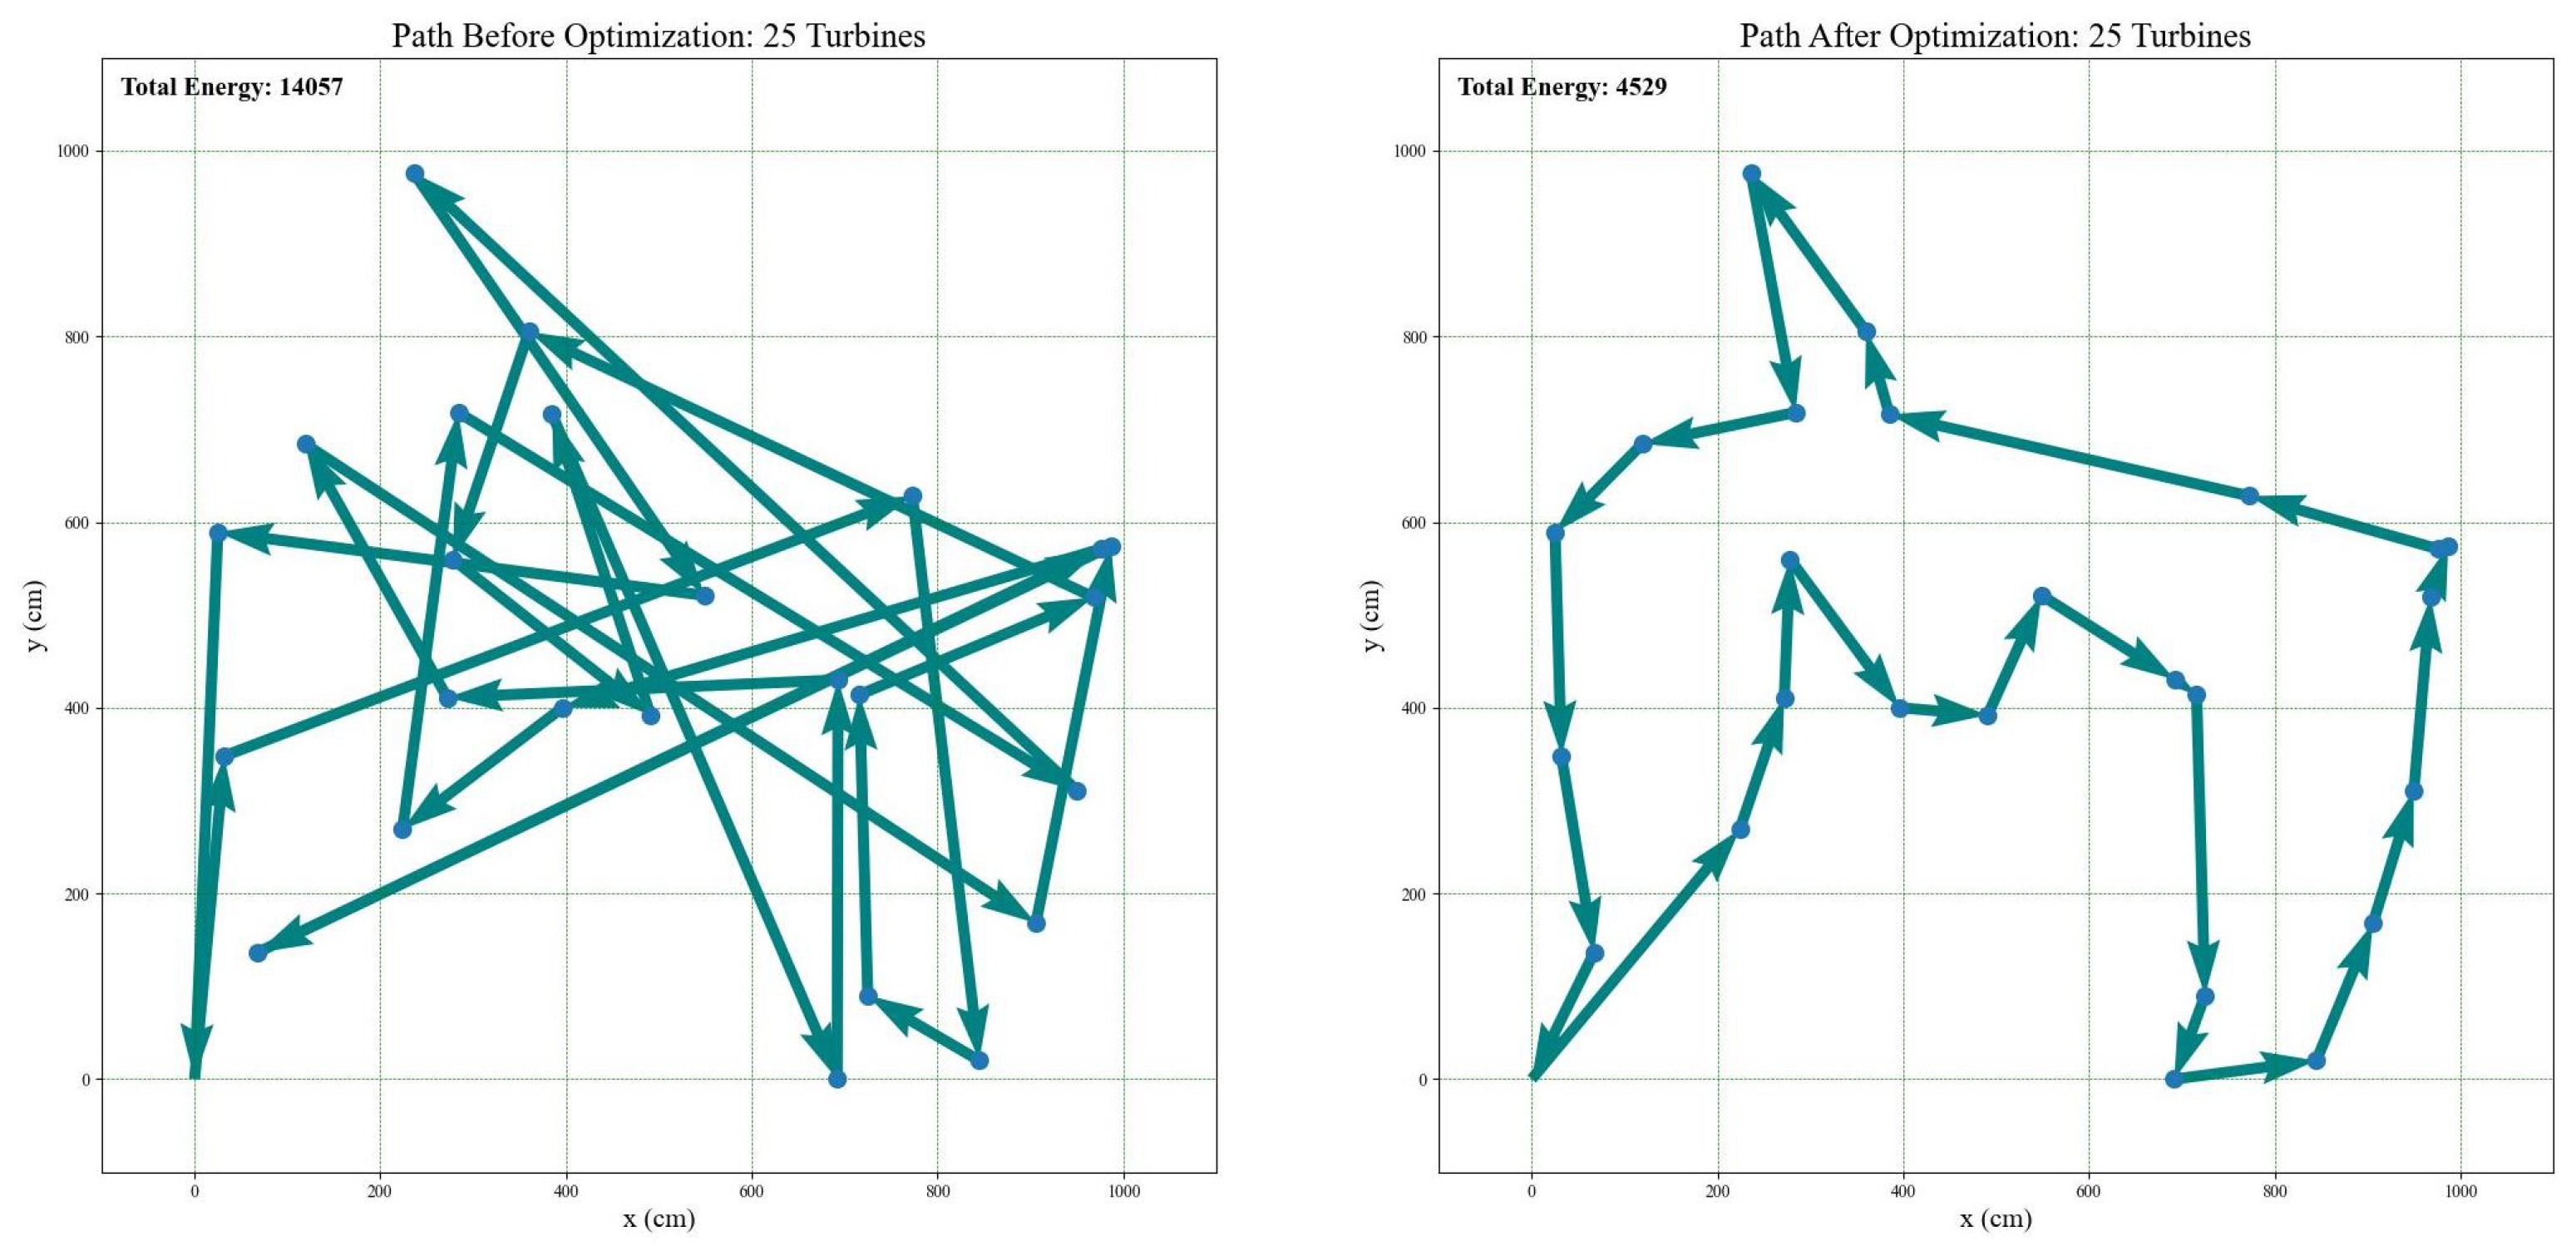
3.2. Generating Optimized Traveling Salesman Path in Python

The pseudo-code of the simulated annealing algorithm used in this study is outlined in Algorithm 1. This algorithm works by taking an array consisting of Cartesian x and y coordinates, a starting temperature, and several desired iterations for each instance of the decreasing temperature. These variables can be changed depending on the size of the input array, as a smaller array will take less computational time (and vice-versa). A separate function is also used, named e n e r g y _ c a l c ( ) , which takes the array of coordinates and calculates then returns the total distance traveled between the coordinates in the order they are presented in the array using the Euclidean distance formula.
The algorithm will randomly select two points in the array to swap, not including the first or last index, to make the resulting path cyclical. If the total energy of the new array ( E 2 ) is less than the previously recorded minimum energy ( E 1 ), then the new path is accepted as the new minimum. If not, the path may still be accepted if the metropolis acceptance criterion (mac), as seen in (1), is calculated to be less than that of a random float value less than 1 [36].
m a c = exp E 2 E 1 T
As the temperature (T) decreases within the algorithm iterations, the probability of acceptance for a less optimal outcome will also decrease. At the end of the algorithm, an array containing the optimized cyclical path of sequential points will be returned. An example of the output can be seen in Figure 4, in which a series of randomly chosen points (25 in our case) were placed into an array that begins and ends at the coordinates (0,0). The resulting total energy after optimization is reduced by approximately 68% using a beginning temperature of T = ( 150 × a r r a y _ s i z e ) and ( 30 × a r r a y _ s i z e ) iterations per temperature decrease. This results in a computational time of approximately 20 s to optimize 25, i.e., 1.55 × 10 25 possible permutations. Although we are focusing on the simulated annealing approach in our study, other heuristic methods could also be used to generate better initial routes for quicker optimization [40]. The implementation of Algorithm 1 in Python can be found in the provided GitHub repository link below.
According to the developed simulated_annealing.py script in this repository, the points are randomly chosen in a 1000 × 1000 unit area. Later on, this code will be called in traveling_salesman_geometric.py, where the visiting points are known and the resulting optimized path is given to the drone.

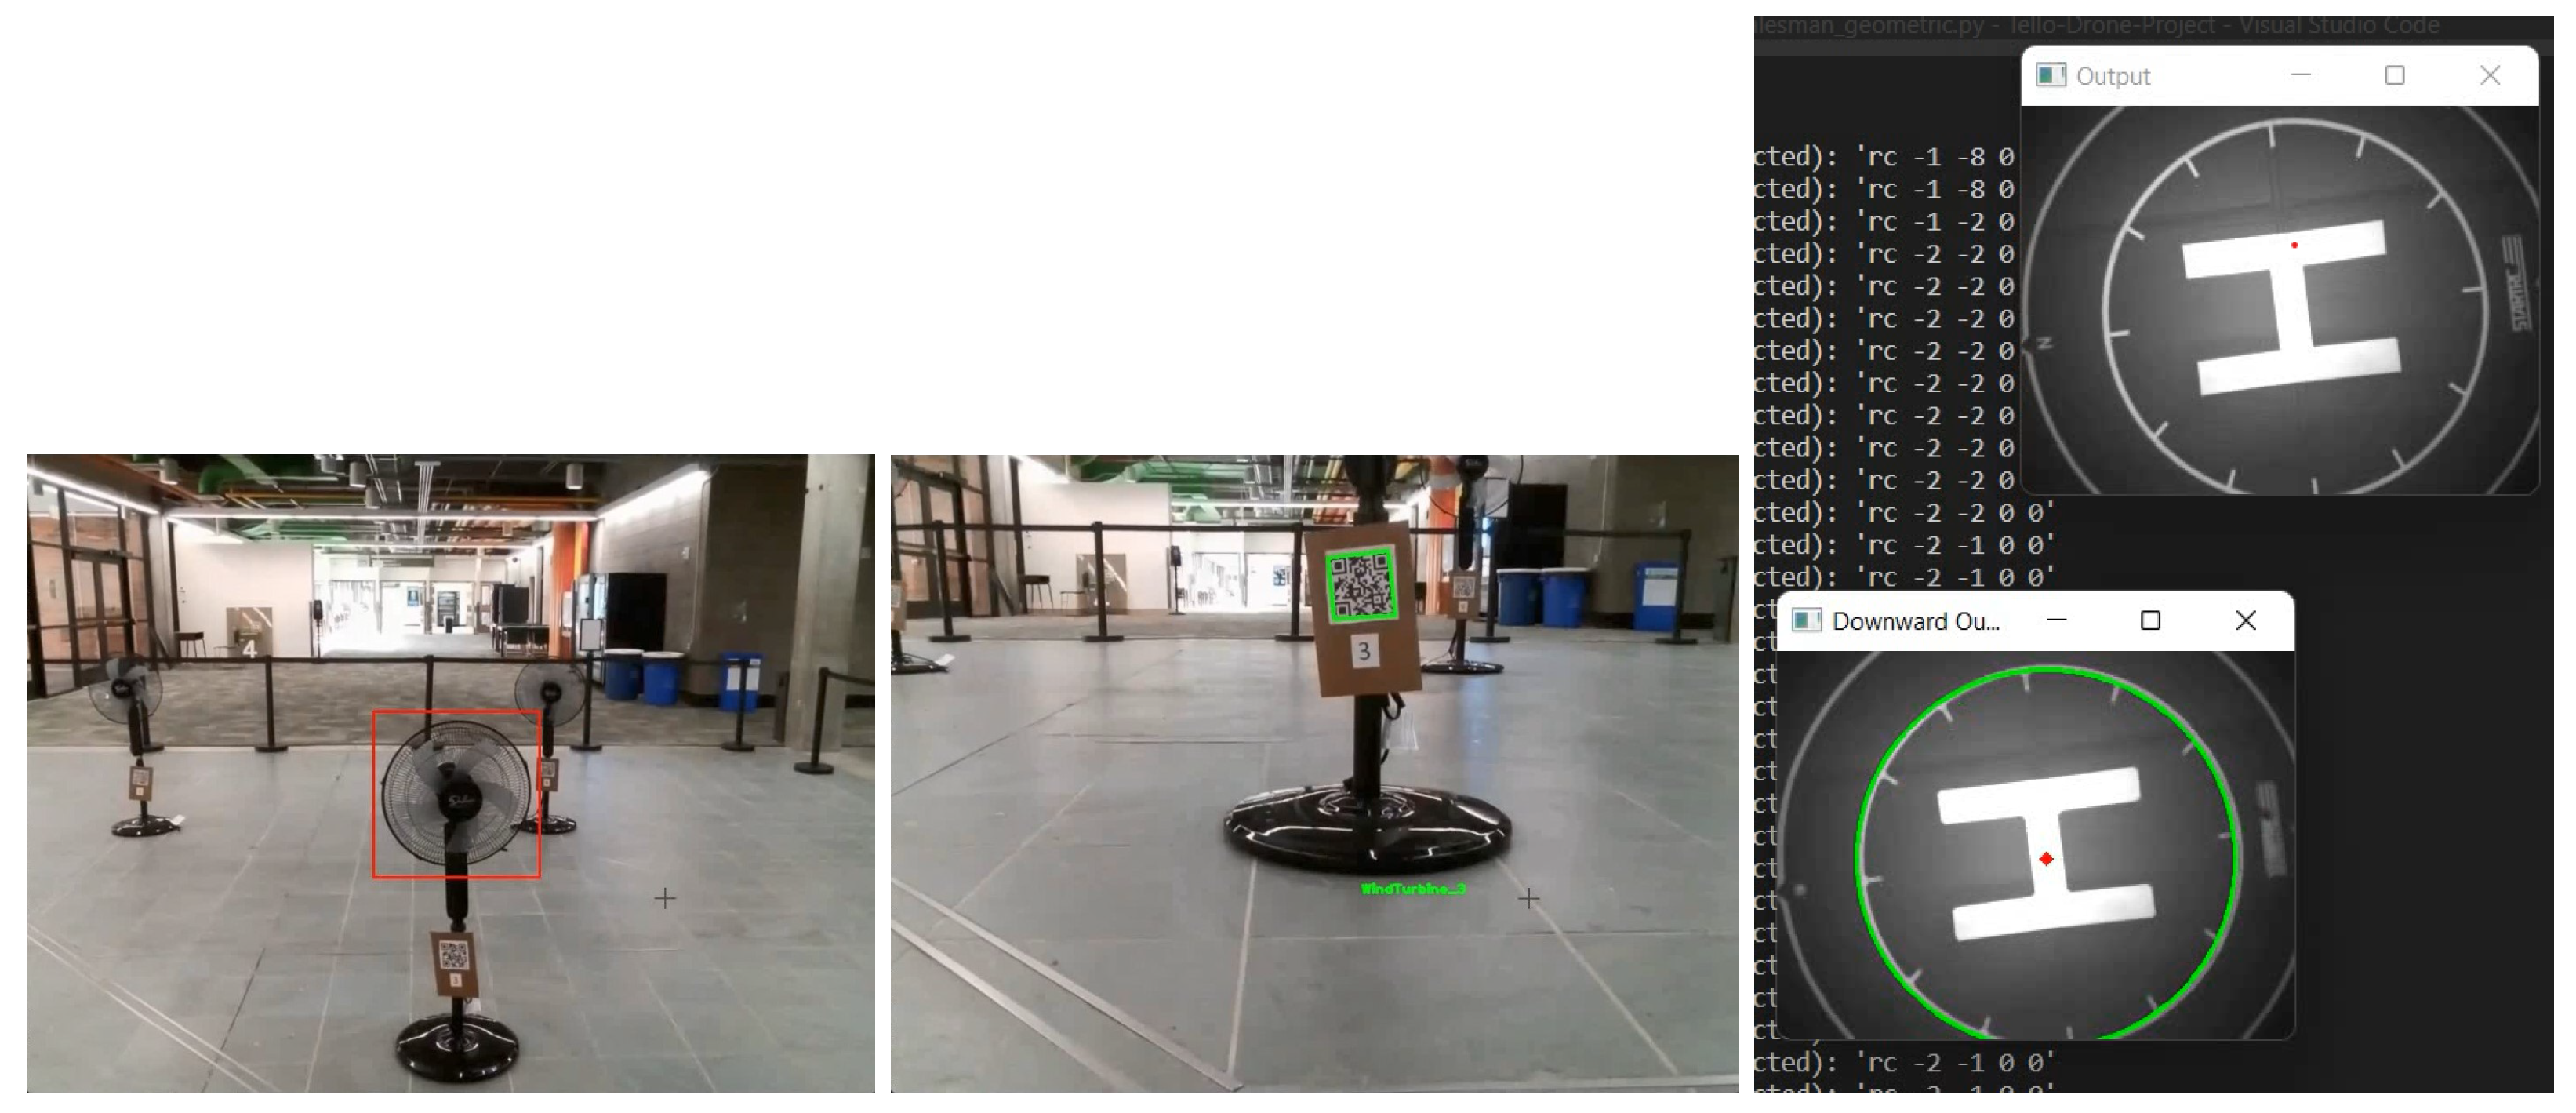
4. Proposed Computer Vision-Based Navigation

This section proposes a computer vision-based navigation system for object detection, vision positioning, and path calculations.

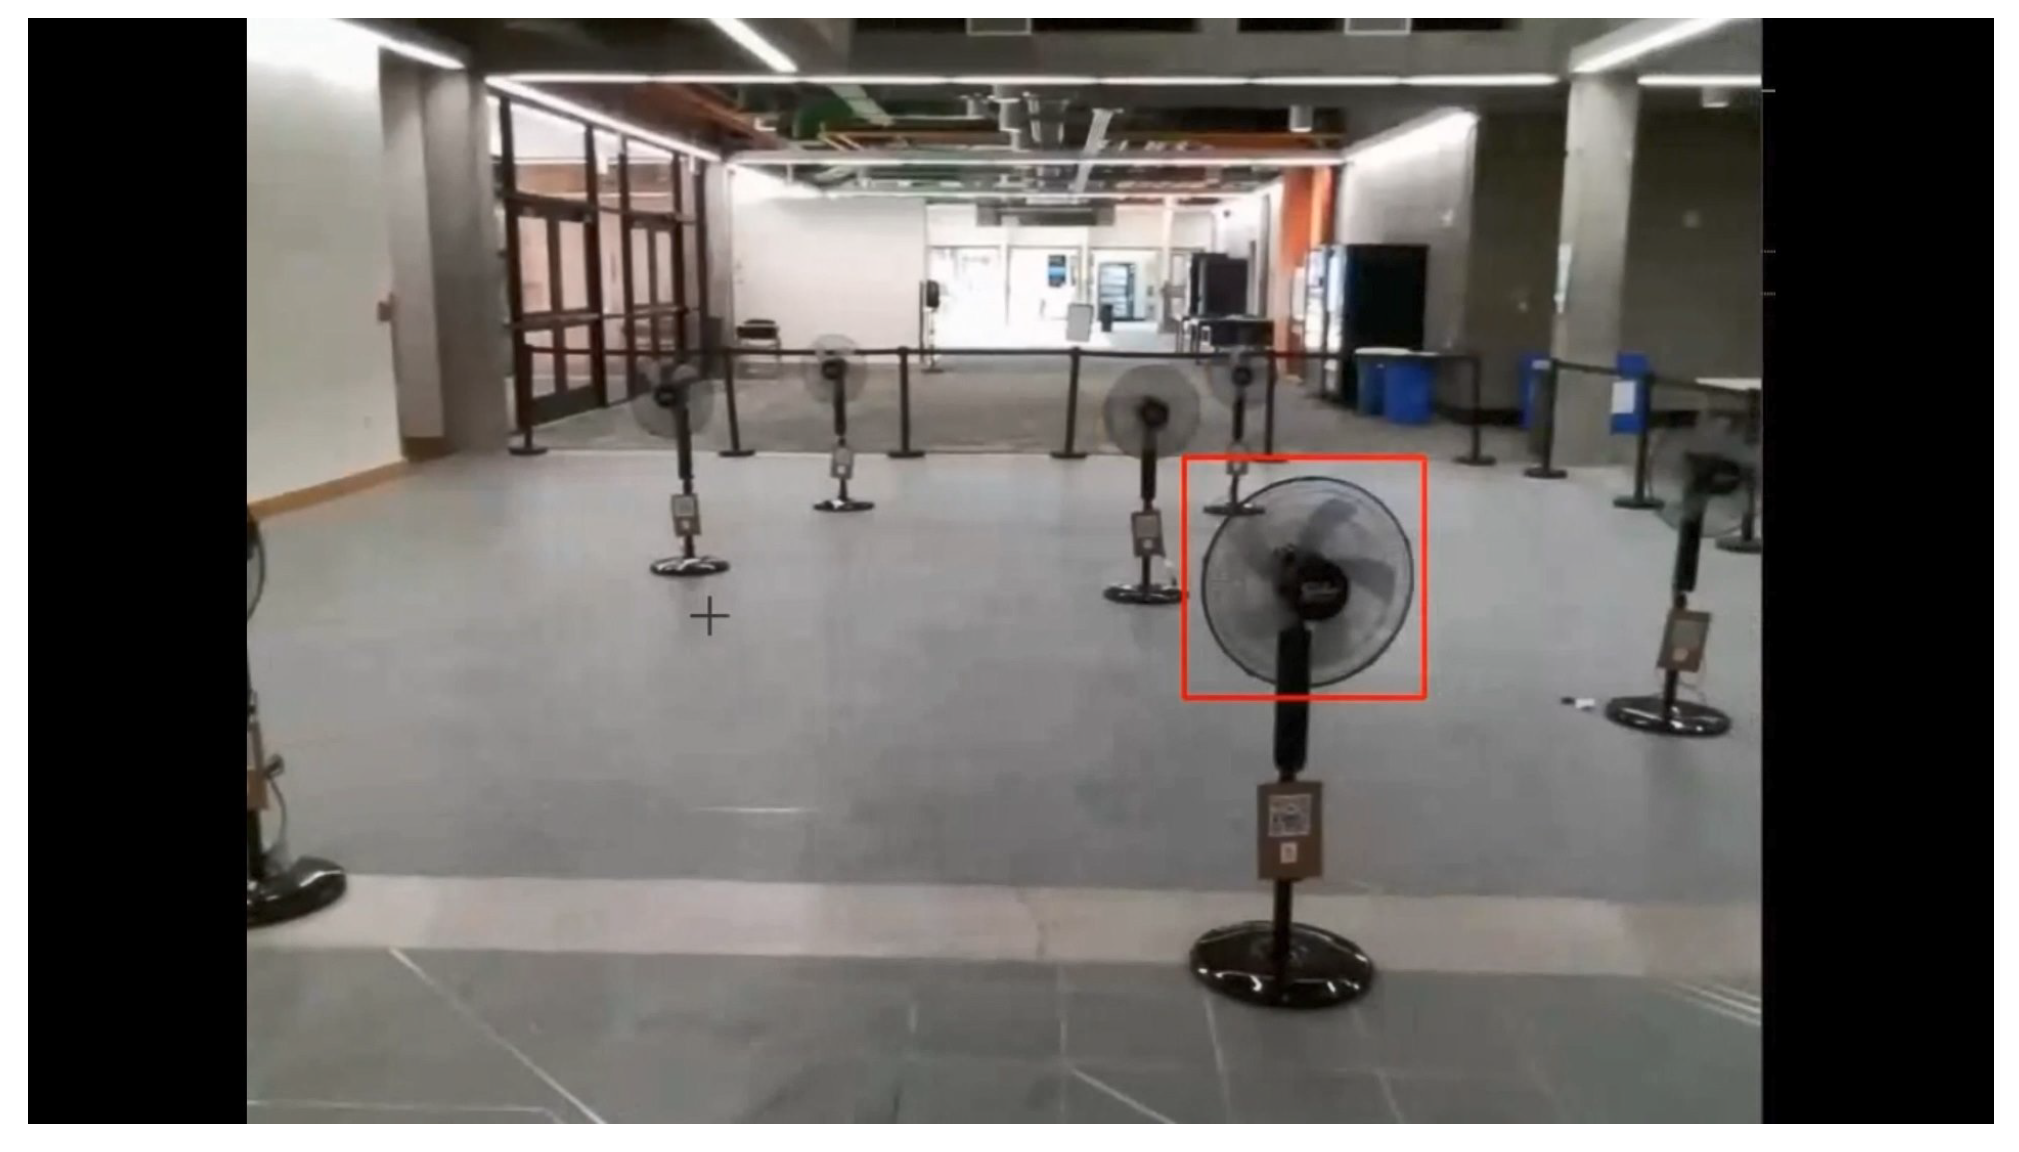
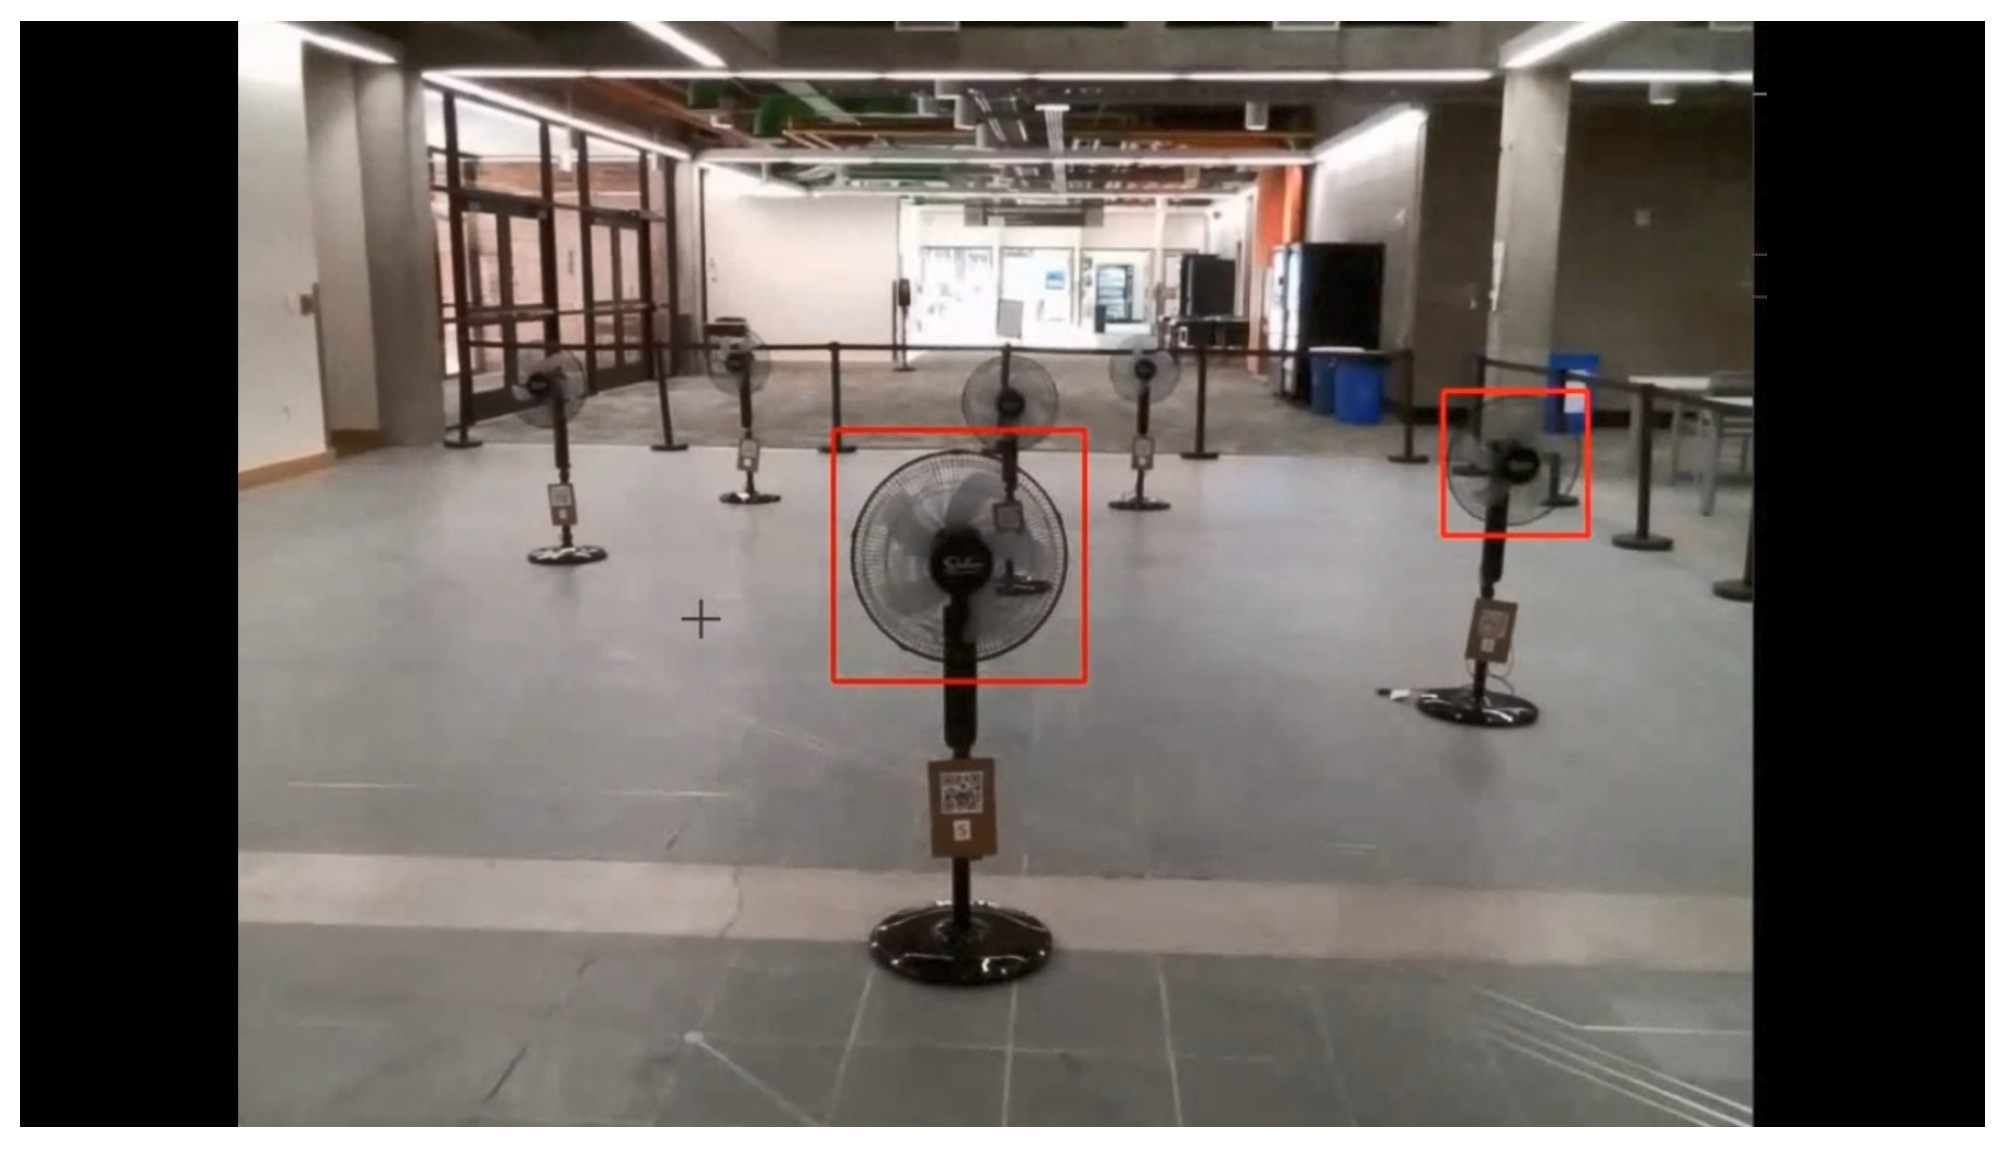
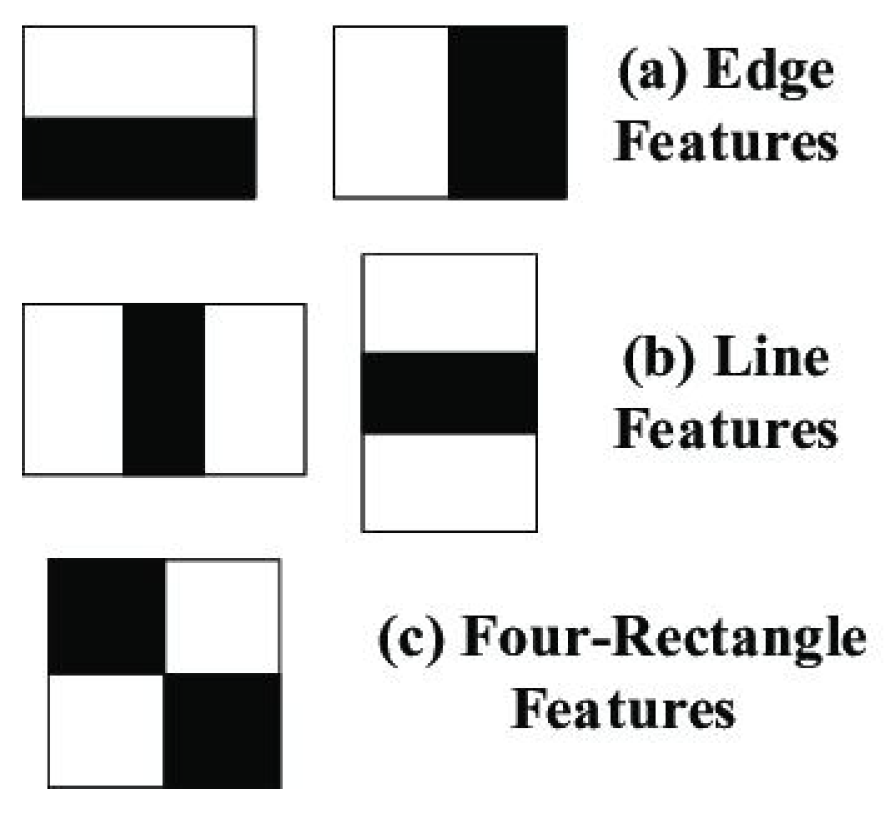
4.1. Object Detection via Cascade Classifier

OpenCV, a library of programming functions, offers object detection for real-time computer vision [41] with varying tools, such as the Haar cascade classifier algorithm [42]. The cascade classifier, introduced by Viola and Jones in 2001, is a pivotal object detection technique. It operates on a series of stages, each containing a set of weak classifiers. These classifiers, trained on subsets of Haar-like features, work collaboratively to discern objects within images. The cascade architecture ensures computational efficiency by quickly eliminating non-object regions, allowing intensive processing on potential object-containing areas. Haar-like features are rectangular filters that capture local intensity patterns in an image, such as those depicted in Figure 5. These features are instrumental in object detection as they efficiently compute the difference between pixel intensities in white and black regions. The simplicity and effectiveness of Haar features make them ideal for real-time applications, enabling the rapid evaluation of image regions to identify objects accurately.
Image annotation is a fundamental step in training cascade classifiers. Annotated images provide labeled examples of target objects, allowing the algorithm to learn distinctive features. Bounding boxes, drawn around objects of interest, serve as ground truth data for the training process. Accurate annotations are pivotal, as they directly influence the classifier’s ability to detect objects precisely. Several annotation tools simplify the annotation process, ensuring accuracy and consistency. These tools offer features such as object tracking, segmentation, and labeling. Polygon-based annotation and instance segmentation enhance annotation precision, creating high-quality datasets that are indispensable for practical classifier training.
A diverse and representative dataset is paramount for training a robust cascade classifier. The dataset should encompass various object instances, backgrounds, scales, and orientations. Careful curation of the dataset ensures that the classifier generalizes well to unseen data, enhancing its real-world applicability. The cascade classifier learns to distinguish between positive (object) and negative (non-object) instances based on the annotated dataset during training. The algorithm iteratively refines its parameters to minimize classification errors. Training involves adjusting the thresholds and weights of weak classifiers and optimizing their performance on the given dataset.
In our case, the computer vision algorithm was trained to detect the fan blades in the real-time drone imagery feed. Here, positive images would be those of the black metal encasing over the blades, while negative images would be images of the same flight environment without fans. All training images were taken from an airborne DJI Tello EDU drone. The model was trained on a dataset of positive and negative images and learned to distinguish between the two. Once the model was trained, it could classify new images as positive or negative.
The cascade classifier was then trained with OpenCV annotations for Haar feature detection. In Python, the findTurbine function was implemented whose only parameter was an image frame extracted from the front-facing drone camera. The function takes the input image, searches for the target object using an XML file, and returns the image with boundaries drawn around the detected object, the x and y values of the center of the target in the image, as well as the area of the detection boundary. The Python implementation of object detection can be found in the provided GitHub repository link below.
The script haar_cascade.py contains the function findTurbine, which uses a .xml file that contains features of the trained machine learning (ML) model to detect fans within the fed image. As a result, it draws bounding boxes over the image and returns the processed image with arrays containing bounding box widths and center pixel coordinates. Using the parameters shown in Figure 6, computer vision-based navigation can be achieved as explained in Section 4.3.

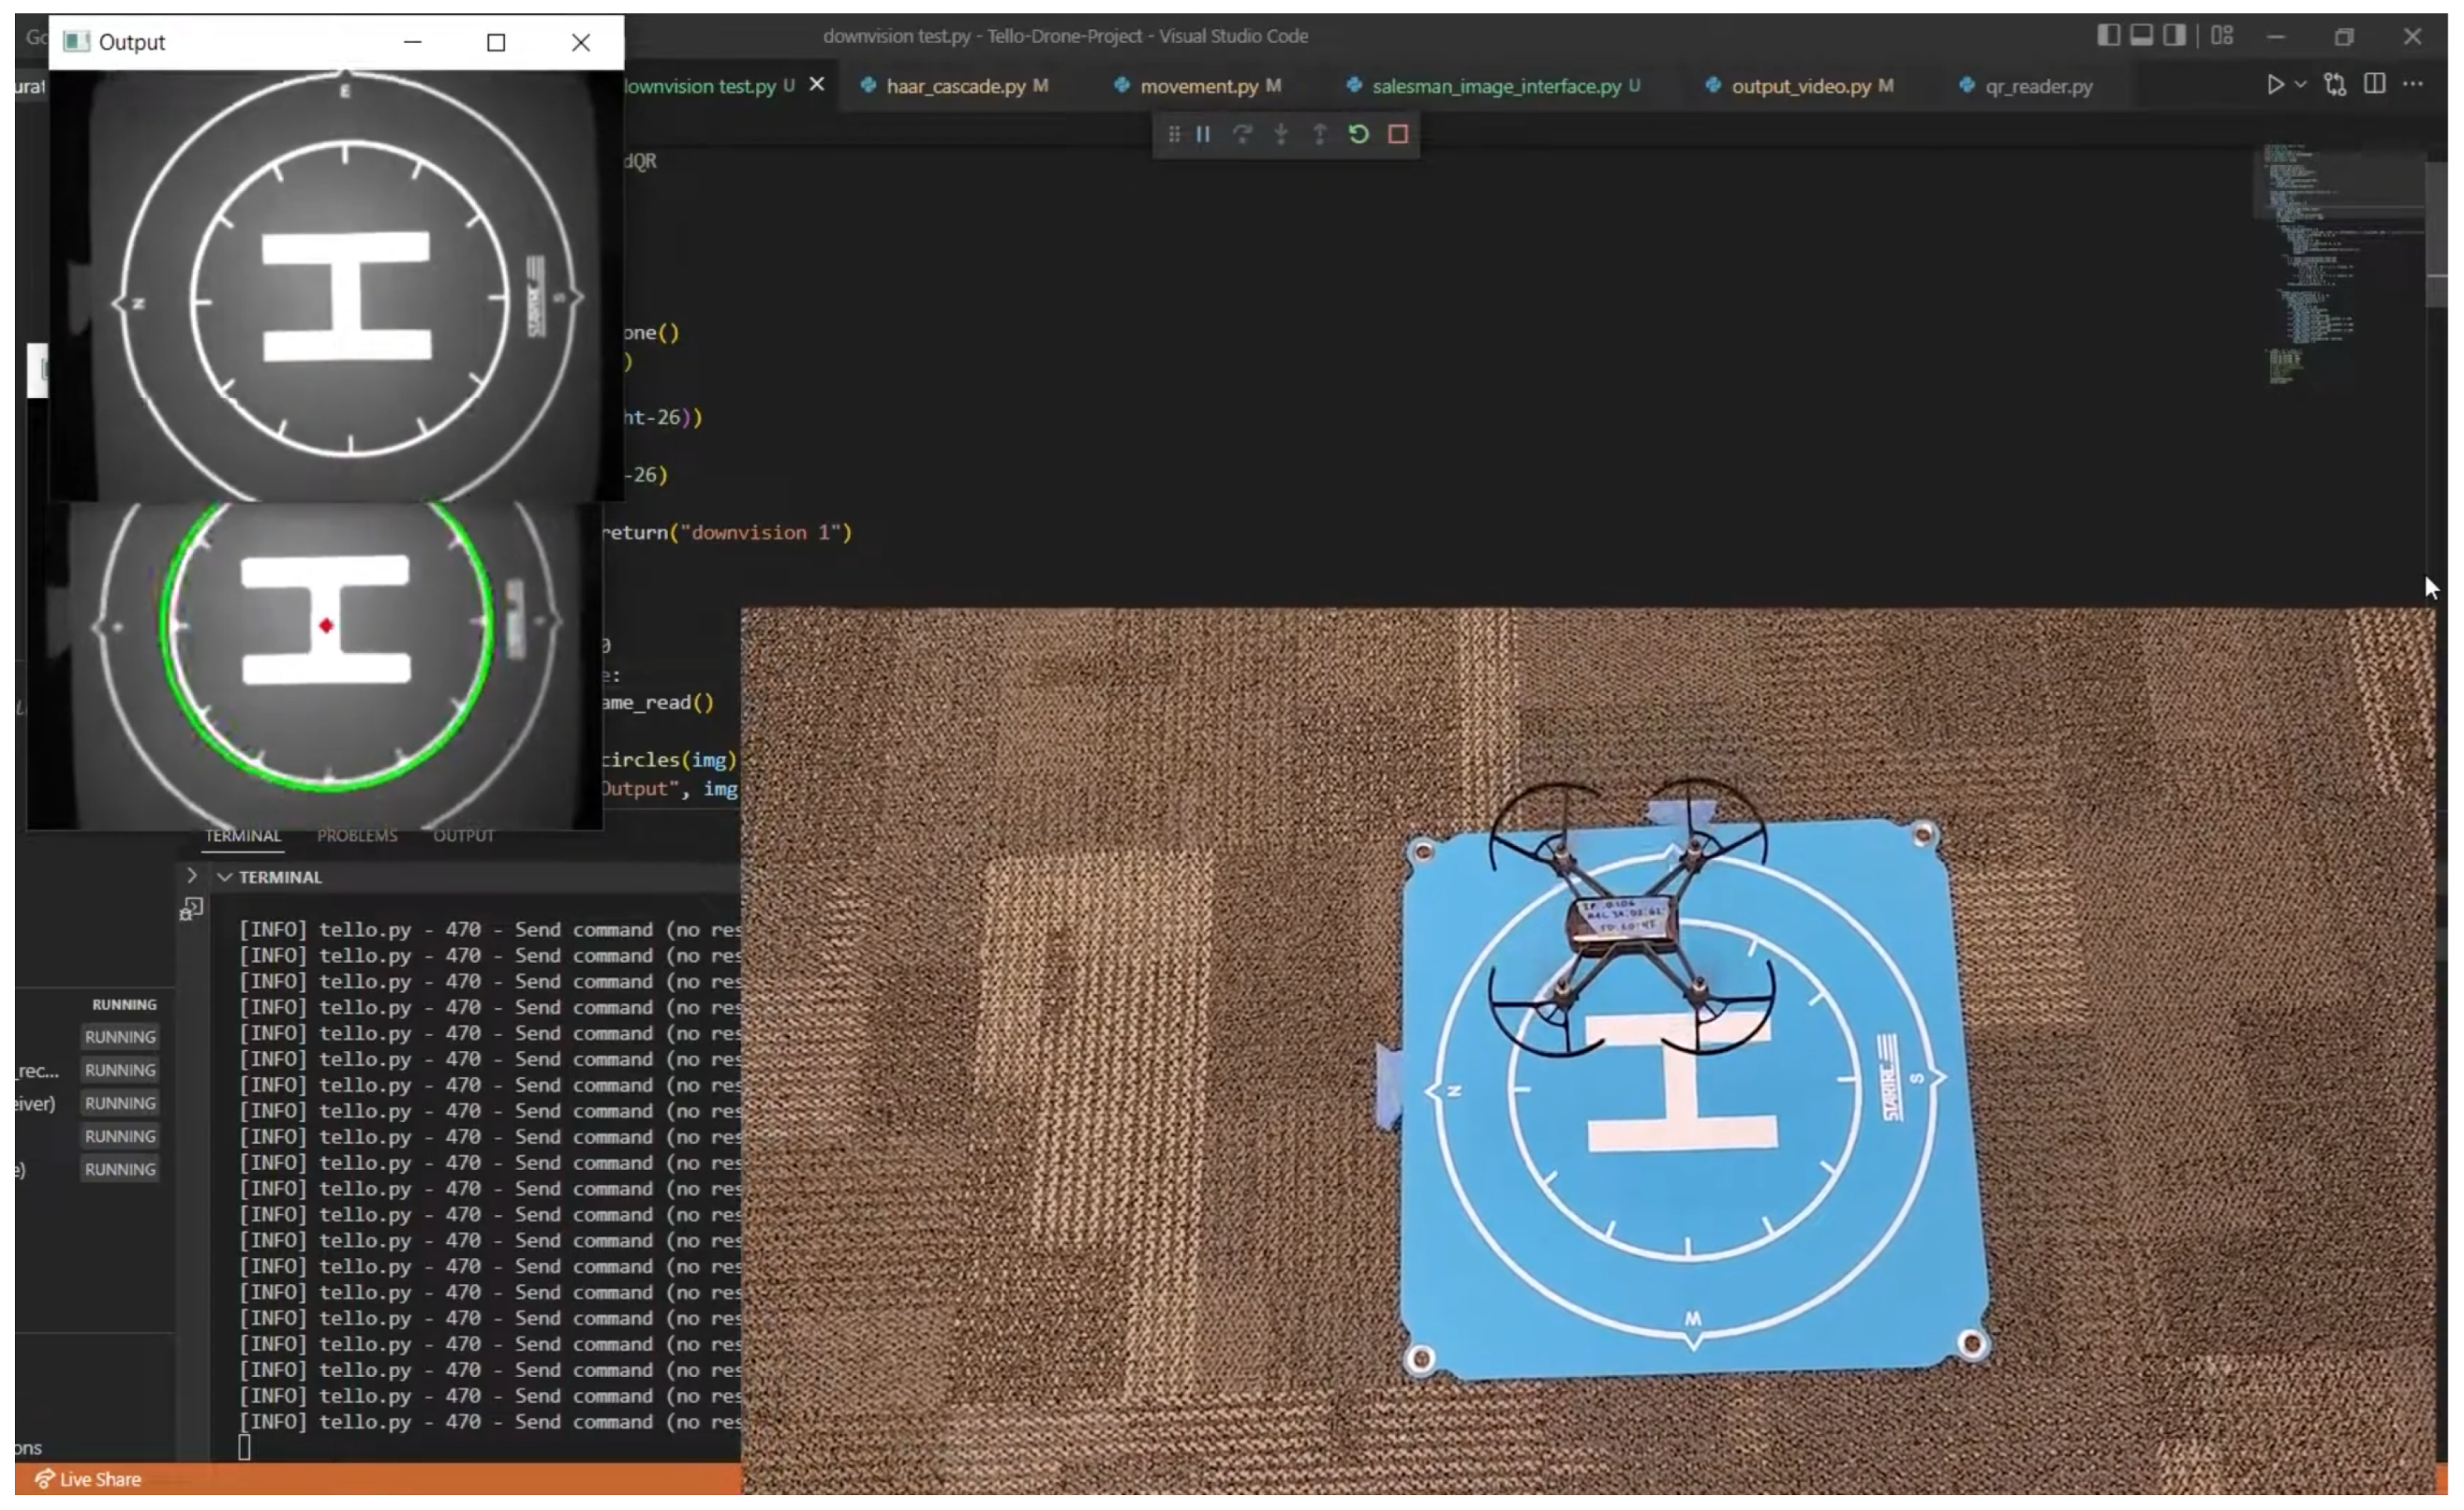
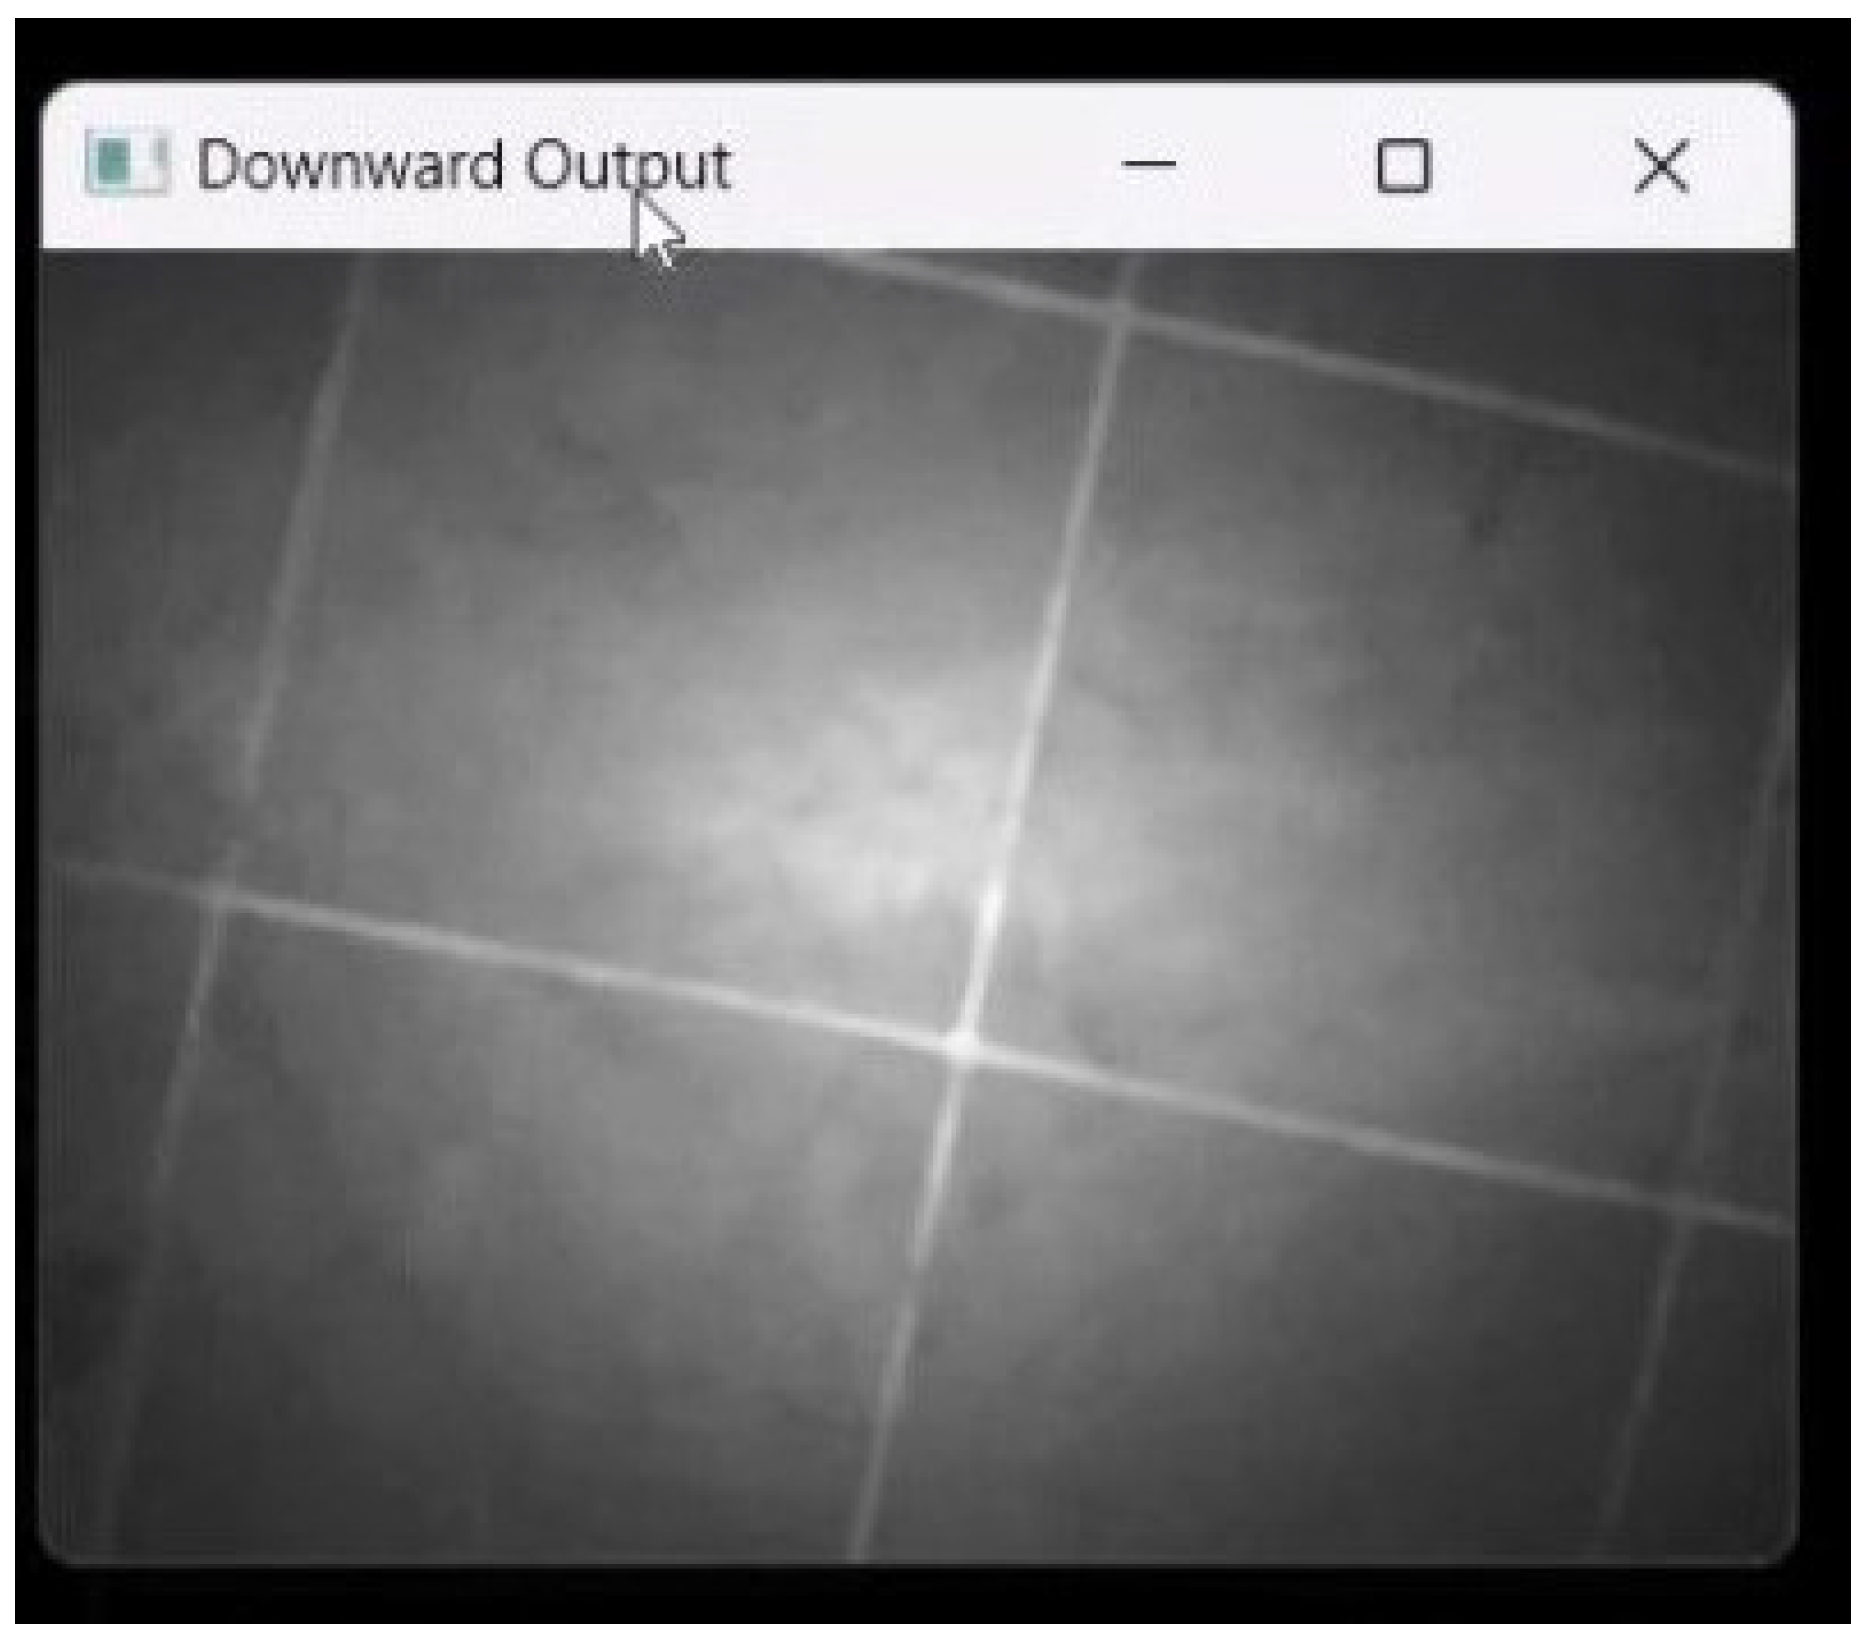
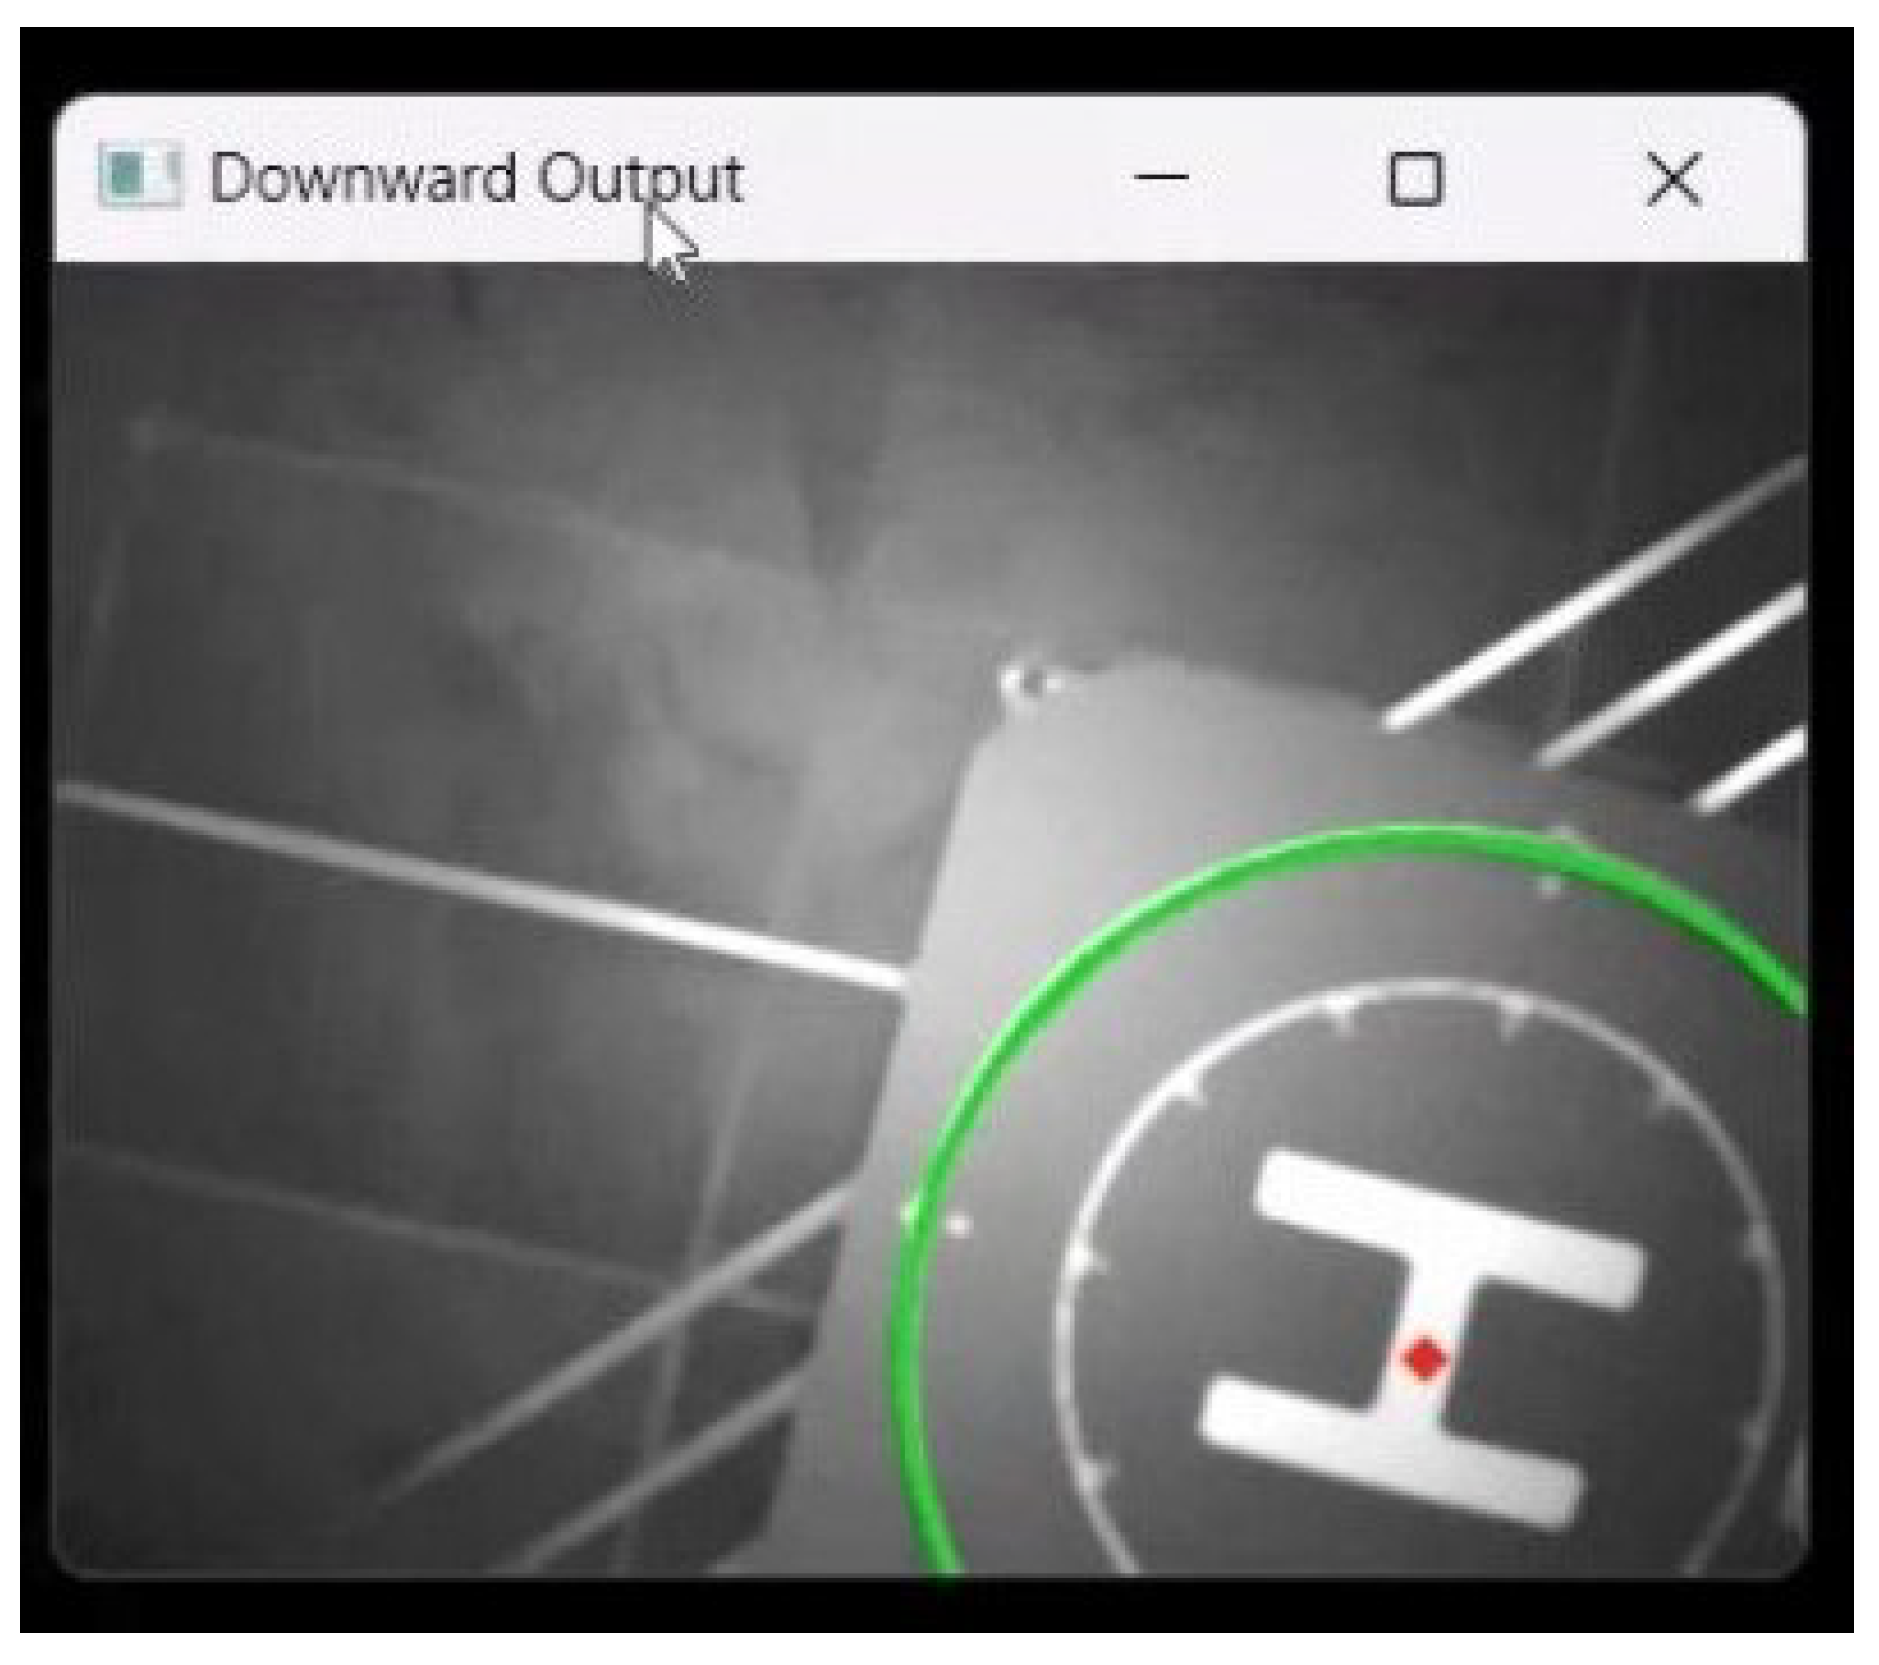
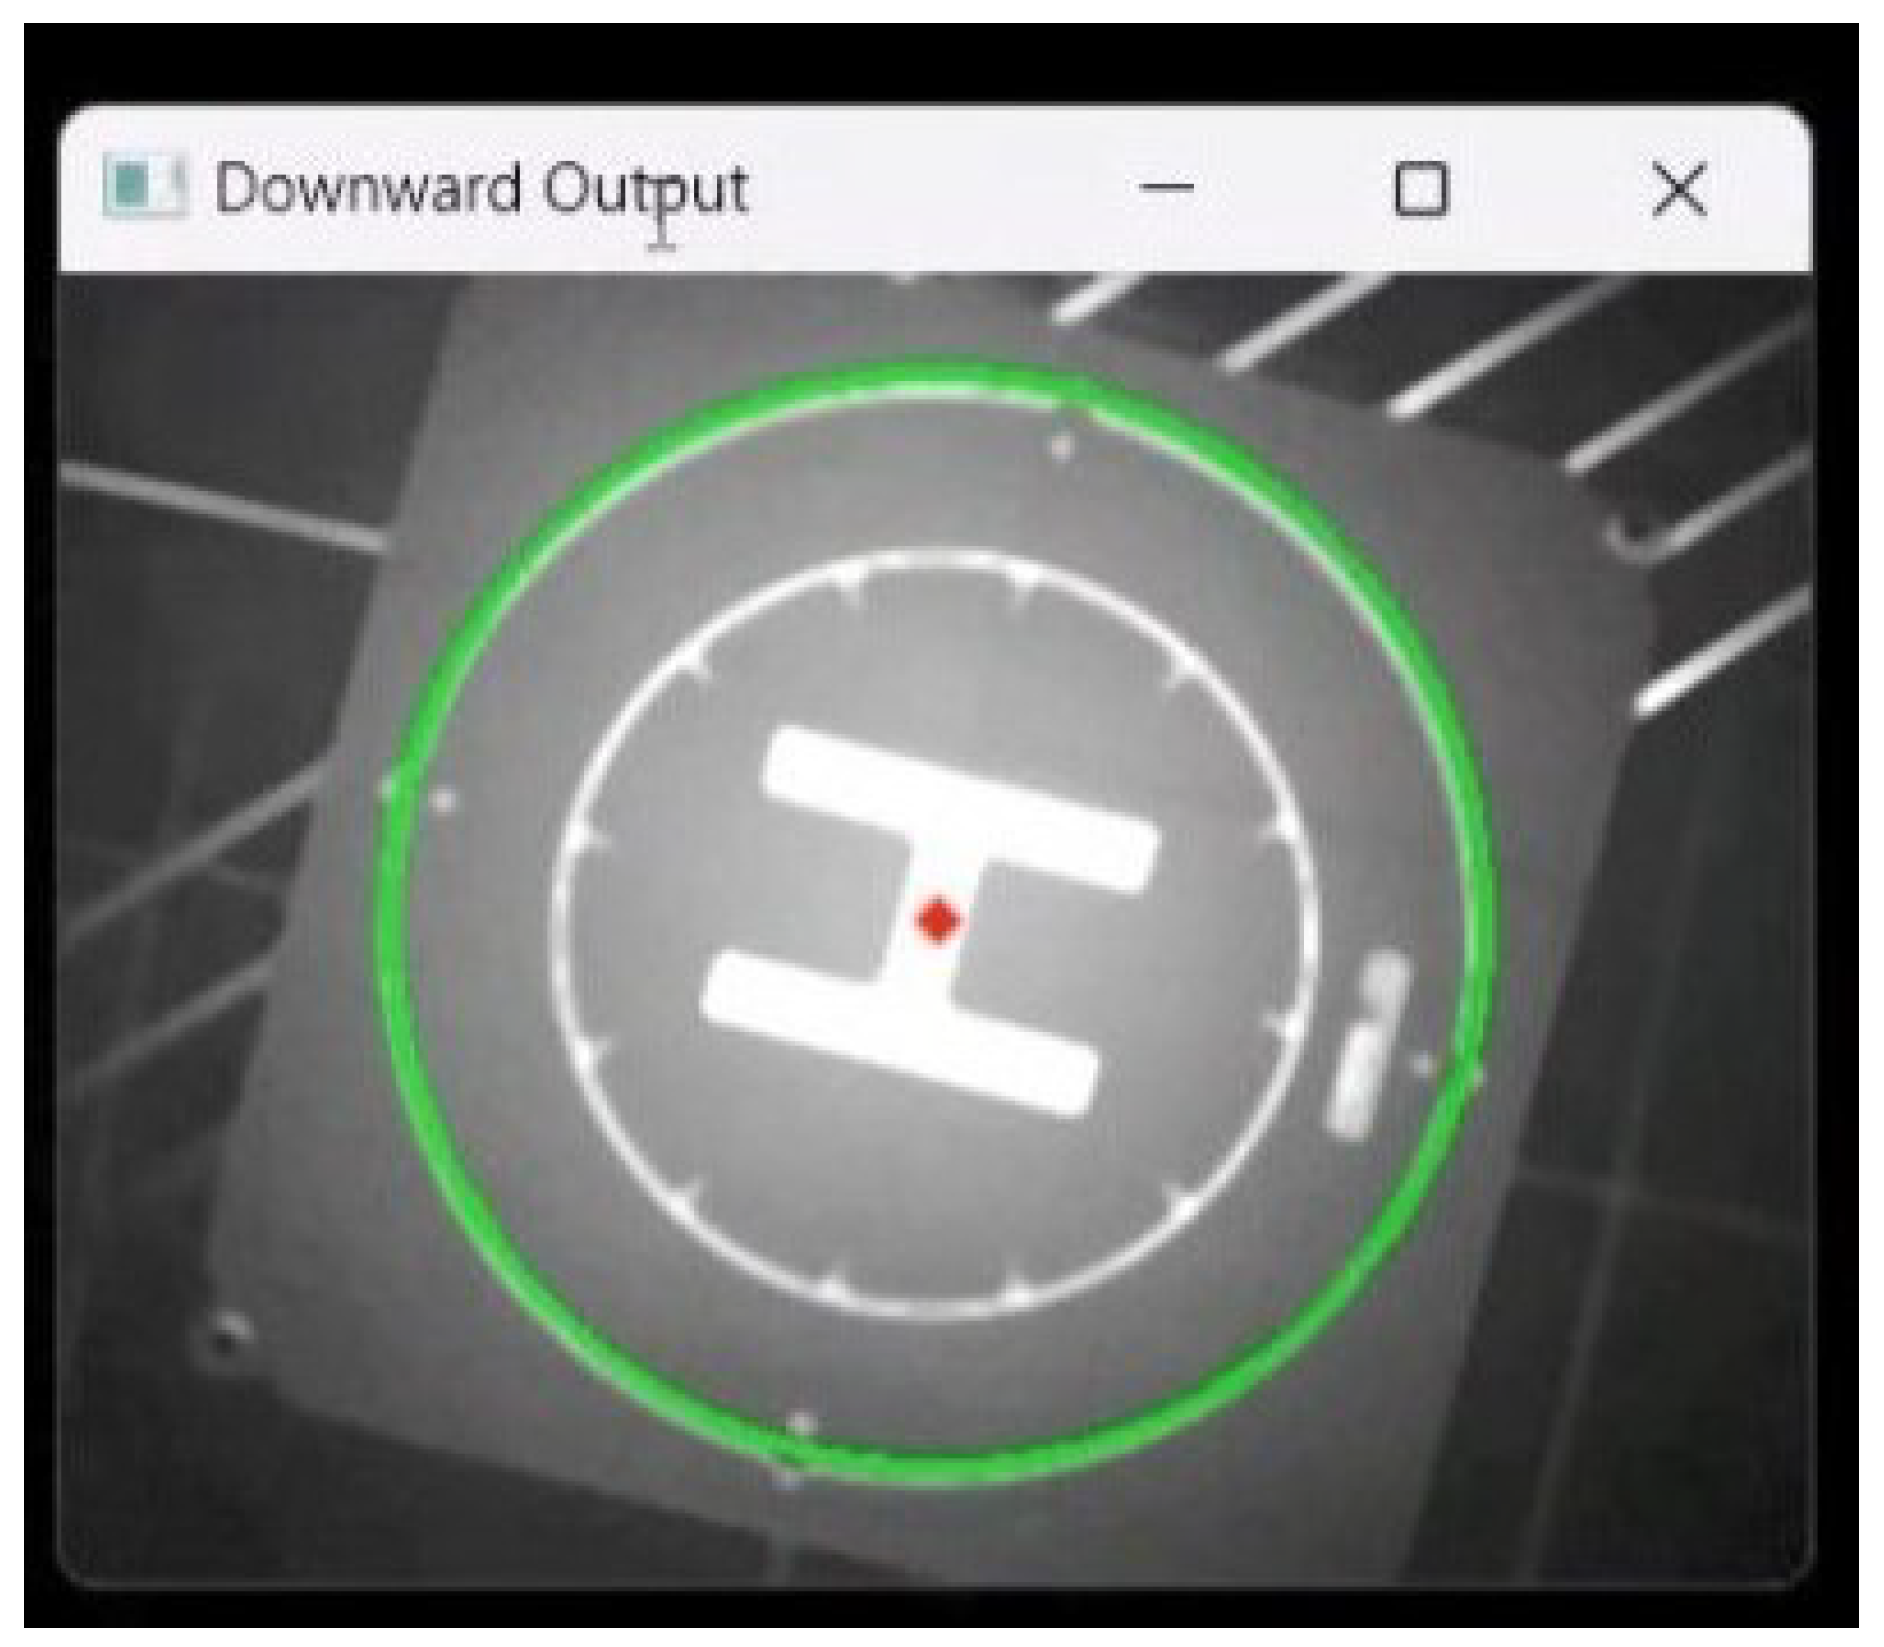
4.2. Vision Positioning System for Calibration and Precise Landing

Considering that our small drone does not have access to a GPS to track its exact location as it traverses the environment, it may be expected to accumulate drift over time from various factors. These factors could include drag, a sudden change in wind speed, or eventual rounding errors in traversal algorithms. One solution to compensate for this accumulated drift is to occasionally visit a nearby helipad with known coordinates and use image processing on the bottom camera frames to recalibrate the software’s known drone location.
When calibration is needed, the drone would first be instructed to visit the vicinity of the closest landing pad. The Tello EDU is equipped with a downward-facing IR camera capable of 320 × 240 pixel images. The taken images are then subjected to a small amount of Gaussian blur to remove unnecessary details from the image, and the captured frames are then processed through the OpenCV Hough transform function. The parameters are set to return the position of the white circle found on the helipads, the frames are marked with the circle’s outline in green, and the center pixels are marked in red for user reference.
A recursive helipad positioning function then creates a vector from the center pixel to the red center of the detected circle. The vector is inputted into the remote control (RC) commands acting as virtual sticks to position the drone directly above the helipad center. Then, the drone resets its internal Cartesian coordinates to match the known coordinates of the helipad, and either continues the mission or lands. This process is depicted in Figure 7. The Python implementation of this drone behavior can be found in the provided GitHub repository. The find_circles processes frames from the drone’s bottom camera, returning the processed image and the coordinates of the detected circle. find_circles is invoked in downvision_calibration.py, where the coordinates of the detected circle center are used to gently maneuver the drone over the helipad.

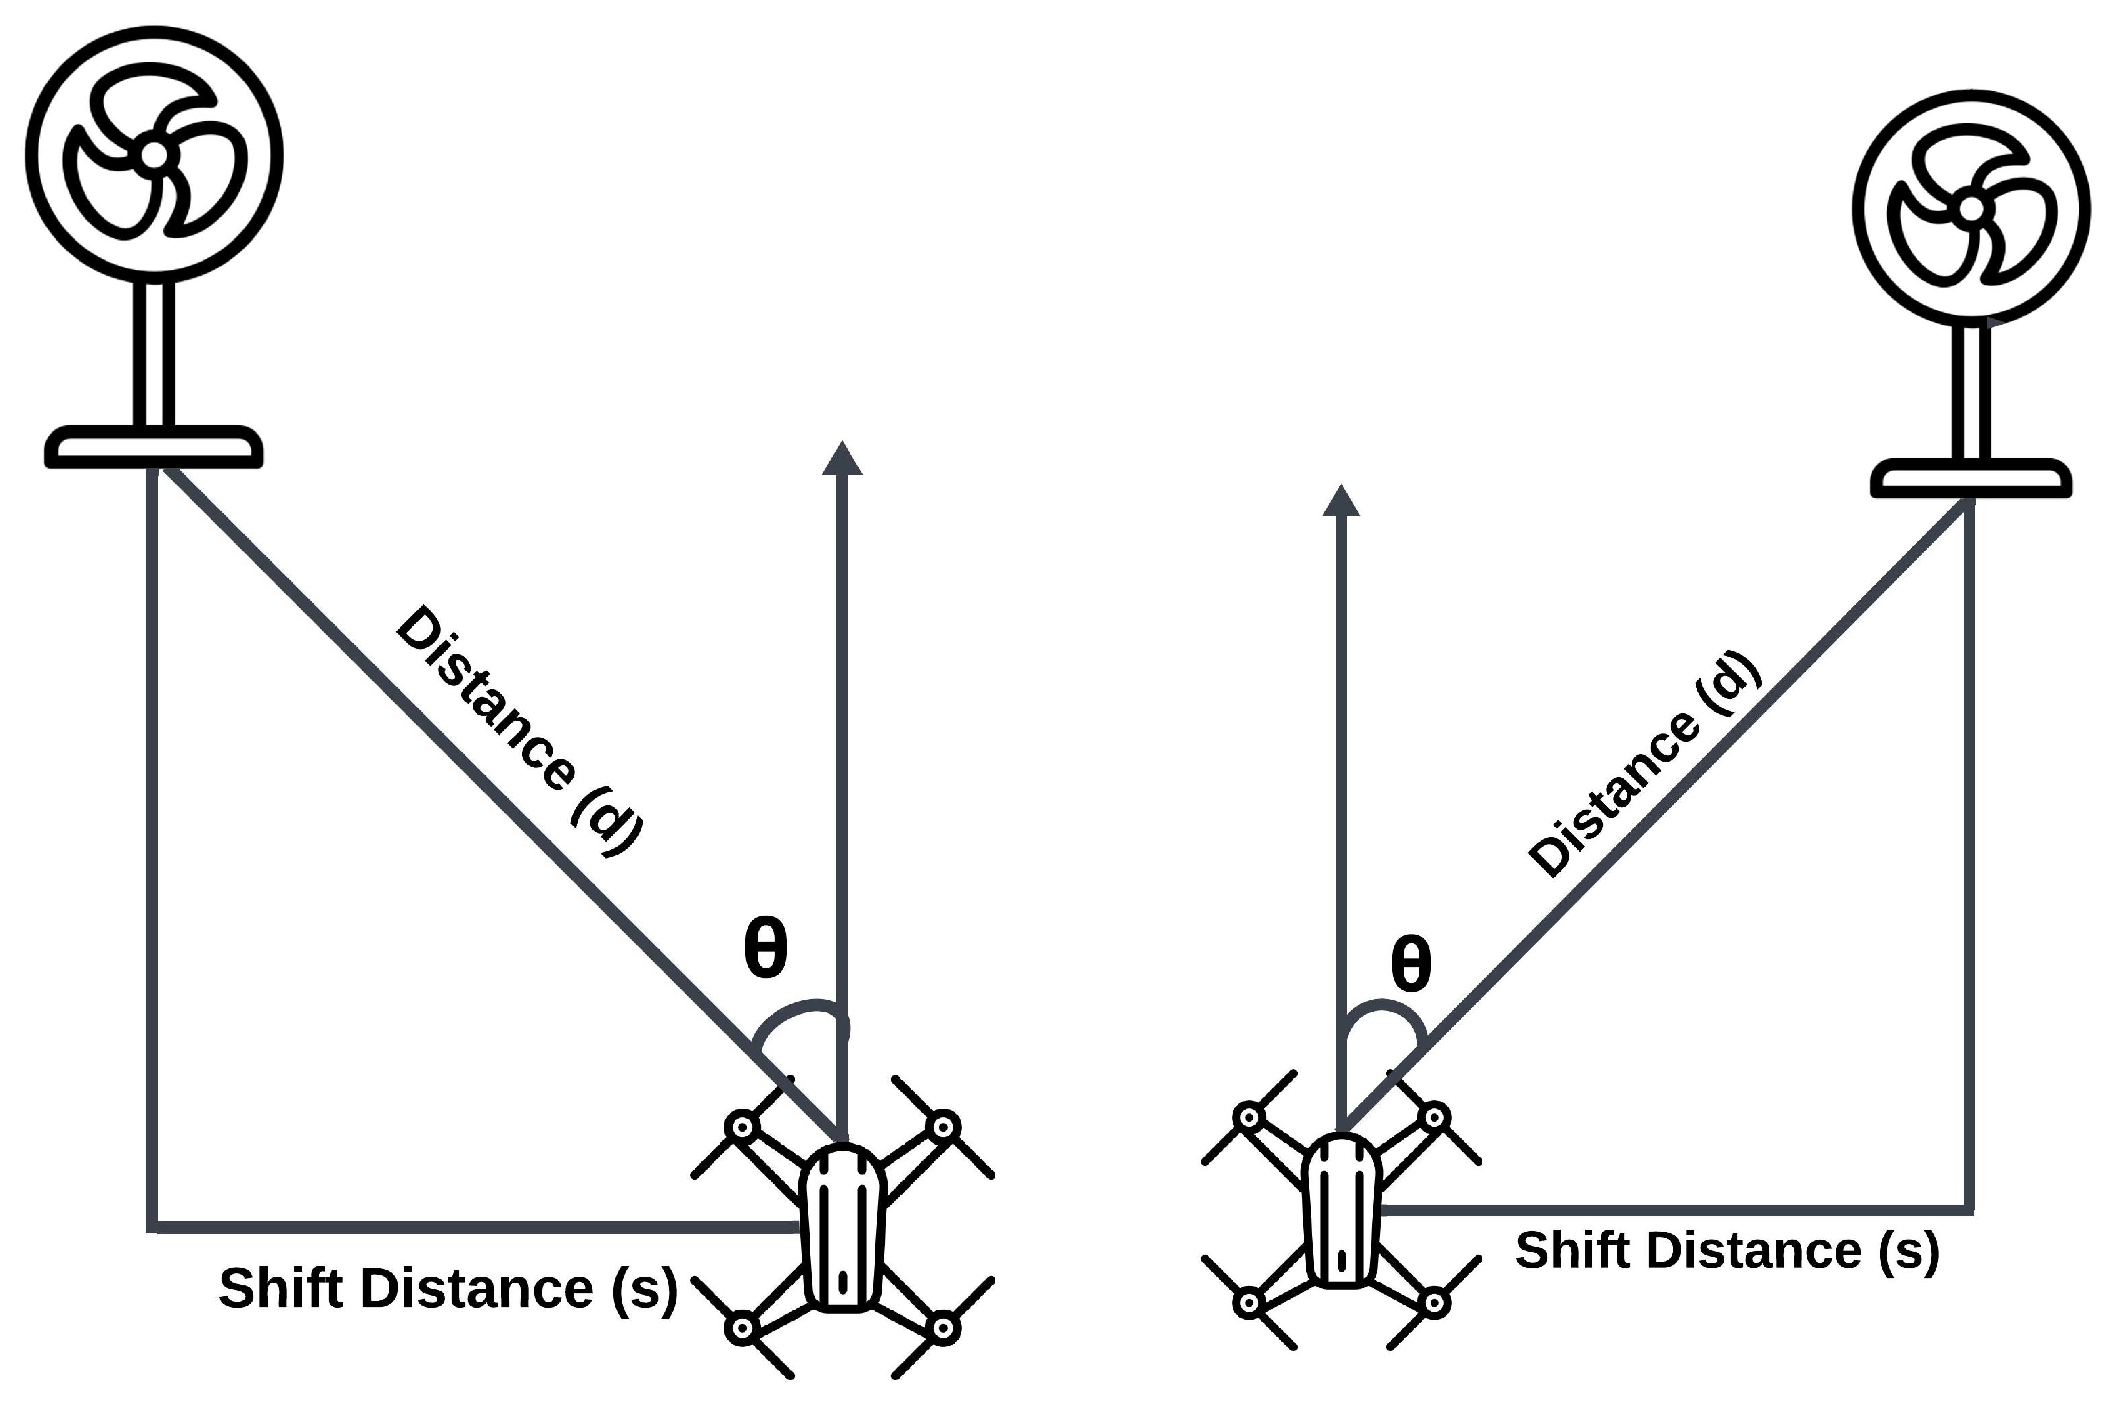
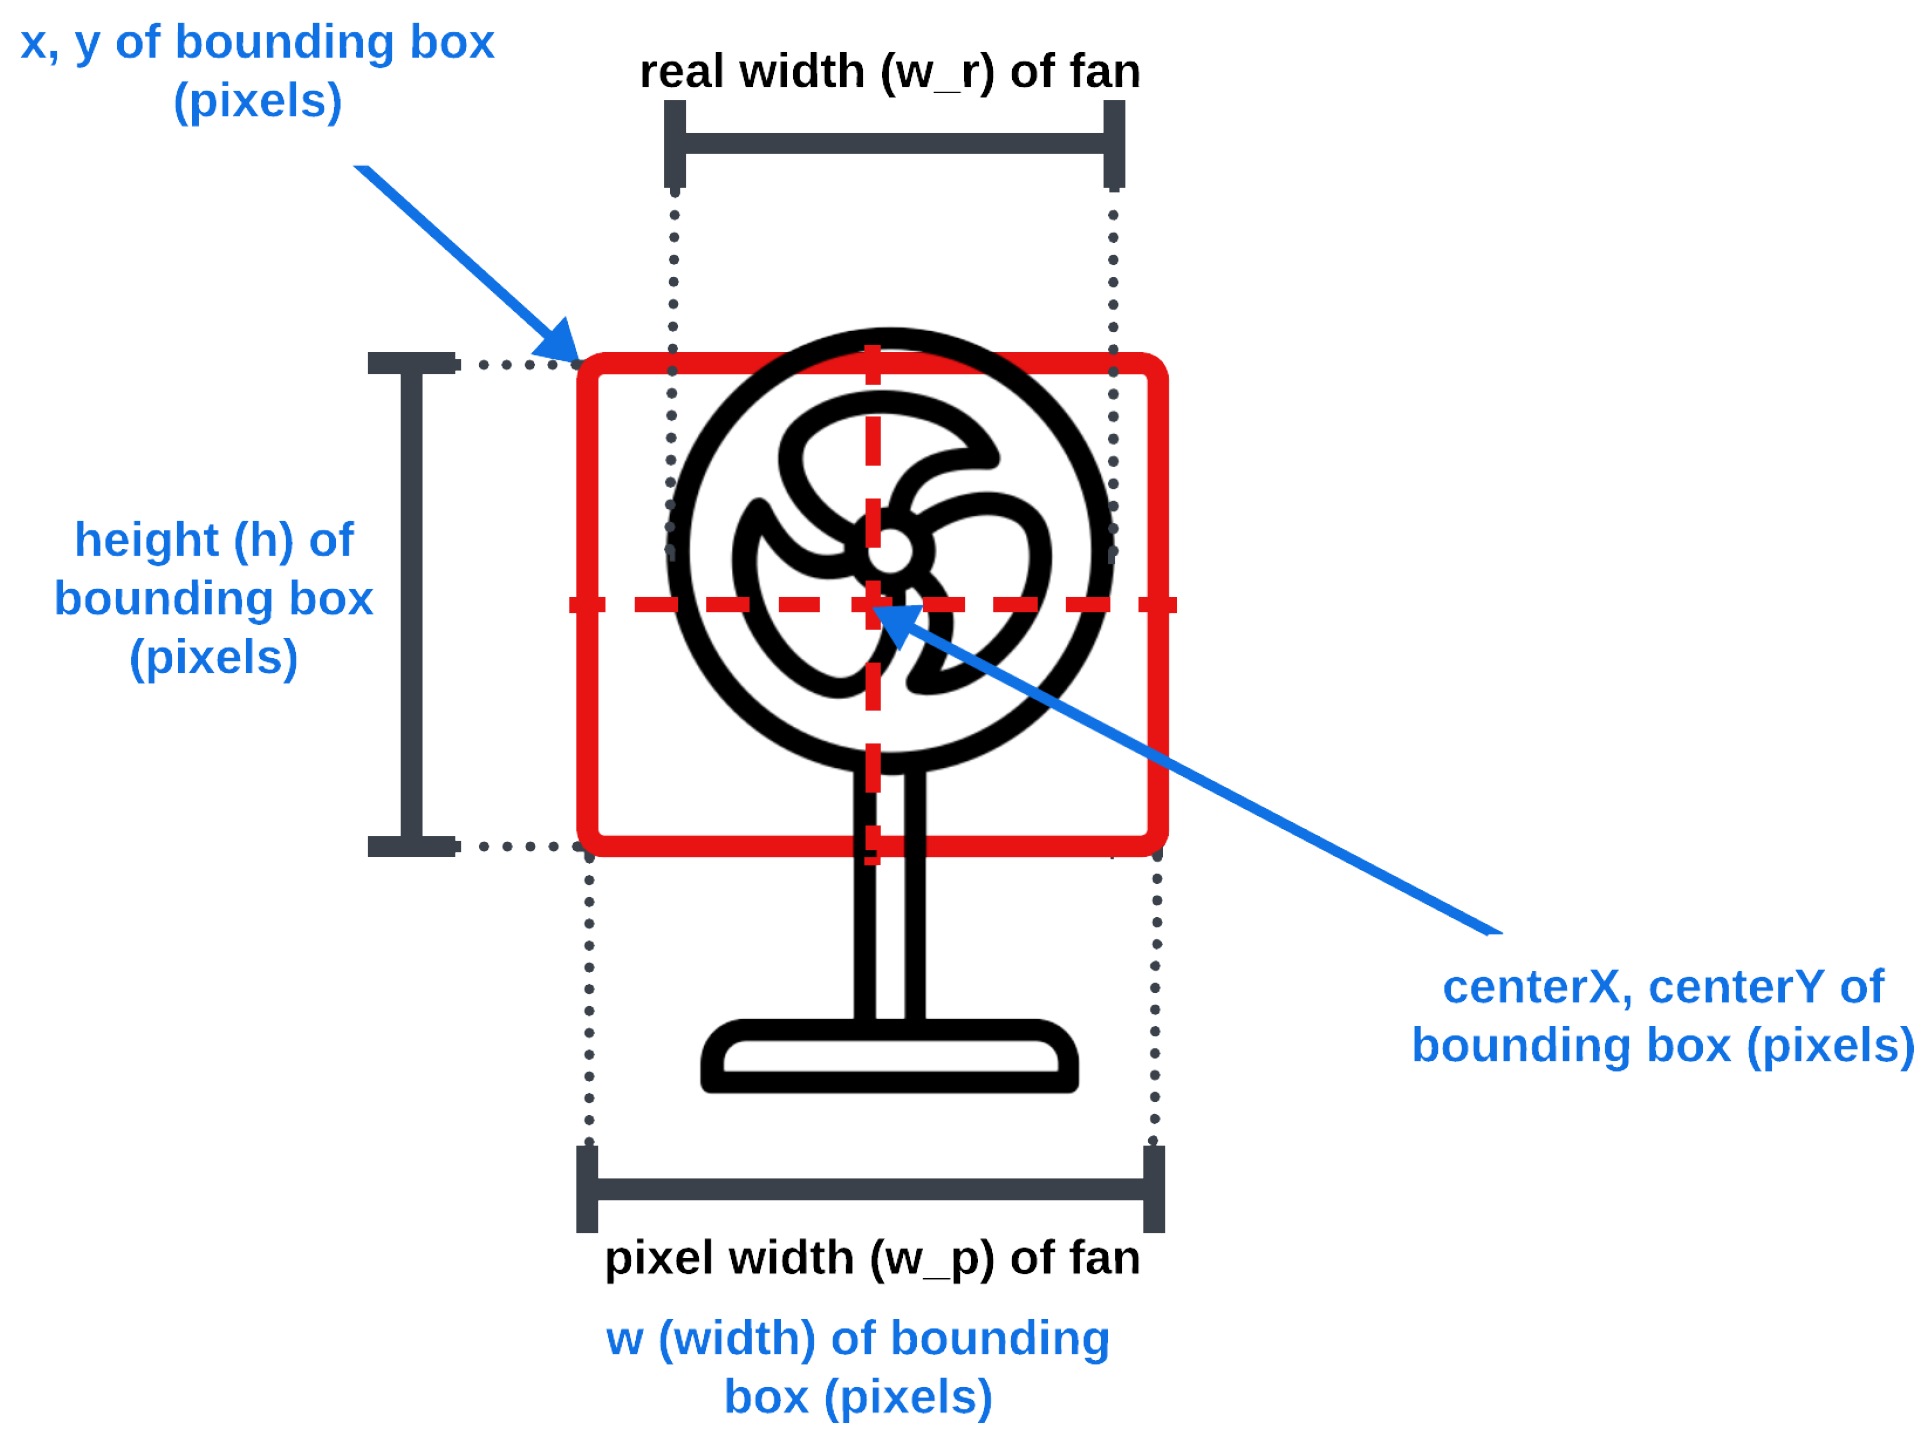
4.3. Trigonometric Calculations for the Path Using a Bounding Box

Here, the ML model is applied to frames received from the drone to return images of bounding boxes over each detected object in the frame. The distance between the fans and the drone is calculated by utilizing the bounding boxes and applying triangle symmetry [32] as (2).
d = l f ( w r / w p ) ,
where
  • d is the approximate distance of the detected object to the drone’s camera (cm),
  • l f is the calculated focal length of the camera for a 720 × 420 resolution image,
  • w r is the real-world width of the object (cm), and
  • w p is the width of the object in the frame (pixels).
However, rigorous testing before the final experiments is necessary since the bounding box accuracy may vary. Possibilities for error include the bounding box not being consistent frame after frame, even for static positioning of the drone and fan, and the bounding box may not necessarily fit the object even if annotations were tightly fit in training the ML model. Testing was planned for when the drone hovered at the traversal altitude to avoid collision with the fans (≈140 cm), where a fan would be set at 200 cm, 300 cm, and 400 cm. Based on (2), the distance would be calculated and saved into a designated CSV file for 48 calculations (as that was how many images would be processed before the drone performed automatic landing due to the lack of incoming movement commands). In the implemented experiments, the fan was placed exactly from the drone camera. However, the Tello drones experienced a moment of instability immediately after takeoff before fully stabilizing, which caused the drone to drift away from its initial takeoff location. The discrepancy between the calculated and actual distance in the experiments is noteworthy, as the actual distance may vary from pre-takeoff to post-takeoff. To mitigate this issue, a helipad center was strategically positioned to align with the actual distance from the fan. The VPS was then employed to center the drone precisely over the helipad after takeoff. Following this alignment step, distance calculations commence with the drone hovering at the specified distance from the fan. This approach ensures a consistent and accurate starting point for distance computations, addressing the potential variations in the actual distance encountered during takeoff. The recordings of these experiments can be found in the link Distance Calculation Experiments.
The analysis of calculated distances, along with their corresponding averages, for actual distances of 200 cm, 300 cm, and 400 cm, is illustrated in Figure 8. The graphical representation depicts a comparison between the calculated and actual distance values. Notably, the comparison plot reveals a linear relationship, with the average computed distances closely aligning with the actual distances. This observation suggests a high degree of accuracy and consistency in the computed distance measurements relative to the actual distances.
The averages were computed to obtain the average percentage error, with the highest error being 5.4271%. These results are displayed in Table 1. Based on these results, fan distances are calculated with an error margin of less than 6%. Accurate estimations are vital to determine how much the drone needs to move forward and how much to shift the drone laterally to position the fan to the center of the drone’s camera frame. The angle required for the drone to face the detected fan, calculated with a processed image width of 720 pixels, is expressed as follows:
θ = ( | 360 x | / 360 ) F O V / 2
where
  • θ 
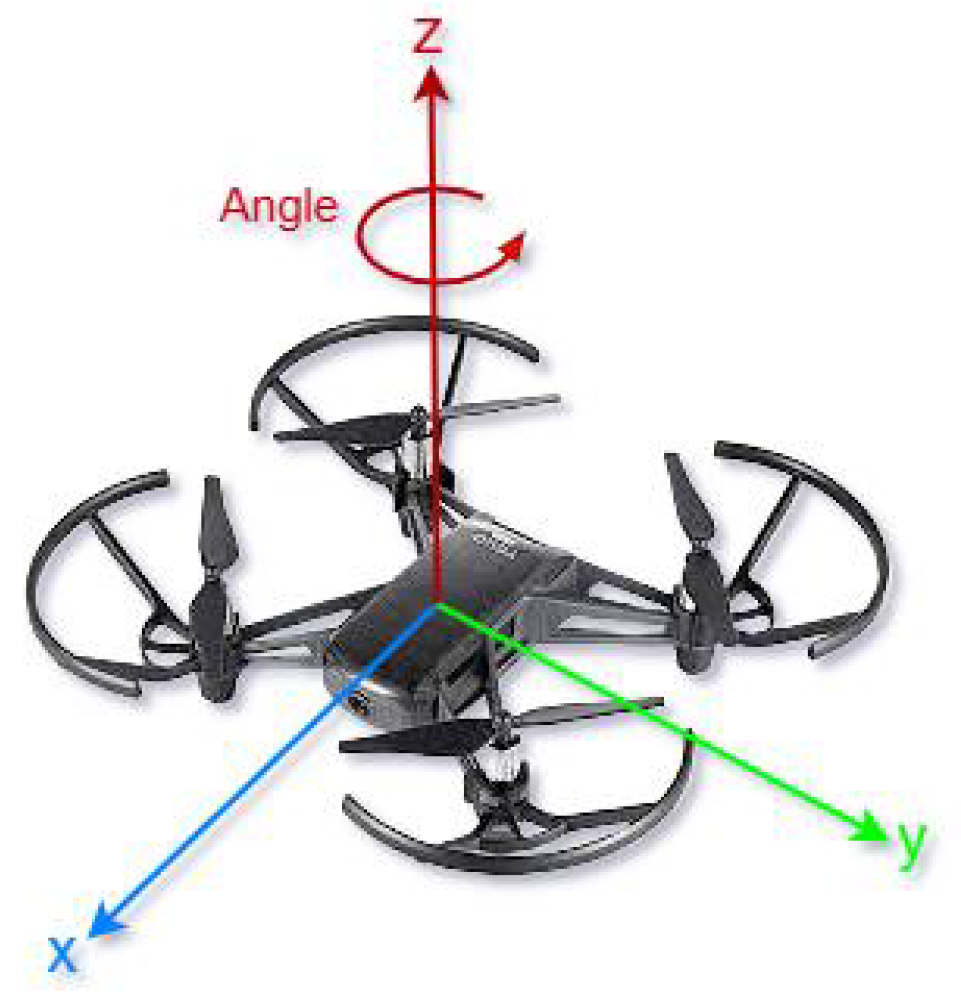
is the angle to turn the drone to center the detected object in the frame (degrees),
  • x is the location of the center of the bounding box in the frame (from pixels 0–720),
  • F O V is the field of view of the drone in degrees (82.6° for Tello drones), and 360 is half the image width in pixels.
  • For cases where x is less than half the image width, θ is counterclockwise; otherwise, it is clockwise.
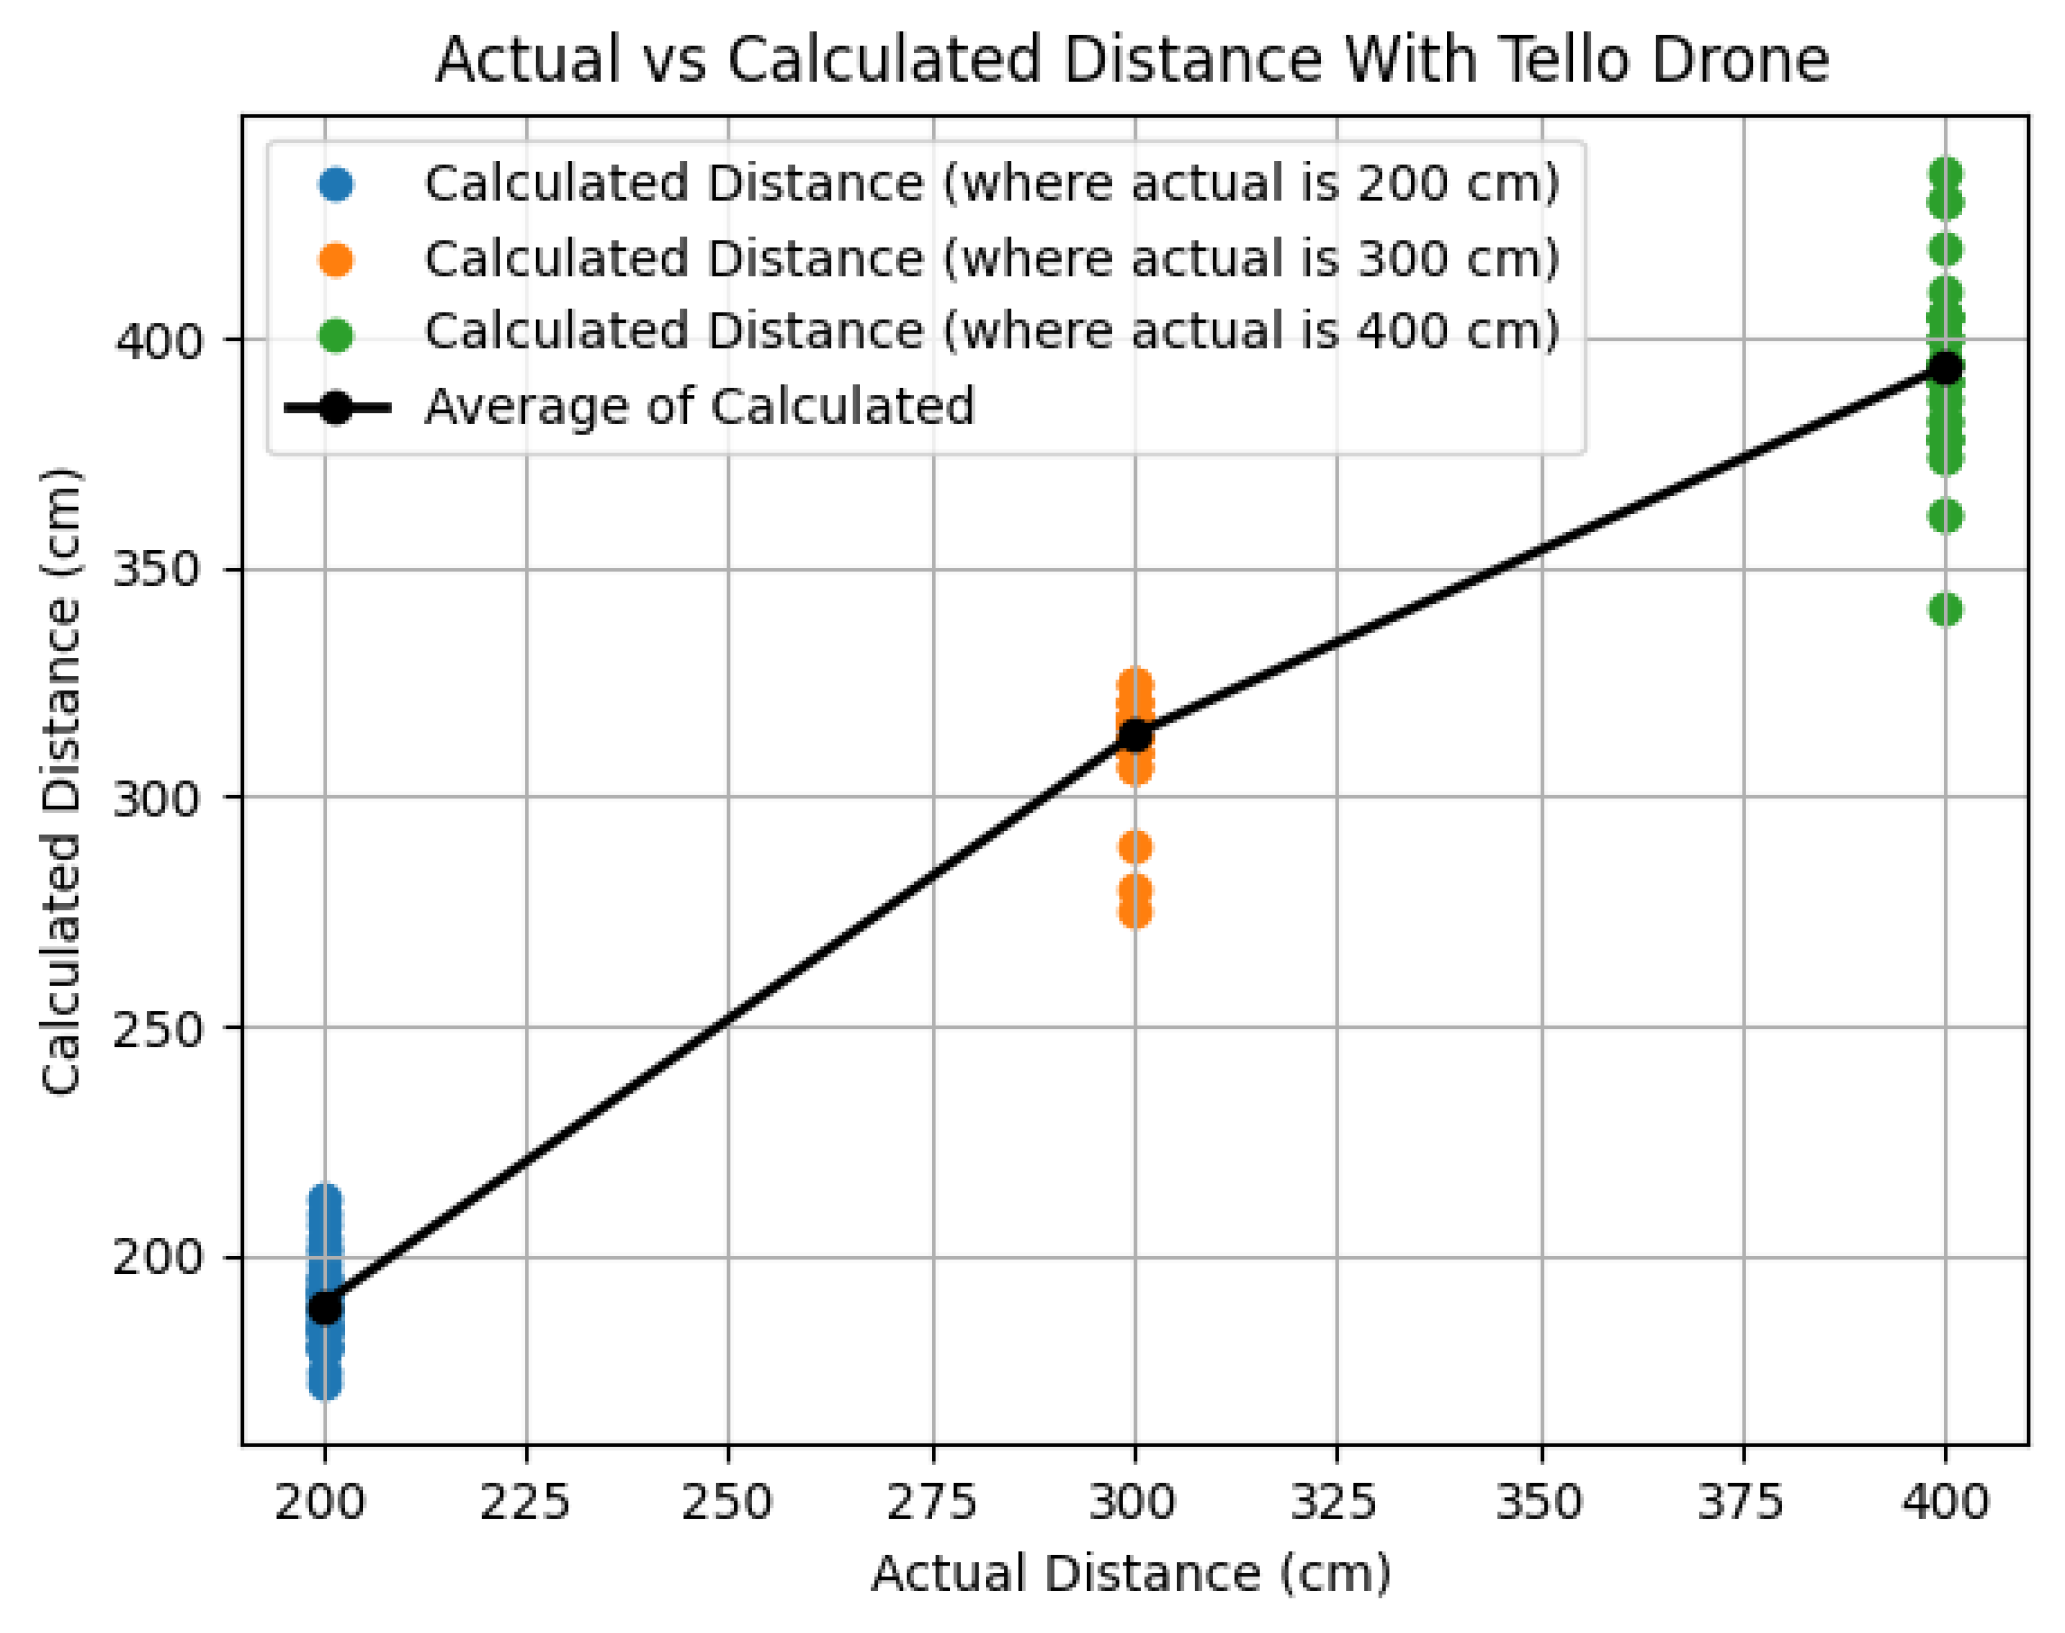
Table 1. Result of the average calculated distances for actual distances of 200, 300, and 400 cm, where the average percentage error is included.
Actual Distance (cm)Average Calculated Distance (cm)Average Error (%)
200189.14585.4271
300313.54174.5139
400393.91671.520825
It is important to note that there are two distinct methods for centering the fan in the frame: rotating the drone or laterally shifting it to the left or right. In our experiments, we primarily employed the shifting method. This decision was based on the expectation that QR codes are oriented toward the negative x direction of the Cartesian plane, facilitating straightforward reading by the drone without the need for angular approaches, which may complicate QR code recognition. Figure 9 provides an aerial view, illustrating two cases utilized for calculating parameters d, and θ .

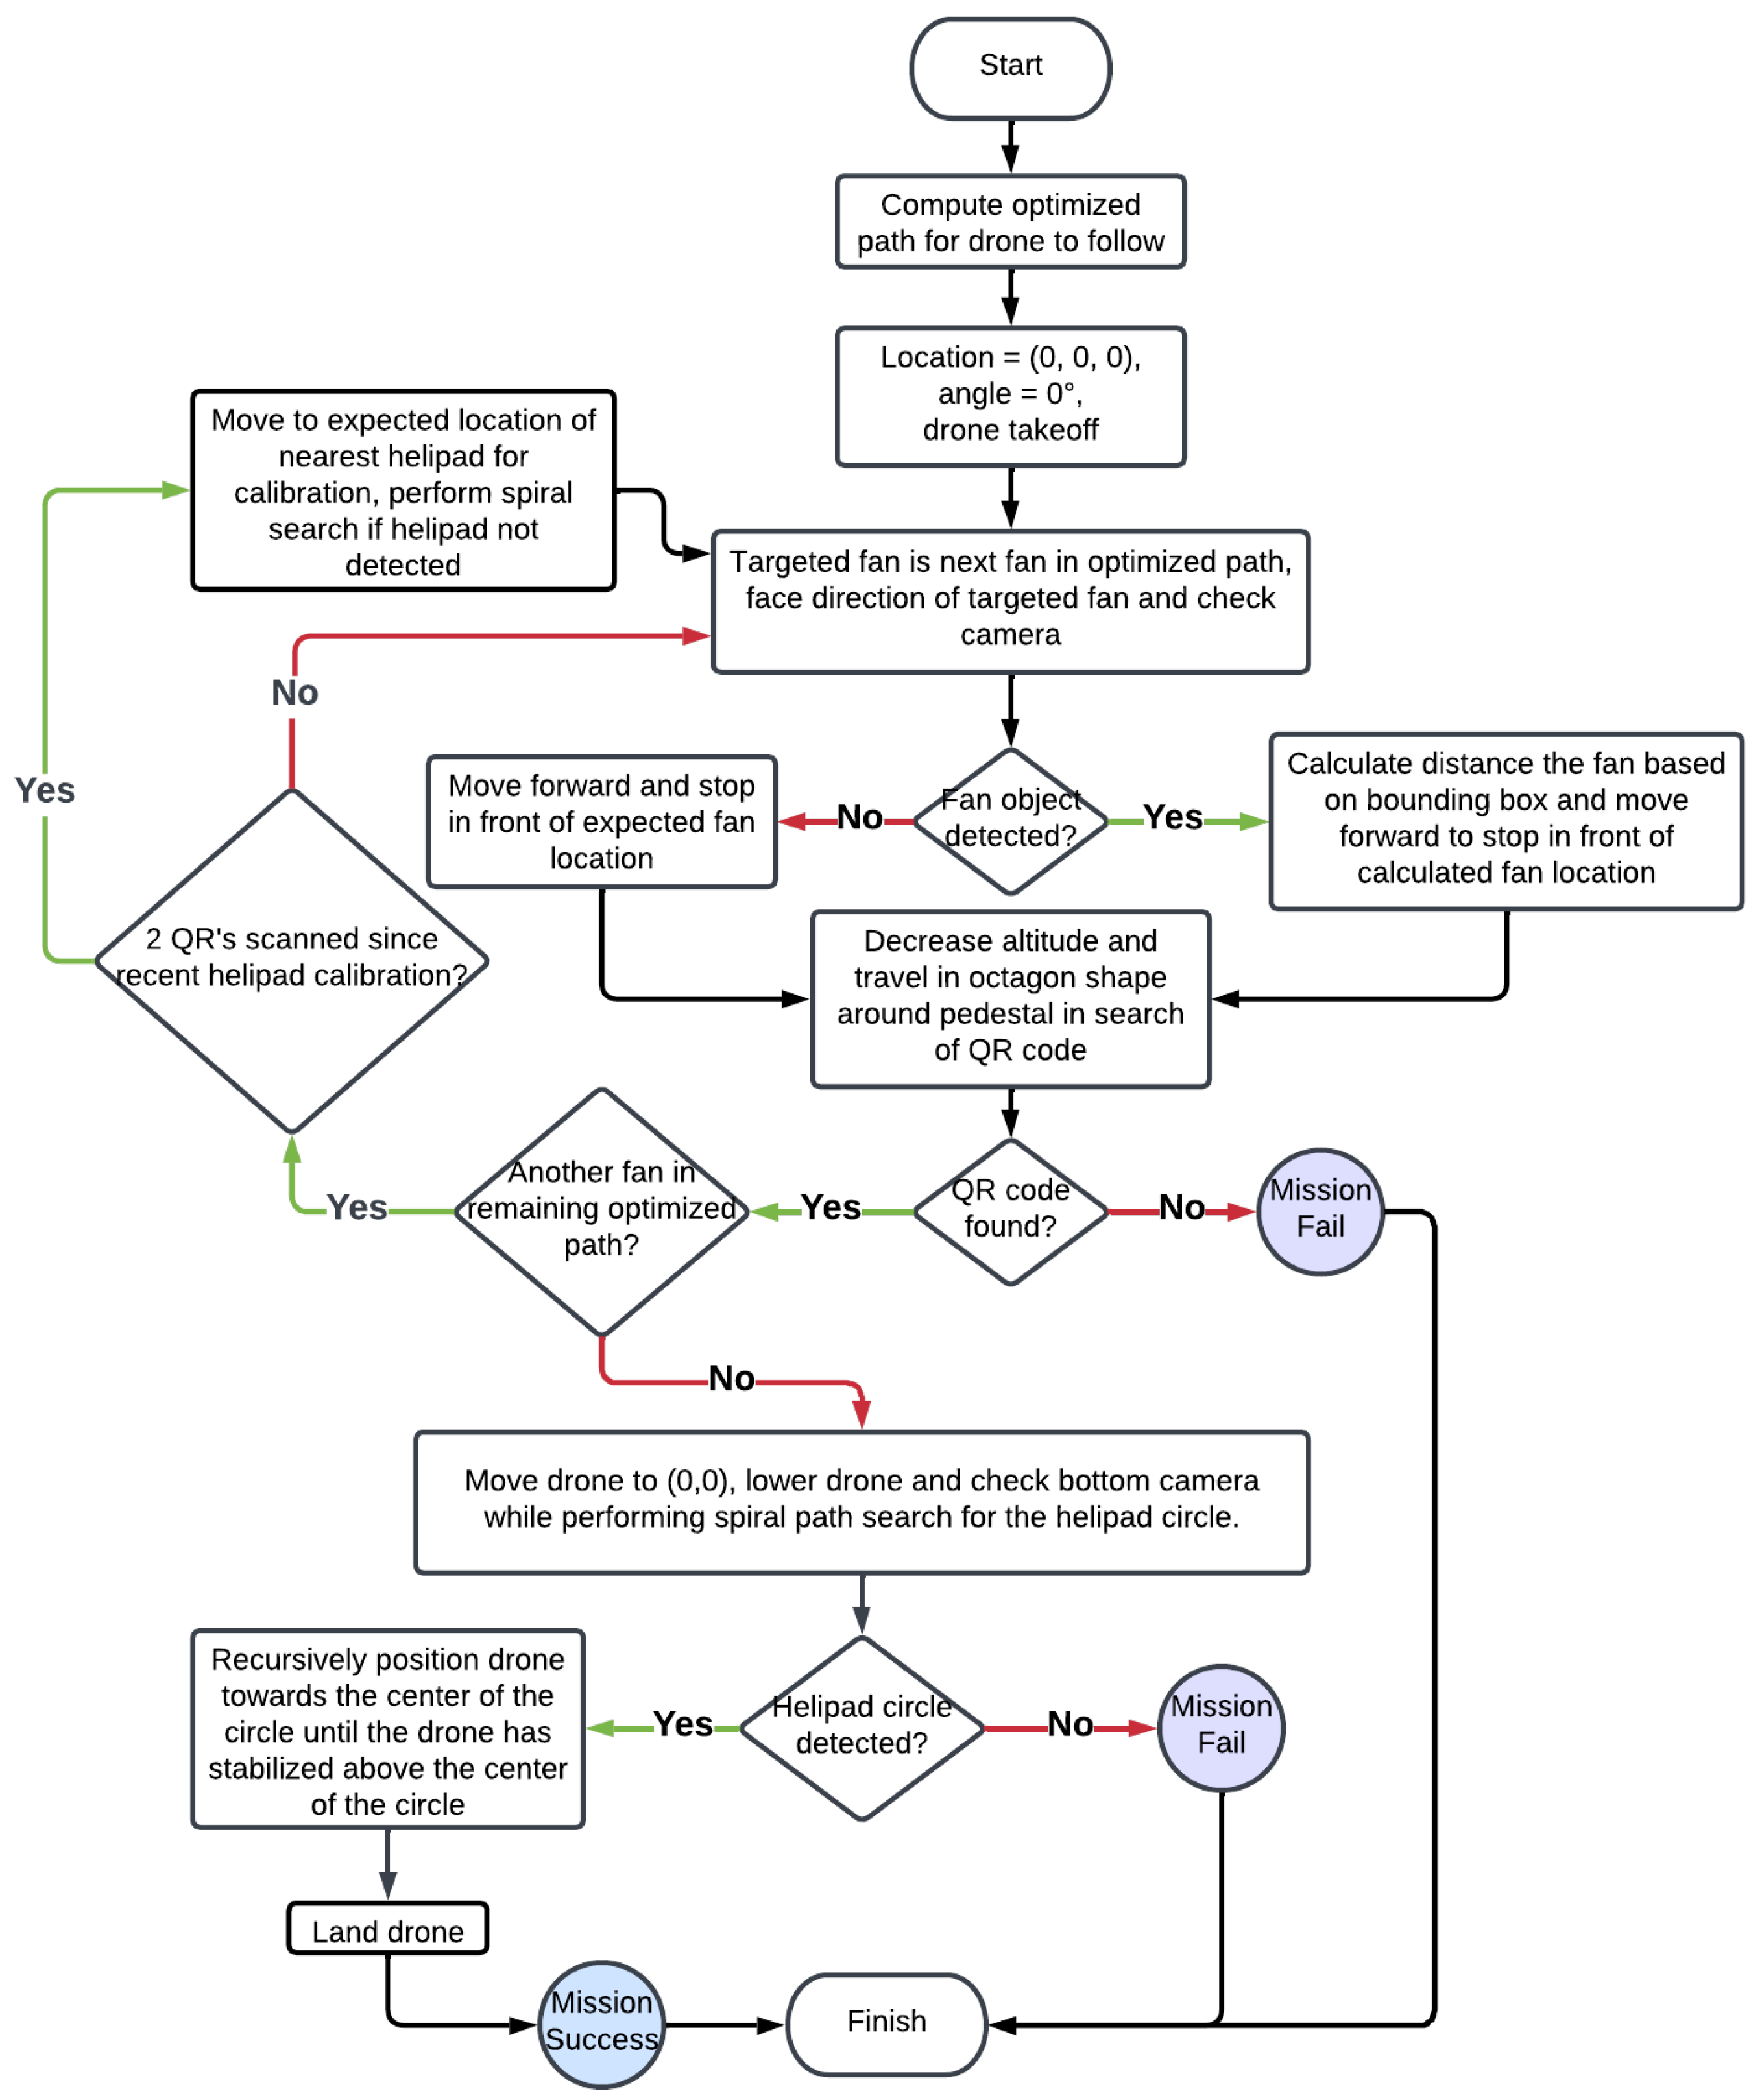
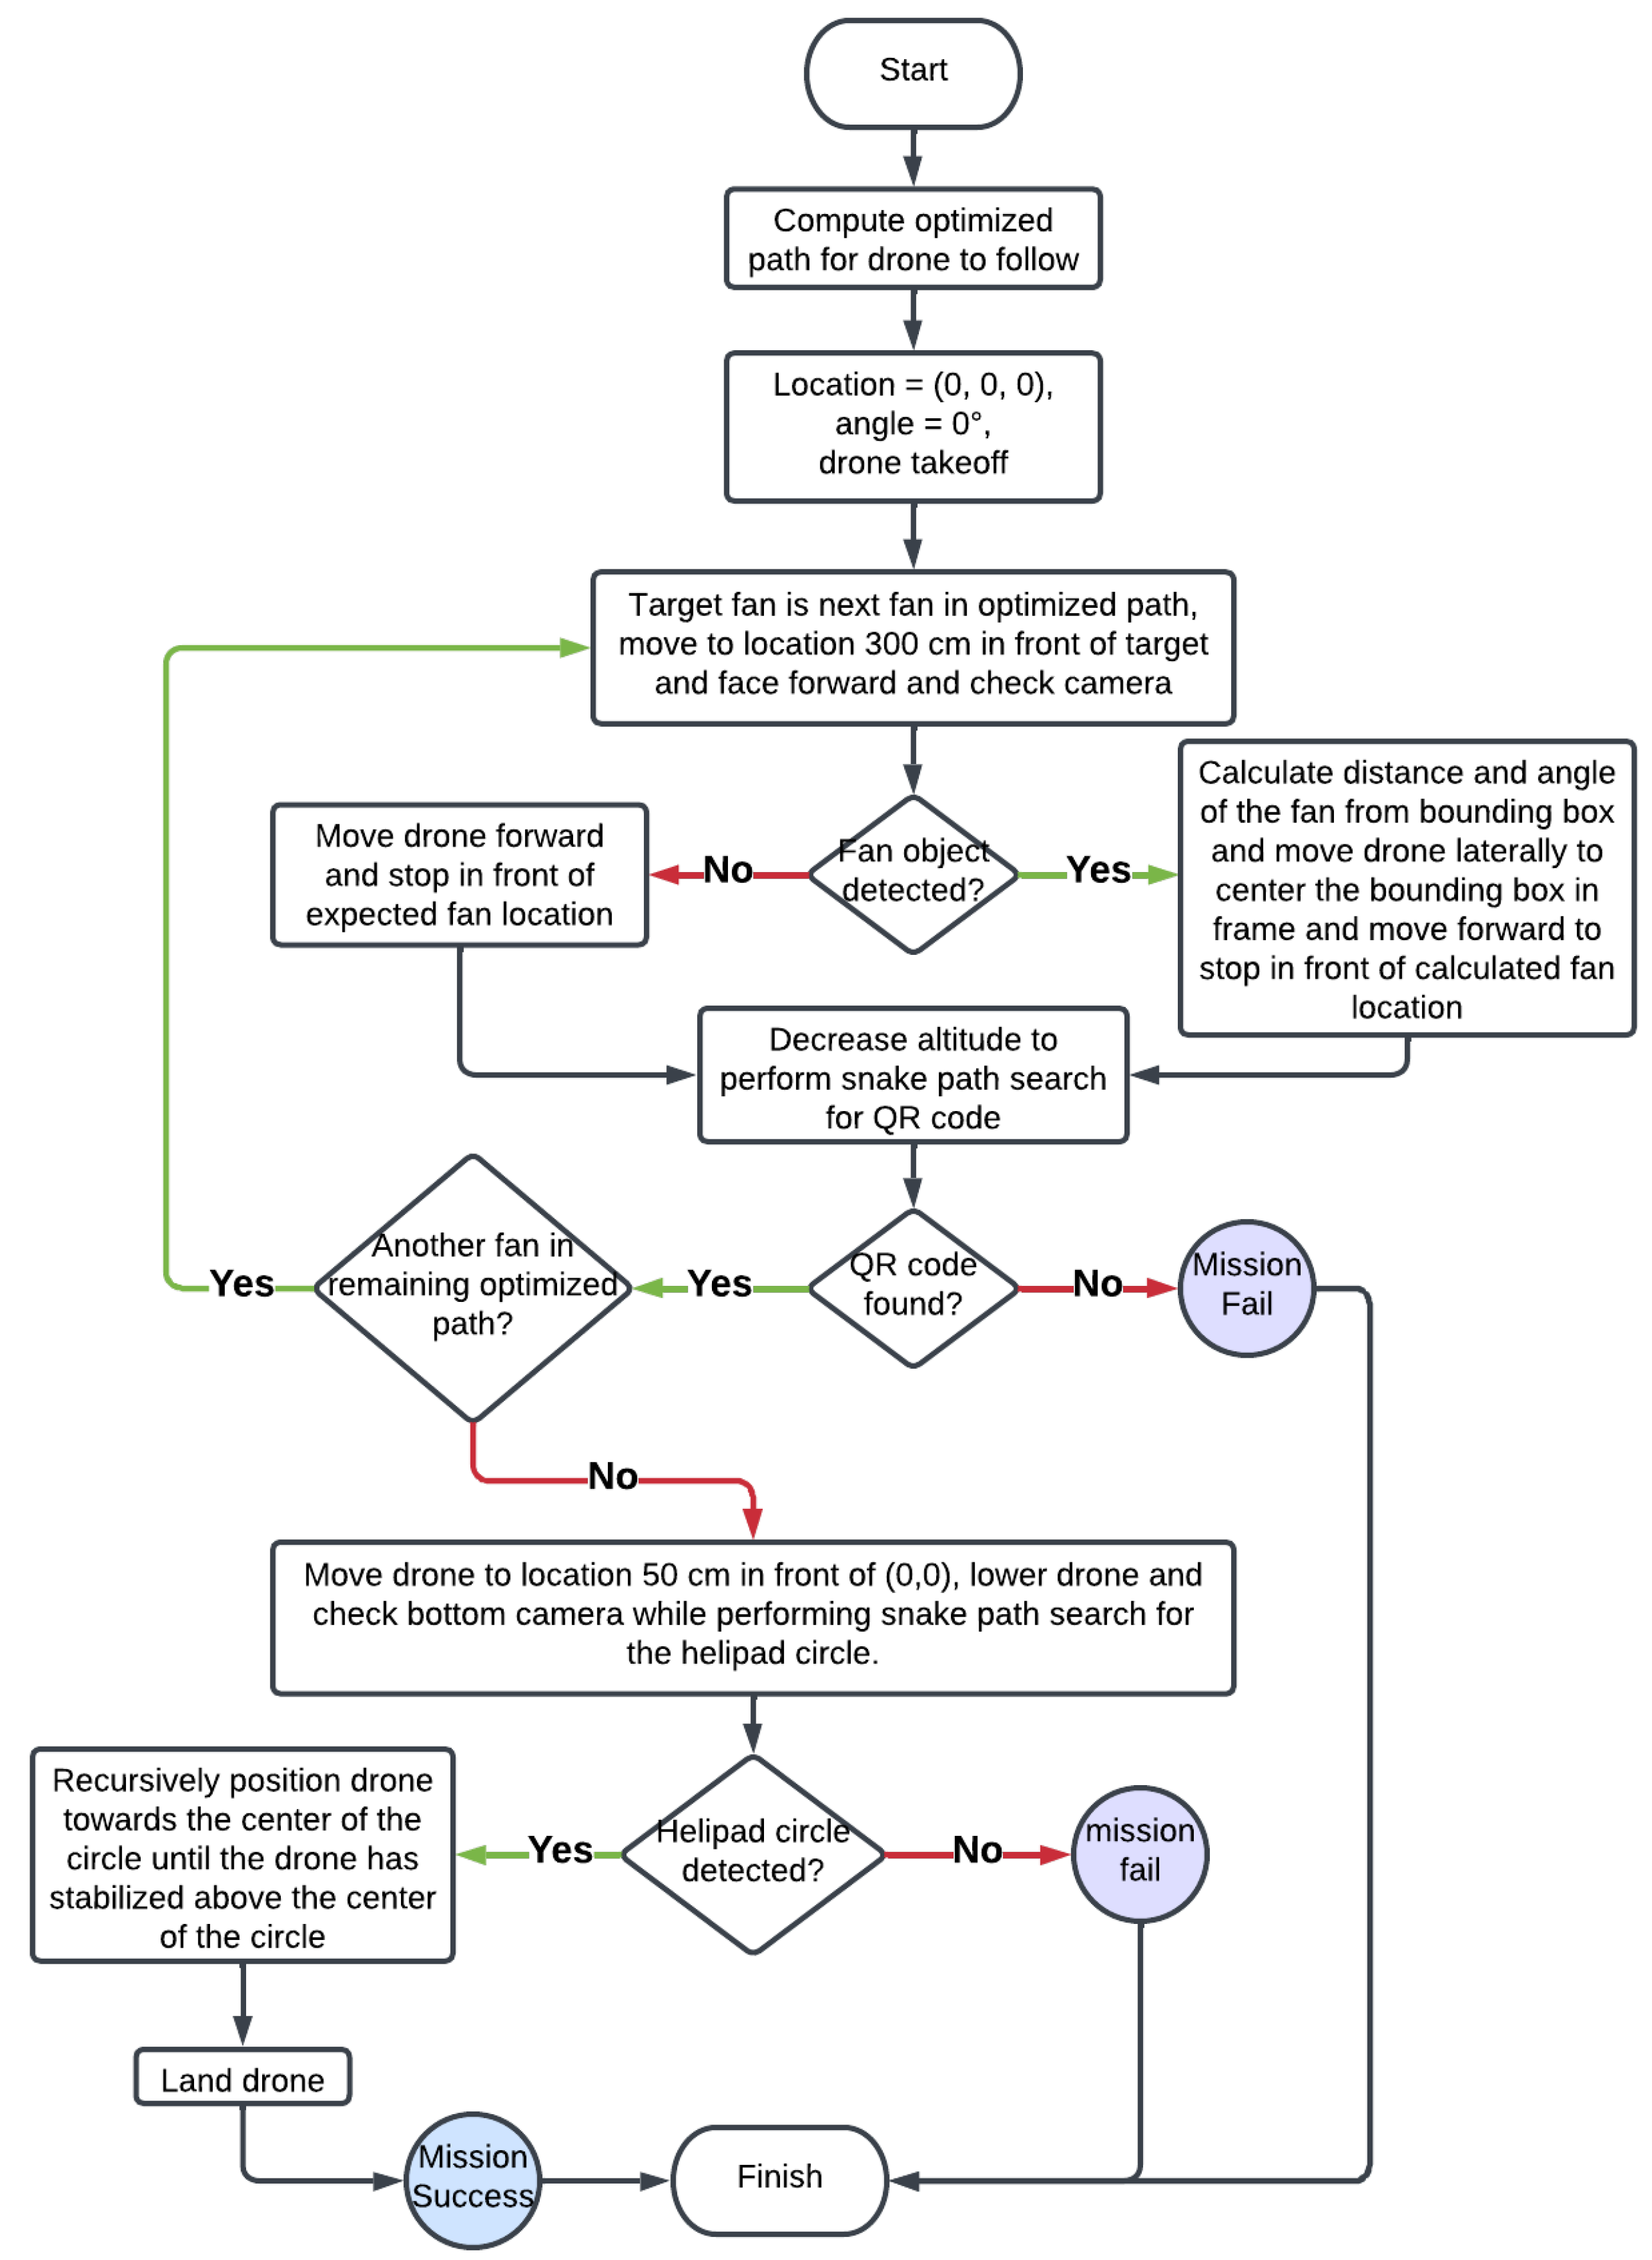
5. Integration of Path Planning with Computer Vision

In our Python scripts, the drone enabled object detection and QR code literacy with its front-facing camera and circle detection with its bottom-facing camera (see Figure 10). To facilitate precise and optimized navigation for the Tello EDU drone, a meticulously crafted set of coordinates was fed into the drone’s control system. These coordinates, generated through rigorous computational methods of simulated annealing, represent specific points in space that define the drone’s flight path. Each coordinate pair denotes a distinct location in the drone’s environment, calculated to optimize the overall trajectory. Utilizing the Python programming language and relevant libraries, these coordinates are systematically passed to the drone’s control interface, enabling the drone to navigate through the designated points autonomously. The Python implementation of the drone—following an array of Cartesian coordinates—can be found in the provided GitHub repository link below.
The script traveling_salesman_geometric.py has a for-loop that iterates through each coordinate pair in the order of the optimized path. Each coordinate pair is fed into a drone movement class function from movement.py. This coordination of coordinates not only ensures the drone’s adherence to a predefined flight path but also maximizes efficiency, making it a fundamental component in achieving seamless and optimized drone operations.
The exact targets were randomly selected and included in the missions in these experiments. The declared initial path followed the random order the targets were selected. An example of optimizing the initial path is shown in Figure 11. In the traveling salesman experiments, the number of targets increased from three to seven. A comparison of the path distances for the same targets before and after optimization is illustrated in Figure 12. The path distances in the plot were averaged over 100 scenarios for each number of fans to visit. Given the limited flight time of drones, minimizing the travel time is crucial. Although we attempted to explore more sophisticated scenarios during experimentation, constraints such as the flight time of the Tello EDU drone, which was less than 13 min on a full charge, prevented us from conducting experiments with additional fans or larger distances between them. Commencing with a random route is not ideal; instead, employing heuristics to generate a well-informed initial route is advisable. We also acknowledge that other heuristic methods could yield similar solutions with lower computational requirements for this indoor simulation. However, we used the simulated annealing method due to its scalability; it is suited for more complex scenarios where a centroid is filled with locations to visit, and the drone may be situated outside the wind farm boundaries, requiring flexibility in flight direction. We demonstrated the robustness of our algorithm when dealing with a larger number of locations to visit. Visiting N turbines presents an N! problem, and depending on the wind directions, the turbines may not necessarily be aligned along the same direction with equally spaced locations, underscoring the suitability of the simulated annealing optimization method for this project, although it is not the only optimization approach available.
While Cartesian coordinate calibration via VPS holds theoretical effectiveness, practical implementation encountered challenges such as drift effects over time and inefficient battery consumption associated with multiple VPS checkpoints. The drone lacked programming to persist with the mission upon detecting the wrong fan, impeding the attainment of VPS calibration in certain instances. In this context, the operational flow of the traveling salesman-based testing is delineated in the flowchart presented in Figure 13. The drone exhibited significantly higher success rates in fan detection through object recognition than in navigating to the anticipated fan location. Consequently, the decision was made to prioritize navigation toward the t a r g e t _ f a n based on computer vision rather than Cartesian movement. In other words, testing was refocused to ensure that every flight case followed the ‘Yes’ path after the ‘Fan Object Detected?’ decision block in Figure 13. Through experimentation, it was observed that object detection was not robust when the fan was at an oblique angle relative to the drone’s POV or when the fan was situated at a considerable distance. Fans were found to be more detectable from frontal or rear perspectives, leading to the utilization of the width, w r in (2), based on these angles. To ensure the generation of accurate distance estimations, a solution was implemented to position the drone directly in front of the t a r g e t _ f a n using the known Cartesian coordinates and facing forward. This strategic repositioning, performed at 300 cm in front of the fan, enhanced object detection accuracy within the frame, t a r g e t _ f a n . Consequently, the ‘No’ path in the decision-making process was no longer chosen, mitigating the potential issues associated with different fan detections at varying distances.
Despite the efficacy of the new method in ensuring fans were within the front camera frame, the detected fan objects may not be consistently centered as desired. The bounding box tracking function introduces variable left or right shifts based on calculations from (2) and (3). In cases where the calculated shift value is less than 20 cm (the minimum movement distance for non-RC commands), the drone rotates by the angle of (3) to align the bounding box center with the center of the camera frame. Experiments were performed in the atrium of the Computer Science building at Utah Valley University as illustrated in Figure 14. The process of centering the bounding box is illustrated in Figure 15 and Figure 16 from left to right. This adjustment process is implemented to achieve the desired framing of the fan within the camera view.
With this refined method, the expectation is that the QR code will be positioned in front of the drone, facilitating reading by the RGB camera. Consequently, the initial approach of circling the pedestal was abandoned. The limited and slightly varied range for QR code reading necessitated a small snake path exploration, gradually moving the drone toward the QR code. This alternative method ensured that the target’s location (QR code in this case) was known to be in a specific direction ( x direction), minimizing the risk of collision by maintaining a conservative distance from the pedestal. More advanced and energy-intensive exploration algorithms would be required in scenarios where the target could be positioned in any direction in the x and y planes.
This concept of halting in front of the target vicinity before initiating a snake path exploration for detection was replicated when implementing a helipad, as depicted in Figure 17, Figure 18, Figure 19 and Figure 20, from left-to-right and top-to-bottom. If the drone’s position is particular in a specific direction (in this case, the x direction), the drone can efficiently snake toward the desired location, eliminating the need for exploration in all directions.

6. Traveling Salesman-Based Analyses and Exploration

The traveling salesman approach for the fans was tested thoroughly, encountering many challenges. The main challenge was the inconsistent accuracy in determining the drone’s location on the Cartesian plane, which was necessary to reach the helipad calibration stage. Specifically, the recorded drone coordinates being just a few feet off from the actual position caused the mission to fail. The experiments demonstrated that the self-updating Cartesian position via VPS was insufficient for the drone to complete the mission. Inaccuracies due to drag, indoor airflow, and drone imperfections necessitated the use of additional tools to correct the recorded coordinate location of the drone. Furthermore, we observed that in some instances, even though the drone could reach the first or second helipad, excessive battery consumption forced the drone to make a low-voltage landing. Thus, a robust solution would require calibration earlier in the traveling salesman mission and more quickly to ensure enough battery life to complete the mission.
The Python script underwent revision to include the update of the drone’s y coordinate to align with the y coordinate of the t a r g e t _ f a n (in the shared repository) after centering the bounding box in the frame. Despite these changes, experiments revealed high failure rates, primarily attributed to persistent inaccuracies in the drone’s x coordinate. The issue escalated with prolonged flight, increasing deviations in the x coordinate. To address this challenge, a decision was made to update the drone’s x coordinate as frequently and promptly as the y coordinate. It is worth emphasizing that QR codes are used to verify the detection of the targeted fan. Experiments demonstrated a consistent distance range at which the drone could read the QR codes. Based on distance measurements from multiple flights, it was concluded that the drone could successfully scan QR codes from approximately 122 cm away. See Algorithm 2 for the drone’s revised coordinate calibration steps.
With these revisions, the traveling salesman process was updated as illustrated in the flowchart in Figure 21. With more frequent and efficient calibrations at the cost of losing some accuracy, the helipad calibration process was removed. Thus, only one helipad would be used to ensure that the drone returned to its starting point.
The Python implementation of the traveling salesman experiments can be found in the shared GitHub repository, traveling_salesman_geometric.py. This function generates the optimized travel path for the drone to follow while salesman_image_interface.py controls the drone movements based on bounding box information returned from check_camera.py and QR data returned from qr_reader.py.

6.1. Traveling Salesman-Based Experiments with Correct Takeoff Locations

After implementing the QR code calibration method, there was a significant improvement in the success rates of the experimental runs. Although updating coordinates with this method is not as precise as helipad calibration, it proved sufficient for the drone to be within a foot of its expected location. This capability mitigated the negative effects of drift and consumed less battery than helipad calibration. The outcomes of these experiments are detailed in Table A1 of Appendix A.
Instances of failed experiment runs were attributed to various factors, including inaccuracies in the drone’s facing angle relative to the expected facing angle, leading to incorrect directional travel or being too far from the helipad vicinity to locate it successfully. Other factors contributing to failures included miscalculations in the distance to a fan, causing the drone to overshoot and travel behind the fan to search for the QR code. Additionally, selecting the incorrect t a r g e t _ f a n prompted the program to instruct the drone to return to the helipad, terminating the mission prematurely. The live video feed from the drone POV (point of view) can be found via the link Traveling salesman path—correct takeoff location videos.

6.2. Traveling Salesman-Based Experiments with Incorrect Takeoff Locations

Given the favorable success rates achieved in the traveling salesman-based experiments (in Table A1), a decision was made to modify the protocol. Instead of directing the drone to return to the helipad when an incorrect QR code was selected, the revised approach involved updating its coordinates and allowing it to proceed toward the t a r g e t _ f a n upon scanning an incorrect QR code. The algorithm for this refined version of coordinate calibration is presented in Algorithm 3.
A new experiment was conducted with this new possibility, i.e., of completing the mission even if the drone was not in the predetermined traveling salesman path due to heavy drift. In this experiment, the drone commenced its mission from a location other than the helipad. However, the takeoff location was still designated as the helipad at coordinates ( 0 , 0 ) , where the ultimate goal was to land on the helipad. This experiment assessed the drone’s ability to redirect onto the designated path autonomously. The results of this experiment are presented in Table A2 of Appendix A, where the first column specifies the selected fans for the path, the second column displays a Boolean variable to denote the success of the mission, as defined in Figure 21, the third column denotes the total flight time from takeoff to landing, and the fourth column denotes the location from which the drone took off. Meanwhile, the helipad remained at the ( 0 , 0 ) location, as perceived by the drone relative to the known fan locations. The results depicted in Table A2 are better than in Table A1 regarding being able to complete the mission, but the average flight times increased. This observation is likely due to the extra time taken to return to the planned path when the wrong QR code is scanned. Although Algorithms 2 and 3 both perform coordinate calibration, the results are better with this experiment, which uses Algorithm 3, even though the drone takes off at a deceiving location. The improved results are attributed to the autonomous system’s ability to correct itself when the wrong target is reached, showcasing the indoor navigation improvement. The live video feed from the drone’s POV (point of view) can be found via the link Traveling salesman path–incorrect takeoff location videos.

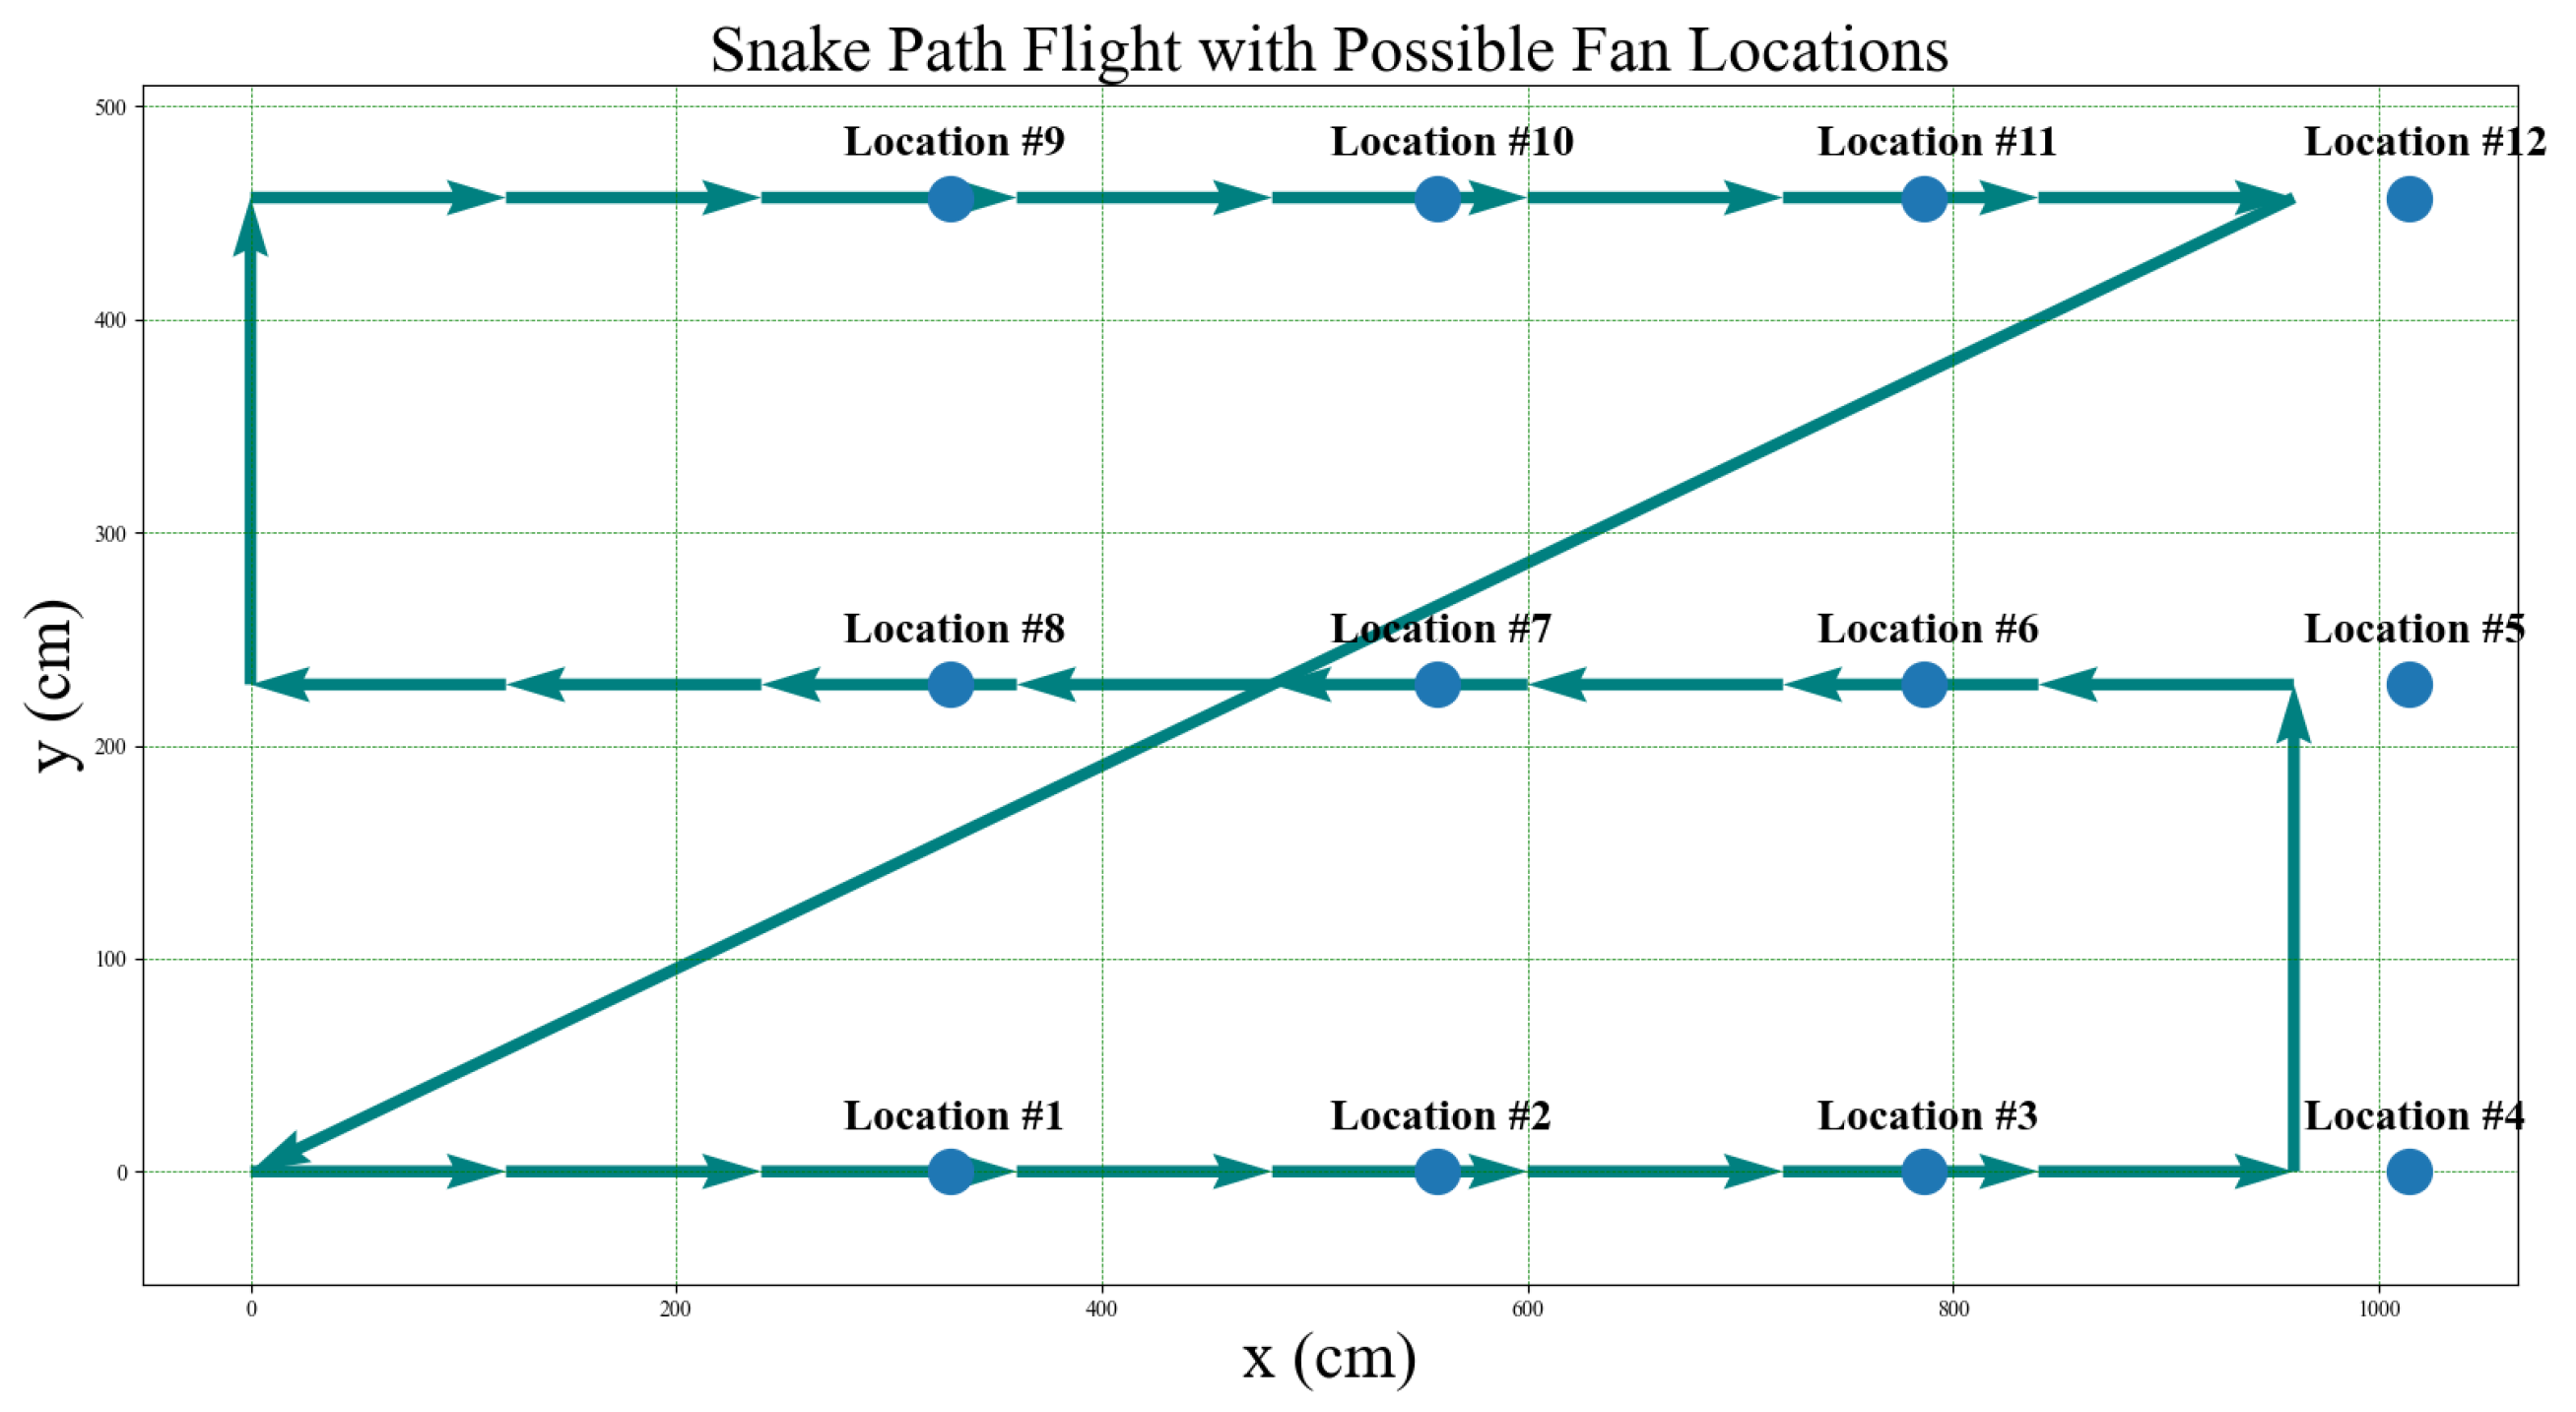
7. Snake Path Area Search Analysis and Exploration

The developed computer vision-based autonomous system is put through other experiments to test and demonstrate its robustness. The snake path area exploration experiment aims to employ a drone for the systematic exploration of a predefined region to identify and locate all fans present within that area. While the specific coordinates of the fans are not provided, the number of fans within the search region may either be known or unknown. If the quantity is known, the drone is directed to return to the helipad upon detecting some unique fans equivalent to the predetermined amount. Regardless of whether the quantity is known or unknown, the drone is instructed to return to the helipad upon completing a comprehensive search of the designated area. The tally of unique fans detected is reported upon concluding each mission. The flight algorithm is shown in Algorithm 4, which produces the path illustrated in Figure 22.
Python implementation of the snake path exploration experiments can be found in the snake_path_experiment folder of the shared repository. The script snake_path_experiment.py uses Algorithm 4 to guide the drone and uses check_camera.py at every step to check for detected objects. Once the desired object (here, the pedestal fan) is found, the QR data are returned from qr_reader.py to determine the number of detected fans.

7.1. Snake Path Area Search Experiments with a Given Number of Fans

Here, the snake path area exploration experiment is performed under the assumption of knowing the number of fans. The results of this experiment are depicted in Table A3 of Appendix A. In this table, passes represent the experiments in which the number of unique fans found matches the known number of fans in the exploration area, and the drone successfully returns to the helipad. A failure indicates that not all fans were found or that the drone was unsuccessful in finding the helipad. The total flight time is calculated from the takeoff until landing. Higher flight times are due to the fans being located near the end of the exploration path or the drone taking longer than usual to find the helipad circle. The recorded live video feed from the drone’s point of view (POV) can be found via the link Snake path search experiment with fan quantity known.

7.2. Snake Path Area Search Experiments Repeated with Unknown Number of Fans

The snake path area exploration experiment is repeated here, with the difference being that the number of fans is unknown, so the drone will always search the entire area before returning to the helipad. It is expected that the total flight duration will be greater than that of the original experiment. In this case, the drone will search the entire area of interest and report the number of fans found within the given search boundaries. The flight algorithm remains the same as in Algorithm 4. The results of this experiment are depicted in Table A4 of Appendix A. In this table, ‘passes’ represent experiment runs where the drone’s ending report matches the number of fans within the search area, and the drone successfully found the takeoff helipad for landing. ‘Fails’ represent flights where the ending report did not match the actual quantity of unique fans within the search area, or the drone was unable to find the helipad before the battery expired. The flight periods extend from takeoff to landing. The recorded live video feed from the drone’s POV can be found via the link Snake path search experiment with fan quantity unknown.

8. Educational Contributions

The research presented in this paper also has considerable educational contributions that can be used to improve the quality of education in courses such as computer vision, autonomous systems, and robotics. Included in the link below is the GitHub repository used for this project, with a detailed README.md file for the autonomous system to be replicated for various projects.
In addition, the link below contains tutorial videos for Tello and Tello EDU drones with code to help with the onboarding process of programming autonomous drone flights with live video feed. The code used is provided in the GitHub link above.
The main educational applications are as follows:
  • The presented research and proof of concept for the use of computer vision in the path planning of drones can be used to improve existing educational programs, as well as develop new educational practices, materials, theories, and educational programs that focus on the use of computer vision in drone path planning.
  • The effectiveness of the developed non-GPS computer vision-based navigation system for low-cost drones makes it an attractive candidate for large-scale educational purposes.
  • The project can be used in machine learning and drone-related courses to teach students how to implement course concepts in real-world applications and overcome challenges. Projects of this caliber, involving autonomous drones and computer vision, enhance students’ understanding and ability to apply course concepts to real-world applications while persevering through the associated challenges.
  • The educational aspect of the project reveals how to implement the experiments, simulated annealing, and image processing in detail using Python, ML libraries, path planning with Tello drones, computer vision tools and techniques using OpenCV, and patience in running a lot of experiments to confirm the results.
  • The research can also be used to inspire students to pursue careers in the fields of computer vision, autonomous drones, and robotics, and to help students think critically about the role of technology in society.

9. Conclusions

This study aimed to develop a computer vision-based solution using a low-cost autonomous drone system for wind turbine inspection that relies on a real-time camera feed using computer vision rather than GPS data. Our study addresses a surrogate problem of detecting the desired turbines in a wind farm, where pedestal fans simulate the turbines. The proposed approach employs computer vision-based path planning and navigation techniques to guide the drone, ensuring that it avoids collisions while visiting unique target locations via energy-efficient paths and completing the mission with a precise landing on a helipad. The presented results and analysis reveal the following aspects of the proposed approach:
(a)
The ability to achieve precise drone navigation within an indoor environment using computer vision methods.
(b)
The successful completion of traversal, detection, and landing tasks for most flights, as demonstrated by tests conducted on a surrogate small-scale wind farm model.
(c)
It offers a cost-effective alternative to GPS-based systems, making it appealing for educational applications and scenarios for GPS-denied environments.
(d)
It has the potential to enhance the autonomy and accuracy of wind farm navigation significantly by integrating visual-based adjustments alongside GPS technology.

10. Future Work

In forthcoming investigations, a key focus will be on the automation of dataset acquisition, which is essential for training and validating deep learning models. Initiatives in this direction are in progress, including the meticulous removal of circular enclosures from fans, thereby exposing intricate fan blades for the detailed health of the blades’ analysis. Additionally, a novel cascade classifier tailored for Haar detection has been meticulously trained to discern the nuanced features of the exposed fans. Furthermore, enhancements to the existing Python scripts are underway, aimed at capturing high-resolution live images and video feeds of the fan blades in diverse scenarios. To augment the robustness of the dataset, the captured images will be systematically shared with the image processing and deep learning team at Utah Valley University. This collaborative endeavor will facilitate the utilization of their prior research findings [44,45], providing a foundation for training deep convolutional neural networks (CNNs). The primary objective of this collaborative effort is to refine the models, enabling them to discriminate between damaged and healthy blades with a heightened level of accuracy and reliability.

Author Contributions

A.A.R. and M.S. conducted the experiments; A.A.R. and M.S. conceived and designed the study; A.A.R. and M.S. collected and analyzed the studies; A.A.R. and M.S. wrote the first draft of the manuscript. M.A.S.M. assisted in reviewing the manuscript and technical writing. All authors have read and agreed to the published version of the manuscript.

Funding

This work is supported by the Office of the Commissioner of Utah’s System of Higher Education (USHE)-Deep Technology Talent Initiative Grant 20210016UT.

Data Availability Statement

The GitHub repository contains all the necessary files for running the experiments described in this paper: GitHub repository: Surrogate wind farm navigation with the Tello EDU drone: https://github.com/MoShekaramiz/Tello_Edu_Surrogated_Wind_Fram. Videos containing the drone POV and console outputs for the traveling salesman experiments, where the drone’s starting coordinates are set to the helipad location of ( 0 , 0 ) , and the true location is at ( 0 , 0 ) ; traveling salesman path—correct takeoff location videos: Traveling salesman path—correct takeoff location videos. Videos containing the drone POV and console outputs for the traveling salesman experiments where the drone starting coordinate is set to the helipad location of ( 0 , 0 ) , and the true location is at a location indicated in the last column of Table A2; traveling salesman path—incorrect takeoff location videos: Traveling salesman path–incorrect takeoff location videos. Videos containing the drone POV and console outputs for the snake path experiments where the locations of the fans are unknown, but the number of fans in the area is known; snake path search—fan quantity known: Snake path search experiment with fan quantity known. Videos containing the drone POV and console outputs of the snake path experiments where the locations of the fans are unknown, and the number of fans in the area is unknown; snake path search—fan quantity unknown: Snake path search experiment with fan quantity unknown. Introductory-level Tello drone coding tutorial videos that introduce the installation and use of necessary libraries, such as djitellopy and OpenCV, coding basics, and running the code to demonstrate a live video feed during flight. These resources are based on drone_tutorial.py, which is included in the above GitHub repository. Drone tutorial code explanations and demonstrations: Quick-Drone-Tutorial.

Acknowledgments

The authors appreciate the contributions of former UVU students Branden Pinney and Quintin Jepsen for their help in developing the initial codes and running the experiments.

Conflicts of Interest

The authors declare no conflicts of interest.

Abbreviations

CCAcoordinate calibration algorithm
CCSCartesian coordinate system
CNNconvolutional neural network
FOVfield of view
GPSglobal positioning system
GPUgraphics processing unit
IRInfrared
LSBA list-based simulated annealing
MLmachine learning
POVpoint of view
QRquick response
RCremote control
RCCArobust coordinate calibration algorithm (with incorrect takeoff location)
RGBred–green–blue (used to describe the digital color camera type)
SAsimulated annealing
SATSsimulated annealing traveling salesman
SLAMsimultaneous localization and mapping
SPFAsnake path flight algorithm
TSPtraveling salesman problem
UAVunmanned aerial vehicle
VPSvision positioning system

Appendix A

Table A1. Results of the traveling salesman experiment with correct takeoff locations.
Randomly Selected Fans for Path (Order-Dependent)Pass (P) or Fail (F)Total Flight Time (s)
7, 3, 1P287
5, 7, 6F1, P, P, P, PNA, 159, 133, 187, 200
3, 7, 5P183
7, 2, 1P213
6, 2, 7P205
6, 4, 7P214
5, 6, 1P217
7, 3, 6P210
5, 7, 4P238
6, 4, 7P283
6, 2, 4P139
6, 3, 7, 5P285
1, 6, 7, 5P304
1, 3, 4, 7P362
1, 6, 2, 5P346
6, 4, 7, 5F2, P, P, P, PNA, 245, 241, 309, 268
4, 2, 6, 3P268
3, 2, 6, 1F3, P, P, P, PNA, 269, 239, 227, 290
4, 2, 6, 1P265
5, 4, 6, 3, 1P201
3, 6, 2, 4, 7P213
7, 4, 2, 3, 1P238
1, 3, 6, 2, 4F4, P, P, P, PNA, 268, 253, 204, 233
4, 2, 6, 3, 1P234
5, 4, 2, 6, 1P283
1, 3, 6, 4, 5P174
1, 6, 2, 4, 5P216
1, 3, 4, 7, 5P204
3, 6, 2, 4, 5P278
5, 4, 2, 6, 3, 1P261
1, 3, 6, 4, 7, 5P278
1, 3, 2, 4, 7, 5P290
1, 3, 2, 4, 7, 5P276
5, 4, 2, 6, 3, 1P406
1, 6, 2, 4, 7, 5P237
1, 3, 6, 2, 4, 5P294
1, 3, 2, 4, 7, 5P260
7, 4, 2, 6, 3, 1F5, F6, F5, P, PNA, NA, NA, 295, 359
3, 6, 2, 4, 7, 5P311
1, 3, 6, 2, 4, 7, 5P334
1, 3, 6, 2, 4, 7, 5P353
1, 3, 6, 2, 4, 7, 5P361
1, 3, 6, 2, 4, 7, 5P303
1, 3, 6, 2, 4, 7, 5P374
1, 3, 6, 2, 4, 7, 5P319
1, 3, 6, 2, 4, 7, 5P288
1, 3, 6, 2, 4, 7, 5P347
1, 3, 6, 2, 4, 7, 5P312
1, 3, 6, 2, 4, 7, 5P286
1 Drone successfully detected and scanned all fans before crashing into the environment boundary due to an angle crooked enough to lead the drone in the incorrect direction. 2 Drone successfully detected and scanned all fans, but missed the helipad, as the drone’s facing angle was crooked compared to the expected facing angle causing the drone to be too far from the helipad vicinity to successfully find it. 3 Drone successfully detected and scanned all fans except fan no. 1, which it overshot and searched for a QR code behind fan no. 1. 4 Drone successfully detected and scanned all fans, but missed the helipad as the drone’s facing angle was crooked compared to the expected facing angle, causing the drone to be too far from the helipad vicinity to successfully find it. 5 Drone successfully detected and scanned all fans but fan no. 1 before crashing into the environment boundary. 6 Drone drifted too far left to detect fan no. 7 within the camera frame.
Table A2. Results of the traveling salesman experiment with erroneous takeoff locations.
Randomly Selected Fans for Path (Order-Dependent)Pass (P) or Fail (F)Total Flight Time (s)Incorrect Takeoff Location (cm)
1, 4, 7P1275(−254, 254)
1, 3, 4P177(−152, −152)
5, 4, 3P180(152, −152)
3, 2, 4P2203(−254, −254)
1, 3, 2P3284(254, 254)
3, 4, 7P4247(297, 211)
6, 2, 7P5266(−147, 241)
5, 7, 1P6250(330, 119)
7, 6, 1P7233(610, 61)
4, 2, 6P8220(−89, 152)
5, 4, 2, 6, 1P9275(−254, 254)
3, 6, 2, 4, 7P10177(−152, −152)
5, 7, 4, 2, 3P11180(152, −152)
5, 4, 2, 6, 3P12203(−254, −254)
3, 6, 2, 4, 5P13284(254, 254)
1, 6, 4, 7, 5P14247(297, 211)
5, 7, 2, 6, 1P15266(0, 279)
5, 4, 6, 3, 1P16250(450, 307),
5, 4, 2, 6, 1P17233(589, 272),
1, 6, 2, 4, 5P18220(376, 369),
1 Detected Fan #5 instead of Fan #1. 2 Detected Fan #5 instead of Fan #3. 3 Detected Fan #3 instead of Fan #1. 4 Detected Fan #2 instead of Fan #3. 5 Detected Fan #4 instead of Fan #6. 6 Detected Fan #4 instead of Fan #5. 7 Detected Fan #2 instead of Fan #7. 8 Detected Fan #3 instead of Fan #4. 9 Detected Fan #7 instead of Fan #5. 10 Detected Fan #4 instead of Fan #3. 11 Detected Fan #1 instead of Fan #5. 12 Detected Fan #3 instead of Fan #5. 13 Detected Fan #5 instead of Fan #3. 14 Detected Fan #6 instead of Fan #1 and detected Fan #3 instead of Fan #1. 15 Detected Fan #7 instead of Fan #5. 16 Detected Fan #4 instead of Fan #5. 17 Detected Fan #2 instead of Fan #5. 18 Detected Fan #2 instead of Fan #1.
Table A3. Results of the snake path search experiment with the given number of fans.
Randomly Selected Fan Location(s)Pass (P) or Fail (F)Total Flight Time (s)
2P91
7P151
One Fan10P249average: 155
1P123
05P161
1, 9P231
11, 6P209
Two Fans5, 7P266average: 229.6
8, 10P303
6, 7P139
2, 9, 11P317
2, 7, 11P367
Three Fans1, 3, 5P285average: 318.6
4, 6, 8P305
1, 3, 10P319
1, 2, 3, 11P343
1, 2, 4, 7P264
Four Fans1, 2, 7, 11P287average: 335.4
4, 6, 9, 11P383
3, 8, 11, 12P400
1, 3, 5, 9, 11P391
7, 8, 9, 11, 12P350
Five Fans1, 3, 6, 2, 7P312average: 389.8
3, 8, 7, 9, 5P485
1, 2, 7, 10, 12P411
Table A4. Results of the snake path search experiment with an unknown number of fans.
Randomly Selected Fan Location(s)Pass (P) or Fail (F)Total Flight Time (s)
8P298
7P313
One Fan5P369average: 327.6
4P324
10P334
4, 8P363
3, 12P321
Two Fans1, 9P337average: 337.4
6, 10P325
6, 11P341
8, 10, 11P325
1, 5, 6P319
Three Fans7, 10, 11P337average: 315
2, 5, 6P274
7, 9, 11P320
3, 4, 8, 10P383
1, 2, 4, 12P330
Four Fans1, 4, 5, 8P324average: 362.6
3, 6, 8, 10P451
1, 2, 8, 9P325
1, 4, 8, 10, 11P400
1, 3, 5, 8, 11P393
Five Fans1, 4, 5, 11, 12P358average: 373
1, 4, 8, 9, 11P441
1, 2, 9, 10, 11P273

References

  1. Walford, C. Wind Turbine Reliability: Understanding and Minimizing Wind Turbine Operation and Maintenance Costs; SANDIA Report; SAND2006-1100; Sandia National Laboratories: Albuquerque, NM, USA, 2006; pp. 1–26.
  2. Besnard, F.; Bertling, L. An approach for condition-based maintenance optimization applied to wind turbine blades. IEEE Trans. Sustain. Energy 2010, 1, 77–83. [Google Scholar] [CrossRef]
  3. Nordin, M.H.; Sharma, S.; Khan, A.; Gianni, M.; Rajendran, S.; Sutton, R. Collaborative unmanned vehicles for inspection, maintenance, and repairs of offshore wind turbines. Drones 2022, 6, 137. [Google Scholar] [CrossRef]
  4. Guo, H.; Cui, Q.; Wang, J.; Fang, X.; Yang, W.; Li, Z. Detecting and positioning of wind turbine blade tips for UAV-based automatic inspection. In Proceedings of the IEEE International Geoscience and Remote Sensing Symposium (IGARSS), Yokohama, Japan, 28 July–2 August 2019; pp. 1374–1377. [Google Scholar]
  5. Yang, C.; Xun, L.; Hua, Z.; Yan, K.; John, S. Towards accurate image stitching for drone-based wind turbine blade inspection. Renew. Energy 2023, 203, 267–279. [Google Scholar] [CrossRef]
  6. Causa, F.; Franzone, A.; Fasano, G. Strategic and tactical path planning for urban air mobility: Overview and application to real-world use cases. Drones 2020, 7, 11. [Google Scholar] [CrossRef]
  7. Chung, H.M.; Maharjan, S.; Zhang, Y.; Eliassen, F.; Strunz, K. Placement and routing optimization for automated inspection with unmanned aerial vehicles: A study in offshore wind farm. IEEE Trans. Ind. Inform. 2020, 17, 3032–3043. [Google Scholar] [CrossRef]
  8. Chung, H.M.; Maharjan, S.; Zhang, Y.; Eliassen, F.; Yuan, T. Edge intelligence empowered UAVs for automated wind farm monitoring in smart grids. In Proceedings of the IEEE Global Communications Conference (GLOBECOM), Taipei, Taiwan, 7–11 December 2020; pp. 1–6. [Google Scholar]
  9. Cao, P.; Liu, Y.; Qiu, M.; Yang, C.; Xie, S. MEC-driven UAV routine inspection system in wind farm under wind influence. In Proceedings of the 12th International Conference on Intelligent Computation Technology and Automation (ICICTA), Xiangtan, China, 26–27 October 2019; pp. 672–677. [Google Scholar]
  10. Zhang, S.; Li, Y.; Ye, F.; Geng, X.; Zhou, Z.; Shi, T. A Hybrid Human-in-the-Loop Deep Reinforcement Learning Method for UAV Motion Planning for Long Trajectories with Unpredictable Obstacles. Drones 2023, 7, 311. [Google Scholar] [CrossRef]
  11. Apostolidis, S.D.; Vougiatzis, G.; Kapoutsis, A.C.; Chatzichristofis, S.A.; Kosmatopoulos, E.B. Systematically Improving the Efficiency of Grid-Based Coverage Path Planning Methodologies in Real-World UAVs’ Operations. Drones 2023, 7, 399. [Google Scholar] [CrossRef]
  12. Wang, L.; Zhang, Z. Automatic detection of wind turbine blade surface cracks based on UAV-taken images. IEEE Trans. Ind. Electron. 2017, 64, 7293–7303. [Google Scholar] [CrossRef]
  13. Wang, L.; Zhang, Z.; Luo, X. A two-stage data-driven approach for image-based wind turbine blade crack inspections. IEEE/ASME Trans. Mechatronics 2019, 24, 1271–1281. [Google Scholar] [CrossRef]
  14. Zhou, Y.; Chen, J.; Xu, R.; Cao, Z.; Jin, Z.; Guo, Z.; Wang, W.; Li, K. Three dimensional fully autonomous inspection method for wind power employing unmanned aerial vehicle based on 5G wireless communication and artificial intelligence. In Proceedings of the IEEE 5th Advanced Information Management, Communicates, Electronic and Automation Control Conference (IMCEC), Chongqing, China, 16–18 December 2022; Volume 5, pp. 800–805. [Google Scholar]
  15. Stokkeland, M.; Klausen, K.; Johansen, T.A. Autonomous visual navigation of unmanned aerial vehicle for wind turbine inspection. In Proceedings of the IEEE International Conference on Unmanned Aircraft Systems (ICUAS), Denver, CO, USA, 9–12 June 2015; pp. 998–1007. [Google Scholar]
  16. Moreno, S.; Peña, M.; Toledo, A.; Treviño, R.; Ponce, H. A new vision-based method using deep learning for damage inspection in wind turbine blades. In Proceedings of the IEEE 15th International Conference on Electrical Engineering, Computing Science and Automatic Control (CCE), Mexico City, Mexico, 5–7 September 2018; pp. 1–5. [Google Scholar]
  17. Car, M.; Markovic, L.; Ivanovic, A.; Orsag, M.; Bogdan, S. Autonomous wind-turbine blade inspection using LiDAR-equipped unmanned aerial vehicle. IEEE Access 2020, 8, 131380–131387. [Google Scholar] [CrossRef]
  18. Xu, Y.; Gu, H.; Dai, Q.; Lu, G.; Gu, J.; Hua, L. Motion tracking detection and tracking technology based on aerial video. In Proceedings of the IEEE 11th International Conference on Intelligent Human-Machine Systems and Cybernetics (IHMSC), Hangzhou, China, 24–25 August 2019; Volume 2, pp. 122–125. [Google Scholar]
  19. Valenti, F.; Giaquinto, D.; Musto, L.; Zinelli, A.; Bertozzi, M.; Broggi, A. Enabling computer vision-based autonomous navigation for unmanned aerial vehicles in cluttered GPS-denied environments. In Proceedings of the 21st International Conference on Intelligent Transportation Systems (ITSC), Maui, HI, USA, 4–7 November 2018; pp. 3886–3891. [Google Scholar]
  20. Jung, S.; Hwang, S.; Shin, H.; Shim, D.H. Perception, guidance, and navigation for indoor autonomous drone racing using deep learning. Robot. Autom. Lett. 2018, 3, 2539–2544. [Google Scholar] [CrossRef]
  21. Khan, S.Z.; Mohsin, M.; Iqbal, W. On GPS spoofing of aerial platforms: A review of threats, challenges, methodologies, and future research directions. PeerJ Comput. Sci. 2021, 7, e507. [Google Scholar] [CrossRef] [PubMed]
  22. Schilling, F.; Lecoeur, J.; Schiano, F.; Floreano, D. Learning vision-based flight in drone swarms by imitation. IEEE Robot. Autom. Lett. 2019, 4, 4523–4530. [Google Scholar] [CrossRef]
  23. Krul, S.; Pantos, C.; Frangulea, M.; Valente, J. Visual SLAM for indoor livestock and farming using a small drone with a monocular camera: A feasibility study. Drones 2021, 5, 41. [Google Scholar] [CrossRef]
  24. Ghazi, G.; Voyer, J. Use of a DJI Tello Drone as an Educational Platform in the Field of Control Engineering. In Proceedings of the Canadian Engineering Education Association (CEEA), Kelowna, BC, Canada, 17–21 June 2023. [Google Scholar]
  25. Verner, I.M.; Cuperman, D.; Reitman, M. Exploring robot connectivity and collaborative sensing in a high-school enrichment program. Robotics 2021, 10, 13. [Google Scholar] [CrossRef]
  26. Dorling, K.; Heinrichs, J.; Messier, G.G.; Magierowski, S. Vehicle routing problems for drone delivery. IEEE Trans. Syst. Man, Cybern. Syst. 2016, 47, 70–85. [Google Scholar] [CrossRef]
  27. Sundar, K.; Rathinam, S. Algorithms for routing an unmanned aerial vehicle in the presence of refueling depots. IEEE Trans. Autom. Sci. Eng. 2013, 11, 287–294. [Google Scholar] [CrossRef]
  28. Crevier, B.; Cordeau, J.F.; Laporte, G. The multi-depot vehicle routing problem with inter-depot routes. Eur. J. Oper. Res. 2007, 176, 756–773. [Google Scholar] [CrossRef]
  29. da Silva, Y.M.; Andrade, F.A.; Sousa, L.; de Castro, G.G.; Dias, J.T.; Berger, G.; Lima, J.; Pinto, M.F. Computer Vision Based Path Following for Autonomous Unmanned Aerial Systems in Unburied Pipeline Onshore Inspection. Drones 2022, 6, 410. [Google Scholar] [CrossRef]
  30. Caballero, F.; Merino, L. DLL: Direct LIDAR Localization. A map-based localization approach for aerial robots. In Proceedings of the 2021 IEEE/RSJ International Conference on Intelligent Robots and Systems (IROS), Prague, Czech Republic, 27 September–1 October 2021; pp. 5491–5498. [Google Scholar]
  31. Mur-Artal, R.; Tardós, J.D. Visual-inertial monocular SLAM with map reuse. IEEE Robot. Autom. Lett. 2017, 2, 796–803. [Google Scholar] [CrossRef]
  32. Pinney, B.; Duncan, S.; Shekaramiz, M.; Masoum, M.A. Drone path planning and object detection via QR codes; a surrogate case study for wind turbine inspection. In Proceedings of the IEEE Intermountain Engineering, Technology and Computing (IETC), Orem, UT, USA, 13–14 May 2022; pp. 1–6. [Google Scholar]
  33. Pinney, B.; Stockett, B.; Shekaramiz, M.; Masoum, M.A.; Seibi, A.; Rodriguez, A. Exploration and Object Detection via Low-Cost Autonomous Drone. In Proceedings of the IEEE Intermountain Engineering, Technology and Computing (IETC), Provo, UT, USA, 12–13 May 2023; pp. 49–54. [Google Scholar]
  34. Giernacki, W.; Rao, J.; Sladic, S.; Bondyra, A.; Retinger, M.; Espinoza-Fraire, T. DJI Tello quadrotor as a platform for research and education in mobile robotics and control engineering. In Proceedings of the IEEE International Conference on Unmanned Aircraft Systems (ICUAS), Dubrovnik, Croatia, 21–24 June 2022; pp. 735–744. [Google Scholar]
  35. Bai, O.; Chu, H. Drones in education: A critical review. Turk. J. Comput. Math. Educ. (TURCOMAT) 2021, 12, 1722–1727. [Google Scholar]
  36. Kirkpatrick, S.; Gelatt, C.D., Jr.; Vecchi, M.P. Optimization by simulated annealing. Science 1983, 220, 671–680. [Google Scholar] [CrossRef] [PubMed]
  37. Cook, W.J. In Pursuit of the Traveling Salesman: Mathematics at the Limits of Computation; Princeton University Press: Princeton, NJ, USA, 2015; ISBN 9780691163529. [Google Scholar]
  38. Zhan, S.h.; Lin, J.; Zhang, Z.j.; Zhong, Y.W. List-based simulated annealing algorithm for traveling salesman problem. Comput. Intell. Neurosci. 2016, 2016, 1712630. [Google Scholar] [CrossRef] [PubMed]
  39. Nourani, Y.; Andresen, B. A comparison of simulated annealing cooling strategies. J. Phys. Math. Gen. 1998, 31, 8373. [Google Scholar] [CrossRef]
  40. Rego, C.; Gamboa, D.; Glover, F.; Osterman, C. Traveling salesman problem heuristics: Leading methods, implementations and latest advances. Eur. J. Oper. Res. 2011, 211, 427–441. [Google Scholar] [CrossRef]
  41. Priambodo, A.; Arifin, F.; Nasuha, A.; Winursito, A. Face Tracking for Flying Robot Quadcopter based on Haar Cascade Classifier and PID Controller. In Proceedings of the Journal of Physics: Conference Series, Yogyakarta, Indonesia, 5 October 2021; Volume 2111, p. 012046. [Google Scholar]
  42. Lane, C.; Jones, O.; Miloro, C.; Frye, M. Development of Semi-Autonomous Flight & Detection Systems Using Small Drones. In Proceedings of the IEEE/AIAA 41st Digital Avionics Systems Conference (DASC), Portsmouth, VA, USA, 18–22 September 2022; pp. 1–9. [Google Scholar]
  43. Viola, P.; Jones, M. Rapid object detection using a boosted cascade of simple features. In Proceedings of the IEEE Computer Society Conference on Computer Vision and Pattern Recognition. (CVPR), Kauai, HI, USA, 8–14 December 2001; Volume 1, p. I. [Google Scholar]
  44. Miller, J.; Seegmiller, C.; Masoum, M.A.; Shekaramiz, M.; Seibi, A.C. Hyperparameter Tuning of Support Vector Machines for Wind Turbine Detection Using Drones. In Proceedings of the IEEE Intermountain Engineering, Technology and Computing (IETC), Provo, UT, USA, 12–13 May 2023; pp. 55–60. [Google Scholar]
  45. N’diaye, L.M.; Phillips, A.; Masoum, M.A.; Shekaramiz, M. Residual and wavelet based neural network for the fault detection of wind turbine blades. In Proceedings of the IEEE Intermountain Engineering, Technology and Computing (IETC), Orem, UT, USA, 13–14 May 2022; pp. 1–5. [Google Scholar]
Figure 1. DJI Tello EDU quadcopter equipped with a front-facing camera (used for object detection) and bottom camera (used for vision position system) with the coordinate system of the body frame.
Drones 08 00154 g001
Figure 2. Flowchart depicting the communication cycle between the local computer with Python scripts and DJI Tello EDU drone.
Drones 08 00154 g002
Figure 3. Flowchart of list-based simulated annealing (LSBA) algorithm [38].
Drones 08 00154 g003
Figure 4. A demonstration of the heuristic simulated annealing on a cyclic path of 25 randomly selected points. The arrows indicate the direction the drone is to travel in the exploratory area.
Drones 08 00154 g004
Figure 5. Each Haar feature depicted is a single value obtained by subtracting the sum of pixels under the white rectangle from the sum of pixels under the black rectangle [43].
Drones 08 00154 g005
Figure 6. The parameters returned from Haar cascade object detection are used to calculate the x / y distance and angle of the fans for the drone. The size and center of the bounding box may not always represent the precise location of fans (turbines), as demonstrated in the recorded videos.
Drones 08 00154 g006
Figure 7. An example showing the drone centers over the helipad using Hough transforms to provide feedback on the drone’s current position.
Drones 08 00154 g007
Figure 8. Illustration of the relationship between the actual and calculated distance based on object detection bounding boxes.
Drones 08 00154 g008
Figure 9. The aerial view of two cases used for calculating d, θ , and s. The left/right diagram refers to the case where the x-center of the bounding box is less/greater than half of the pixel width of the image.
Drones 08 00154 g009
Figure 10. From left to right the OpenCV’s rectangle function is applied to Haar detection boundaries for the red bounding boxes. The QR code is used for target verification and is read by the Python library ‘pyqrcode’. Using frames from the bottom camera live stream window, the Hough transform function is applied to detect the helipad circle and displays the modified image in a new window.
Drones 08 00154 g010
Figure 11. A demonstration of the heuristic simulated annealing for 7 randomly ordered fans used in experiments where fan identification is labeled.
Drones 08 00154 g011
Figure 12. A comparison of path distances before and after optimization for the number of fans to visit in the traveling salesman experiments.
Drones 08 00154 g012
Figure 13. Flowchart of the early version of the traveling salesman functionality in which the real-time recorded drone location would be updated by centering over the known location of helipads.
Drones 08 00154 g013
Figure 14. Pictures of the traveling salesman experiment setup and environment.
Drones 08 00154 g014
Figure 15. The bounding box center pixel is deemed too far from the frame’s center pixel so that a lateral shift can be performed.
Drones 08 00154 g015
Figure 16. After shifting laterally, the bounding box center pixel is deemed within the acceptable range of the frame’s center pixel.
Drones 08 00154 g016
Figure 17. If no helipad is detected on the bottom camera, the drone performs a snake path exploration to search for the helipad.
Drones 08 00154 g017
Figure 18. Although the helipad is in the frame, the exploration path continues since no circle is detected.
Drones 08 00154 g018
Figure 19. Hough transform for detecting the circle and a travel vector from the frame’s central pixel to the circle’s center pixel.
Drones 08 00154 g019
Figure 20. The drone recursively follows computed travel vectors until the frame’s center is near the circle center.
Drones 08 00154 g020
Figure 21. Flowchart of the revised traveling salesman functionality, where calibration is no longer conducted via helipads but through object detection of the known fan locations and QR codes confirming each location.
Drones 08 00154 g021
Figure 22. The planned flight path for the snake path search algorithm, where the location of the fans is not known.
Drones 08 00154 g022
Disclaimer/Publisher’s Note: The statements, opinions and data contained in all publications are solely those of the individual author(s) and contributor(s) and not of MDPI and/or the editor(s). MDPI and/or the editor(s) disclaim responsibility for any injury to people or property resulting from any ideas, methods, instructions or products referred to in the content.

