Article

Development of Unmanned Aerial Vehicle Navigation and Warehouse Inventory System Based on Reinforcement Learning

by
Huei-Yung Lin
1,*,
Kai-Lun Chang
2 and
Hsin-Ying Huang
2
1
Department of Computer Science and Information Engineering, National Taipei University of Technology, Taipei 106, Taiwan
2
Department of Electrical Engineering, National Chung Cheng University, Chiayi 621, Taiwan
*
Author to whom correspondence should be addressed.
Drones 2024, 8(6), 220; https://doi.org/10.3390/drones8060220
Submission received: 19 April 2024 / Revised: 21 May 2024 / Accepted: 27 May 2024 / Published: 28 May 2024
(This article belongs to the Section Drone Design and Development)

Abstract

:
In this paper, we present the exploration of indoor positioning technologies for UAVs, as well as navigation techniques for path planning and obstacle avoidance. The objective was to perform warehouse inventory tasks, using a drone to search for barcodes or markers to identify objects. For the indoor positioning techniques, we employed visual-inertial odometry (VIO), ultra-wideband (UWB), AprilTag fiducial markers, and simultaneous localization and mapping (SLAM). These algorithms included global positioning, local positioning, and pre-mapping positioning, comparing the merits and drawbacks of various techniques and trajectories. For UAV navigation, we combined the SLAM-based RTAB-map indoor mapping and navigation path planning of the ROS for indoor environments. This system enabled precise drone positioning indoors and utilized global and local path planners to generate flight paths that avoided dynamic, static, unknown, and known obstacles, demonstrating high practicality and feasibility. To achieve warehouse inventory inspection, a reinforcement learning approach was proposed, recognizing markers by adjusting the UAV’s viewpoint. We addressed several of the main problems in inventory management, including efficiently planning of paths, while ensuring a certain detection rate. Two reinforcement learning techniques, AC (actor–critic) and PPO (proximal policy optimization), were implemented based on AprilTag identification. Testing was performed in both simulated and real-world environments, and the effectiveness of the proposed method was validated.

1. Introduction

In recent years, drone-related technologies have attracted widespread attention across various fields. Drones are known for their light weight, flexibility, low cost, and efficiency, which allows them to perform diverse tasks, without the requirement of human intervention. The rapid development and potential applications of these technologies have received close interest from academia and industry alike. The various applications of drones include disaster monitoring, environmental surveillance, agriculture, logistics, security monitoring, etc. With the continuous development of drone technologies, they have immense potential for applications in many fields. However, it is worth noting that most current applications are outdoor-based, predominantly due to the limited availability of indoor positioning techniques. As demand for indoor usage of drones increases, precise positioning and stable flight control become crucial for promoting indoor drone applications. Thus, in this paper, we study and explore indoor drone positioning and path planning technologies, to enhance flight accuracy and control capabilities in indoor environments. This enables more diverse indoor drone applications, to meet demands across different domains. Moreover, an inventory management system based on the development of UAVs with reinforcement learning techniques was developed (Codes are available at https://github.com/kellen080/Navigation and https://github.com/kellen080/Indoor_Positioning (accessed on 26 May 2024)).
Indoor positioning refers to technology that achieves precise location tracking of a mobile device (such as a drone or a smartphone) or people within buildings or other enclosed spaces. Compared to outdoor positioning technology (such as GNSS), indoor positioning techniques face greater challenges, due to complex indoor environments, including signal interference and the inability to rely on satellite-based positioning. Typically, a combination of techniques such as visual features, inertial measurement units, and simultaneous localization and mapping (SLAM) are used to achieve redundant and accurate indoor positioning. Current popular approaches include the use of wireless signals, fiducial markers, inertial measurement units, and simultaneous localization and mapping from environmental perception.
Path planning is generally used in robotics and autonomous navigation, to derive a path from a starting point to a destination, while considering the obstacles and possible constraints in the environment. The goal is to determine the optimal trajectory or path that is safe, efficient, and satisfies specific conditions. Path planning is applied in various domains, such as robotics, autonomous navigation, and unmanned aerial vehicles (drones) [1].
Reinforcement learning has been investigated for decades, and it has proven its effectiveness in playing many video games [2]. Since its operations and strategy are similar to the applications of UAVs, it has gradually become adopted for flight control, to perform specific tasks. For the use in warehouse inventory, it is possible to let the UAVs learn how to move with a certain viewing angle and recognize items of interested [3]. With the deployment of UAVs, a warehouse inventory system can then access dangerous or hard-to-reach places. On the other hand, reinforcement learning is a method based on the interaction with environments to obtain feedback. The advantage of this machine learning approach is that the input data do not need to be labeled. Despite the requirement of a long training time, it has been successfully used in many real-world scenarios. Among reinforcement learning strategies, this paper adopts AC (actor–critic) [4] and PPO (proximal policy optimization) [5] to construct environmental conditions, action generation, scoring methods, etc. for training. In our application, the design of the environmental conditions involves feature extraction of images. Based on the current situation, two types of action are generated: moving, or changing the camera angle. In addition to performing the basic task of tag identification, scoring also includes other auxiliary methods, such as considering the operation cost.

2. Related Works

2.1. Indoor Localization and Path Planning

Commonly adopted techniques utilizing wireless signals to measure the position and orientation of an object in indoor environments include UWB (ultra-wideband) [6], BLE (Bluetooth low energy) [7], and Wi-Fi [8]. Usually, these approaches measure signal-based parameters such as the time of arrival (TOA), time difference of arrival (TDOA), two-way ranging (TWR), or angle of arrival (AOA). Based on the principles of triangulation, signal propagation models, or fingerprint data, the location of objects can be calculated. The advantages of these methods include low power consumption, cost-effectiveness, and easy deployment and maintenance. They have effectively addressed issues related to multi-path effects [9] and signal penetration through obstacles, providing high accuracy and reliability in positioning. These technologies find applications in various fields, including navigation, tracking, security, and smart homes.
Fiducial markers are small and distinctive patterns or symbols used as reference points in computer vision systems. They are placed in an environment to assist the system in determining the position and orientation of objects when the system has difficulty solely relying on the appearance of the objects for localization. Fiducial markers find numerous applications in fields such as robotics, augmented reality, and computer vision, including indoor positioning, robot navigation, and architectural measurements, etc. In general, fiducial markers possess characteristics such as fixed positions, prominent features, and uniqueness. Fiducial markers can present various forms, including 2D or 3D patterns, or simple colored dots. Among them, the most common types of fiducial markers are 2D barcode-like patterns, such as AprilTag [10], ArUco [11], and ARToolKit [12]. The markers can be scanned or recognized by sensors like cameras and radars, and their known geometric structures and sizes are used to determine their positions and orientations within the scene.
Visual-inertial odometry (VIO) is a positioning technology utilizing both cameras and inertial measurement units (IMU). A camera provides a series of image data, while the IMU measures the acceleration and angular velocity of the device. The key to VIO techniques lies in fusing the data from camera and IMU to eliminate the drift issues commonly encountered when using visual odometry (VO) alone. Specifically, VIO fuses the visual information from a camera with the acceleration and gyroscope data from an IMU to obtain a more accurate camera trajectory, enabling precise and robust tracking of the device’s motion over time. VIO technology offers advantages such as high accuracy and real-time performance, allowing it to operate in real time in various environments. Consequently, VIO has widespread applications in many fields, such as computer vision, robotics, and autonomous navigation. Commonly adopted VIO techniques include OKVIS [13], MSCKF [14], and ROVIO [15].
Simultaneous localization and mapping (SLAM) is a computational technique used in robotics and computer vision. The objective is to construct an environment map and simultaneously estimate a robot’s or sensor’s position in the unknown environment using information sensed by the moving robot or sensors (such as stereo cameras, radars, and LiDARs). In an unknown space, SLAM techniques enable a robot to detect its own pose in real time, while simultaneously creating a detailed map during the process. Over the years, SLAM has garnered widespread attention and research. Some popular SLAM techniques include RTAB-Map [16], VINS-Mono [17], and ORB-SLAM2 [18]. Implementing a SLAM system is complex and requires consideration of various factors, such as sensor accuracy and environmental uncertainty. Nevertheless, SLAM is crucial for achieving autonomous navigation in mobile robotics and has significant applications in unmanned aerial vehicles (drones), autonomous vehicles, and robotic systems [19].
Global path planning typically involves generating maps or representations of the environment. It utilizes search algorithms to find an optimal path in a robot’s configuration space, while avoiding obstacles and adhering to environmental constraints as much as possible. Real-time environmental influences and the robot’s actual motion state are not taken into account in general. Global path planning is an offline process. It requires path planning and map building before the robot is set in motion. This allows the robot to quickly obtain path planning results during task execution, to avoid encountering unknown obstacles that may lead to mission failure. In global path planning, the structure and layout of the environment are typically considered as a whole, including the starting and ending positions, map information, constraint conditions, cost functions, and other information. A few commonly used approaches include graph-based methods [20], genetic-algorithm-based methods [21], and deep-learning-based methods [22]. The output is usually a high-level path or trajectory, followed by a low-level controller or motion planner to execute the planned path.
Local path planning refers to the process of calculating the next action the robot will take based on its current position, orientation, and information about the surrounding environment during its movement. It is used to determine the optimal path or trajectory for a moving object in a small region of the environment, usually around the object’s current position, to enable a robot to reach the target point, while ensuring flight safety. In practice, global path planning and local path planning are often combined. Global path planning determines the general direction for the movement, while local path planning continuously adjusts the robot’s motion trajectory in real time during its movement. Some well-known local path planning techniques include the dynamic window approach (DWA) [23], artificial potential field [24], and methods based on virtual constraints [25].

2.2. Warehouse Inventory Inspection

Currently, the logistics industry is extremely developed, and a number of solutions have been investigated for warehouse management. Among them, warehouse inventory is considered a specifically important part of warehouse management. The main task is to confirm the correct quantity and types of cargoes. To ensure the correctness and traceability of quantity, it is necessary to have a timely update of the records of cargo. In conventional methods, stocktaking is generally carried out manually, which is a time-consuming, labor-intensive, and error-prone task. Nevertheless, automated solutions have been introduced for warehousing systems in the process of industrial automation, to improve efficiency and reduce costs. Techniques for reducing inventory time include the use of new scanning and sensing technologies, and robot guidance planning, etc.
In [26], Kalinov et al. presented an autonomous heterogeneous robot system for warehouse inventory [26]. The tasks of UGRs (unmanned ground robot) and UAVs include global positioning, navigation, and barcode scanning. In addition to regular cameras, an UAV is equipped with a laser scanner for barcode scanning. It flies above the UGR for power supply and data transmission. For real-time barcode detection and reading, convolutional neural networks (CNNs) are commonly adopted [27]. Once the barcode location with respect to the UAV is known, it can be used to generate a barcode map and optimize the path for inventory investigation [28]. In most applications, the motion path of the UAV can be derived using the traveling salesman problem, and unconfirmed barcodes can be used for future path planning [29]. Once new barcodes have been detected, they will be verified and included to the database, followed by positional updating and trajectory optimization of the UAV.
Cristiani et al. presented an inventory management system using mini-drones [30]. Their proposed architecture consists of four parts: an intelligent warehouse, one or more drones, a ground control station (GCS), and a ground charging station (GRS). The intelligent warehouse contained shelves, aisles, and cargo with unique labels. A ground control station was used to control the flight path, as well as transmit the inventory data over WiFi. When performing the scanning task, the UAV moves vertically in a zigzag shape to detect the labels on all shelf units. Yoon et al. presented a technique to scan products and estimate the 3D position of a drone [31]. Barcodes were detected with a trained segmentation model. They reported good success rates on localization of QR codes. More recently, Rhiat et al. presented the idea of a “smart shelf”, to optimize inventory management [32]. They employed a mobile robot with gripper for navigation and manipulation. iBeacon and RFID were used to identify the items on the shelf.
The application scenario of the proposed inventory management system contained storage boxes placed on a double-layer shelf. Unlike most developments for warehouse inventory [33,34], our target items are placed randomly with AprilTags [35] attached for detection and recognition. Due to the motion path of the UAV, the AprilTags might be blocked from certain camera viewpoints. In this paper, we propose a path planning method based on partially observable markers, with identification via orientation estimation of a camera. The ROIs (regions of interest) are first identified using an object detection network, with consideration of various factors including occlusion, image blur, visible size, and 3D pose. In addition, K-means clustering is adopted to group the feature points and predict the location of the AprilTag. With an implementation based on AprilTag 2 [36], we are able to perform detection at a high frame rate for far range markers.

3. Localization and Navigation

The proposed method includes two components: indoor mapping and localization, and path planning with obstacle avoidance. For indoor mapping and localization, various global and local indoor positioning techniques, including UWB, QVIO, AprilTag, and RTAB-Map SLAM, are used for multi-sensor fusion. The system architecture is shown in Figure 1, with the indoor positioning module on the left. We also demonstrated indoor localization trajectories, and compared the performance of each sensor. For path planning and obstacle avoidance, the ROS (robot operating system) Navigation Stack’s global path planner is utilized to find the optimal path, while the local path planner is used to avoid unknown obstacles, as illustrated in the center of Figure 1. The integration of RTAB-Map [16], a visual feature-based indoor localization technique, was carried out, reducing costs by using a low-cost camera. Finally, this was integrated with MAVROS, PX4 Autopilot, and QGroundControl, enabling the unmanned aerial vehicle (UAV) to fly autonomously. As shown on the right of Figure 1, the system achieves indoor mapping, localization, path planning, and obstacle avoidance capabilities.

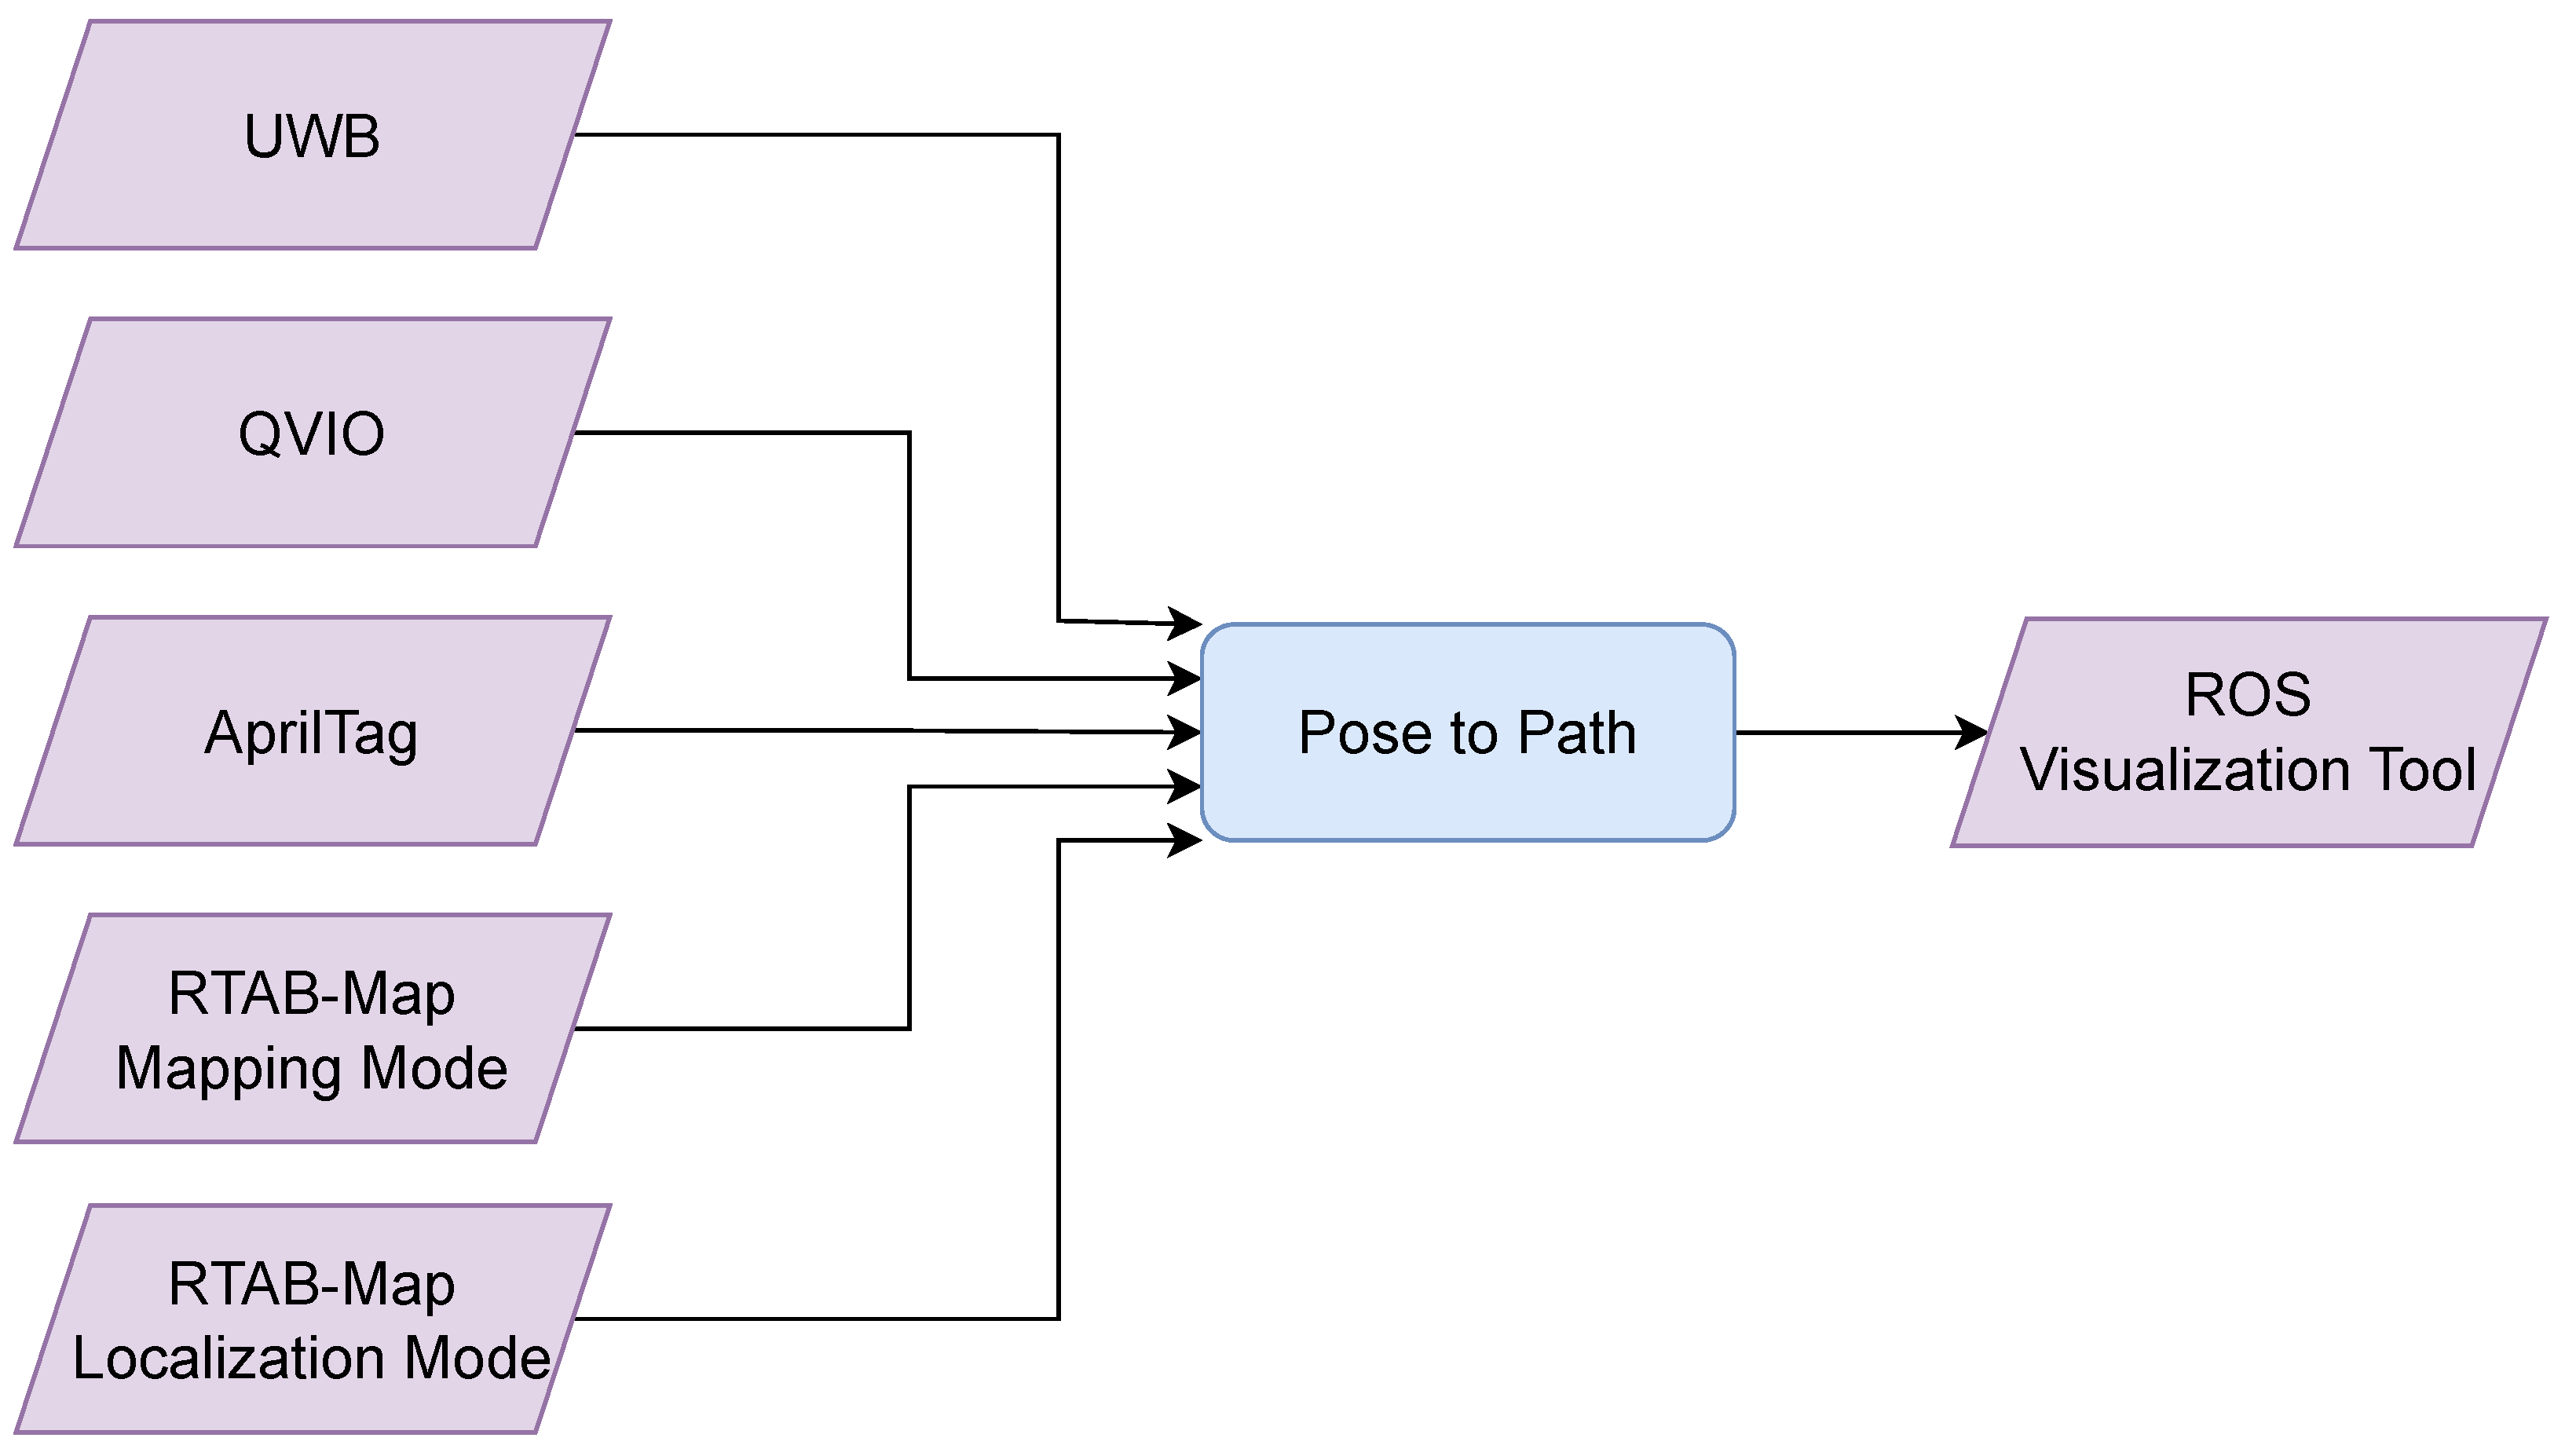
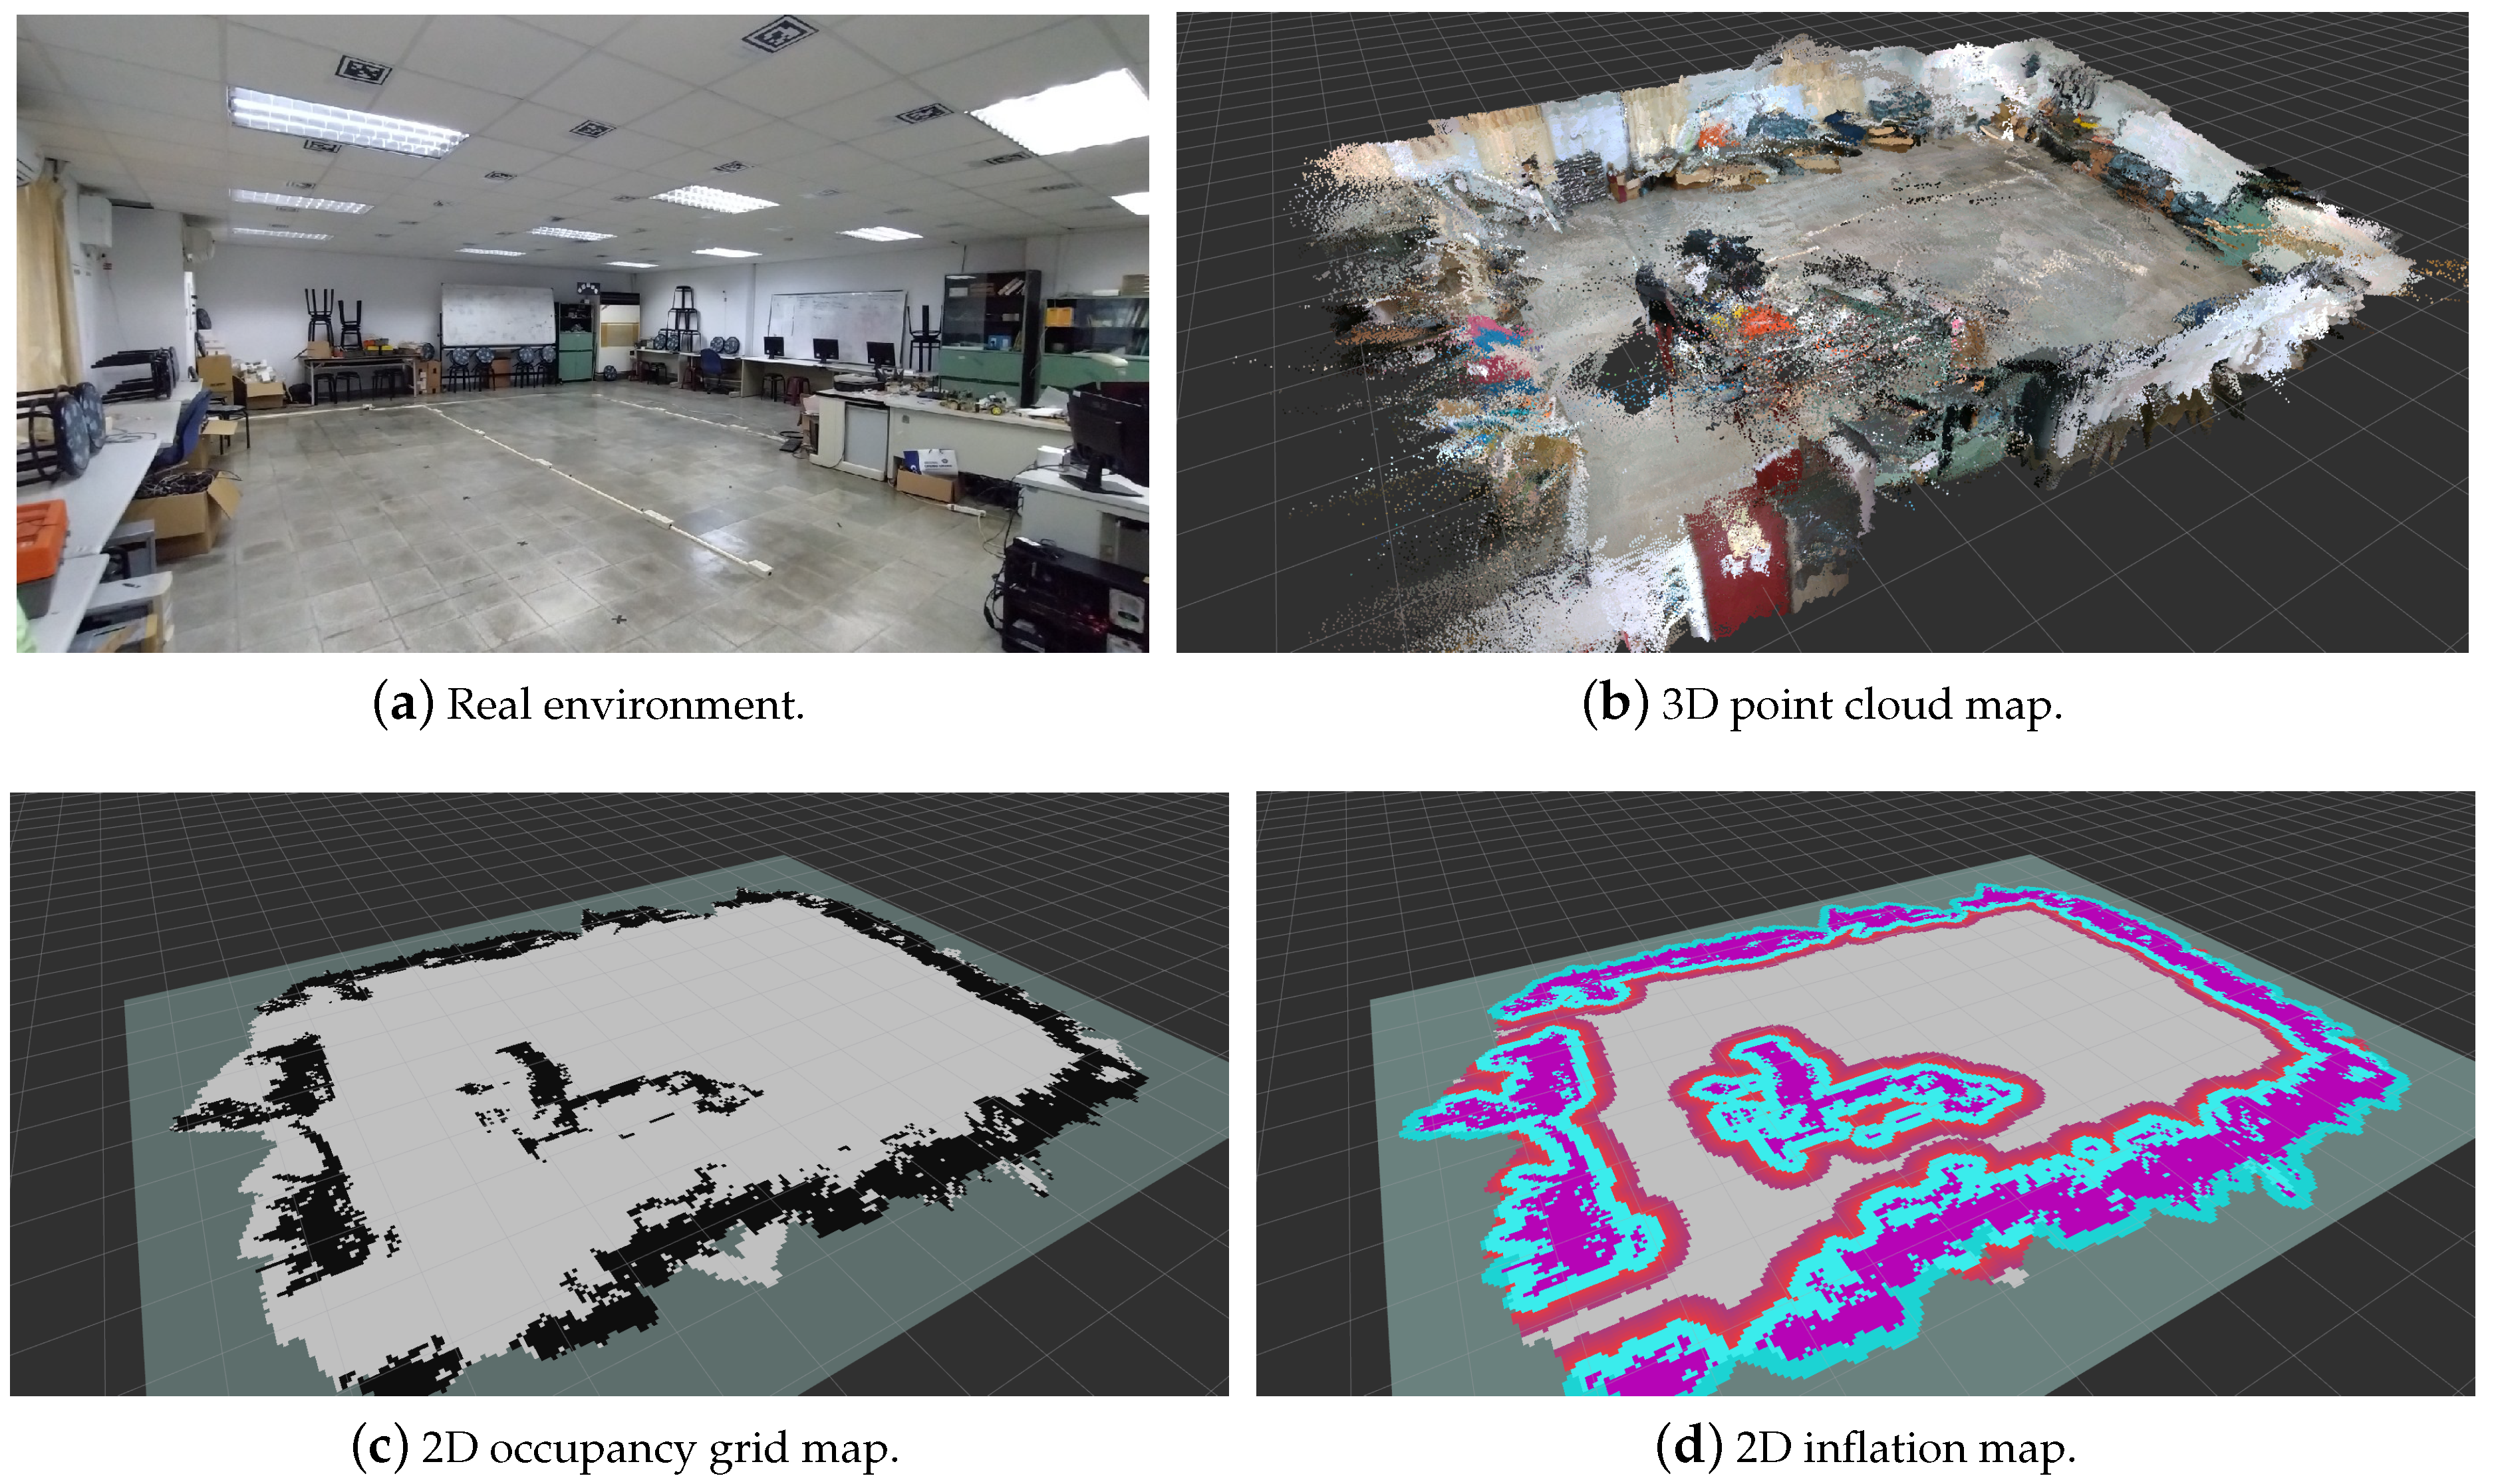
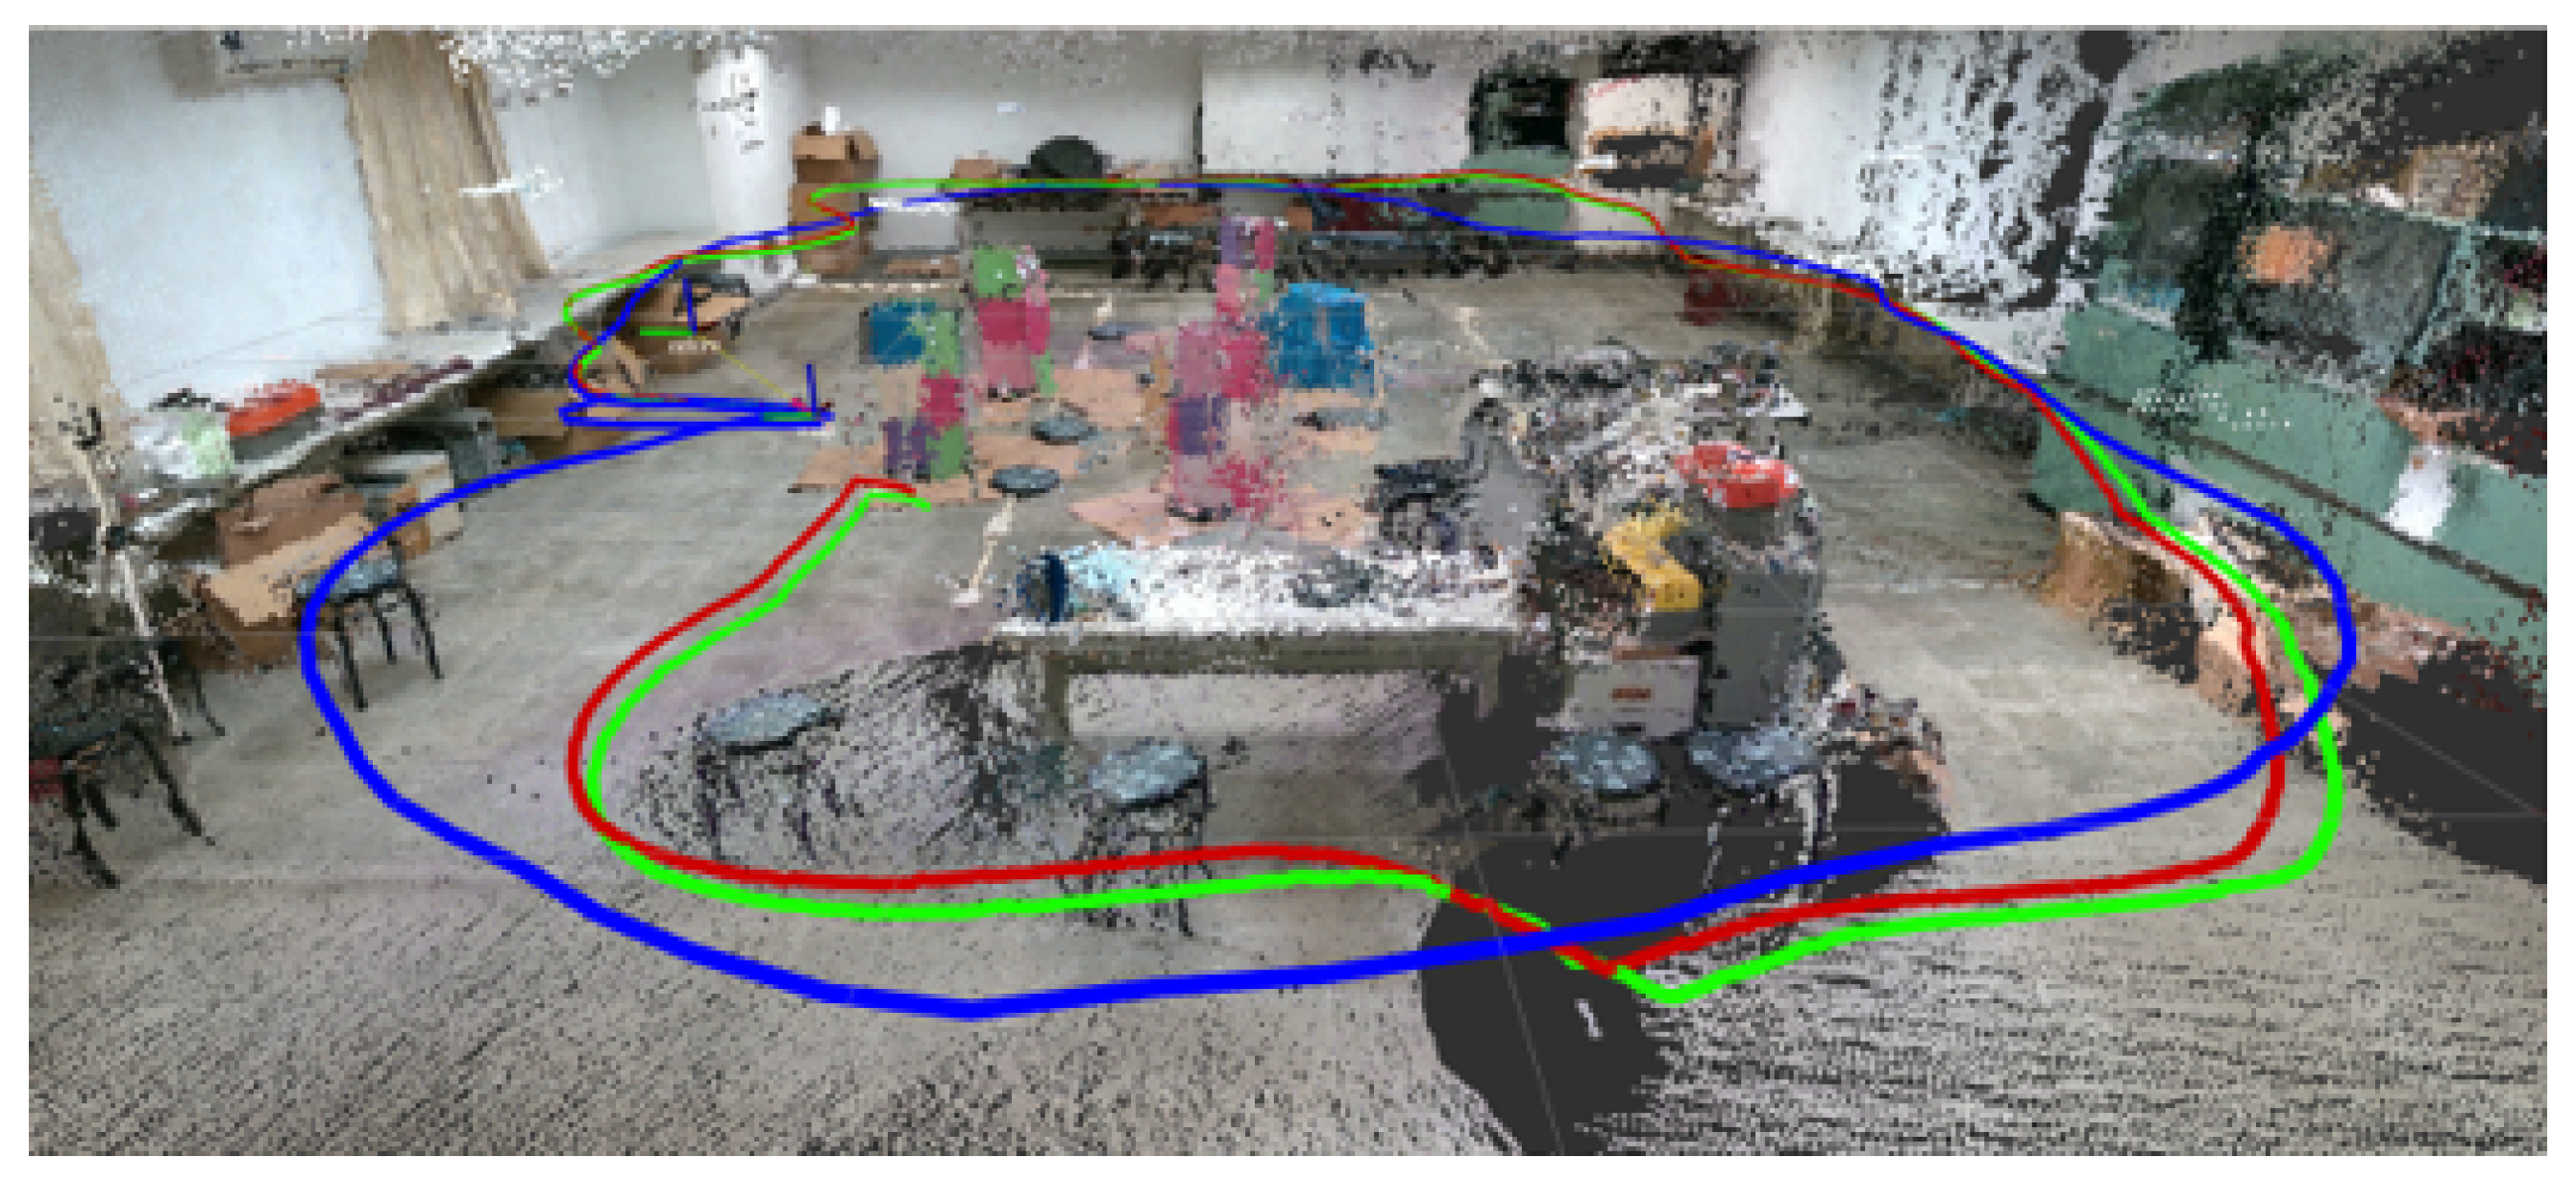
3.1. Indoor Mapping and Positioning

The experiments of this work were conducted in a laboratory environment with dimensions of 8 m in length, 7 m in width, and 2.5 m in height. The environment setup included using items with rich visual features, obstacles used for drone obstacle avoidance testing, placing UWB anchors around the perimeter of the environment, and having AprilTag positioning markers mounted on the ceiling. These settings were used to test and validate the indoor positioning and navigation algorithms. For indoor mapping and localization, many positioning methods were compared, as depicted in Figure 2. After the environment had been set up, the different positioning techniques were activated, and the pose obtained from each sensor was converted into a path. Finally, the paths were displayed on RViz for visualization.
We used the mvVISLAM (machine vision Visual-Inertial SLAM) algorithm, QVIO (Qualcomm VIO), provided by Qualcomm machine vision SDK (mvSDK) as our local positioning method. QVIO employs an extended Kalman filter (EKF) to fuse data from the IMU and camera tracking, which results in 6 DOF pose estimation with real-world coordinates. Utilizing a fish-eye tracking camera mounted at a 45-degree downward angle on the front of the drone, visual feature extraction was performed on the captured images. In the experiments, it was observed that even though the images could include the drone’s landing gear, the stability of the QVIO (visual-inertial odometry) system was not significantly affected, as long as there were sufficient feature points in the images. On the contrary, when lacking feature points, QVIO became more susceptible to losing odometry, due to the momentary acceleration of the drone.
The principles of UWB global positioning technology are similar as for a GPS satellite. By deploying a number of known-coordinate positioning anchor points (UWB Anchors) indoors and placing a positioning tag (UWB Tag) on the object to be located, the tag continuously emits pulses at a certain frequency that are used to measure the distance to each anchor. Finally, through an algorithm, the current position of the tag is determined.
In this work, we used AprilTag fiducial markers of the Tag36h11 category for precise global indoor positioning. These AprilTags were placed on the indoor ceiling. ROS wrapper:apriltag_ros provided the AprilTag fiducial marker detection algorithm, allowing us to detect the marker ID and its current pose with respective to the camera. It was then published on the ROS platform for further use. We also implemented functions for tag bundle detection and tag bundle calibration, enabling the detection of multiple tags in a single or consecutive images.
rtabmap_ros is a ROS wrapper for RTAB-Map, which is a RGB-D SLAM method based on real-time constraints and loop closure detection. It is capable of generating 3D point cloud maps and creating 2D occupancy grid maps for navigation. RTAB-Map can be used to build a map of the environment by fusing data from RGB-D sensors, and it employs loop closure detection to optimize the map and improve localization accuracy.

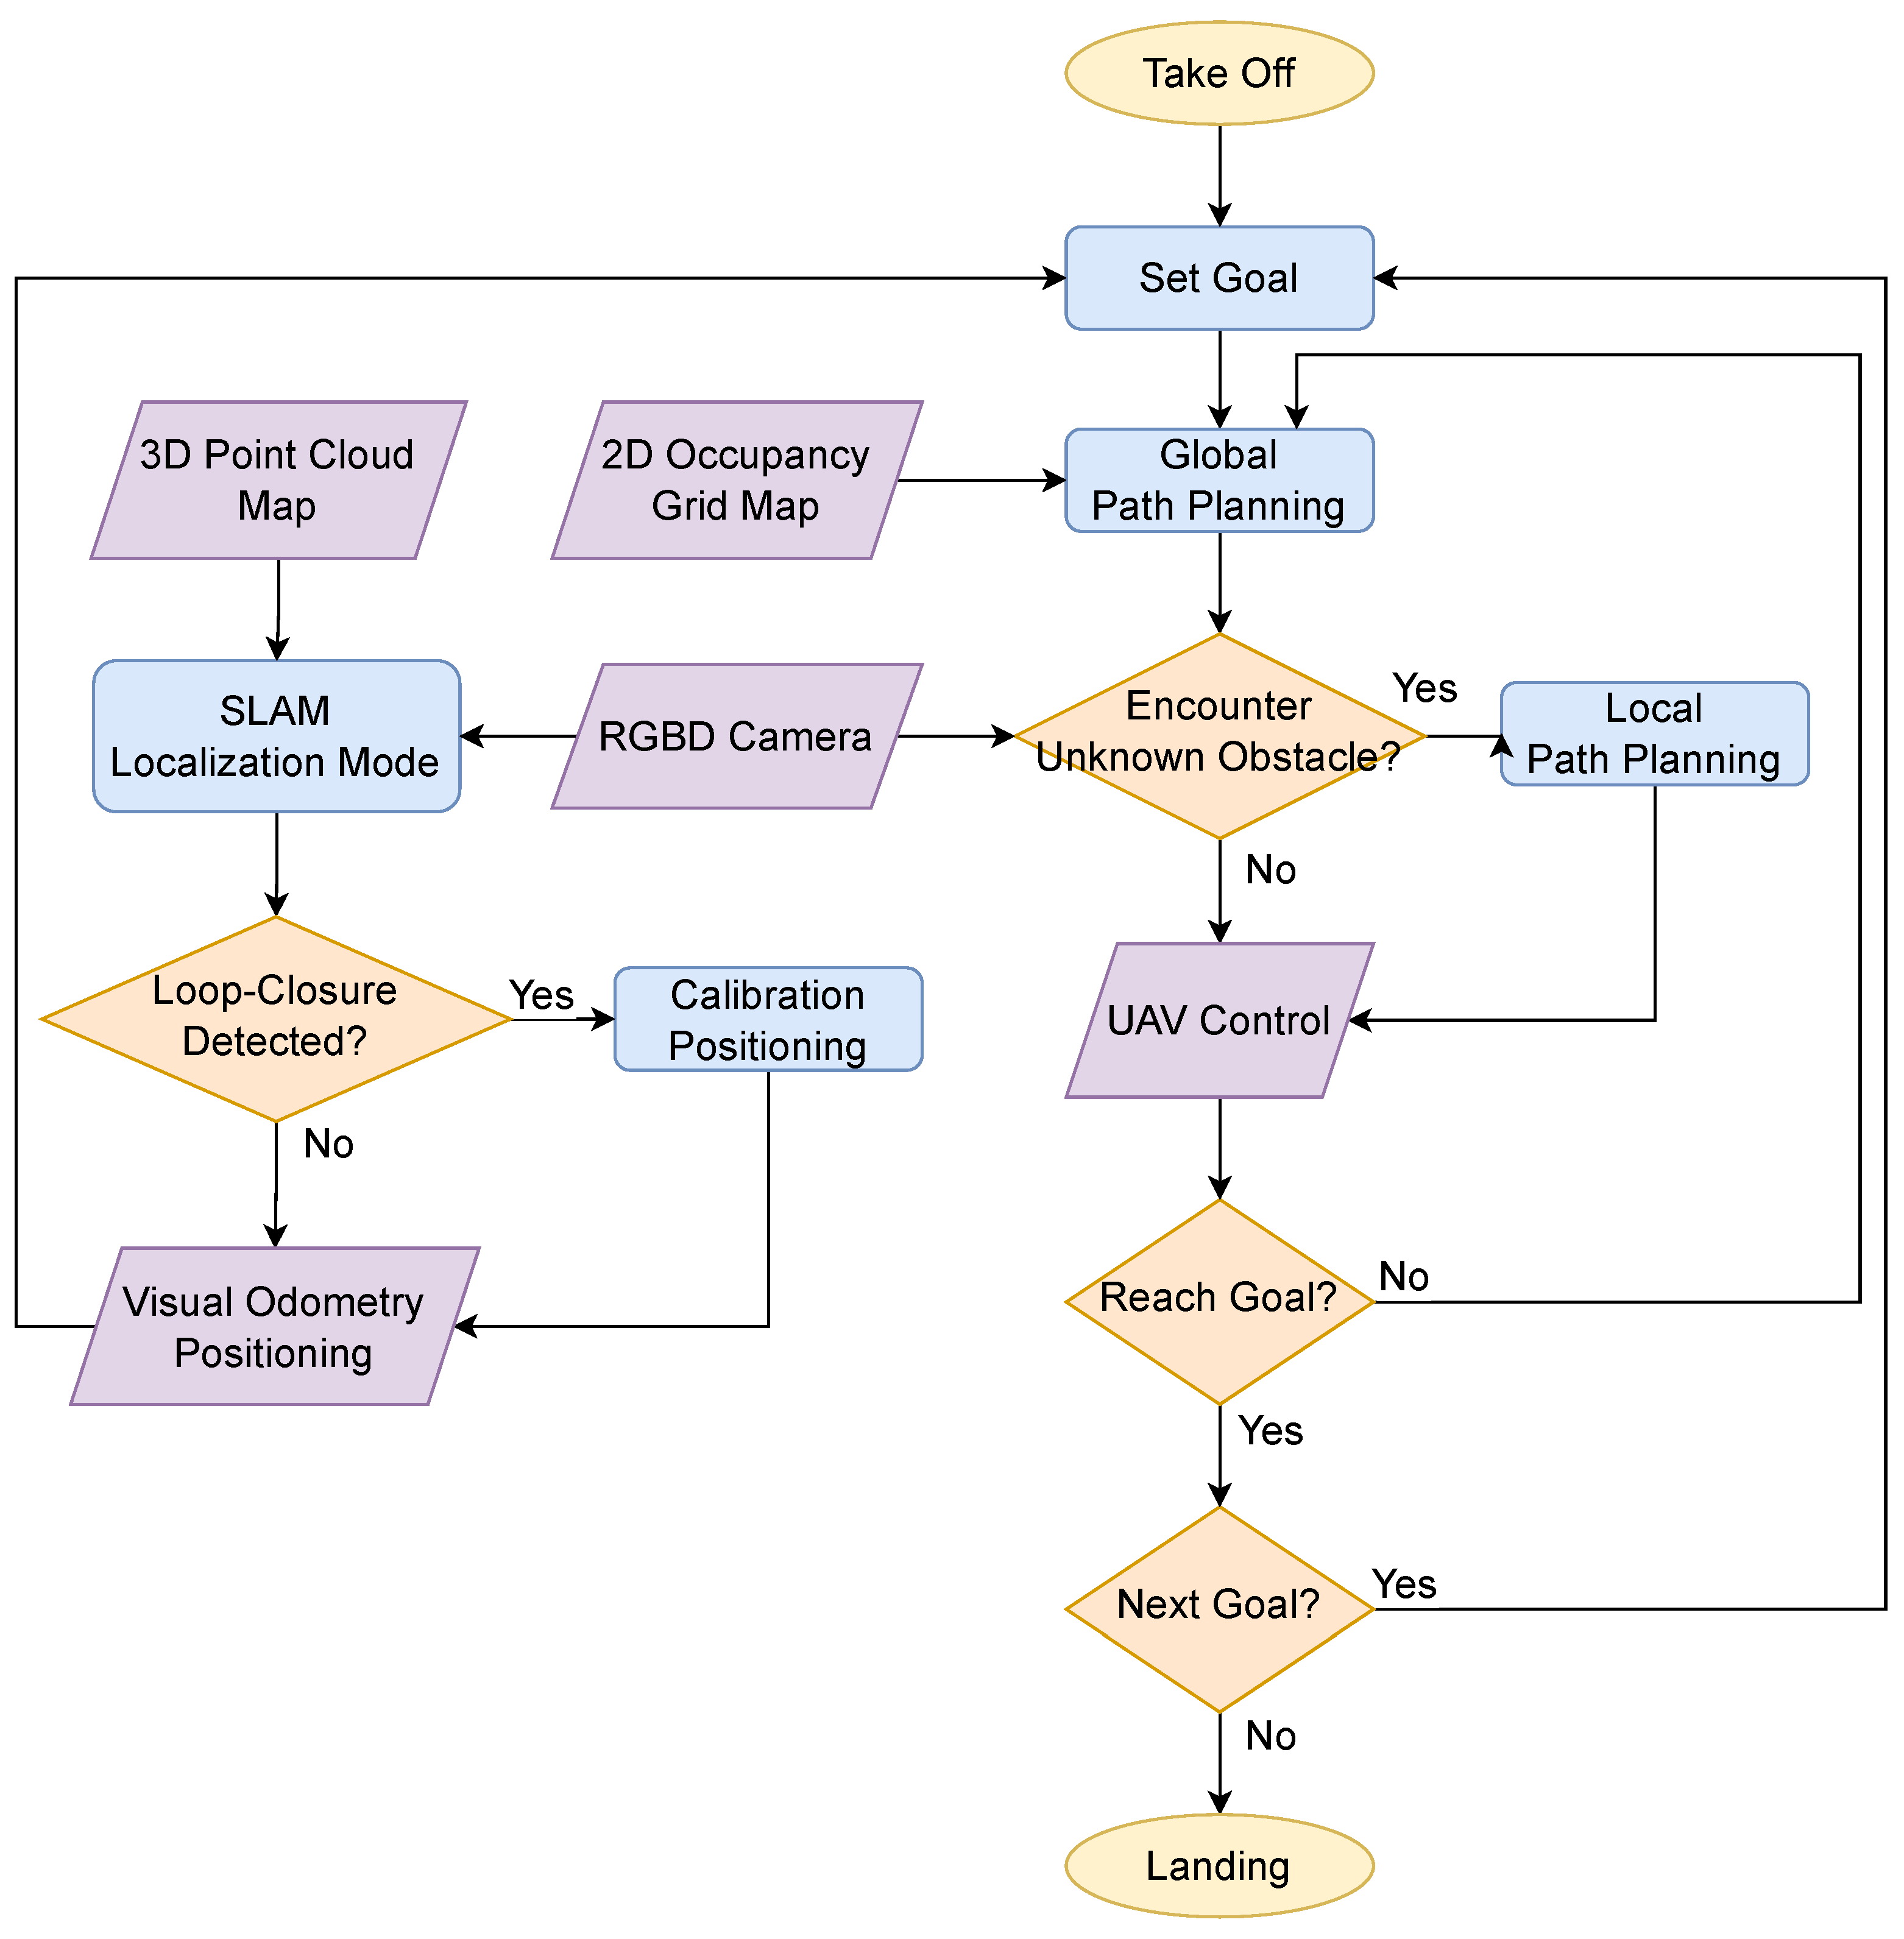
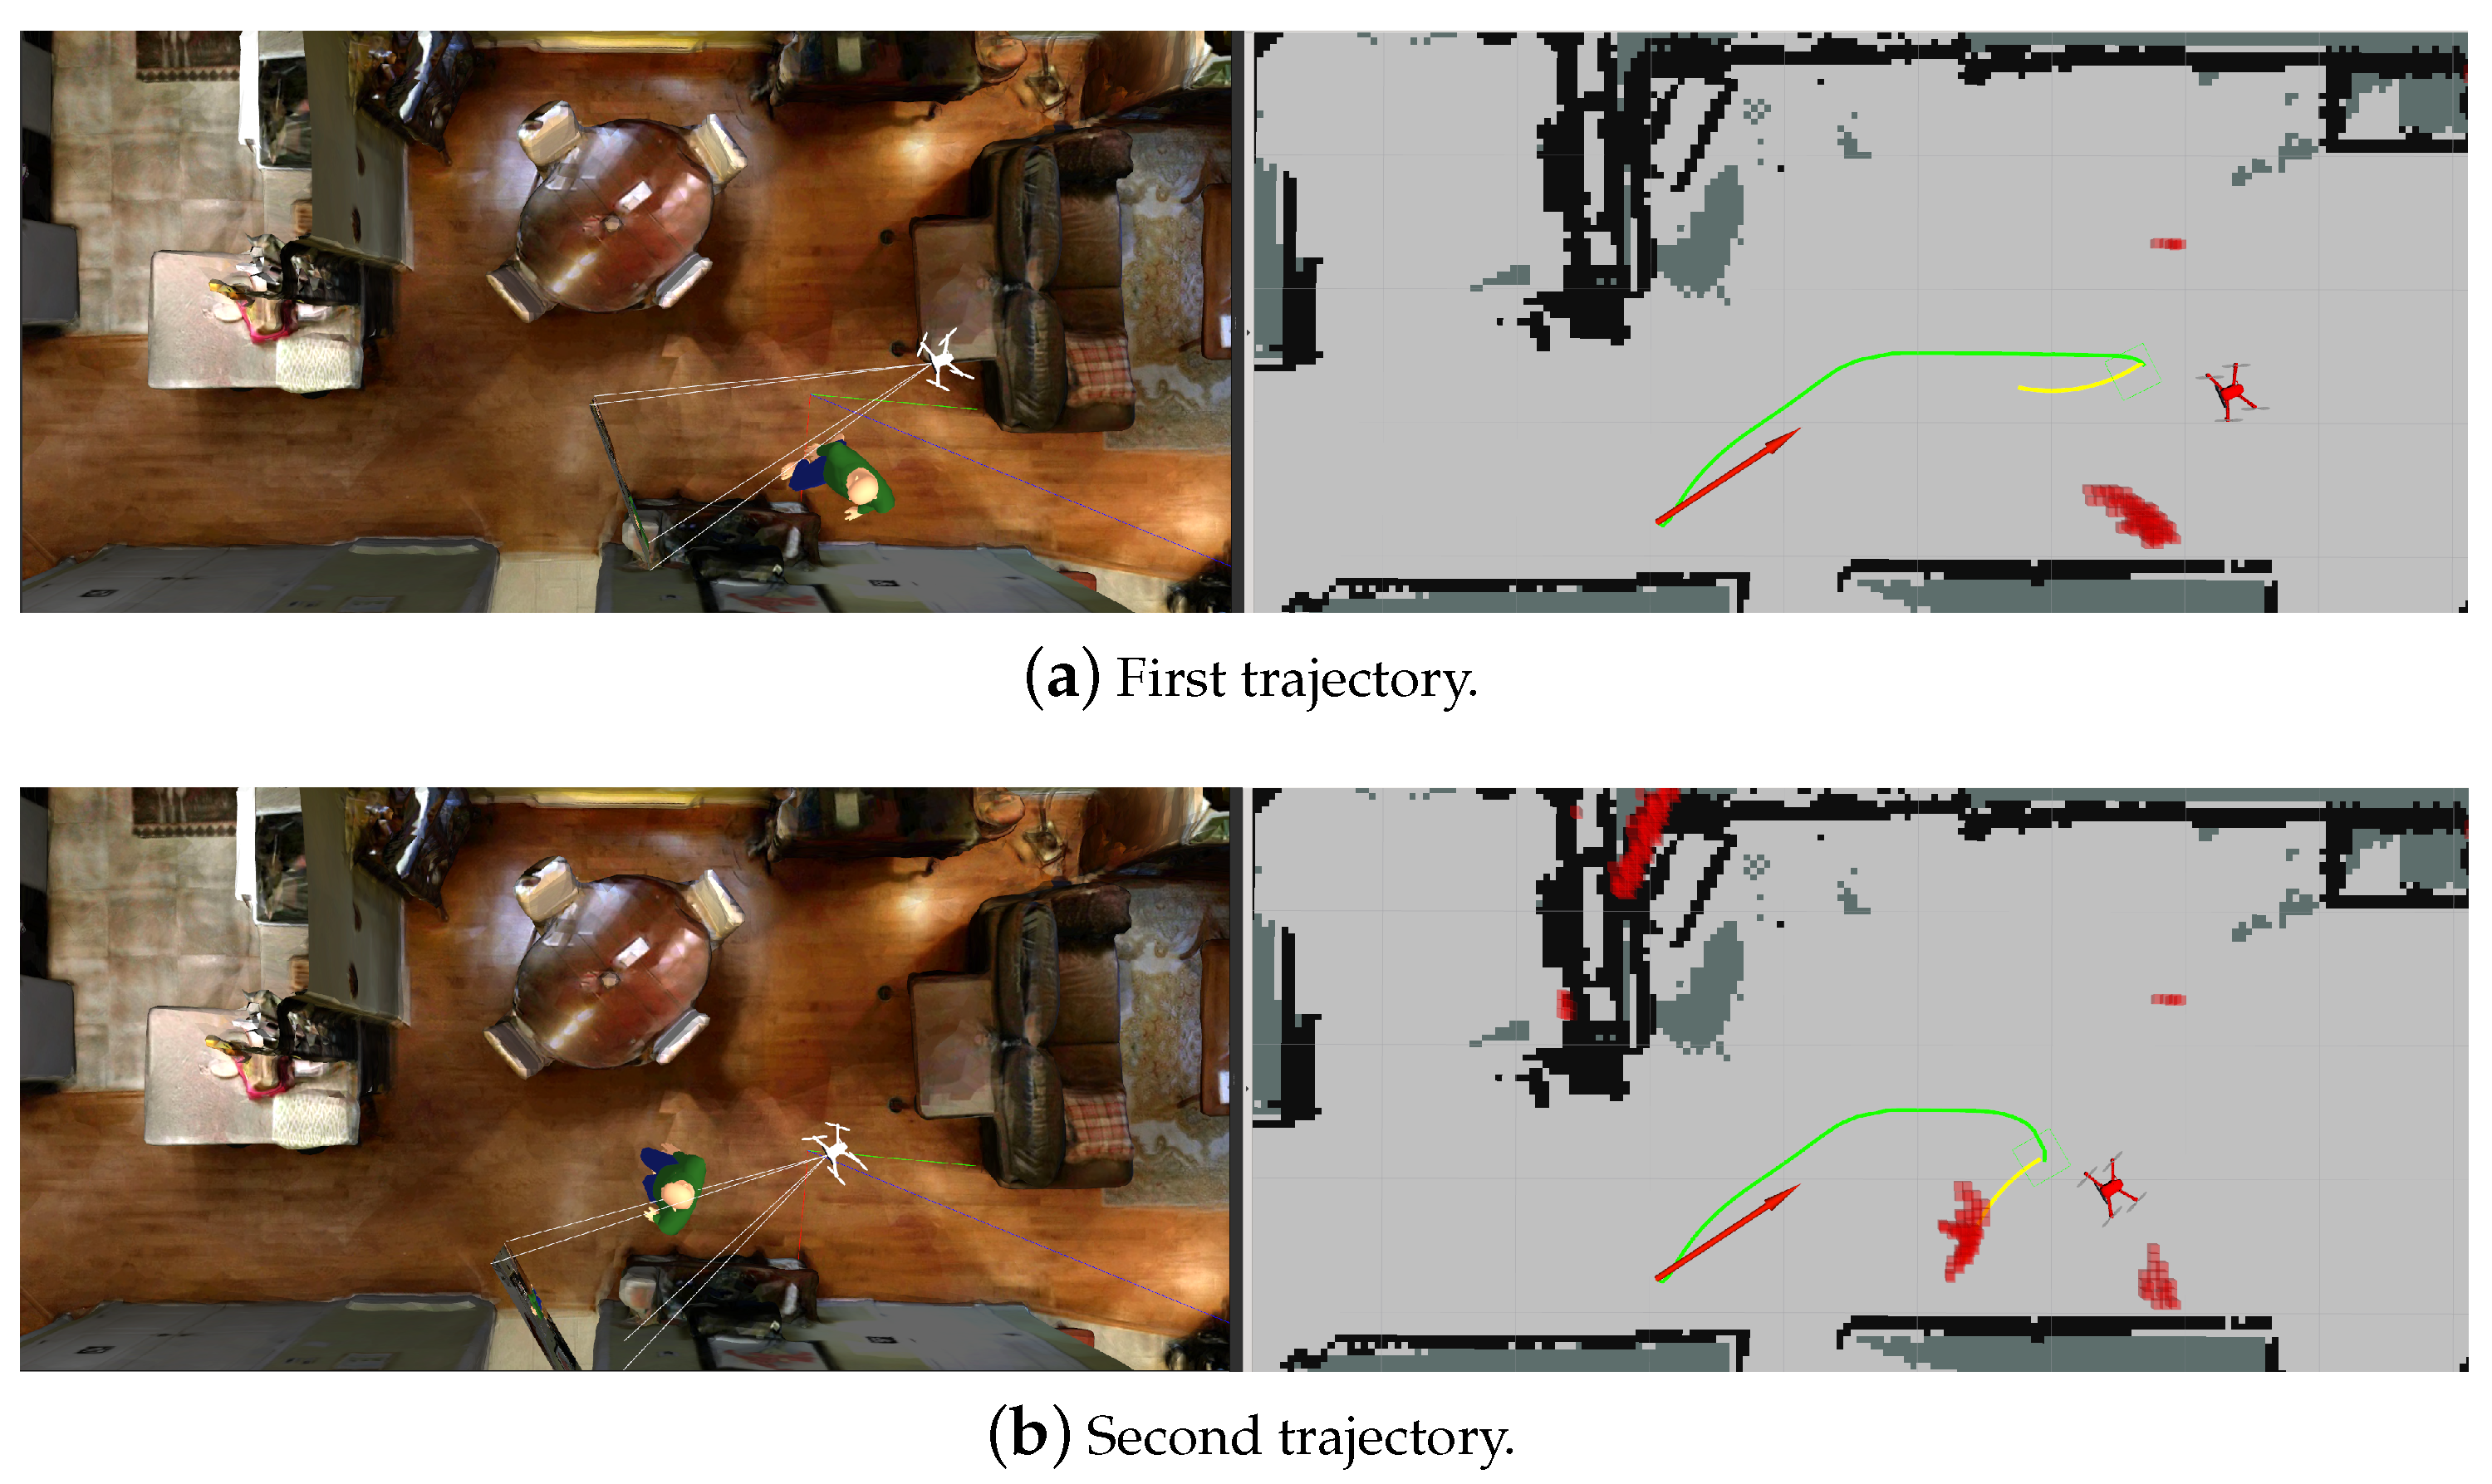
3.2. Path Planning with Obstacle Avoidance

For indoor path planning and obstacle avoidance for UAVs, we first constructed 2D occupancy grid maps and 3D point cloud maps of the indoor environment using RTAB-Map before the flight. During the flight, the UAV localized itself in the absence of GPS signals indoors by performing visual odometry based on the current visual input and simultaneously matching this with the 3D point cloud map. This process involved loop closure detection, which helped to eliminate the errors accumulated in the visual odometry over time, as shown on the left of Figure 3.
For path planning and obstacle avoidance for UAVs, we used ROS Navigation Stack as a framework for the overall navigation system. The global path planner derives an optimal path from the current position to the specified destination, by taking into account the known obstacles shown in the 2D occupancy grid map. This helps avoid dead ends that might be local optimal solutions. In addition, the local path planner, with the use of a depth camera, enables the UAV to avoid unknown dynamic and static obstacles that are not marked on the 2D occupancy grid map while flying along the path previously obtained from the global path planner.
Navigation stack is conceptually straightforward. It takes current pose and external environmental information from odometry and sensors, respectively, and outputs velocity commands to drive the robot. However, it is not possible to apply Navigation Stack to a robot without some prerequisites. Before using Navigation Stack, the robot must be set up on the ROS platform, with a correctly configured tf transform tree, and to publish sensor data using the appropriate ROS message types. Moreover, Navigation Stack requires that the configuration is tailored to the shape and dynamics of the robot to fully leverage its capabilities.
In global_planner, we utilized the algorithm based on navfn (navigation function) developed in [37]. navfn provides a fast interpolation navigation function that can be used to plan global paths for a robot. The grid-based global path planner assumes a robot operating on a 2D occupancy grid map and uses the Dijkstra algorithm [38] to find the lowest-cost global path from the starting point to the destination within the grid. On the other hand, for local_planner, we employed the algorithm based on dwa_local_planner, developed in [23]. It provides an implementation of the dynamic window approach (DWA) technique for local path planning in robot navigation. Given a 2D cost map and a global path to follow, the local planner generates velocity and angular velocity commands and sends them to the robot. The DWA algorithm takes the robot’s dynamics and the surrounding environment into account, to dynamically adjust the robot’s velocity and avoid obstacles when following the global path.

4. Warehouse Inventory Inspection

The system architecture of the proposed inventory management technique is illustrated in Figure 4. First, the UAV acquires images from the environment at discrete sampling points, with various camera positions and orientations. We collected images of both virtual and real-scene environments as the inputs for training and testing. The virtual environment was built with shelves and aisles for UAV navigation, where all sampling angles were captured by a simulated drone. The camera was mounted on the drone, which flew at a fixed height (4.5 m) and recorded images at a downward angle of 35°. In the real environment, images were taken from fixed positions within a area, using a camera mounted on a mobile platform, with no downward perspective. The testing process was similar to the training process, with the distinction that all parameters were fixed, and each step’s images were saved.

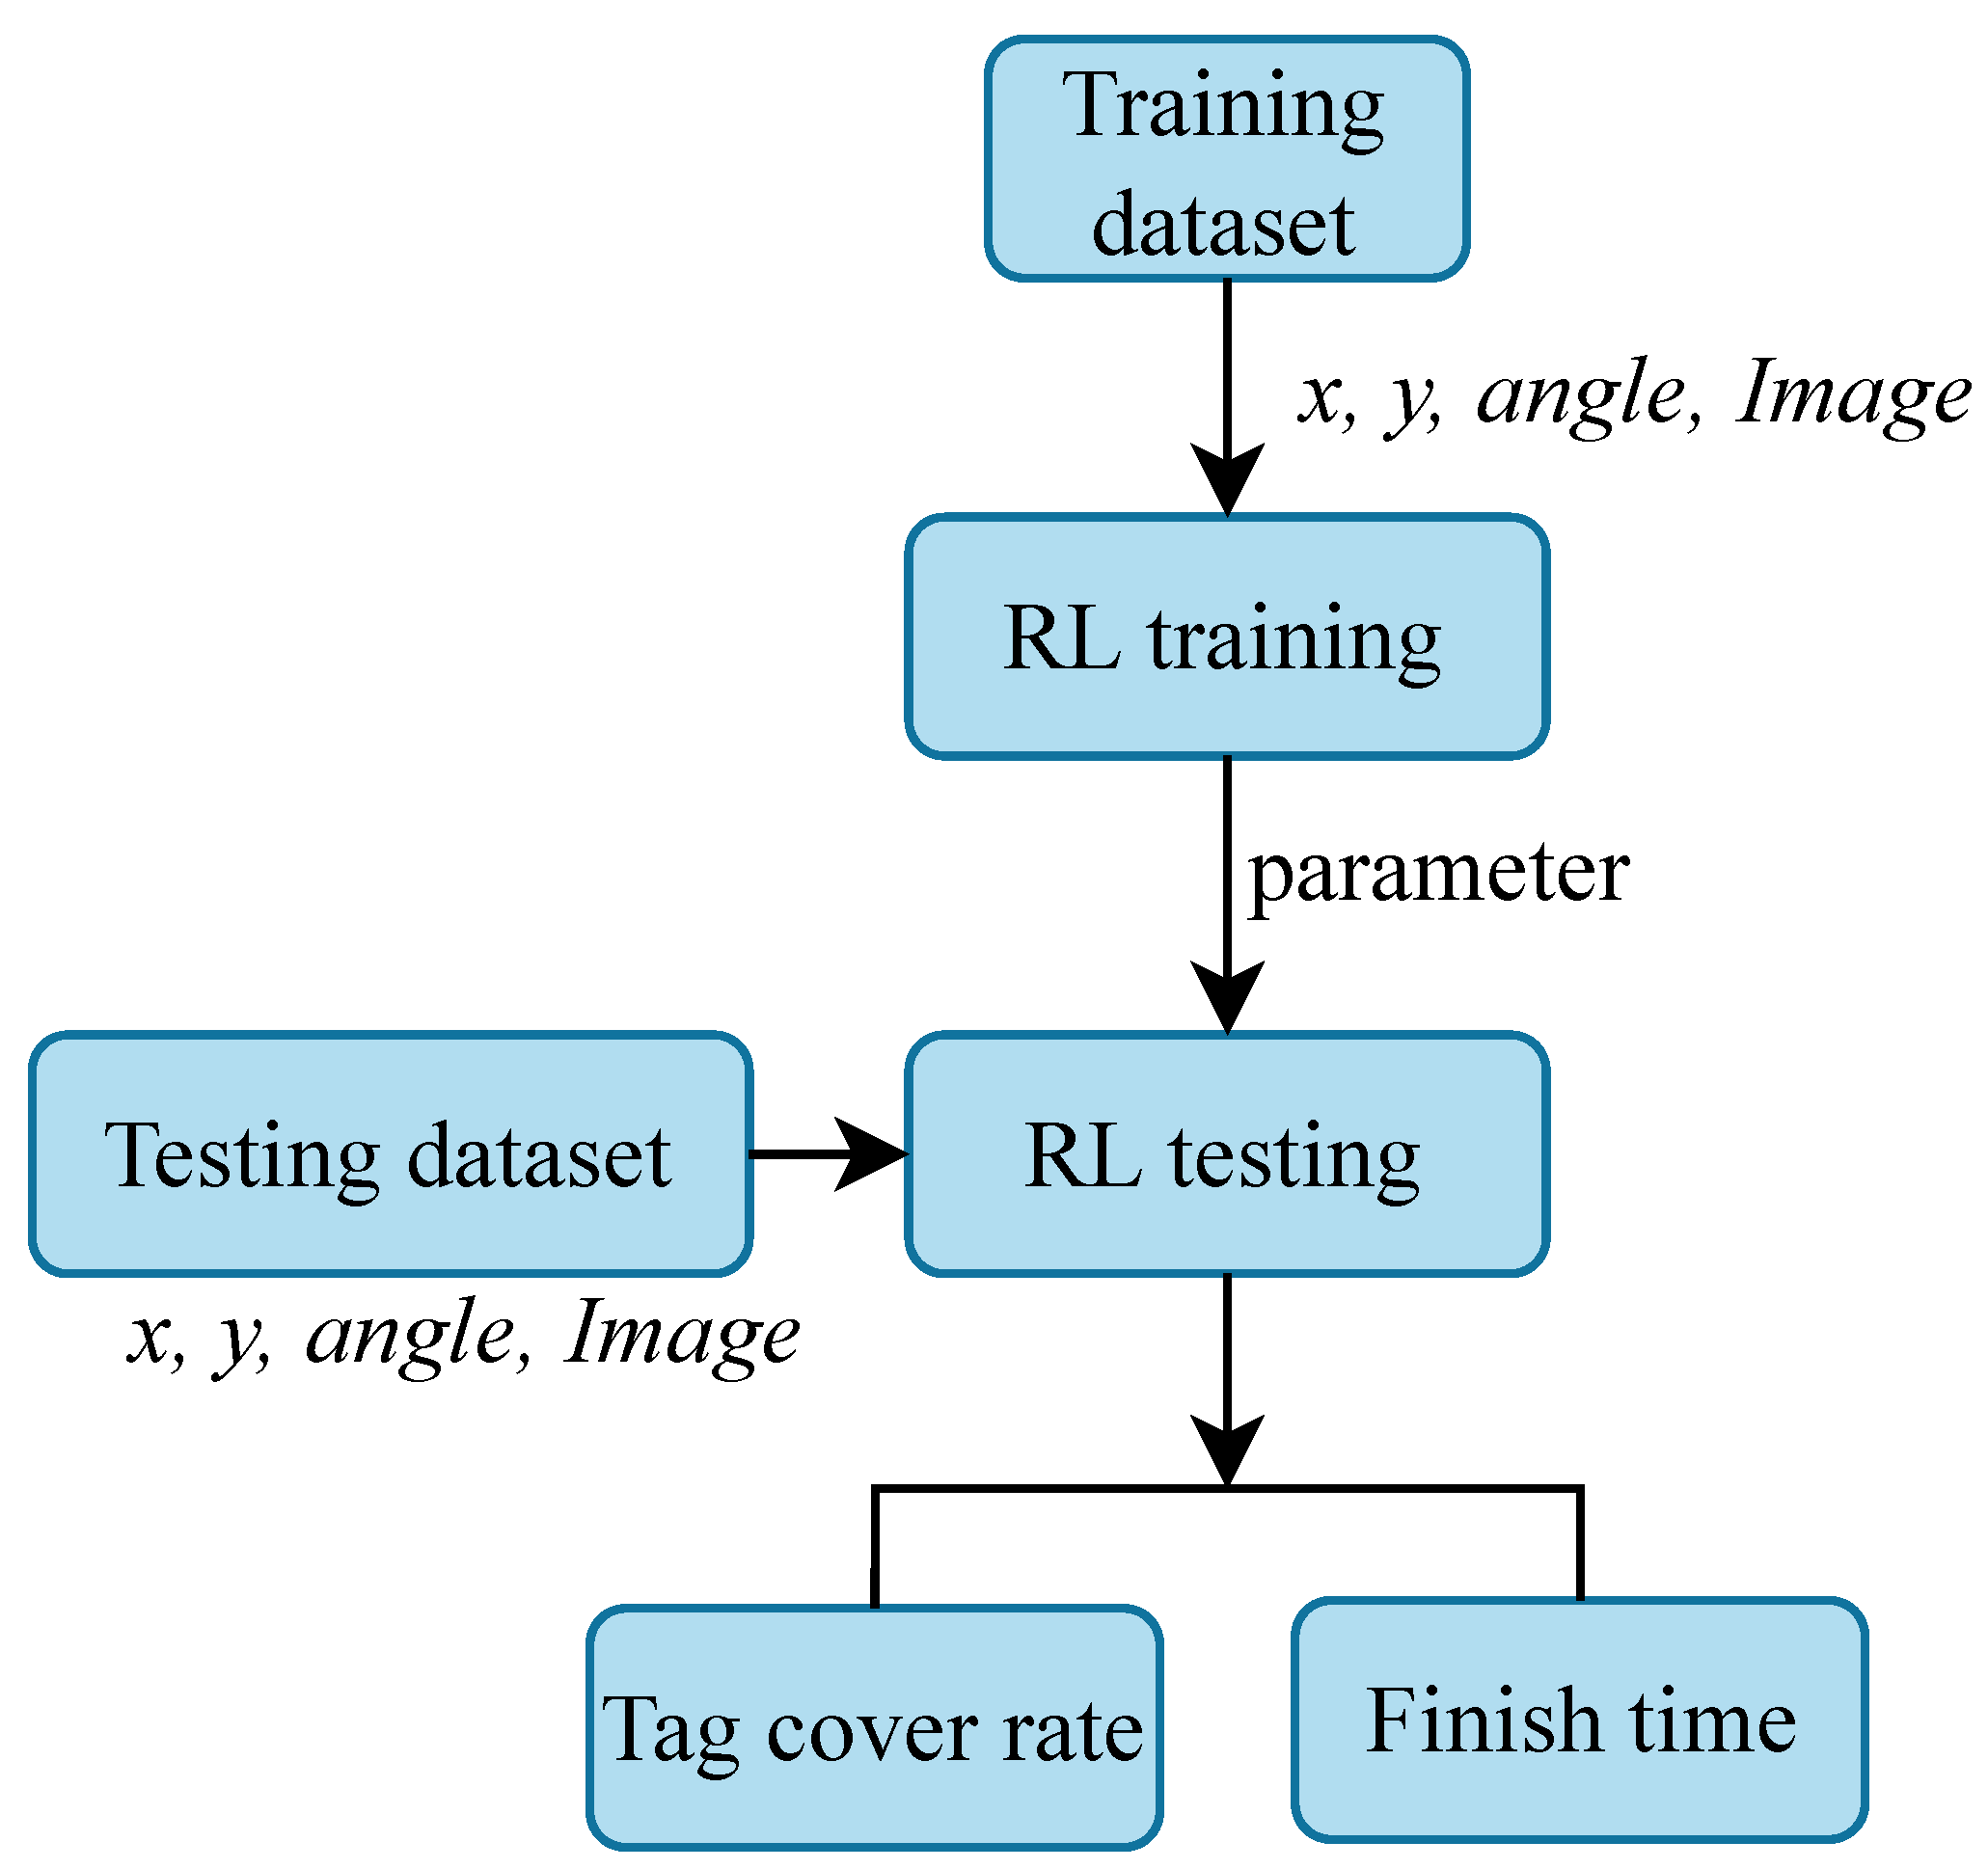
4.1. Proposed Reinforcement Learning Framework

Reinforcement learning is a learning method based on interacting with the environment to receive feedback. One advantage of this type of machine learning is that the input data do not need to be labeled, but it typically requires a longer training time. The used algorithms can generally be divided into two types: on-policy, and off-policy. In on-policy methods, the actor interacts with the environment and performs learning and updates using the same policy throughout the process. Examples include A3C [39] and DQN [40]. Off-policy methods have separate policies for interacting with the environment and learning. PPO [5] is an example of an off-policy method. In this work, we used both frameworsk to construct our own environmental conditions, action generation, and scoring methods for training and testing. The environmental conditions were designed for feature extraction from images, and the actions were generated based on the current situation, involving movement or changes in camera viewpoints.
AC (actor–critic) is an on-policy method, and its basic framework is shown in Figure 5a. The agent observes the current environment and obtains a set of current information (observation). Then, the agent generates an action to modify the environment and produce the next set of states (next state). At the same time, the environment provides feedback (reward) to the agent based on the actions given by the agent for the next set of states. This feedback is then returned to the agent as the basis for adjusting internal values. The internal structure of the actor is shown in Figure 5b. After the current state input, it is divided into two parts for processing. First, the current state is processed through the policy network, to output a probability distribution for action selection. The current state is then processed through the value network to output an evaluation value (critic). Here, the evaluation value represents the expected cumulative reward in this state. It takes the action provided by the agent as input and outputs the next state. The feedback (reward) for choosing this action depends on the current state and whether the data collection for this round has completed after internal processing.
Figure 6 illustrates the framework of PPO (proximal policy optimization). It is divided into two parts: the actor (top) and critic (bottom). In the actor, there are two policies with the same structure but used for different purposes. One is responsible for interacting with the environment, and the other is responsible for learning and updating. They are separated because one parameter is trained based on the data collected by another parameter. This allows the reuse of the collected data to update the parameter multiple times, thereby improving the training efficiency. PPO does not calculate the KL divergence in its update but instead restricts its range. In linking action selection with the learning strategy, PPO uses importance sampling to transform between the two distributions. This method enables the data collected after executing a set of action selections to be used for multiple training sessions. In the internal structure of the critic, the loss function is the difference between the true and estimated values. The true value is obtained with the next state and feedback as input, while the estimated value is obtained with the current state as input.
Figure 7 depicts a system flowchart of our reinforcement learning training framework. During the training stage, a set of random coordinates, angles, and images are used as input of the initial state. If the amount of data is sufficient, learning and parameter updating will be carried out; otherwise, the data collection process continues. The images are first standardized in size, followed by feature extraction using ResNet34 [41]. Using the features to learn the policy and critic, a predicted evaluation value and the probability distribution of actions are obtained, respectively. We check the action range and output the next state and reward value according to the action selection If the task is complete, network training is performed based on the structure of the different methods; otherwise, more data are collected continuously. Finally, after completing all rounds, the training results are observed according to the rewards accumulated in different rounds.
Figure 8 illustrates a flowchart of our reinforcement learning architecture. After training is completed, the trained parameters are stored and imported, using test data as input to test the same structure. Since the input of reinforcement learning does not have label characteristics, there is no standard basis. However, according to our objective, the evaluation method was set here as the detection rate of the quantity of cargo and the time (number of steps) used.

4.2. Action Selection

As shown in Figure 9, an action requires a certain level of continuity, so the choice of the next move contains ‘up’, ‘down’, ‘left’, ‘right’, ‘upper-right’, ‘upper-left’, ’down-right’, and ‘down-left’ options, with 1 m displacement from the current position. Note that the UAV normally flies at a constant height, and these actions are performed locally for barcode inspection. For the actions for the change in camera orientation, we set the range in the horizontal direction from −40° to 40°, with an interval of 10°. Moreover, to imitate how humans conduct the inspection task, we included several additional mechanisms in the action selection framework. First, the default action was set as move, until no new identifiable AprilTag appeared in the images. The action was then adjusted to the change in camera orientation. If no AprilTags were found in the newly acquired images, the actions changed back to move.
In Table 1, we tabulate the relationships between the action direction and action number. In terms of handling boundary conditions for action selection, a greater degree of exploration is usually preferred. Thus, to increase the randomness of action selection, more complex settings were implemented. As illustrated in Table 2, we assumed the field range was n × n . If the UAV’s current position is on the boundary in the x-direction (say, x = n ) and the action of increasing x is selected, we first check if it is also located on the boundary in the y-direction. If not, an action is randomly selected from 1, 2, 3, 5, and 7. However, if the position is on the boundary in the y-direction (say y = n ), then only actions 2, 3, or 7 can be selected. Nevertheless, the orientation changes are simpler compared to the moving action. All selections are legitimate apart from the current angle.

4.3. Reward Function
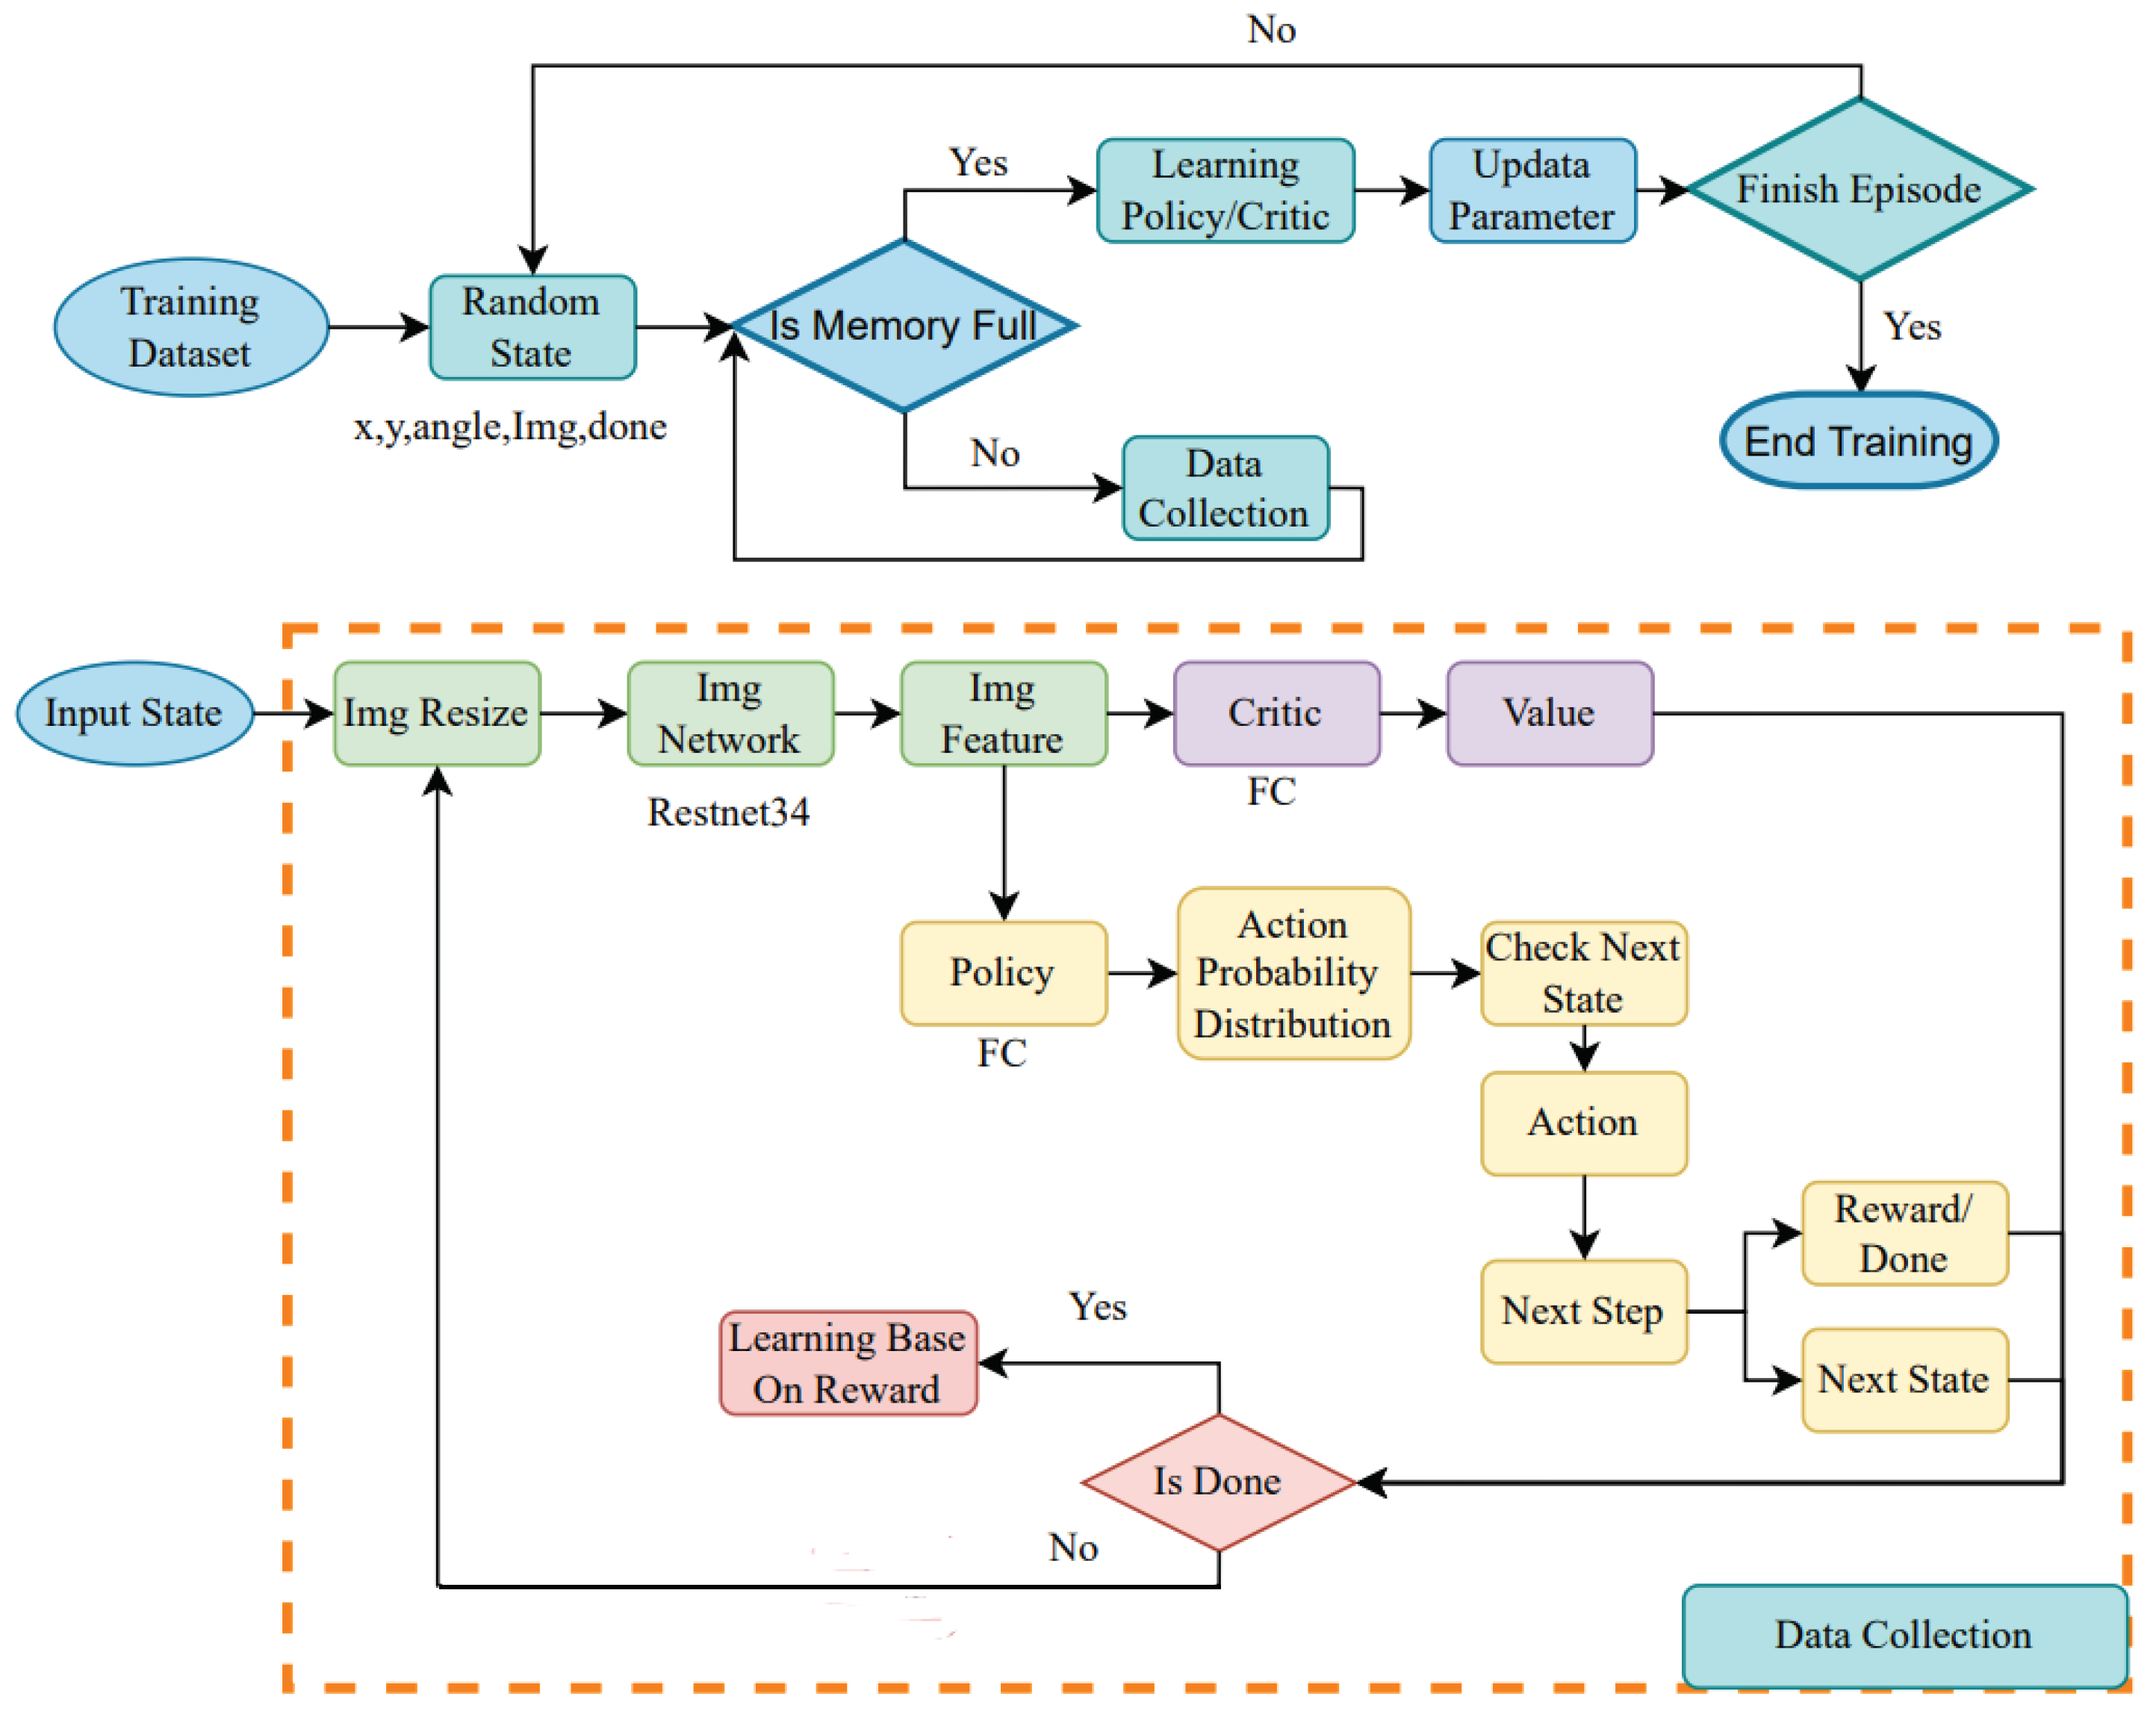
For our reinforcement learning framework, we designed various scoring methods. Depending on our objectives and the impact on evaluating the situation of action selection before and after, we assigned different weight distributions for each calculation. The number for tag detection refers to the number of new AprilTags recognized by the AprilTag detector in a single frame. If a tag appeared and was detected in the previous image, it is not counted again in the current frame. That is, a tag can only be scored once for the reward. Since the tag detection rate is one of scoring criteria, it is desirable to see as many recognizable AprilTags as possible in each frame. Thus, it carries the majority of the weight.
In the scoring criteria, completing the search was one of our goals. Therefore, extra points were awarded if the search for all tags in the scene was completed. In addition, even if the predetermined data collection amount was not reached after completing the search, data collection was forcibly exited. Afterward, all action selection and interactions with the environment stopped, and learning started. The environment was also reset, initiating a new round of data collection. For the initialization and reset, an empty array was set up to remember the labels seen before. This was cleared every time it was reset. Additionally, a random set of coordinates and angles was generated, representing the initial position. The content of the next state included new coordinates, angles, images, a flag indicating completion status, selected actions, feedback scores after selecting actions, and a flag indicating the selected rotation angle.
For the entire framework, in addition to aiming to recognizing tags, one of our objectives was to perform the detection as quickly as possible. Thus, in the scoring method, both the number of movements and rotations were taken into account as costs. We expected to find new tags in each step. After each action, it was checked if new tags had appeared. If there were new tags detected after an action, the action selection counter was reset to zero; otherwise, it was incremented by 1. At this point, the score was deducted based on the counter’s value using
T o t a l _ D e d u c t i o n = k = 1 n k s t e p
where n is the value of the action selection counter, and s t e p is a predefined total number of steps that can be taken.
In order to identify areas of interest before the detector recognizes the targets, we proposed a directional guidance mechanism. It combines YOLOv5 with the tag detection results, followed by locating the centers using K-means clustering to guide the next action selection. First, we obtained all potential tag locations using a pretrained YOLOv5 model. This was compared with the detection derived from AprilTag detector. The overlap was removed, since it was confirmed to be a tag, and the remaining results were regions of interest for exploration. Prior to K-means clustering, an outlier removal process was carried out to derive the representative cluster center. A score was calculated based on the cluster’s center distance to the left-right of the frame. This was then used to direct the UAV’s change in heading to the left or right for the next action. This also prevented getting stuck in a certain place, since it always provided a direction where tags were most concentrated.

4.4. Network

In the first half of the network, images are used as input and processed through the Resnet34 network for feature extraction. The output features are then used as input for the subsequent policy network. This consists of fully connected layers. The basic network configuration is as described previously, but there are slight modifications depending on the method used.

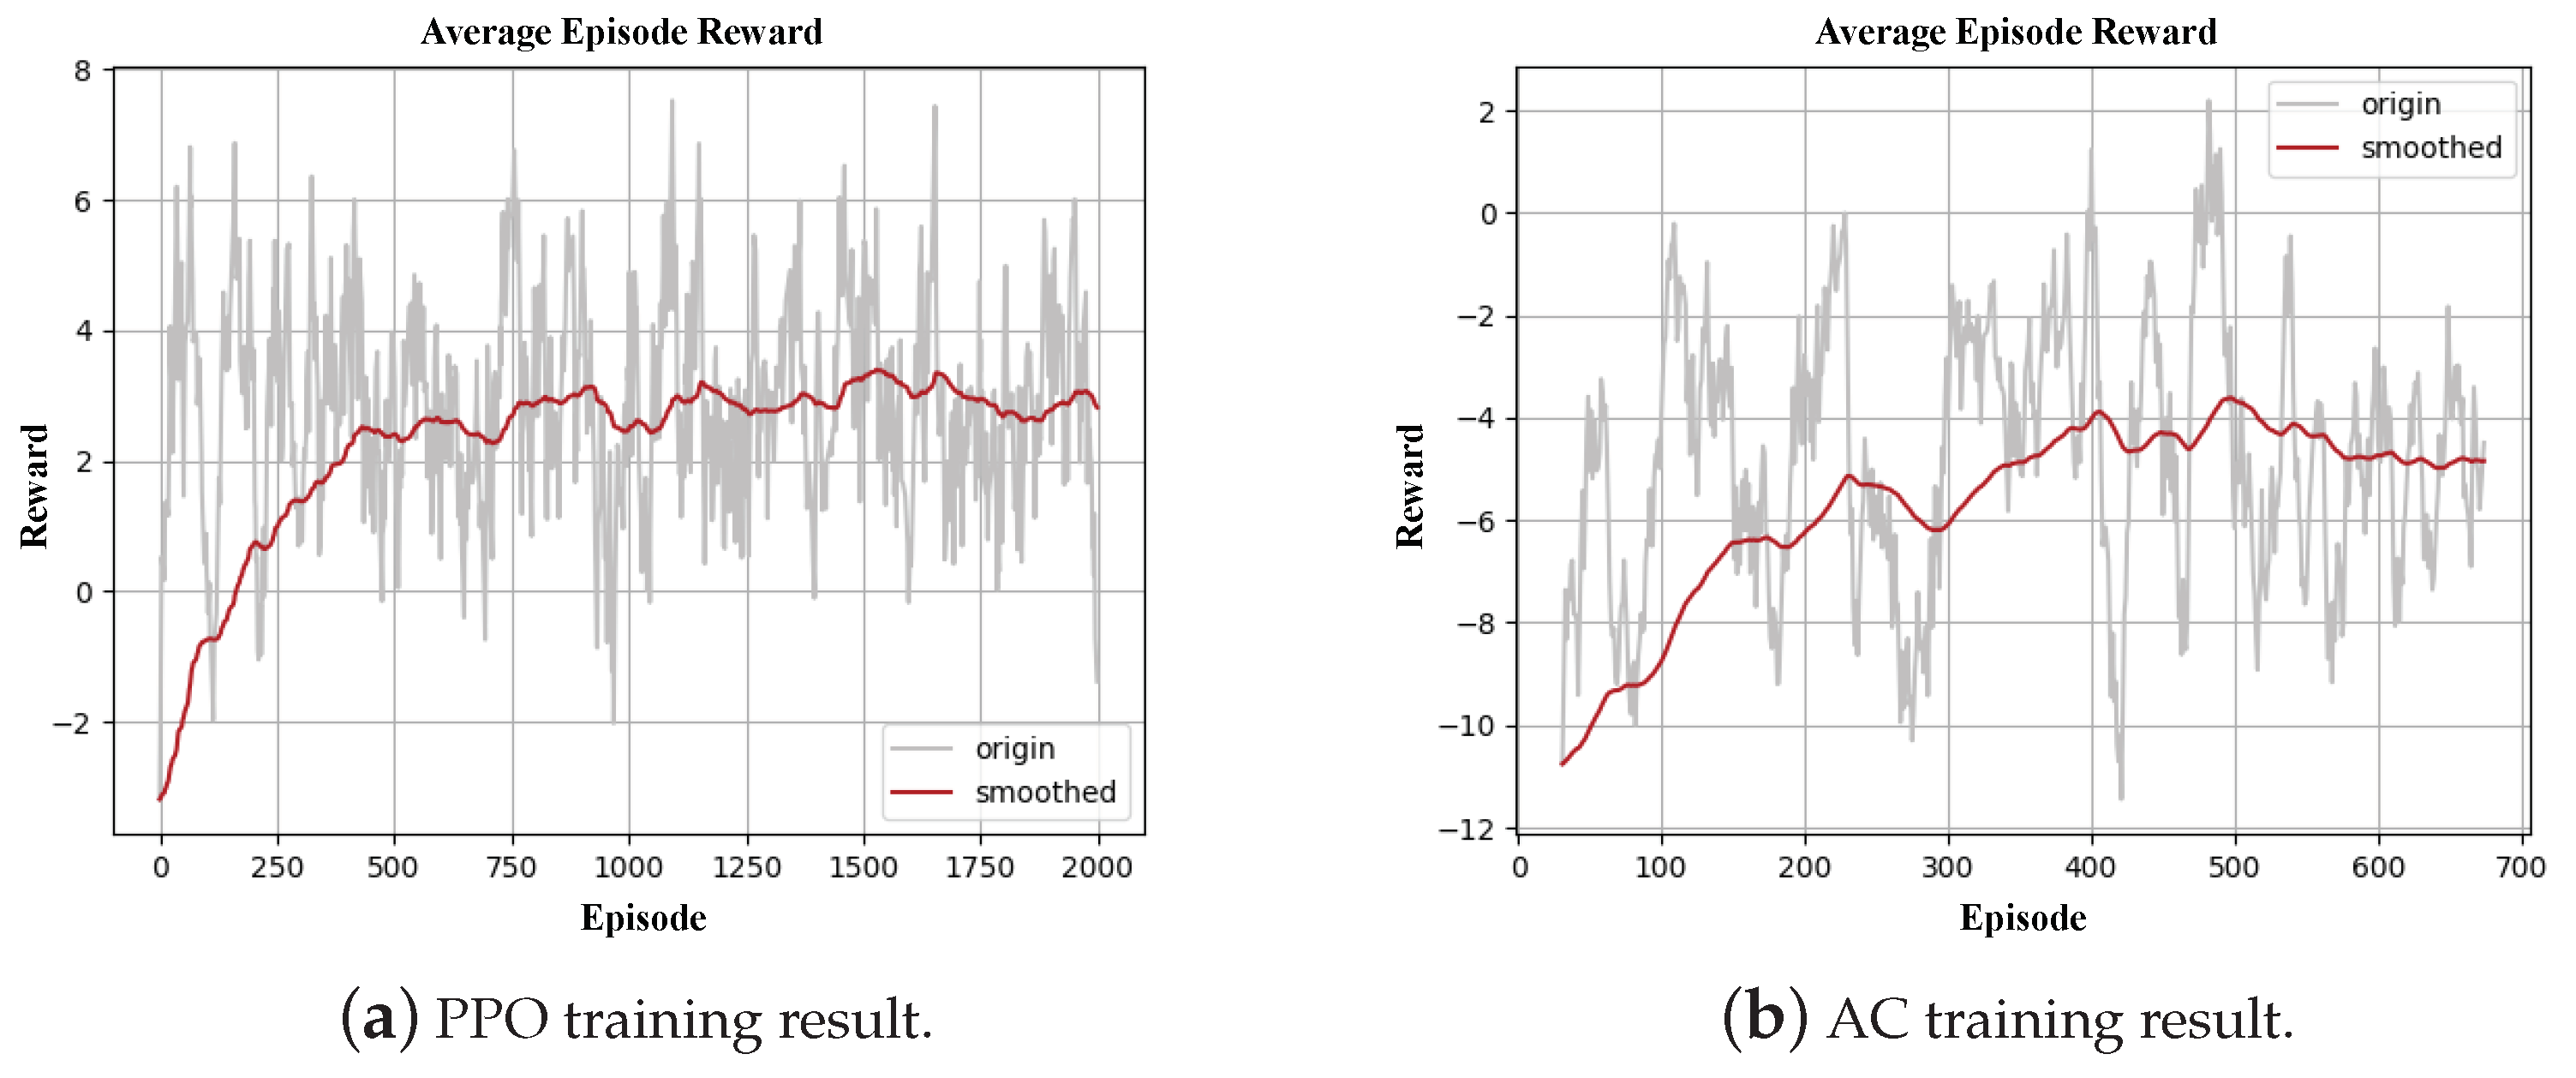
4.4.1. PPO (Proximal Policy Optimization)

For PPO, there are two policy networks, both with the same architecture but different functions [42,43]. The features obtained from Resnet34 are taken as input. It outputs a standard deviation and a mean value, forming the probability distribution of actions. The next action is generated from the distribution and then undergoes a final check in the action selection. After a new action is obtained, it is fed back as a input to update the probability distribution.

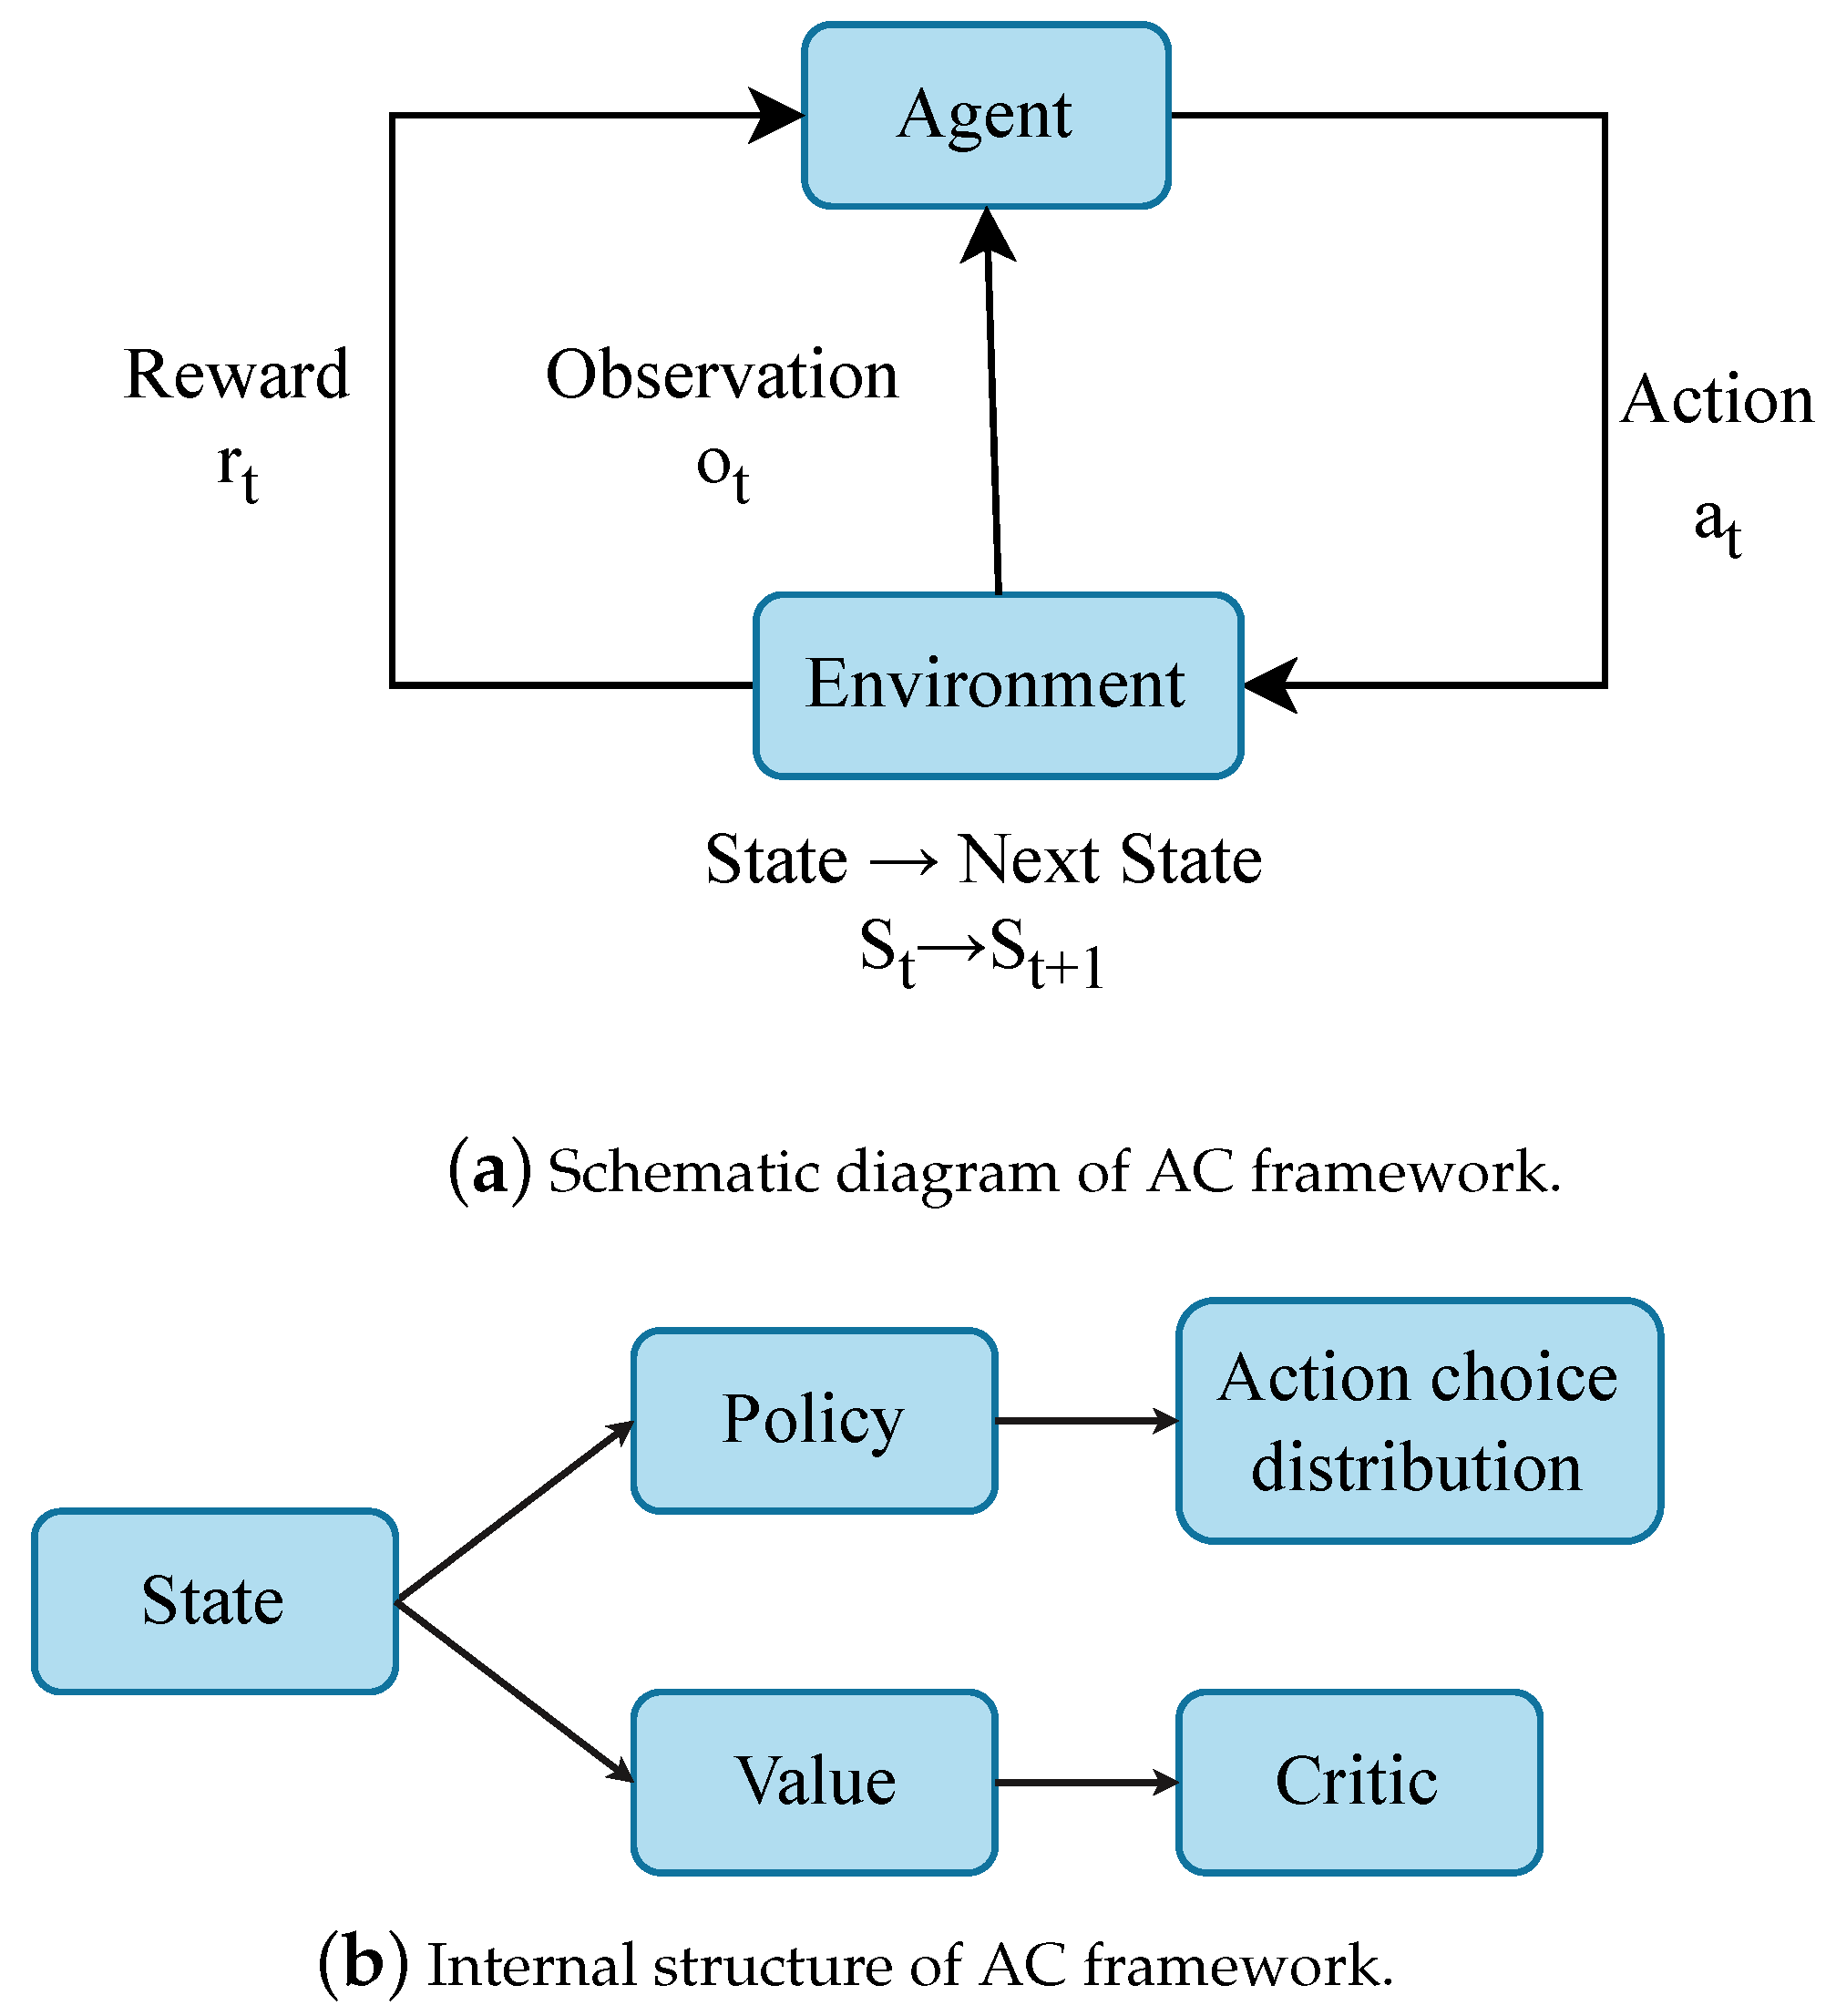
4.4.2. AC (Actor–Critic)

The features obtained by the previous Resnet34 network are used as input, and the output features are also used as input for the policy network. However, unlike the PPO method, the output here is an action probability curve. The next action is randomly generated from this distribution. Finally, the action selection is checked and the action curve is updated. The critic structure for both methods is the same. This part is relatively straightforward, taking the features obtained from the current state as input. The features are then fed into a critic network composed of fully connected layers. The output of the network provides an estimated value. We compare the estimate with the actual value obtained using the features from the next state in the same critic network to calculate the loss.

4.5. Dataset

Common methods for object detection data collection include sampling using planar and spherical points. As shown Figure 10, let p represent the sampling point, r is the radius, θ is the azimuth angle, and ϕ is the elevation angle. The point p can be obtained from the representative variables. In this work, we considered the application for a warehouse environment. Items in a warehouse are typically placed on shelves, so a planar representation was chosen for data collection. We also considered occlusion caused by irregularly arranged goods, and the perspective in rotation was included. The UE4 (Unreal Engine 4) with the Airsim plugin to simulate drones was adopted to create the environment for data collection. The drone’s physics engine was turned off during image capture to ensure the stability and generality of the training results.
The dataset was generated using original AprilTag36h11 images, divided into virtual and real scenes. In the virtual scenes, sampling of consecutive images was conducted using a spherical viewpoint setup in UE4. We included non-box objects in the scene, and the AprilTags came in different sizes, with a total of 340 images. For the real scenes, video recording was performed using an Intel Realsense D455, segmented into images to create the dataset. The dataset included 16 randomly placed boxes with AprilTags and some areas with square objects made of plastic pieces. There were 100 annotated images in the dataset. For the validation set, images of shelf scenes from the virtual environment were used, with 300 annotated images. The YOLO format was chosen with AprilTags annotated by enclosing them in rectangular bounding boxes.

5. Experiments

The architecture of the proposed navigation system is shown in Figure 11. It contained an UAV equipped with an Intel RealSense D435 depth camera and an UP-Board embedded computer. In addition, there was a WLAN router facilitating information exchange between the various devices, and a host computer that was responsible for running the navigation and obstacle avoidance algorithms. We adopted an ModalAI M500 for our experiments. This is a development quadcopter drone featuring the Qualcomm Snapdragon 821 processor. The flight control system of the M500 is based on the PX4 Autopilot flight control system, supporting autonomous flight, remote control, and mission automation. It also offers advanced flight modes, such as an Altitude Mode for altitude hold, Position Mode for position hold, and Offboard Mode for programmable control.
To conduct navigation experiments, we configured the hardware by mounting an Intel RealSense D435 depth camera and an UP-Squared embedded computer on the M500. This setup enabled the drone to transmit real-time RGB-D images captured by the D435 camera back to the computer via a wireless local area network (WLAN) using UP-Squared. Because of the inabilities of UP-Squared to successfully run certain navigation algorithms, we also opted for a notebook computer equipped with an Intel i5-8250U 1.6 GHz CPU and 8 GB RAM. Moreover, a desktop computer with the hardware configuration of an Intel i7-8700 3.2 GHz CPU, NVIDIA RTX 2070 8GB GPU, and 16 GB RAM was used to perform computationally intensive tasks.
The architecture of our positioning system is illustrated in Figure 12. A mobile platform was used to carry the UAV along with the UWB Tag and the D455 depth camera. This setup allowed for multiple positioning methods, including AprilTag, QVIO, SLAM, and UWB. The hardware configuration of the mobile platform consisted of various components. At the front, there was a VOXL tracking camera placed at a 45-degree downward angle, responsible for QVIO positioning. In addition, a D435 depth camera was mounted on the front for RTAB-Map mapping and positioning. In the rear, there was a D455 camera used for AprilTag detection.

5.1. Indoor Mapping and Positioning

After setting up four anchors, we used the control window to observe the relative positions and coordinates of the anchors. The anchors were placed around the experimental environment, forming a rectangular space within which the tag moved. This setup enabled a global indoor positioning technique similar to GPS, allowing for accurate localization within the designated area. Using the mobile platform with the UWB tag mounted on it, indoor positioning experiments were conducted while keeping the height (Z-axis) at a constant. In these experiments, it was observed that although the UWB positioning exhibited larger variations in the Z-axis, the overall X and Y-axis horizontal positioning trajectories did not exhibit drift or divergence over time. Since UWB positioning does not rely on visual cues, it remains accurate, even in environments lacking distinctive features (e.g., white-walled rooms) or areas with low lighting conditions. Nevertheless, it was important to be cautious of obstacles, as they could impact the accuracy of the UWB positioning, depending on their distance and size relative to the anchors and the UWB tag.
Using the QVIO tracking camera positioned at a 45-degree downward angle on the front of the UAV, an area-based indoor positioning technique was employed. Compared to global positioning techniques, the advantage of the area-based positioning lies in achieving more precise localization in a defined space, often resulting in smoother trajectories. However, if global markers are not available, it is not easy to correct for accumulated positioning errors, which might worsen over time due to small inaccuracies. Visual localization heavily relies on extracting feature points from a rich texture scene, which is critical for overall positioning robustness. To address this issue, we placed numerous objects in the experimental environment around the surroundings, to cover the plain white walls. This enhanced the availability of visual features for QVIO and improved the stability of the visual-based localization.
For the virtual environments, we utilized Gazebo [44] to simulate the UAV, RGB-D camera, and indoor space for mapping. This simulation was essential for validating the algorithms before the implementation in real-world scenarios. The mapping process included the generation of a 3D point cloud for visual feature loop closure detection, a 2D occupancy grid for global path planning and obstacle avoidance, and a 2D map showing the safe flying zone for the UAV, as illustrated in Figure 13. We conducted RTAB-map localization in real environments with four scenarios. These scenarios included loop closure detection, loop closure not detected, loop closure rejected, and odometry lost.
  • Scenario 1: When the drone images detects a loop closure in the previously constructed map, it corrects the accumulated drift error of the visual odometry, achieving global indoor localization.
  • Scenario 2: When the loop closure is undetected, the drone relies solely on visual odometry and extracts visual features for local indoor localization.
  • Scenario 3: When loop closure is rejected, this indicates that loop closure is detected but does not exceed the pre-set threshold for acceptance. This typically occurs when the drone’s position is correct, but there is some slight deviation in the orientation.
  • Scenario 4: When odometry is lost, this means the drone’s visual odometry is unable to maintain continuity with the previous frame, due to significant and rapid image motion in a short period. This often happens if the drone rotates in place, resulting in an instantaneous angular velocity.
Utilizing the upward-facing D455 depth camera mounted on top of the mobile platform, we carried out AprilTag detection on the captured RGB images. After a series of tests, we found that continuously detecting AprilTags in the scene could prevent issues such as incorrect path connections and non-smooth trajectories, as depicted in Figure 14. The red arrows represent the odometry, and the green path illustrates the motion trajectory. Moreover, when multiple AprilTags (two or more) were detected simultaneously within the same image frame, this resulted in a more accurate and stable pose estimation compared to detecting only a single AprilTag. This multi-detection capability enhanced the robustness of the AprilTag-based localization process.
Figure 15 shows the indoor localization trajectories obtained using the RTAB-Map SLAM mapping mode and localization mode. The blue, green, and red paths represent the trajectories obtained when the initial mapping mode, localization mode, and the mapping mode were reactivated during the second localization mode. From the SLAM trajectory comparison graph, we can observe that the latter two trajectories (from the localization mode and the mapping mode, i.e., green and red paths) were very similar, and the advantages of pre-constructed maps for the localization mode were not evident. Therefore, the benefits of loop closure detection for correction become more prominent in spacious environments where the visual odometry might diverge.
Figure 16 illustrates the characteristics of the different localization techniques. The yellow, cyan, red, and blue curves represent ground truth, UWB, QVIO, and AprilTag localization trajectories, respectively. In addition, the magenta path corresponds to the SLAM (simultaneous localization and mapping) mapping mode trajectory, and the green path represents the localization mode trajectory. Despite some noticeable fluctuations in altitude, the UWB trajectory did not diverge significantly due to severe shaking. The performance of QVIO remained in a state of shrinkage and deviated from the true path, mainly because of the lack of ground features. The AprilTag trajectory showed excellent stability and closely followed the ground truth trajectory. The SLAM localization trajectory was very similar to the mapping trajectory.

5.2. Path Planning with Obstacle Avoidance

The feasibility of navigation and obstacle avoidance algorithms was tested in both virtual and real environments. These consisted of the construction of 2D occupancy grid maps with static known and unknown obstacles that were not present during mapping. In addition, we tested the algorithm’s robustness with dynamic unknown obstacles, to validate the performance. For virtual environments, Figure 17 illustrates the integration of Gazebo and RViz. Gazebo showed the simulation environment, while the RViz display window showed various elements, including the global path, local path, dynamic obstacles, static obstacles, unknown obstacles, and known obstacles. The red arrow represents the destination that the drone was heading towards in RViz, the green path is the global path generated by the navfn global planner, and the yellow path is the local path generated by the DWA (dynamic window approach) local planner. The light gray, dark gray, black, and red grids represent the flyable area, unknown area, known obstacles, and obstacles detected by the sensors, respectively. The light blue grid represents the map based on the drone’s radius, and the dark blue grid represents the map with an additional safety margin applied after testing.
For real environments, Figure 18 illustrates the integration of the RTAB-Map (Figure 18a) and RViz (Figure 18b). This setup allowed testing the effectiveness of the global path planner using static known obstacles. The performance of the local path planner was evaluated using a puzzle made of foam blocks as static unknown obstacles. In addition, the local path planner’s real-time responsiveness was tested by having a floor robot carrying the foam blocks as dynamic unknown obstacles.

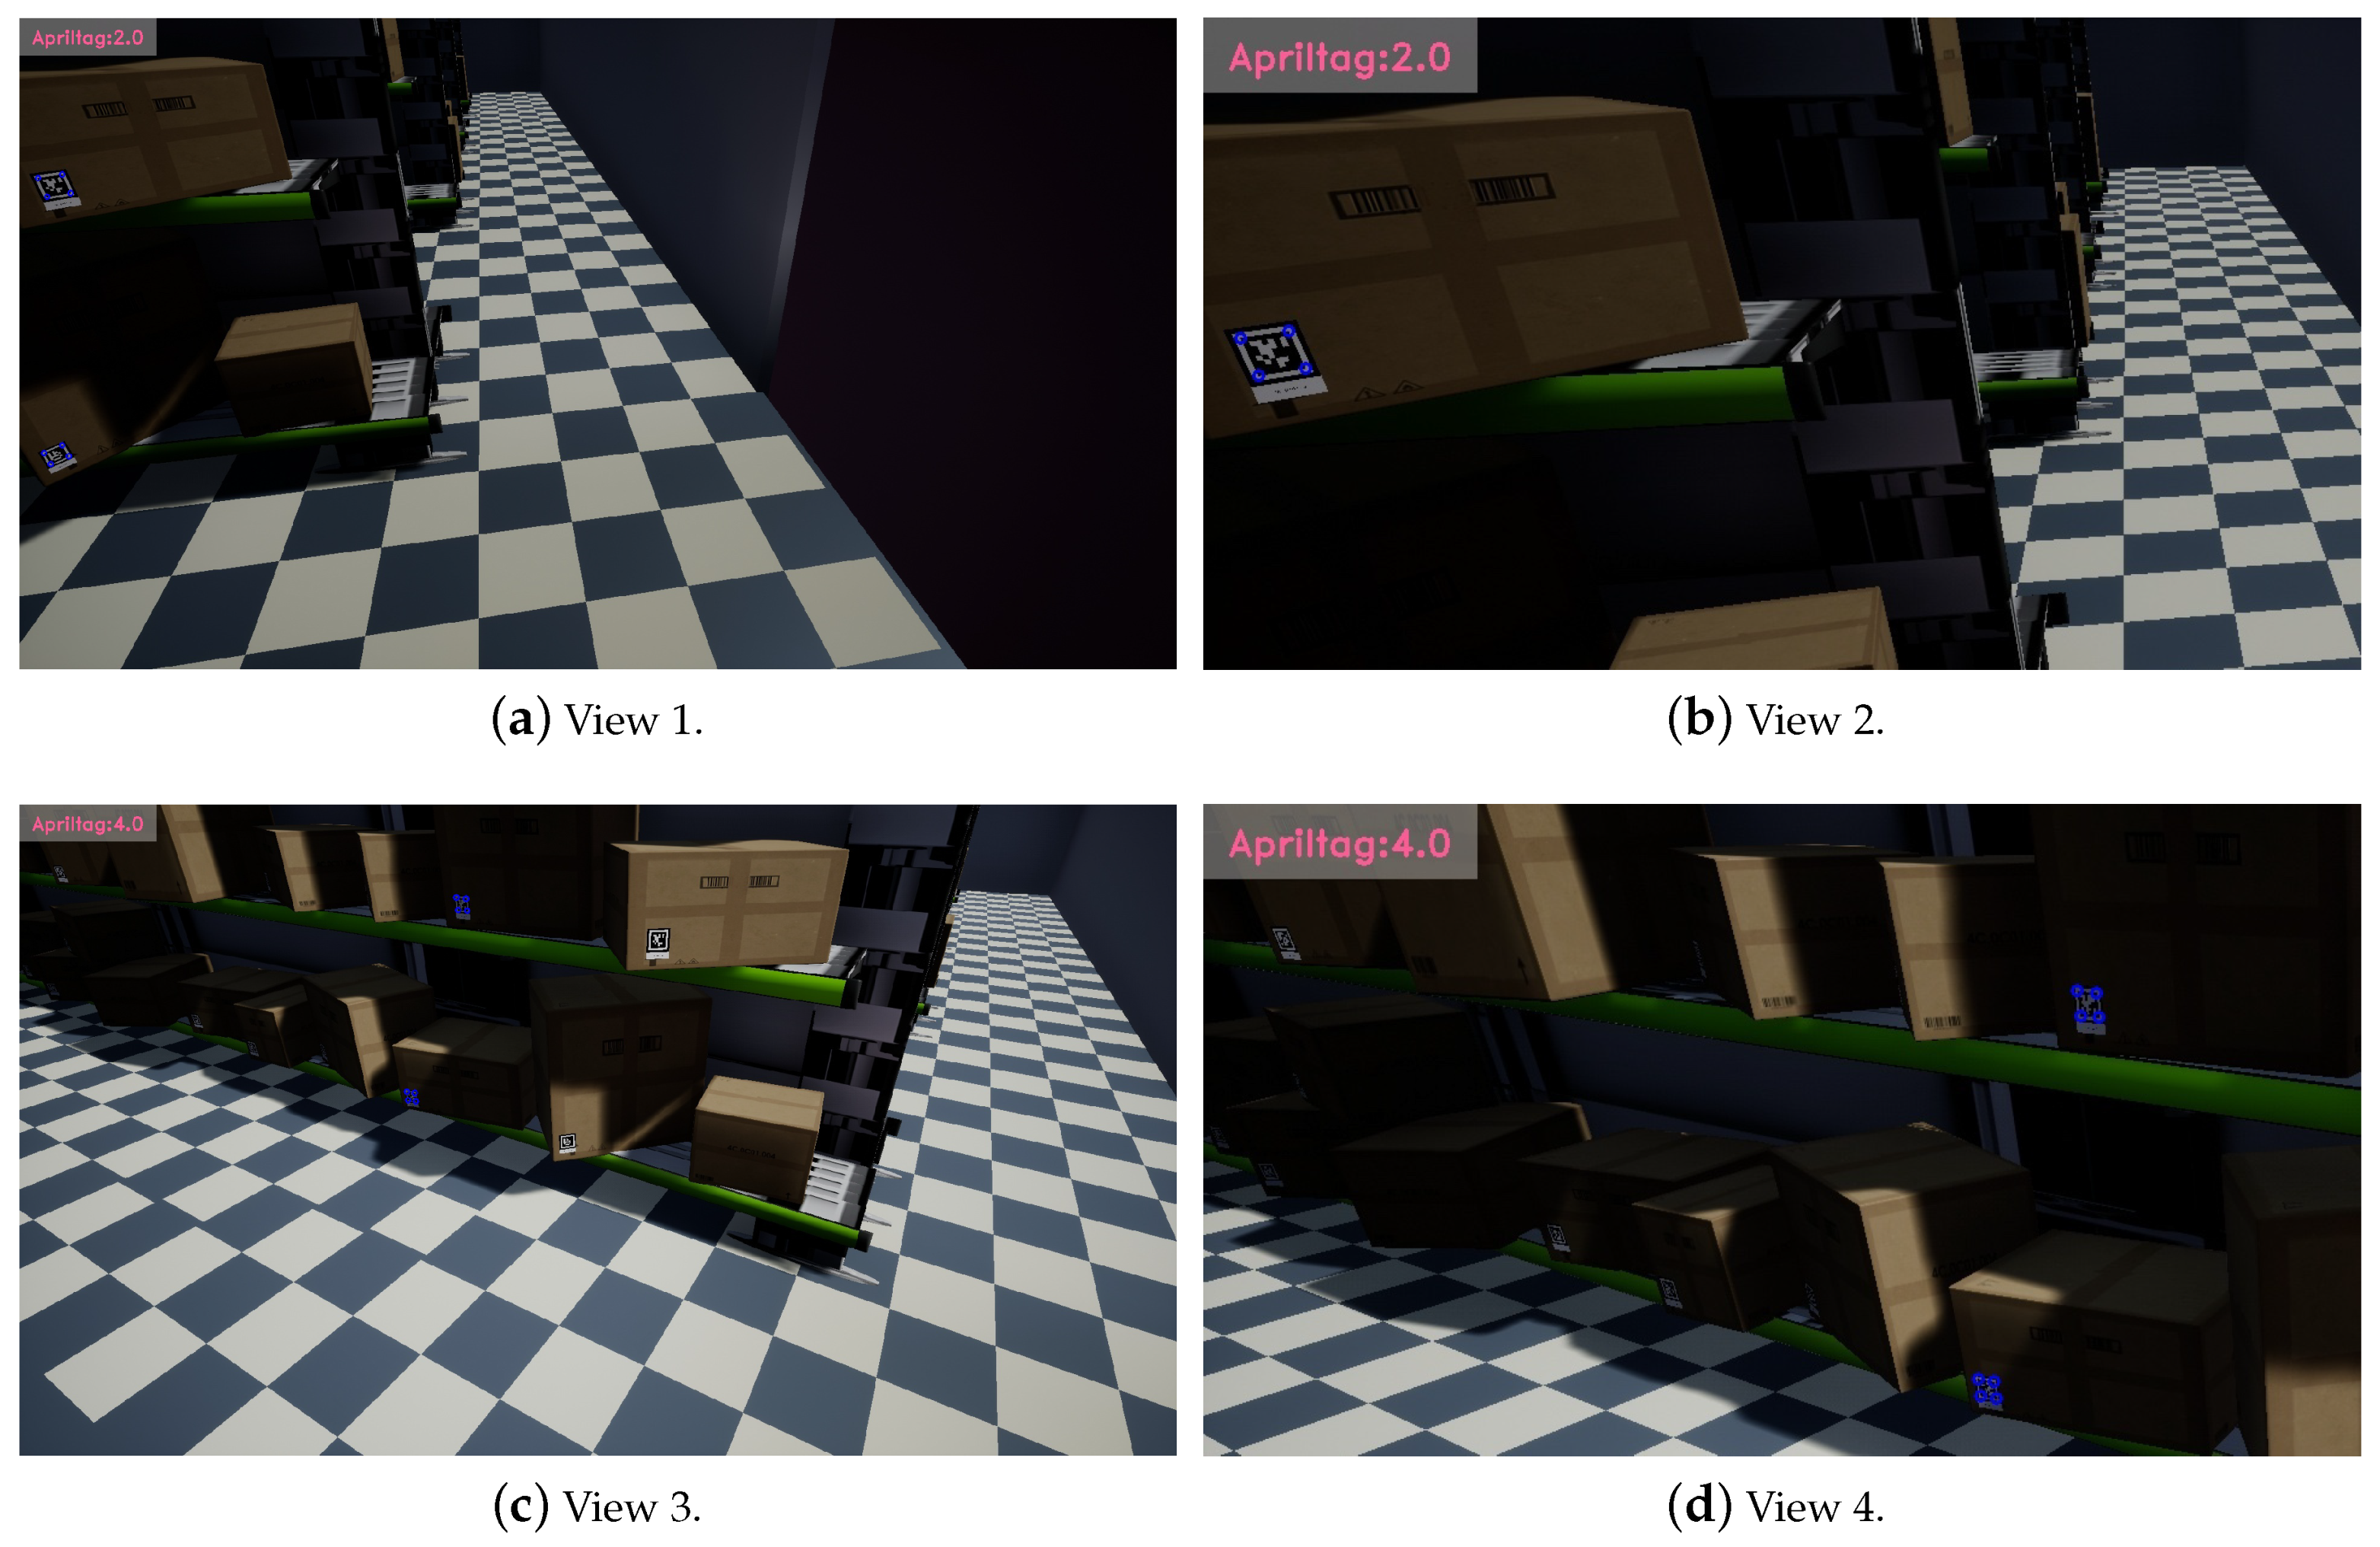
5.3. Inventory Inspection

The proposed inventory inspection techniques were tested in simulations and real-scene environments. In the virtual environment, in UE4, boxes were created with four different sizes, 1 × 1.33 × 1 m, 2 × 1.33 × 1 m, 2 × 1.33 × 1.5 m, and 2 × 1.33 × 1 m. The size of AprilTags was 0.21 × 0.271 m2. As illustrated in Figure 19, the boxes were placed on a shelf, and the drone equipped with a camera flew at a fixed height (4.5 m). The camera’s viewing angle was downward at 35 . We divided the aisle into three sampling point tracks parallel to the shelf. Each track consisted of 35 positions, so there were a total of 105 sampling viewpoints. The boxes on the shelf were placed randomly, including different orientations and occlusions. In this paper, we adopted the PPO and AC methods. Both of them used Resnet34 for image feature extraction and the same dataset for training. Their architectures were written in PyTorch. A summary of the reinforcement learning training parameters is shown in Table 3. PPO ran on Ubuntu 18.04 with a Nvidia GeForce RTX 3070Ti, and AC ran on Ubuntu 20.04 with a Nvidia GeForce RTX 4090.
After multiple rounds of parameter adjustment experiments, we set the maximum number of movements to 50. Both the actor and critic had learning rates of 0.02, and the update frequency for each episode was 20. We set ϵ to 0.2, and the optimizer adopted was Adam, which used a stochastic gradient descent based on adaptive estimation of 1st-order and 2nd-order moments. Figure 20a shows the training results of PPO, where episode represents how many paths were taken, indicating the number of times the environment was reset. In AC training, we set the maximum number of movements to 100. Both the actor and critic had a learning rate of 0.0002, with gamma set to 0.9. The update frequency for each episode was 24, and there was a learning rate decay of 0.7. The optimizer used was Adam. Figure 20b illustrates the training results of AC, where episode represents how many paths were taken, indicating the number of times the environment was reset.
The testing experiments were conducted using trained parameters to estimate the number of steps taken and the detection rate of boxes. Figure 21 shows the testing results using PPO in a virtual environment with a step set to 50. These include steps 1 to 4 and 47 to 50 in the left and right columns, respectively. The blue circles represent the tags newly detected in the frame. Since the previously scanned tags were not marked again, their scores were not included in the new calculation. The text in the upper-left corner shows the cumulative number of tags, with a total of 25 found in this test. Ten simulation tests with 26 boxes were performed in the experiment. The number of detected boxes was either 24 or 25, and the average detection rate was reported as 94.62%. Figure 22 shows the testing results using AC in a virtual scene with step set to 80. These include steps 1 to 4 and 77 to 80 in left and right columns, respectively. The same as for PPO testing, there were 26 boxes to identify in the scene. With 10 simulation tests, the number of detected boxes ranged from 20 to 24, with an average detection rate of 90.38%.
For the real scene experiments, 16 cardboard boxes were placed on a two-tier elevated table. Each box had a unique AprilTag with ID numbers ranging from 0 to 15. Two different box types were used: one was 25 × 26 × 35 cm (Type A), and the other was 18 × 38 × 40 cm (Type B). There were a total of 10 Type A boxes and 6 Type B boxes. The dimensions of the AprilTags were 6.7 × 6.7 cm, and the length of the aisle in the scene was approximately 3.6 m. We utilized a Realsense D455 camera to capture images at a fixed height and adopted a digital compass to record the orientation. Similar to the virtual environment, the images were sampled every 30 cm. The aisle was divided into three parallel tracks, so there were a total of 3 × 12 sampling locations. Together with nine viewpoints for each position, this resulted in 324 images for each experiment.
Figure 23 presents the real-world testing results of PPO training (steps 1–4 and 10–13 in the left and right columns, respectively). In this scene, there were a total of 16 boxes to search for, and the maximum number of steps for each movement was set to 50. Table 4 (left) shows statistics from 10 real-world scenario tests, recording the final number of boxes found, detection rates, and the total number of steps (time) used. It can be seen from the table that in nearly every instance, all the boxes in the scene were found in approximately 20 steps or less. The average number of boxes detected was 15.9, with a detection rate of 99.38%. There were a total of 16 boxes to search for in the AC training, and the maximum number of steps for each movement was also set to 50. Table 4 (right) provides statistics from 10 real-world tests, recording the number of boxes found, detection rates, and the total number of steps (time) used. It can be observed from the table that in nearly every instance, all boxes in the scene were found. The average number of items detected was 15.7, with a detection rate of 98.13%. However, in terms of the number of steps required, AC needed twice as many steps to complete the task compared to PPO. The average number of steps required was 36.4 steps.

6. Conclusions and Future Work

This research first integrated multiple indoor localization techniques, including visual-inertial odometry, SLAM, UWB, and AprilTag. It compared their stability and accuracy. We also utilized ROS Navigation Stack, combining PX4 Autopilot, MAVROS, and QGroundControl for drone navigation, and validating both global path planning and local path planning algorithms. Moreover, RTAB-Map was used for map construction to achieve indoor localization with visual odometry. We replaced expensive radar with cost-effective depth cameras, and conducted verification in virtual and real environments, considering various application scenarios, such as known obstacles, unknown obstacles, and dynamic unknown obstacles. Extensive testing and parameter tuning were conducted to validate the algorithm’s robustness, stability, and real-time performance. For the warehouse management system using an UAV, we implemented a reinforcement-learning-based path planning technique using AprilTags. The training results in virtual environments were applied to simulations, as well as real-world testing. In the simulated environment, the PPO method achieved an average detection rate of 94.62%, while AC achieved an average detection rate of 90.38%. In the real-world environment, PPO almost consistently found all targets in about 20 steps, with an average detection rate of 99.38%. AC also found all boxes in most cases, with an average detection rate of 98.13%. The results demonstrate that the effectiveness of our approach was validated with real-world scenes. Differently from recent publications more focused on the applications of warehouse management [45], this paper presented an UAV navigation system for inventory inspection. The operation was performed by an UAV alone, without the assistance of a ground vehicle, as in [46]. Compared to the autonomous warehouse inventory application in [47], our approach integrated reinforcement learning for barcode scanning and provided better inspection results.
The method used in this paper was based on ROS Navigation Stack, which currently enables navigation in a two-dimensional space, where the altitude remains fixed. To fully leverage an unmanned aerial vehicle’s capabilities for free movement in three-dimensional space in future work, it is essential to extend navigation to the Z-axis. This extension involves incorporating path planning for altitude adjustment and obstacle avoidance, enabling the UAV to achieve free movement in three-dimensional space. In addition, this study was conducted in a controlled environment, and practical real-world applications are undoubtedly more complex and unpredictable. Therefore, enhancing robustness is a critical issue. This includes optimizing both global and local path planning trajectories to make the unmanned aerial vehicle more efficient and energy-saving. Strengthening collision avoidance mechanisms and protective strategies in both the UAV’s software and hardware is vital to ensure the safety of personnel in the environment. Moreover, developing reliable human recognition systems could further enhance safety measures for the UAV’s operation.

Author Contributions

Conceptualization, H.-Y.L.; Methodology, H.-Y.H.; Software, H.-Y.L., K.-L.C. and H.-Y.H.; Validation, K.-L.C. and H.-Y.H.; Formal analysis, H.-Y.L., K.-L.C. and H.-Y.H.; Investigation, K.-L.C.; Resources, H.-Y.L.; Data curation, H.-Y.H.; Writing—original draft, H.-Y.L., K.-L.C. and H.-Y.H.; Writing—review & editing, H.-Y.L.; Visualization, H.-Y.H.; Supervision, H.-Y.L.; Project administration, H.-Y.L.; Funding acquisition, H.-Y.L. All authors have read and agreed to the published version of the manuscript.

Funding

The support of this work in part by the Ministry of Science and Technology of Taiwan under Grant MOST 106-2221-E-194-004 is gratefully acknowledged.

Data Availability Statement

The original contributions presented in the study are included in the article, further inquiries can be directed to the corresponding author.

Conflicts of Interest

The authors declare no conflict of interest.

References

  1. Lin, H.Y.; Peng, X.Z. Autonomous quadrotor navigation with vision based obstacle avoidance and path planning. IEEE Access 2021, 9, 102450–102459. [Google Scholar] [CrossRef]
  2. de Jesus, J.C.; Kich, V.A.; Kolling, A.H.; Grando, R.B.; Guerra, R.S.; Drews, P.L.J. Depth-CUPRL: Depth-Imaged Contrastive Unsupervised Prioritized Representations in Reinforcement Learning for Mapless Navigation of Unmanned Aerial Vehicles. In Proceedings of the 2022 IEEE/RSJ International Conference on Intelligent Robots and Systems (IROS), Kyoto, Japan, 23–27 October 2022; pp. 10579–10586. [Google Scholar] [CrossRef]
  3. Moura, A.; Antunes, J.; Dias, A.; Martins, A.; Almeida, J. Graph-SLAM Approach for Indoor UAV Localization in Warehouse Logistics Applications. In Proceedings of the 2021 IEEE International Conference on Autonomous Robot Systems and Competitions (ICARSC), Santa Maria da Feira, Portugal, 28–29 April 2021; pp. 4–11. [Google Scholar] [CrossRef]
  4. Awate, Y.P. Policy-Gradient Based Actor-Critic Algorithms. In Proceedings of the 2009 WRI Global Congress on Intelligent Systems, Xiamen, China, 19–21 May 2009; Volume 3, pp. 505–509. [Google Scholar] [CrossRef]
  5. Schulman, J.; Wolski, F.; Dhariwal, P.; Radford, A.; Klimov, O. Proximal policy optimization algorithms. arXiv 2017, arXiv:1707.06347. [Google Scholar]
  6. Xia, J.; Li, S.; Wang, Y.; Jiang, B. Research on uwb/ble-based fusion indoor positioning algorithm and system application. In Proceedings of the 2021 International Symposium on Computer Technology and Information Science (ISCTIS), Guilin, China, 4–6 June 2021; pp. 50–54. [Google Scholar]
  7. Xia, J.; Wu, Y.; Du, X. Indoor Positioning Technology Based on the Fusion of UWB and BLE. In Proceedings of the Security, Privacy, and Anonymity in Computation, Communication, and Storage: SpaCCS 2020 International Workshops, Nanjing, China, 18–20 December 2020; Springer: Cham, Switzerland, 2021; pp. 209–221. [Google Scholar]
  8. Shang, S.; Wang, L. Overview of WiFi fingerprinting-based indoor positioning. IET Commun. 2022, 16, 725–733. [Google Scholar] [CrossRef]
  9. Deng, W.; Li, J.; Tang, Y.; Zhang, X. Low-Complexity Joint Angle of Arrival and Time of Arrival Estimation of Multipath Signal in UWB System. Sensors 2023, 23, 6363. [Google Scholar] [CrossRef] [PubMed]
  10. Krogius, M.; Haggenmiller, A.; Olson, E. Flexible layouts for fiducial tags. In Proceedings of the 2019 IEEE/RSJ International Conference on Intelligent Robots and Systems (IROS), Macau, China, 4–8 November 2019; pp. 1898–1903. [Google Scholar]
  11. Garrido-Jurado, S.; Muñoz-Salinas, R.; Madrid-Cuevas, F.J.; Marín-Jiménez, M.J. Automatic generation and detection of highly reliable fiducial markers under occlusion. Pattern Recognit. 2014, 47, 2280–2292. [Google Scholar] [CrossRef]
  12. Kato, H.; Billinghurst, M. Marker tracking and hmd calibration for a video-based augmented reality conferencing system. In Proceedings of the 2nd IEEE and ACM International Workshop on Augmented Reality (IWAR’99), San Francisco, CA, USA, 20–21 October 1999; pp. 85–94. [Google Scholar]
  13. Leutenegger, S.; Lynen, S.; Bosse, M.; Siegwart, R.; Furgale, P. Keyframe-based visual–inertial odometry using nonlinear optimization. Int. J. Robot. Res. 2015, 34, 314–334. [Google Scholar] [CrossRef]
  14. Mourikis, A.I.; Roumeliotis, S.I. A multi-state constraint Kalman filter for vision-aided inertial navigation. In Proceedings of the 2007 IEEE International Conference on Robotics and Automation, Rome, Italy, 10–14 April 2007; pp. 3565–3572. [Google Scholar]
  15. Bloesch, M.; Omari, S.; Hutter, M.; Siegwart, R. Robust visual inertial odometry using a direct EKF-based approach. In Proceedings of the 2015 IEEE/RSJ International Conference on Intelligent Robots and Systems (IROS), Hamburg, Germany, 28 September–2 October 2015; pp. 298–304. [Google Scholar]
  16. Labbé, M.; Michaud, F. RTAB-Map as an open-source lidar and visual simultaneous localization and mapping library for large-scale and long-term online operation. J. Field Robot. 2019, 36, 416–446. [Google Scholar] [CrossRef]
  17. Qin, T.; Li, P.; Shen, S. Vins-mono: A robust and versatile monocular visual-inertial state estimator. IEEE Trans. Robot. 2018, 34, 1004–1020. [Google Scholar] [CrossRef]
  18. Mur-Artal, R.; Tardós, J.D. Orb-slam2: An open-source slam system for monocular, stereo, and rgb-d cameras. IEEE Trans. Robot. 2017, 33, 1255–1262. [Google Scholar] [CrossRef]
  19. Lin, H.Y.; Tu, K.C.; Li, C.Y. Vaid: An aerial image dataset for vehicle detection and classification. IEEE Access 2020, 8, 212209–212219. [Google Scholar] [CrossRef]
  20. Ghosh, S.K. Visibility Algorithms in the Plane; Cambridge University Press: Cambridge, UK, 2007. [Google Scholar]
  21. Chaari, I.; Koubaa, A.; Bennaceur, H.; Ammar, A.; Alajlan, M.; Youssef, H. Design and performance analysis of global path planning techniques for autonomous mobile robots in grid environments. Int. J. Adv. Robot. Syst. 2017, 14, 1729881416663663. [Google Scholar] [CrossRef]
  22. Tsardoulias, E.G.; Iliakopoulou, A.; Kargakos, A.; Petrou, L. A review of global path planning methods for occupancy grid maps regardless of obstacle density. J. Intell. Robot. Syst. 2016, 84, 829–858. [Google Scholar] [CrossRef]
  23. Fox, D.; Burgard, W.; Thrun, S. The dynamic window approach to collision avoidance. IEEE Robot. Autom. Mag. 1997, 4, 23–33. [Google Scholar] [CrossRef]
  24. Khatib, O. Real-time obstacle avoidance for manipulators and mobile robots. Int. J. Robot. Res. 1986, 5, 90–98. [Google Scholar] [CrossRef]
  25. Kobayashi, M.; Motoi, N. Local path planning: Dynamic window approach with virtual manipulators considering dynamic obstacles. IEEE Access 2022, 10, 17018–17029. [Google Scholar] [CrossRef]
  26. Kalinov, I.; Petrovsky, A.; Ilin, V.; Pristanskiy, E.; Kurenkov, M.; Ramzhaev, V.; Idrisov, I.; Tsetserukou, D. WareVision: CNN Barcode Detection-Based UAV Trajectory Optimization for Autonomous Warehouse Stocktaking. IEEE Robot. Autom. Lett. 2020, 5, 6647–6653. [Google Scholar] [CrossRef]
  27. Yang, S.Y.; Jan, H.C.; Chen, C.Y.; Wang, M.S. CNN-Based QR Code Reading of Package for Unmanned Aerial Vehicle. Sensors 2023, 23, 4707. [Google Scholar] [CrossRef]
  28. Babu, S.; Markose, S. IoT enabled Robots with QR Code based localization. In Proceedings of the 2018 International Conference on Emerging Trends and Innovations In Engineering And Technological Research (ICETIETR), Ernakulam, India, 11–13 July 2018; pp. 1–5. [Google Scholar]
  29. Cho, H.; Kim, D.; Park, J.; Roh, K.; Hwang, W. 2D barcode detection using images for drone-assisted inventory management. In Proceedings of the 2018 15th International Conference on Ubiquitous Robots (UR), Honolulu, HI, USA, 26–30 June 2018; pp. 461–465. [Google Scholar]
  30. Cristiani, D.; Bottonelli, F.; Trotta, A.; Di Felice, M. Inventory Management through Mini-Drones: Architecture and Proof-of-Concept Implementation. In Proceedings of the 2020 IEEE 21st International Symposium on “A World of Wireless, Mobile and Multimedia Networks” (WoWMoM), Cork, Ireland, 31 August–3 September 2020; pp. 317–322. [Google Scholar] [CrossRef]
  31. Yoon, B.; Kim, H.; Youn, G.; Rhee, J. 3D position estimation of drone and object based on QR code segmentation model for inventory management automation. In Proceedings of the 2021 IEEE International Symposium on Safety, Security, and Rescue Robotics (SSRR), New York, NY, USA, 25–27 October 2021; pp. 223–229. [Google Scholar]
  32. Rhiat, A.; Chalal, L.; Saadane, A. A Smart Warehouse Using Robots and Drone to Optimize Inventory Management. In Proceedings of the Future Technologies Conference (FTC), Virtual, 28–29 October 2021; Springer: Cham, Switzerland, 2022; Volume 1, pp. 475–483. [Google Scholar]
  33. Manjrekar, A.; Jha, D.S.; Jagtap, P.; Yadav, V. Warehouse inventory management with cycle counting using drones. In Proceedings of the 4th International Conference on Advances in Science & Technology (ICAST2021), Bahir Dar, Ethiopia, 27–29 August 2021. [Google Scholar]
  34. Vamsi, A.M.; Deepalakshmi, P.; Nagaraj, P.; Awasthi, A.; Raj, A. IOT based autonomous inventory management for warehouses. In Proceedings of the EAI International Conference on Big Data Innovation for Sustainable Cognitive Computing: BDCC, Coimbatore, India, 13–15 December 2018; Springer: Cham, Switzerland, 2020; pp. 371–376. [Google Scholar]
  35. Kalaitzakis, M.; Cain, B.; Carroll, S.; Ambrosi, A.; Whitehead, C.; Vitzilaios, N. Fiducial markers for pose estimation: Overview, applications and experimental comparison of the artag, apriltag, aruco and stag markers. J. Intell. Robot. Syst. 2021, 101, 71. [Google Scholar] [CrossRef]
  36. Wang, J.; Olson, E. AprilTag 2: Efficient and robust fiducial detection. In Proceedings of the 2016 IEEE/RSJ International Conference on Intelligent Robots and Systems (IROS), Daejeon, Republic of Korea, 9–14 October 2016; pp. 4193–4198. [Google Scholar] [CrossRef]
  37. Brock, O.; Khatib, O. High-speed navigation using the global dynamic window approach. In Proceedings of the 1999 IEEE International Conference on Robotics and Automation (Cat. No. 99CH36288C), Detroit, MI, USA, 10–15 May 1999; Volume 1, pp. 341–346. [Google Scholar]
  38. Dijkstra, E.W. A note on two problems in connexion with graphs. In Edsger Wybe Dijkstra: His Life, Work, and Legacy; Association for Computing Machinery: New York, NY, USA, 2022; pp. 287–290. [Google Scholar]
  39. Mnih, V.; Badia, A.P.; Mirza, M.; Graves, A.; Lillicrap, T.; Harley, T.; Silver, D.; Kavukcuoglu, K. Asynchronous methods for deep reinforcement learning. In Proceedings of the International Conference on Machine Learning PMLR, New York, NY, USA, 20–22 June 2016; pp. 1928–1937. [Google Scholar]
  40. Mnih, V.; Kavukcuoglu, K.; Silver, D.; Graves, A.; Antonoglou, I.; Wierstra, D.; Riedmiller, M. Playing atari with deep reinforcement learning. arXiv 2013, arXiv:1312.5602. [Google Scholar]
  41. Koonce, B.; Koonce, B. ResNet 34. In Convolutional Neural Networks with Swift for Tensorflow: Image Recognition and Dataset Categorization; Apress: Berkeley, CA, USA, 2021; pp. 51–61. [Google Scholar]
  42. Shani, L.; Efroni, Y.; Mannor, S. Adaptive trust region policy optimization: Global convergence and faster rates for regularized mdps. In Proceedings of the AAAI Conference on Artificial Intelligence, New York, NY, USA, 7–12 February 2020; Volume 34, pp. 5668–5675. [Google Scholar]
  43. Zhong, H.; Zhang, T. A theoretical analysis of optimistic proximal policy optimization in linear markov decision processes. Adv. Neural Inf. Process. Syst. 2024, 36, 1–25. [Google Scholar]
  44. Koenig, N.; Howard, A. Design and use paradigms for gazebo, an open-source multi-robot simulator. In Proceedings of the 2004 IEEE/RSJ International Conference on Intelligent Robots and Systems (IROS)(IEEE Cat. No. 04CH37566), Sendai, Japan, 28 September–2 October 2004; Volume 3, pp. 2149–2154. [Google Scholar]
  45. Malang, C.; Charoenkwan, P.; Wudhikarn, R. Implementation and critical factors of unmanned aerial vehicle (UAV) in warehouse management: A systematic literature review. Drones 2023, 7, 80. [Google Scholar] [CrossRef]
  46. Guérin, F.; Guinand, F.; Brethé, J.F.; Pelvillain, H. Towards an autonomous warehouse inventory scheme. In Proceedings of the 2016 IEEE Symposium Series on Computational Intelligence (SSCI), Athens, Greece, 6–9 December 2016; pp. 1–8. [Google Scholar]
  47. Kwon, W.; Park, J.H.; Lee, M.; Her, J.; Kim, S.H.; Seo, J.W. Robust autonomous navigation of unmanned aerial vehicles (UAVs) for warehouses’ inventory application. IEEE Robot. Autom. Lett. 2019, 5, 243–249. [Google Scholar] [CrossRef]
Figure 1. The system architecture of our localization and navigation technique for UAVs. It consists of two components, indoor mapping and localization, and path planning with obstacle avoidance. In indoor mapping and localization, various global and local indoor positioning techniques, including UWB, QVIO, AprilTag, and RTAB-Map SLAM, are used for multi-sensor fusion.
Drones 08 00220 g001
Figure 2. System flowchart of the proposed technique for indoor mapping and localization. After setting up the environment, the different positioning techniques were activated, and the pose obtained from each sensor was converted into a path. The paths were finally shown with the ROS visualization tool.
Drones 08 00220 g002
Figure 3. The flowchart of our proposed navigation system. It also consists of loop closure detection, which helps to eliminate the errors accumulated in visual odometry over time.
Drones 08 00220 g003
Figure 4. The architecture of the proposed warehouse inventory management system. The images acquired in the setup environment were used as inputs for training and testing. The data collection was divided into virtual and real scene cases. In the virtual environment, a simulated drone acquired images from various sampling angles of the shelves. In the real environment, images were taken from fixed points within the setup area using a camera mounted on a mobile platform. The testing process was identical to training, with the difference being that all parameters were fixed, and each step’s images were saved. Testing was conducted ten times, and the results are summarized in Table 4.
Drones 08 00220 g004
Figure 5. A schematic diagram and internal structure of AC (actor–critic) framework. AC (actor-critic) is an on-policy method, and the basic framework is shown in (a). The internal structure of the actor is illustrated in (b).
Drones 08 00220 g005
Figure 6. The framework for PPO (proximal policy optimization). It consists of two parts: an actor (top) and critic (bottom). There are two policies with the same structure but used for different purposes, one for interacting with the environment and the other for learning and updating.
Drones 08 00220 g006
Figure 7. System flowchart of our reinforcement learning training framework. A set of random coordinates, angles, and images are taken as initial input. The system checks if sufficient data have been collected. If not, data collection continues. If enough data are collected, the learning process begins, and parameters are updated upon completion. Before feature extraction in the input training framework, images are normalized in size. The feature extraction network, ResNet34, is used, and its output is divided into two parts: policy and critic. The latter predicts an evaluation value, while the former outputs a probability distribution of actions. Action range checking is performed next, followed by selection of the next state and reward output according to the action selection rules. The system then checks if the task is complete, i.e., if all targets in the scene have been found. If not, a series of continuous state collections continues. Finally, the training results are observed based on the accumulated rewards from each round.
Drones 08 00220 g007
Figure 8. The flowchart of our reinforcement learning architecture for testing. After training is completed, the trained parameters are saved and imported for testing. The testing was conducted using a test dataset as input and followed the same framework. Evaluation was based on the detection rate of objects and the number of steps used.
Drones 08 00220 g008
Figure 9. The action movement in translation ((a), in front view) and rotation ((b), in top view). The choice of the next move included ‘up’, ‘down’, ‘left’, ‘right’, ‘upper-right’, ‘upper-left’, ’down-right’, and ‘down-left’. The camera orientation ranged from −40° to 40°, with an interval of 10°.
Drones 08 00220 g009
Figure 10. The sampling points were derived from the viewpoints using polar coordinates ( r , θ , ϕ ) , where p is the sampling point, and r , θ , ϕ represent the radius, azimuth angle, and elevation angle, respectively.
Drones 08 00220 g010
Figure 11. The navigation system architecture. It contained an UAV equipped with an Intel RealSense D435 depth camera and an UP-Board embedded computer.
Drones 08 00220 g011
Figure 12. The positioning system architecture. A mobile platform was used to carry the UAV along with the UWB Tag and the D455 depth camera.
Drones 08 00220 g012
Figure 13. RTAB-Map—Real environment mapping. The mapping process included the generation of a 3D point cloud for visual feature loop closure detection, a 2D occupancy grid for global path planning and obstacle avoidance, and a 2D map showing the safe flying zone for the UAV.
Drones 08 00220 g013
Figure 14. Comparison of the paths created with or without continuous AprilTag detection.
Drones 08 00220 g014
Figure 15. Indoor localization trajectories obtained from the RTAB-Map SLAM mapping and localization modes. The blue, green, and red paths represent the trajectories obtained when the initial mapping mode, localization mode, and the mapping mode were reactivated during the second localization mode.
Drones 08 00220 g015
Figure 16. The characteristics of the different localization techniques. The yellow, cyan, red, and blue curves represent the ground truth, UWB, QVIO, and AprilTag localization trajectories, respectively.
Drones 08 00220 g016
Figure 17. Path planning for dynamic obstacle avoidance—virtual environment. The red arrow represents the destination that the drone was heading in towards in RViz, the green path is the global path generated by the navfn global planner, and the yellow path is the local path generated by the local planner.
Drones 08 00220 g017
Figure 18. Path planning for dynamic obstacle avoidance—real-world environment. The performance of the local path planner was evaluated using a puzzle made of foam blocks as static unknown obstacles.
Drones 08 00220 g018
Figure 19. The boxes were placed on a shelf, and the drone equipped with a camera flew at a fixed height. There were three tracks in front of the shelf, each track had 35 sampling points, and the plane had a total of 35 × 3 sampling angle points.
Drones 08 00220 g019
Figure 20. The reinforcement learning training results for PPO and AC.
Drones 08 00220 g020
Figure 21. The testing results using PPO in a virtual environment with step set to 50. The images on the right are zoomed-in to better illustrate the blue circles.
Drones 08 00220 g021
Figure 22. The testing results using AC in a virtual scene with step set to 80.
Drones 08 00220 g022
Figure 23. The real-world testing results for PPO training. The steps are from 1 to 4 and 10 to 13 in the left and right columns, respectively.
Drones 08 00220 g023
Table 1. The relationships between action direction and action number. A greater degree of exploration is usually preferred, to handle boundary conditions for action selection.
Action Number01234567
Action Direction + x + y x y + x , + y x , + y + x , y x , y
Table 2. Handling the boundary condition for action selection. The field range was set as n × n for movement.
StateUnavailable ActionsAvailable Actions
x = n 0, 4, 61, 2, 3, 5, 7
x = 0 2, 5, 70, 1, 3, 4, 6
y = n 1, 4, 50, 2, 3, 6, 7
y = 0 3, 6, 70, 1, 2, 4, 5
Table 3. Summary of reinforcement learning training parameters for PPO and AC, including maximum movement, episode update, learning rate, and ϵ .
Max MovementEpisode UpdateLearning Rate ϵ
PPO50200.020.2
AC100240.00020.2
Table 4. The statistics from 10 real-world scenario tests, recording the final number of boxes found, detection rates, and the total number of steps (time) used. In the left table for the PPO real scene experimental results, all the targets could be identified in 20 steps almost every time. The average number of cargo detected was 15.9, the cargo detection rate was 99.38%, and the average number of steps required was 16.2 steps. In the right table for the AC real scene experiment, the results show that almost all the targets could be detected every time. The average amount of cargo detected was 15.7, the cargo detection rate was 98.13%, the average number of steps required was 36.4 steps. In terms of the number of steps, the PPO method required about 2-times longer to complete the task.
Exp.No.StepCoverageExp.No.StepCoverage
11619100%1145087.5%
21611100%21640100%
3155092.31%31619100%
41617100%41637100%
51613100%51644100%
61615100%6155093.75%
71610100%71631100%
81613100%81628100%
91614100%91619100%
101616100%101638100%
Average15.916.299.38%Average15.736.498.13%
Disclaimer/Publisher’s Note: The statements, opinions and data contained in all publications are solely those of the individual author(s) and contributor(s) and not of MDPI and/or the editor(s). MDPI and/or the editor(s) disclaim responsibility for any injury to people or property resulting from any ideas, methods, instructions or products referred to in the content.

