Article

CooPercept: Cooperative Perception for 3D Object Detection of Autonomous Vehicles

College of Computer Science and Technology, Nanjing University of Aeronautics and Astronautics, Nanjing 210016, China
*
Authors to whom correspondence should be addressed.
Drones 2024, 8(6), 228; https://doi.org/10.3390/drones8060228
Submission received: 6 May 2024 / Revised: 25 May 2024 / Accepted: 27 May 2024 / Published: 29 May 2024

Abstract

:
Autonomous vehicles rely extensively on onboard sensors to perceive their surrounding environments for motion planning and vehicle control. Despite recent advancements, prevalent perception algorithms typically utilize data acquired from the single host vehicle, which can lead to challenges such as sensor data sparsity, field-of-view limitations, and occlusion. To address these issues and enhance the perception capabilities of autonomous driving systems, we explore the concept of multi-vehicle multimedia cooperative perception by investigating the fusion of LiDAR point clouds and camera images from multiple interconnected vehicles with different positions and viewing angles. Specifically, we introduce a semantic point cloud feature-level cooperative perception framework, termed CooPercept, designed to mitigate computing complexity and reduce turnaround time. This is crucial, as the volume of raw sensor data traffic generally far exceeds the bandwidth of existing vehicular networks. Our approach is validated through experiments conducted on synthetic datasets from KITTI and OPV2V. The results demonstrate that our proposed CooPercept model surpasses comparable perception models, achieving enhanced detection accuracy and greater detection robustness.

1. Introduction

Autonomous vehicles (AVs) hold great promise to make the world a safer place by reducing accident rates [1]. Among the various enabling functionalities in AVs, accurate representation and mapping of the driving environment is the first and foremost task, offering pertinent information to facilitate informed decision-making in complex environments [2]. In particular, AVs rely on their onboard sensors to sense and perceive the surrounding environments, and multiple sensing modalities are commonly fused to achieve more accurate and robust perception in existing self-driving systems by exploiting their complementary properties for better performance [3]. However, the fusion of multimodal sensors from a fixed point of view may still suffer from occlusion, field-of-view limitations, and low data density in distant regions [4]. To this end, cooperative perception by fusing information from multiple geographically different sensing sources appears to be a promising solution to such problems [5]. Effective cooperative perception can expand the perceptual scope, detect occluded objects, and increase perceptual accuracy [6].
As an important function in the perception system of a self-driving vehicle, 3D object detection involves increasingly intensive research and development efforts. The detection results commonly consist of a list of objects of interest enclosed by 3D bounding boxes. Due to advantages in providing accurate location information [7], Light Detection and Ranging (LiDAR) data usually form the raw input of single sensor-based 3D object detectors. An input point cloud generated by a LiDAR sensor is usually projected into a cylindrical coordinate [8] or bird’s-eye view (BEV) [9] to obtain a structured and fixed-length representation that can be fed to a CNN network for object detection. After projecting the LiDAR points into an input tensor, the detection model feeds the represented data into convolutional layers to create the final 3D bounding boxes around objects of interest on a single forward pass [10]. However, for the representation choice and space quantization, both convolution and projection can lead to the loss of information. Unlike the aforementioned projection techniques, Voxelnet [11] generates a structured input by learning the representation of raw LiDAR points. STD [12] and PointRCNN [13] are two-stage detectors that refine the 3D proposals through a specialized network. Both use PointNet [14] as a backbone to obtain point-wise 3D proposals.
LiDAR point clouds provide a highly precise 3D range view, but with relatively low texture and resolution information compared to camera data. On the other hand, while camera images provide rich color and texture information, this inherently leads to depth ambiguity [15]. Therefore, numerous methods have been proposed to fuse camera and LiDAR data for more robust 3D target detection, which can be grouped into three categories: (1) object-centric fusion, such as AVOD [14] and MV3D [16], where different modalities exploit distinct backbones and fusion is conducted at the object proposal level using region-of-interest pooling within each pattern from a shared set of proposals; (2) continuous feature fusion [17,18], where feature information is shared across all spaces of the LiDAR and image backbones; and (3) detection seeding, such as Frustrum PointNet [19], ConvNet [20], and IPOD [21], where the models extract semantics from images a priori, then apply them to seed detection in the LiDAR point cloud.
Despite its promise, 3D object detection using the sensor data from a single host vehicle has several major limitations. First, the perception ability of multi-modal sensor fusion models is limited by low sensing range and possible field-of-view occlusion by objects [22]. Furthermore, sole reliance on a vehicle’s own sensors lacks redundancy and may suffer from single-point-of-failure issues [23]. Thus, cooperative perception has been proposed to fuse information from multiple independent networked sources, which range from raw LiDAR and camera data to object detection results and moving object tracks. Arnold et al. [24] reconstructed 3D objects using images collected from multiple perspectives to improve 3D detection accuracy. Existing works usually share raw data between vehicles using raw data-level fusion. As an illustration, Chen et al. [25] argued that the advantages of raw point cloud fusion compared with fusing images include more precise position information and no need to perform convolutions for overlap. However, the huge amount of raw LiDAR data seriously increases the computing power and communications bandwidth requirements. Correa et al. [26] fused detection results instead of raw LiDAR points to enhance perception performance, and proposed two standardized message transportation protocols, i.e., the Collective Perception Message (CPM) and Cooperative Awareness Message (CAM), for object level fusion. Hobert et al. [27] pointed out flaws in CAMs and presented proposals for improvement. While bandwidth requirements are reduced, object-level fusion may produce undesirable outcomes due to biased individual predictions [28]. Recent methods have studied different ways of balancing accuracy and efficiency. For example, MKD-Cooper [29] aggregates shared deep learning-based features from neighboring vehicles using a collaborative attention fusion module that dynamically captures inter-vehicle interactions through channel and spatial attention. FedBEVT [30] and BEV-V2X [31] share bird’s-eye view (BEV) data from cameras between AVs. However, these works focus on the fusion of data from a single type of sensors from different vehicles, and neglect to combine the advantages of LiDAR and cameras. Achievements have been made in research into multi-vehicle multi-sensor fusion methods [32,33]; however, many problems, such as imperfect information fusion methods, large amounts of data with limited network bandwidth, and spatiotemporal alignment issues, remain to be solved.
To achieve accurate, robust, and efficient perception of driving environments, we propose CooPercept, a feature-based multi-sensor fusion cooperative perception method. To the best of our knowledge, this is the first proposed semantic point cloud feature fusion method for accurate cooperative object detection with connected autonomous vehicles. The main contributions and the technical advancements of this paper are summarized as follows.
  • To meet the requirements of cooperative perception in terms of spatial coverage and stringent computation time, we propose a lightweight and effective sequential LiDAR–camera fusion method based on image semantic segmentation. The model can be deployed in multiple autonomous vehicles, and the fused data are shared among vehicles for cooperative object detection.
  • To overcome the aforementioned deficiencies of existing works, we develop a cooperative 3D object detection method based on feature-level data fusion that integrates the processed point cloud features with the image semantic information from multiple vehicles. By fusing voxel features, our method can accurately identify more potential objects than post-detection fusion, and the size of the transmitted and computed data is significantly reduced compared with raw data-level fusion methods.
  • We conduct comprehensive experiments, with the results showing that the proposed approach improves the detection precision and robustness of connected autonomous vehicles with acceptable computational overhead and communication costs. By augmenting the point cloud with image semantics, the proposed method possesses the advantages of both LiDAR and camera data. The detection performance of the cooperative perception scheme based on voxel feature fusion compares favorably with that of raw data fusion schemes, while the size of the transmitted data required by feature fusion is far less than the size of the original data.
The rest of this paper is structured as follows. In Section 2, the proposed cooperative perception framework and fusion strategies are presented and analyzed. The new system’s performance is evaluated and discussed in Section 3. Finally, some conclusions are drawn in Section 4.

2. System Model and Fusion Schemes

This section presents CooPercept, our proposed cooperative perception network. As shown in Figure 1, CooPercept consists of three main modules: (1) a self-data processing module that processes raw point clouds and images to generate compressible voxel features; (2) a cross-CAV fusion module that merges and fuses the intermediate feature representations from multiple CAVs; and (3) the output network that generates and presents the final outputs. We next introduce each module in detail.

2.1. Self-Data Processing

In the proposed scheme, each self-driving vehicle first processes its own LiDAR point clouds and camera images to create the intermediate feature representation. These data are then compressed and broadcast to nearby CAVs.

2.1.1. LiDAR–Camera Fusion

We fuse the camera and LiDAR data by appending image semantic segmentation scores to each point. Semantic segmentation maps of the camera RGB images are generated based on the efficient model from [34]. The LiDAR point clouds are processed through a homogenous transformation and then projected into the images. After projecting the LiDAR points into the image class, we append the segmentation labels for the corresponding pixels to the LiDAR points to generate the semantic LiDAR points. In cases where LiDAR points are projected into multiple image classes at the same time due to the overlapping fields of view of the cameras, we randomly select one segmentation label. In this way, contextual information with visual features is fused into the point cloud.

2.1.2. Voxel Feature Encoding

The cooperative perception method we propose is grounded in the assumption that two or more vehicles can combine semantic point clouds from different positions and/or angles to increase perceptual precision and range while reducing the blind zones encountered by a single perspective due to occlusion. Driven by the success of feature-level fusion in 2D object detection and the fact that feature maps can be extracted from semantic LiDAR point clouds, we propose a feature-based semantic point cloud fusion method for accurate 3D target detection. Our new method has a number of advantages. First, compared with raw data-level fusion, feature-level fusion can materially reduce the amount of transmitted data while better protecting the privacy of users. In addition, compared with object level fusion, the proposed feature-based fusion scheme is more accurate due to its effective exploitation of complementary information obtained from diversified raw sensor observations.
More specifically, we first quantize the semantic point clouds into 3D voxel representations. Each voxel contains the features of the semantic LiDAR points that were located in it before. In the voxelized semantic point clouds, only a few voxels contain valid information, while the rest are empty. For these voxels, features can be extracted by feeding them through a voxel feature encoding (VFE) layer [10]. After being processed by several full connection layers, all non-empty voxels are converted into vectors with a fixed length of 128, i.e., the feature maps.

2.1.3. Compression

Each vehicle needs to compress its feature maps prior to transmission. These intermediate representations are compressed by the variational image compression algorithm [35]. With the aid of a learned hyperprior, this approach learns to compress the data using a convolutional network, then quantizes and encodes the latent representations losslessly via entropy encoding. The differentiable and trainable compression module allows our model to learn how to preserve enough valid information while simultaneously minimizing the amount of data.

2.2. Cross-CAV Fusion

Before aggregation, an autonomous vehicle needs to decode the data received from other CAVs by a decoder. The decoder applies entropy decoding to the received data stream and a convolutional network to extract the decompressed feature maps. Then, an updated intermediate representation is generated by integrating the received information from other vehicles into its own.

2.2.1. Temporal and Spatial Alignment

The fusion module needs to deal with the fact that multiple autonomous vehicles have different spatial locations and may observe the scene at different time points. Therefore, it is necessary to to encapsulate additional information into the exchange package. In addition to the LiDAR sensor installation information, the package should include the vehicle’s GPS reading and Inertial Measurement Unit (IMU) reading with timestamps. The GPS reading provides the center position of each point cloud frame, while the IMU data provide the offset information of the vehicle during driving.
From the aggregated data of the connected vehicles, a new semantic point cloud frame is produced by merging data from the transmitter and the receiver with the same timestamp using the following equation:
X Y Z = X R Y R Z R X T   Y T   Z T  
where X, Y, and Z are the 3D space coordinates of each point in the semantic point cloud frame, X R Y R Z R   represents the coordinates of the receiver’s semantic point cloud data, and X T   Y T   Z T     are the point cloud coordinates from the transmitter after transformation to account for the connected vehicles being in different locations. We apply a transform (2) to the original coordinates to align the data obtained from different vehicles with respect to a transmitter, as provided below:
X T   Y T   Z T   = R × X T Y T Z T + d x d y d z
where d x , d y , d z represents the difference in GPS coordinate readings between the transmitter and the receiver. The rotation matrix R is generated as follows:
R = R z α R y β R x γ ,
R z α = c o s α s i n α 0 s i n α c o s α 0 0 0 1 ,
R y β = c o s β 0 s i n β 0 1 0 s i n β 0 c o s β ,
R x γ = 1 0 0 0 c o s γ s i n γ 0 s i n γ c o s γ ,
where α , β , γ is the IMU reading difference between the transmitter and the receiver, representing the yaw, pitch, and roll angles of the rotation, respectively, while R z α , R y β , and R y γ are three basic rotation matrices due to the rotation angles on the z, y, and x-axes, respectively, in three dimensions.

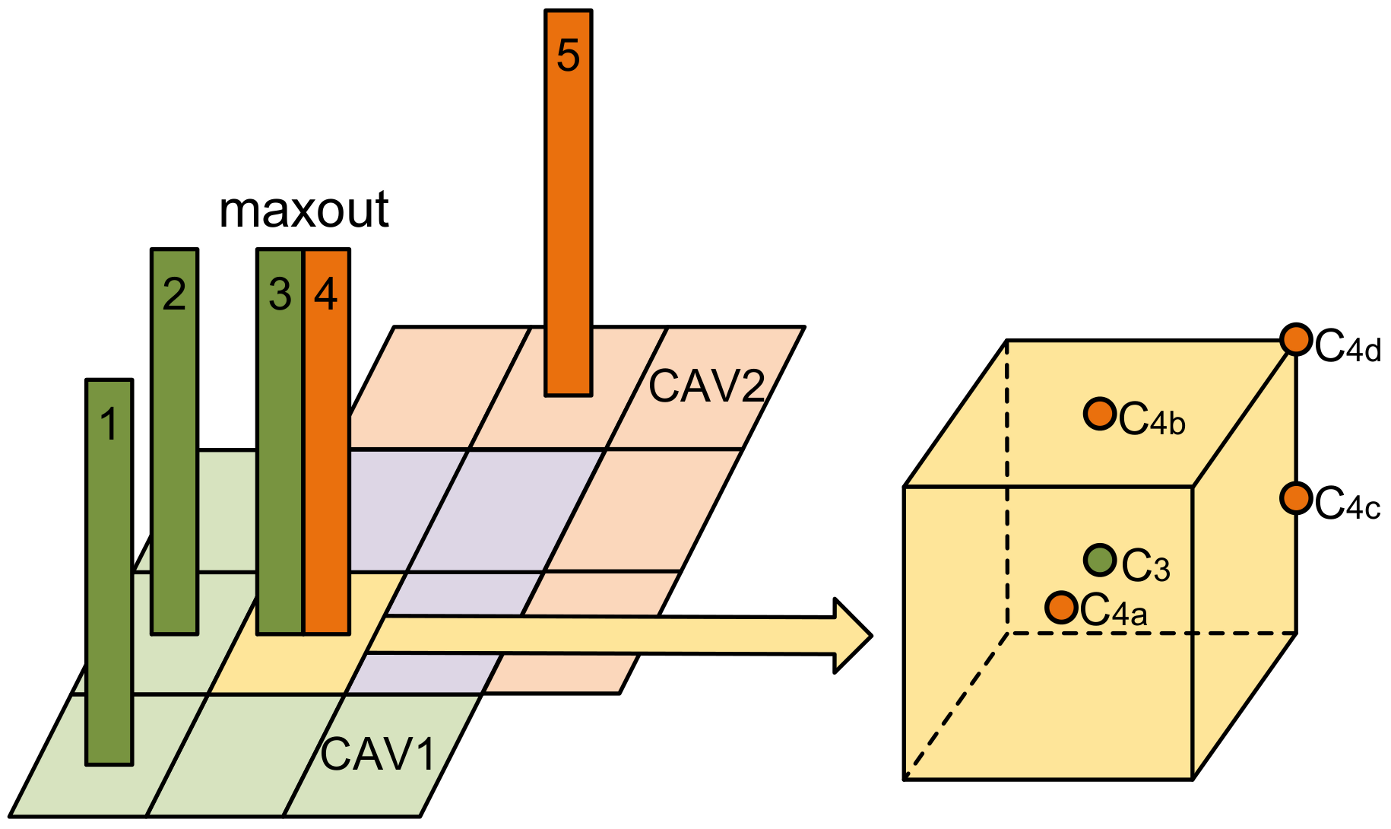
2.2.2. Voxel Feature Fusion

After the alignment in the previous step, the CAVs at different locations geographically can share and fuse the data obtained from the same calibrated 3D space. Next, we merge all of the voxel features from the inputs of multiple vehicles. By employing the element-wise maxout [36] scheme, it is possible to fuse the voxels from the same calibrated locations, as depicted in Figure 2.
The maxout function is used to extract the features that are most prominent among the data from different inputs. Inspired by similar approaches in convolutional neural networks, it preserves crucial features and suppresses trivial ones. Moreover, maxout does not introduce any extra parameters, as it is an uncomplicated floating-point operation. The incurred additional computational overhead is trivial, and can be ignored. In Figure 2, Voxel 3 from CAV 1 and Voxel 4 from CAV 2 are in the same calibrated location, and are denoted as V 3 and V 4 , respectively. The fused features V are presented as follows:
V i = m a x V 3 i , V 4 i , i = 1 , , 128
where V i represents the i-th element.
Even a small bias between voxels from two vehicles will cause an explicit mismatch; thus, it is impractical to expect perfect matches in practical applications. There are four different mismatches in Figure 2. The green dot C 3 denotes the center point of Voxel 3 from CAV 1, while the orange dots C 4 a , C 4 b , C 4 c , and C 4 d indicate the potential center points of Voxel 4 from CAV 2. In case (a), denoted as C 4 a , the center point of Voxel 4 is located in Voxel 3. In case (b), the center point C 4 b is located on a side of Voxel 3, which implies that Voxel 4 intersects with two voxels from CAV 1. In case (c), the center point C 4 c is located on an edge of Voxel 3, meaning that Voxel 4 connects with four voxels from CAV 1. In case (d), the center point C 4 d is located on a corner of Voxel 3 and intersects with eight voxels. For the above cases, we fuse Voxel 4 with all of the intersected voxels from CAV 1, including Voxel 3.

2.3. Output Network

As shown in Figure 1, after the synthetic voxel feature maps are generated, they are sent to a sparse convolutional layer to generate the spatial feature maps, then the results are fed to a region proposal network (RPN) for object proposal. The outputs of the RPN include the probability score p 0 , 1 of the proposed regions of interest and the locations of the proposed regions P = P x , P y , P z , P h , P w , P l , P θ , where P h , P w , P l , P θ respectively represent the height, width, length, and yaw rotation angle, while P x , P y , P z is the 3D coordinates of the center point of the proposed region. In addition, the RPN output includes a loss function, which consists of two parts: the regression loss L r e g and classification loss L c l s .
We use G = G x , G y , G z , G h , G w , G l , G θ to represent a 3D ground-truth bounding box, where G h , G w , G l , G θ represents the height, width, length, and yaw rotation angle, respectively, and G x , G y , G z denotes the central point coordinate of the bounding box. Using our method, a vector P is generated to denote the predicted bounding box parameters. To minimize the loss between the ground truth and our prediction values, we regress the predicted 3D boxes by minimizing the prediction error Δ x , Δ y , Δ z , Δ h , Δ w , Δ l , Δ θ as follows:
Δ x = G x P x P d , Δ y = G y P y P d , Δ z = G z P z P h , Δ h = l o g G h P h , Δ w = l o g G w P w , Δ l = l o g G l P l , Δ θ = G θ P θ ,
where P d = P l 2 + P w 2 1 2 .
Supposing that the number of proposed positive and negative anchors are N p o s and N n e g , respectively, we employ the binary cross-entropy loss to represent the smooth-L1 loss and classification loss [37,38]. The loss function is defined as follows:
L = α 1 N n e g i = 1 N n e g L c l s p n e g i , 0 + β 1 N p o s i = 1 N p o s L c l s p p o s i , 1 + 1 N p o s i = 1 N n e g L r e g P i , G i
where G i is the ith ground truth, P i represents the corresponding predicted anchor, and p p o s i and p n e g i denote the probabilities of the positive anchors and negative anchors, respectively. To maintain balance between the losses, two parameters α and β are introduced into the function.

3. Experiments

3.1. Dataset

In our experiments, we tested CooPercept on two kinds of synthetic datasets simulated from KITTI [39] and OPV2V [40].
The KITTI dataset is provided by the Toyota Technological Institute in Chicago and the Karlsruhe Institute of Technology. A famous vision benchmark suite project, KITTI provides labeled data for model training and performance evaluations. As we are studying LiDAR–camera fusion for object detection, the Velodyne LiDAR data and the corresponding camera images from the KITTI dataset were used. Within one LiDAR point cloud frame, about 1 × 10 5 points are stored in a binary float matrix, along with their spatial locations and reflectance information. In addition, as KITTI data are collected from single vehicles without connection, we used different time points of the same record to simulate the data gathered from different CAVs. Considering that a moving object can be located in completely different spatial positions due to the change in timestamps, we selected only those scenarios where the surrounding objects were static. Two such segments of data in the test were selected to provide a demonstration, shown in Figure 3. At the start time t 1 , fused with the corresponding 120 front view image, a frame of the semantic point cloud was generated. After the testing vehicle was driven for t seconds (in our experiments, t is a random value between 1 and 2), another set containing an image and point cloud was collected at time t 2 . By merging the images and point clouds at t 1 and t 2 , this experiment simulated the cooperative perception process between two CAVs.
However, it is difficult to perfectly simulate CAVs with different perspectives and dynamic objects using the above dataset; thus, we used data from OPV2V to test more complex scenarios. OPV2V simulates traffic flow and records data via CARLA-SUMO co-simulation. The dataset has an average of 2.52 CAVs, with a minimum of two and a maximum of five in each frame, which are spawned in eight towns provided by CARLA. Each CAV is equipped with a 64-channel LiDAR, four cameras that can cover 360 view together, and GPS/IMU sensors; see Figure 4 for several example scenes.

3.2. Test Scenarios

Using the datasets, we emulated and tested a series of different common scenarios, which are presented below.
Multi-lane roads. One of the most common driving scenarios, it always combines multiple lanes with different traffic speeds. Due to a large number of vehicles, such roads are traffic jams-prone areas. The detection ranges of different models can be compared effectively on long straight lines.
Road intersections. Another classical driving scenario is a road intersection, where the traffic is usually heavy and too closely spaced together, leading to the vision of sensors on an autonomous vehicles being blocked by other vehicles or obstacles. To test the effectiveness of our model in solving occlusion, we included the road intersection scenario in our tests.
Inclement Weather. There are many kinds of bad weather in real driving environments, such rain, fog, hail, snow, and dust storm weather conditions, in which the performance of LiDAR and cameras can be severely degraded. To test the robustness of our model, we added this scenario to our experiments.

3.3. Experiment Setup

According to the KITTI dataset, our region of interest is set to the 3D scope of 0 , 60 m × 40 , 40 m × 2.7 , 1.3 m in the Cartesian coordinate system, with the sensor as the origin. The objects within 15 m of the CAV are considered to be nearby ones, with the others considered faraway objects. The data were split into 2000/500/1000 frames for training/validation/testing. For the OPV2V dataset, we selected a fixed vehicle as the ego vehicle among all spawned CAVs for each snippet in the testing and validation set. Detection performance was evaluated near the ego vehicle in a range of 140 , 140 m × 40 , 40 m × 2.7 , 1.3 m. The broadcast range among CAVs was set to 70 m, with sensing messages outside of this communication range ignored by the ego vehicle. The training/validation/testing splits were 5357/1274/2239 frames, respectively.
The size per cell was approximately 0.08 m × 0.08 m × 0.19 m with a resolution of 768 × 1024 × 21 .
The Average Precision (AP) at Intersection-over-Union (IoU) thresholds of 0.5 and 0.7 is used in this paper as the metric for evaluation.
In our experiments, the models were run on a workstation with a GeForce GTX 1080Ti GPU.

3.4. Baselines

We evaluated two single-vehicle 3D object detection models, F-PointNet [19] and F-ConvNet [20], which combine camera data and LiDAR data as the inputs without V2V communication. Two baselines with V2V communication were introduced as well, namely, Output Fusion and LiDAR Fusion. In Output Fusion, CAVs send postprocessed results with confidence scores and bounding boxes. Upon being received, the bounding boxes are transformed into the receiver coordinate system and then merged across CAVs. In LiDAR Fusion, the receiver warps all raw LiDAR scanned data collected from transmitters to its own coordinate frame through relative transformation between CAVs, then performs integration directly. We used the Draco LiDAR compression algorithm to compress the LiDAR data. In addition, to investigate the influence of our LiDAR–camera fusion scheme and V2V communication scheme, we evaluated two ablation models of CooPercept in our tests: CooPercept-a, which takes only LiDAR data as input without LiDAR–camera fusion, and CooPercept-b, which lacks cross-vehicle aggregation.

3.5. Evaluation of CooPercept

The performance of our proposed CooPercept cooperative perception model was evaluated by conducting a set of experiments in the aforementioned scenarios (Table 1). First, using the KITTI dataset, we compared the detection performance of CooPercept to existing baselines. Second, we studied the impact of sensor drift on detection performance on the OPV2V dataset to evaluate the robustness of our fusion method. The possibility of real-time edge computing on inter-vehicle data was analyzed on the OPV2V dataset as well. The final subsection presents some qualitative results achieved by CooPercept.

3.5.1. Comparison with Benchmarks

Table 1 shows the detection performance of the different schemes under various scenarios on the KITTI dataset, with the best results marked in bold font. It can be observed that CooPercept shows the best performance in almost all scenarios. Although the LiDAR Fusion solution achieves very close detection accuracy to that of CooPercept, it is very costly and may incur intolerable transmission delays to exchange the huge amount of raw LiDAR data generated by self-driving vehicles in real time. In addition, as observed in the baseline test, baselines without cooperative perception (F-PointNet, F-ConvNet, and CooPercept-b) achieve passable near-object detection performance while dropping sharply in accuracy for the detection of more distant objects. This is understandable, as LiDAR reaches further ranges it generates sparser points and less sensing information. In contrast, the cooperative perception models (LiDAR Fusion, Output Fusion, CooPercept-a, and CooPercept) have more obvious advantages in “Far” detection than in “Near” detection. Finally, 3D object detection on rainy days represents is a challenge. CooPercept shows better performance than the baselines in this scenario, as it can take advantage of more data features.
In summary, the following conclusions can be drawn from the above experimental results: (1) the ability of cooperative perception to obtain extra features allows for extended detection range with an increase in detection precision; (2) compared to the baselines, CooPercept has higher prediction accuracy and more stable performance in a variety of scenarios; and (3) the ablation study proves the effectiveness of our LiDAR–camera fusion and V2V communication schemes.

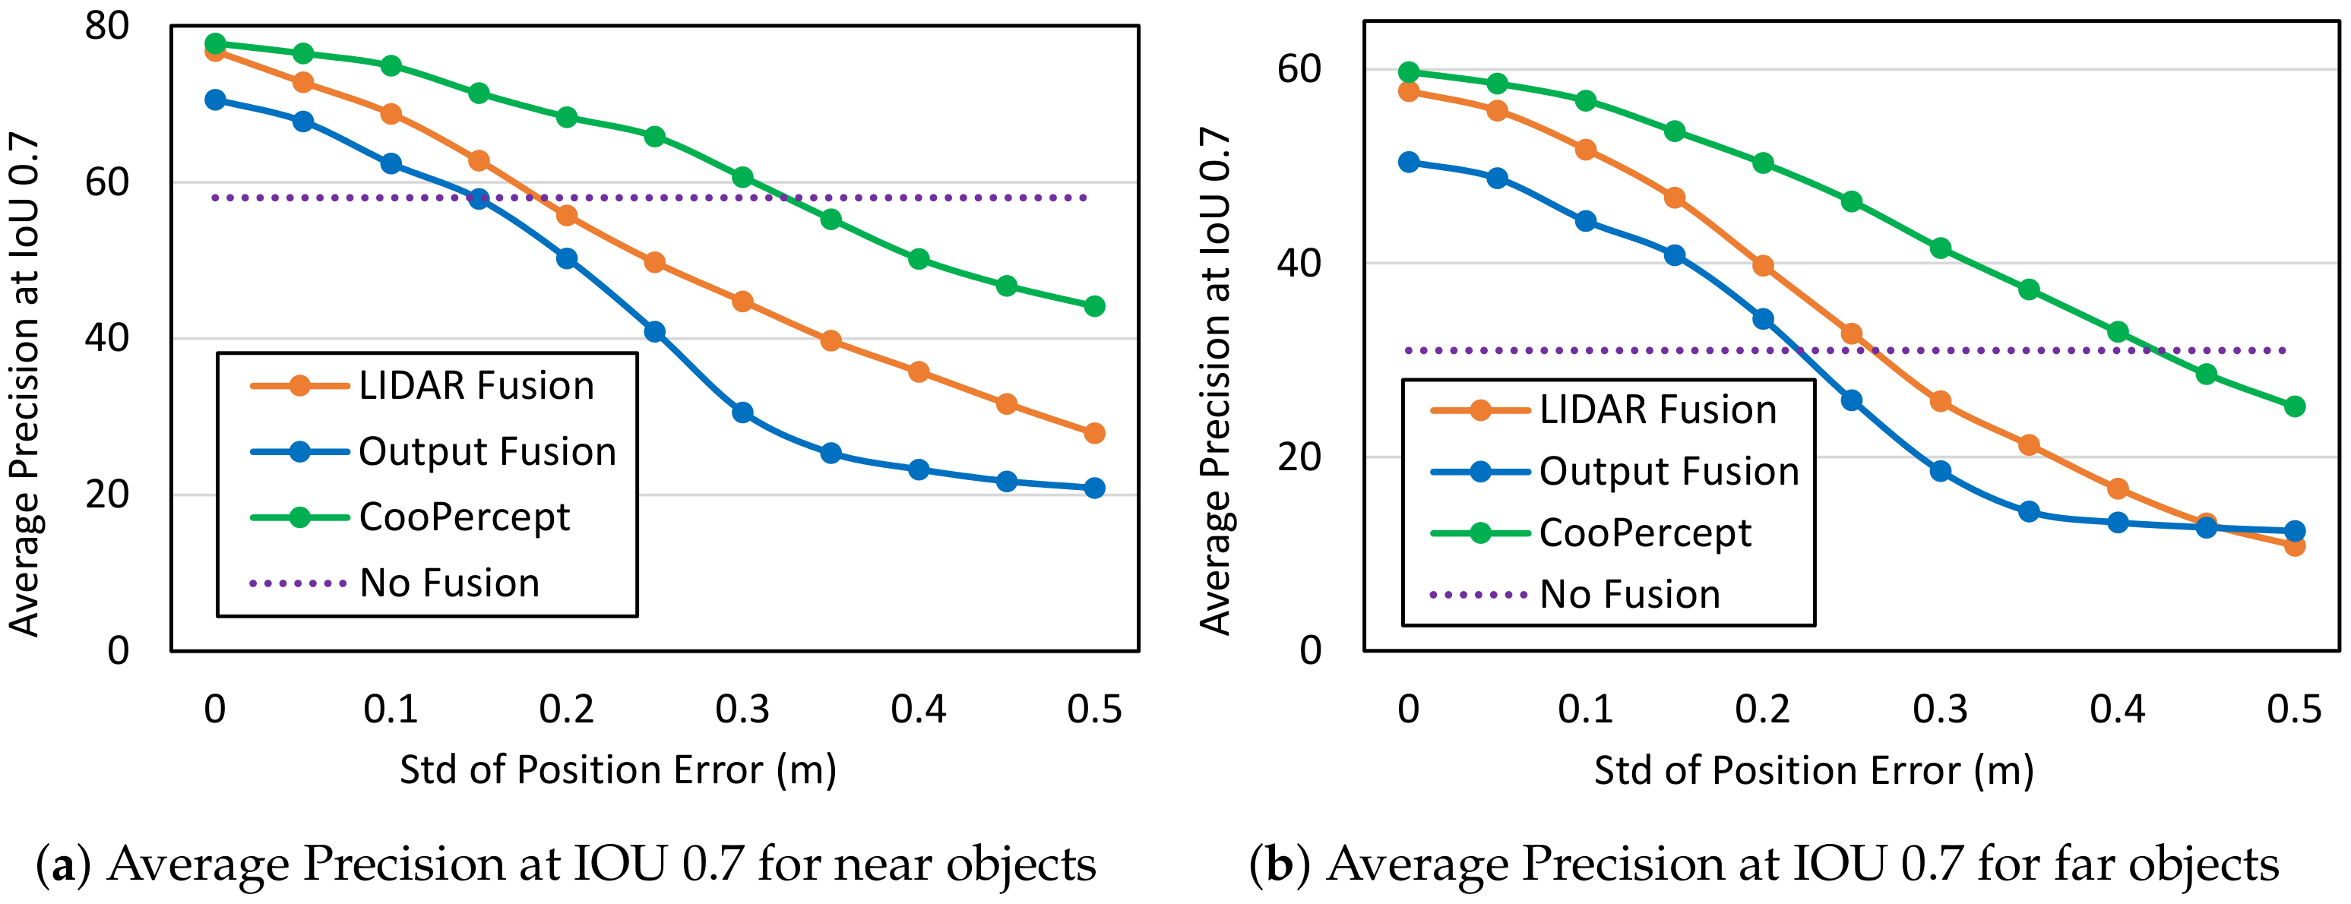
3.5.2. Fusion Robustness

In the real world, sensor drift situations are unavoidable. To consider this problem, we tested the robustness of our proposed model against sensor drift on the OPV2V dataset. We simulated inaccurate position estimates by introducing different levels of Gaussian noise ( σ = 0.5 m) to the GPS readings of the transmitters and conducted procedural artificial skewing of our IMU readings by introducing different levels of von Mises ( σ = 4 , 1 K = 4.75 × 10   3 ) noise to the heading of the transmitters. As indicated in Figure 5 and Figure 6, CooPercept outperforms Output Fusion and LiDAR Fusion in detection performance under different degrees and types of reading drifting. Although none of the models perform well at high noise levels, the performance degradation of CooPercept with the increase in the reading error is significantly less severe than other models. Comparing Figure 5 and Figure 6, it can be seen that the degradation in performance due to heading noise is the most severe when detecting distant objects, as even a slight rotation in the ego-view can lead to significant misalignments.

3.5.3. Transmission and Computation

Due to the limited bandwidth and computing power in practice, a huge volume of data transmission between CAVs will inevitably cause network congestion and depletion of on-board computing resources. Testing on the OPV2V dataset indicates that with CooPercept, this issue is simply eliminated.
In this experiment, the models were run on two workstations with GeForce GTX1080Ti GPUs, with the data rate of the communication network set to 30 Mbps. Figure 7 shows the time consumption and data volume for various fusion strategies. CooPercept can compress a transmitted data frame to a size of about 0.4 MB, which is far less than the amount of data that the raw data fusion model needs to transmit. Under our experimental conditions, the total time consumed for CooPercept was less than 0.4 s, which consists of the time for data processing and transmission. Comparatively, the baselines needed much more time to process and transmit data. These results prove that the voxel feature fusion method and data compression algorithm used by CooPercept improve the transmission and computation performance of the model. Considering the development of 5G communication techniques and the possibility of deploying our model on edge systems in the future, the total time consumption of one data frame could be reduced even further.

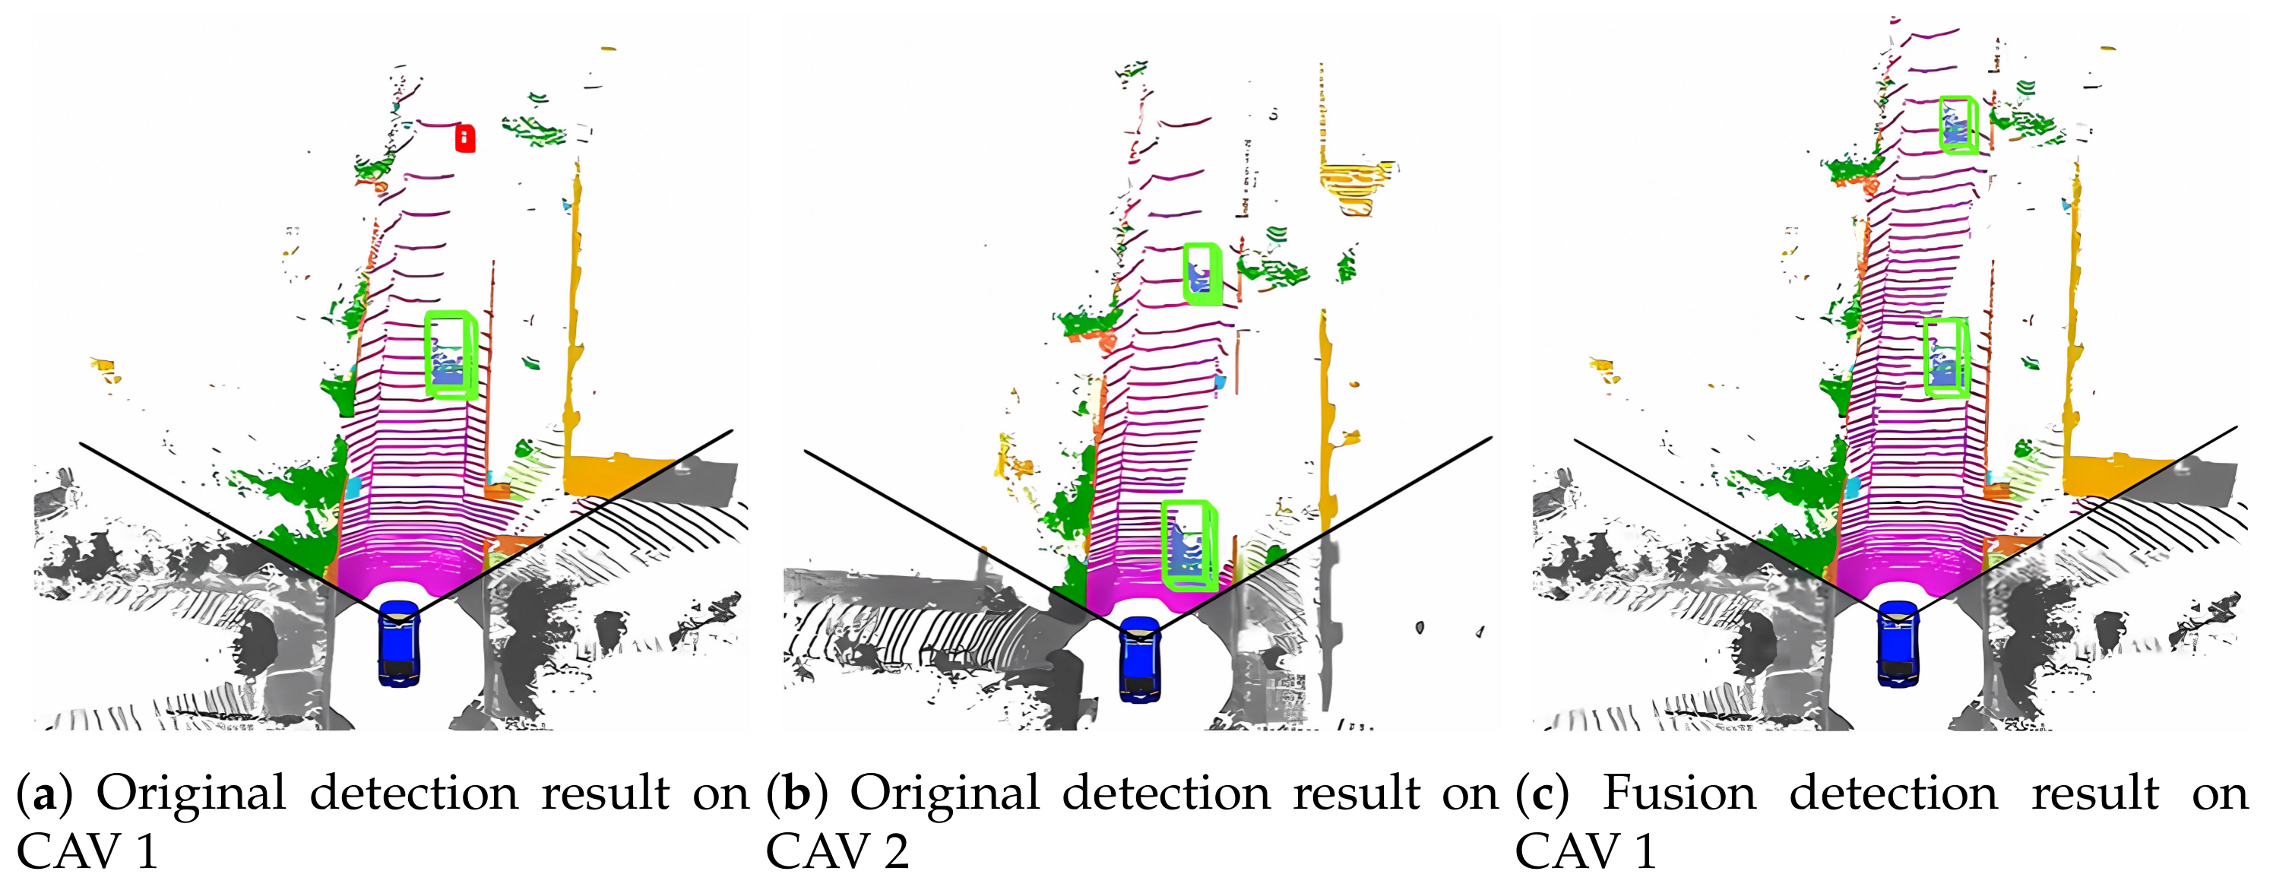
3.6. Qualitative Results

Figure 8 and Figure 9 show the results of fusion from the receiver (CAV 1) and the transmitter (CAV 2). In both figures, the bounding boxes are marked in three colors: the vehicles marked in green represent those that are detected correctly; the vehicles marked in red represent those detected incorrectly; finally, the vehicles marked in black represent those undetected by the CAVs.
As shown in the figures, CooPercept can see more further objects, has better ability to overcome occlusion, and shows improved perceptual accuracy. In Figure 8, CAV 2 perceives a vehicle that is obscured for CAV 1, which provides the downstream CAV with more information and allows it to adopt a safer driving strategy. Figure 9 reveals that CooPercept can detect more objects in the scene that were not detected correctly by the two CAVs at first.

4. Discussion

This article has mainly studied multimodal fusion between two CAVs. For more complex scenarios, such as cooperative perception between three or more CAVs, more detailed experiments will need to be conducted in future work. Certain technical details, such as the emulation of cooperative sensing processes between two CAVs by merging KITTI data at different times, require further research to verify the rationality of the practice and make the experiments more persuasive. Furthermore, there is no guarantee that information received from other vehicles is correct. Future research opportunities include the investigation of potential security flaws in cooperative perception.

5. Conclusions

In this paper, we have developed a novel end-to-end model called CooPercept as a new cooperative perception framework based on feature-level LiDAR–camera fusion, attaining enhanced cooperative perception capability for improved 3D object detection performance. The proposed scheme consists of a self-data processing module, a cross-vehicle aggregation module, and an output network. The experimental results demonstrate that our model achieves higher detection accuracy than the baselines along with enhanced robustness against sensor drift and in inclement weather conditions. At the same time, it performs well in terms of its communication and computation overhead. With the continuous deployment of 5G communication and edge computing techniques, these advantages are expected to make CooPercept highly applicable in real driving scenarios.

Author Contributions

Conceptualization, Y.Z. and B.C.; methodology, Y.Z.; software, Y.Z.; validation, Y.Z.; formal analysis, Y.Z. and F.H.; investigation, Y.Z. and J.H.; resources, B.C.; data curation, Y.Z.; writing—original draft preparation, Y.Z.; writing—review and editing, Y.Z., J.Q. and B.C.; visualization, Y.Z.; supervision, B.C.; project administration, F.H. and J.H.; funding acquisition, B.C. All authors have read and agreed to the published version of the manuscript.

Funding

This research was funded by the National Key Research and Development Program of China under Grant 2019YFB2102002, the National Natural Science Foundation of China under Grants 62176122 and 62001217, the A3 Foresight Program of the NSFC under Grant 62061146002, and the Key Research and Development Program of Jiangsu Province under Grant BE2019012.

Data Availability Statement

The raw data supporting the conclusions of this article will be made available by the authors on request.

Conflicts of Interest

The authors declare no conflicts of interest. The funders had no role in the design of the study, in the collection, analysis, or interpretation of data, in the writing of the manuscript, or in the decision to publish the results.

References

  1. Jiang, Z.; Pan, W.; Liu, J.; Dang, S.; Yang, Z.; Li, H.; Pan, Y. Efficient and Unbiased Safety Test for Autonomous Driving Systems. IEEE Trans. Intell. Veh. 2023, 8, 3336–3348. [Google Scholar] [CrossRef]
  2. Chen, L.; Li, Y.; Huang, C.; Li, B.; Xing, Y.; Tian, D.; Li, L.; Hu, Z.; Na, X.; Li, Z.; et al. Milestones in Autonomous Driving and Intelligent Vehicles: Survey of Surveys. IEEE Trans. Intell. Veh. 2023, 8, 1046–1056. [Google Scholar] [CrossRef]
  3. Wang, L.; Zhang, X.; Song, Z.; Bi, J.; Zhang, G.; Wei, H.; Tang, L.; Yang, L.; Li, J.; Jia, C.; et al. Multi-Modal 3D Object Detection in Autonomous Driving: A Survey and Taxonomy. IEEE Trans. Intell. Veh. 2023, 8, 3781–3798. [Google Scholar] [CrossRef]
  4. Wang, K.; Zhou, T.; Li, X.; Ren, F. Performance and Challenges of 3D Object Detection Methods in Complex Scenes for Autonomous Driving. IEEE Trans. Intell. Veh. 2023, 8, 1699–1716. [Google Scholar] [CrossRef]
  5. Watta, P.; Zhang, X.; Murphey, Y.L. Vehicle Position and Context Detection Using V2V Communication. IEEE Trans. Intell. Veh. 2021, 6, 634–648. [Google Scholar] [CrossRef]
  6. Hurl, B.; Cohen, R.; Czarnecki, K.; Waslander, S. TruPercept: Trust modelling for autonomous vehicle cooperative perception from synthetic data. In Proceedings of the 2020 IEEE Intelligent Vehicles Symposium (IV), Las Vegas, NV, USA, 19 October–13 November 2020; IEEE: Piscataway, NJ, USA, 2020; pp. 341–347. [Google Scholar]
  7. Schwarz, B. Mapping the world in 3D. Nat. Photonics 2010, 4, 429–430. [Google Scholar] [CrossRef]
  8. Simony, M.; Milzy, S.; Amendey, K.; Gross, H.M. Complex-yolo: An euler-region-proposal for real-time 3D object detection on point clouds. In Proceedings of the European Conference on Computer Vision (ECCV) Workshops, Munich, Germany, 8–14 September 2018; pp. 197–209. [Google Scholar]
  9. Bayomi, N.; Fernandez, J.E. Eyes in the Sky: Drones Applications in the Built Environment under Climate Change Challenges. Drones 2023, 7, 637. [Google Scholar] [CrossRef]
  10. Zhou, Y.; Tuzel, O. Voxelnet: End-to-end learning for point cloud based 3D object detection. In Proceedings of the IEEE Conference on Computer Vision and Pattern Recognition, Salt Lake City, UT, USA, 18–23 June 2018; pp. 4490–4499. [Google Scholar]
  11. Shi, S.; Wang, X.; Li, H. Pointrcnn: 3D object proposal generation and detection from point cloud. In Proceedings of the IEEE/CVF Conference on Computer Vision and Pattern Recognition, Long Beach, CA, USA, 15–20 June 2019; pp. 770–779. [Google Scholar]
  12. Qi, C.R.; Su, H.; Mo, K.; Guibas, L.J. Pointnet: Deep learning on point sets for 3D classification and segmentation. In Proceedings of the IEEE Conference on Computer Vision and Pattern Recognition, Honolulu, HI, USA, 21–26 July 2017; pp. 652–660. [Google Scholar]
  13. Yang, Z.; Sun, Y.; Liu, S.; Shen, X.; Jia, J. Std: Sparse-to-dense 3D object detector for point cloud. In Proceedings of the IEEE/CVF International Conference on Computer Vision, Seoul, Republic of Korea, 27 October–2 November 2019; pp. 1951–1960. [Google Scholar]
  14. Ku, J.; Mozifian, M.; Lee, J.; Harakeh, A.; Waslander, S.L. Joint 3D proposal generation and object detection from view aggregation. In Proceedings of the 2018 IEEE/RSJ International Conference on Intelligent Robots and Systems (IROS), Madrid, Spain, 1–5 October 2018; IEEE: Piscataway, NJ, USA, 2018; pp. 1–8. [Google Scholar]
  15. Liu, F.; Shan, J.; Xiong, B.; Fang, Z. A real-time and multi-sensor-based landing area recognition system for uavs. Drones 2022, 6, 118. [Google Scholar] [CrossRef]
  16. Chen, X.; Ma, H.; Wan, J.; Li, B.; Xia, T. Multi-view 3D object detection network for autonomous driving. In Proceedings of the IEEE Conference on Computer Vision and Pattern Recognition, Honolulu, HI, USA, 21–26 July 2017; pp. 1907–1915. [Google Scholar]
  17. Liang, M.; Yang, B.; Wang, S.; Urtasun, R. Deep continuous fusion for multi-sensor 3D object detection. In Proceedings of the European Conference on Computer Vision (ECCV), Munich, Germany, 8–14 September 2018; pp. 641–656. [Google Scholar]
  18. Wang, Z.; Zhan, W.; Tomizuka, M. Fusing bird’s eye view lidar point cloud and front view camera image for 3D object detection. In Proceedings of the 2018 IEEE Intelligent Vehicles Symposium (IV), Changshu, China, 26–30 June 2018; IEEE: Piscataway, NJ, USA, 2018; pp. 1–6. [Google Scholar]
  19. Qi, C.R.; Liu, W.; Wu, C.; Su, H.; Guibas, L.J. Frustum pointnets for 3D object detection from rgb-d data. In Proceedings of the IEEE Conference on Computer Vision and Pattern Recognition, Salt Lake City, UT, USA, 18–23 June 2018; pp. 918–927. [Google Scholar]
  20. Wang, Z.; Jia, K. Frustum convnet: Sliding frustums to aggregate local point-wise features for amodal 3D object detection. In Proceedings of the 2019 IEEE/RSJ International Conference on Intelligent Robots and Systems (IROS), Macau, China, 3–8 November 2019; IEEE: Piscataway, NJ, USA, 2019; pp. 1742–1749. [Google Scholar]
  21. Yang, Z.; Sun, Y.; Liu, S.; Shen, X.; Jia, J. Ipod: Intensive point-based object detector for point cloud. arXiv 2018, arXiv:1812.05276. [Google Scholar]
  22. Li, J.; Xu, R.; Liu, X.; Ma, J.; Chi, Z.; Ma, J.; Yu, H. Learning for Vehicle-to-Vehicle Cooperative Perception Under Lossy Communication. IEEE Trans. Intell. Veh. 2023, 8, 2650–2660. [Google Scholar] [CrossRef]
  23. Meng, Z.; Xia, X.; Xu, R.; Liu, W.; Ma, J. HYDRO-3D: Hybrid Object Detection and Tracking for Cooperative Perception Using 3D LiDAR. IEEE Trans. Intell. Veh. 2023, 8, 4069–4080. [Google Scholar] [CrossRef]
  24. Arnold, E.; Al-Jarrah, O.Y.; Dianati, M.; Fallah, S.; Oxtoby, D.; Mouzakitis, A. Cooperative object classification for driving applications. In Proceedings of the 2019 IEEE Intelligent Vehicles Symposium (IV), Paris, France, 9–12 June 2019; IEEE: Piscataway, NJ, USA, 2019; pp. 2484–2489. [Google Scholar]
  25. Chen, Q.; Tang, S.; Yang, Q.; Fu, S. Cooper: Cooperative perception for connected autonomous vehicles based on 3D point clouds. In Proceedings of the 2019 IEEE 39th International Conference on Distributed Computing Systems (ICDCS), Dallas, TX, USA, 7–10 July 2019; IEEE: Piscataway, NJ, USA, 2019; pp. 514–524. [Google Scholar]
  26. Correa, A.; Alms, R.; Gozalvez, J.; Sepulcre, M.; Rondinone, M.; Blokpoel, R.; Lücken, L.; Thandavarayan, G. Infrastructure support for cooperative maneuvers in connected and automated driving. In Proceedings of the 2019 IEEE Intelligent Vehicles Symposium (IV), Paris, France, 9–12 June 2019; IEEE: Piscataway, NJ, USA, 2019; pp. 20–25. [Google Scholar]
  27. Hobert, L.; Festag, A.; Llatser, I.; Altomare, L.; Visintainer, F.; Kovacs, A. Enhancements of V2X communication in support of cooperative autonomous driving. IEEE Commun. Mag. 2015, 53, 64–70. [Google Scholar] [CrossRef]
  28. Liu, C.; Chen, J.; Chen, Y.; Payton, R.; Riley, M.; Yang, S.H. Self-Supervised Adaptive Weighting for Cooperative Perception in V2V Communications. IEEE Trans. Intell. Veh. 2023, 9, 3569–3580. [Google Scholar] [CrossRef]
  29. Li, Z.; Liang, H.; Wang, H.; Zhao, M.; Wang, J.; Zheng, X. MKD-Cooper: Cooperative 3D Object Detection for Autonomous Driving via Multi-teacher Knowledge Distillation. IEEE Trans. Intell. Veh. 2023, 9, 1490–1500. [Google Scholar] [CrossRef]
  30. Song, R.; Xu, R.; Festag, A.; Ma, J.; Knoll, A. FedBEVT: Federated Learning Bird’s Eye View Perception Transformer in Road Traffic Systems. IEEE Trans. Intell. Veh. 2023, 9, 958–969. [Google Scholar] [CrossRef]
  31. Chang, C.; Zhang, J.; Zhang, K.; Zhong, W.; Peng, X.; Li, S.; Li, L. BEV-V2X: Cooperative Birds-Eye-View Fusion and Grid Occupancy Prediction via V2X-Based Data Sharing. IEEE Trans. Intell. Veh. 2023, 8, 4498–4514. [Google Scholar] [CrossRef]
  32. Li, Y.; Niu, J.; Ouyang, Z. Fusion strategy of multi-sensor based object detection for self-driving vehicles. In Proceedings of the 2020 International Wireless Communications and Mobile Computing (IWCMC), Limassol, Cyprus, 15–19 June 2020; IEEE: Piscataway, NJ, USA, 2020; pp. 1549–1554. [Google Scholar]
  33. Jisen, W. A study on target recognition algorithm based on 3D point cloud and feature fusion. In Proceedings of the 2021 IEEE 4th International Conference on Automation, Electronics and Electrical Engineering (AUTEEE), Shenyang, China, 19–21 November 2021; IEEE: Piscataway, NJ, USA, 2021; pp. 630–633. [Google Scholar]
  34. Zhu, Y.; Sapra, K.; Reda, F.A.; Shih, K.J.; Newsam, S.; Tao, A.; Catanzaro, B. Improving semantic segmentation via video propagation and label relaxation. In Proceedings of the IEEE/CVF Conference on Computer Vision and Pattern Recognition, Long Beach, CA, USA, 15–20 June 2019; pp. 8856–8865. [Google Scholar]
  35. Ballé, J.; Minnen, D.; Singh, S.; Hwang, S.J.; Johnston, N. Variational image compression with a scale hyperprior. arXiv 2018, arXiv:1802.01436. [Google Scholar]
  36. Goodfellow, I.; Warde-Farley, D.; Mirza, M.; Courville, A.; Bengio, Y. Maxout networks. In Proceedings of the International Conference on Machine Learning, Atlanta, GA, USA, 17–19 June 2013; PMLR: London, UK, 2013; pp. 1319–1327. [Google Scholar]
  37. Girshick, R. Fast r-cnn. In Proceedings of the IEEE International Conference on Computer Vision, Santiago, Chile, 7–13 December 2015; pp. 1440–1448. [Google Scholar]
  38. Ren, S.; He, K.; Girshick, R.; Sun, J. Faster r-cnn: Towards real-time object detection with region proposal networks. Adv. Neural Inf. Process. Syst. 2015, 28, 91–99. [Google Scholar] [CrossRef] [PubMed]
  39. Geiger, A.; Lenz, P.; Urtasun, R. Are we ready for autonomous driving? The kitti vision benchmark suite. In Proceedings of the 2012 IEEE Conference on Computer Vision and Pattern Recognition, Providence, RI, USA, 16–21 June 2012; IEEE: Piscataway, NJ, USA, 2012; pp. 3354–3361. [Google Scholar]
  40. Xu, R.; Xiang, H.; Xia, X.; Han, X.; Li, J.; Ma, J. Opv2v: An open benchmark dataset and fusion pipeline for perception with vehicle-to-vehicle communication. In Proceedings of the 2022 International Conference on Robotics and Automation (ICRA), Philadelphia, PA, USA, 23–27 May 2022; IEEE: Piscataway, NJ, USA, 2022; pp. 2583–2589. [Google Scholar]
Figure 1. The architecture of the proposed CooPercept model, comprising three major modules: a self-data processing module that transforms raw point clouds and images into compressible voxel features; a cross-CAV fusion module that combines and fuses the intermediate feature representations from various CAVs; and a final output network that creates and displays the results.
Drones 08 00228 g001
Figure 2. Maxout function for voxel feature fusion.
Drones 08 00228 g002
Figure 3. Cooperative detection of objects based on the KITTI dataset.
Drones 08 00228 g003
Figure 4. Visualizations of the bird’s-eye view point cloud from two scenes, with red denoting the ego vehicle and green the surrounding CAVs.
Drones 08 00228 g004
Figure 5. Robustness evaluation of performance under GPS reading drifting.
Drones 08 00228 g005
Figure 6. Robustness evaluation of performance under IMU reading drifting.
Drones 08 00228 g006
Figure 7. Comparison of time consumed and volume of data transmitted using different fusion approaches.
Drones 08 00228 g007
Figure 8. CooPercept qualitative detection performance in the straight lane scenario. The green vehicles are those that were appropriately spotted, the cars shown in red are those that were mistakenly detected, and the cars indicated in black are those that were not spotted by the CAVs.
Drones 08 00228 g008
Figure 9. CooPercept qualitative detection performance in the crossroad scenario.
Drones 08 00228 g009
Table 1. Precision comparison between CooPercept and benchmarks, showing the average precision in %.
ScenarioIOUF-PointNetF-ConvNetLiDAR FusionOutput FusionCooPercept-aCooPercept-bCooPercept
NearFarNearFarNearFarNearFarNearFarNearFarNearFar
Road Inter-sections0.572.2433.7374.4632.8781.2560.3472.5752.6678.4657.4676.8543.3380.5062.72
0.763.7524.6666.5328.7572.6453.5066.4644.7467.1950.9470.6435.4673.6756.28
Multi-lane Roads0.568.0640.1470.9737.1383.5462.4469.6055.3577.0755.8472.3240.3878.1568.73
0.760.2832.3663.8630.0277.7259.0660.4144.6569.5252.4865.1337.5276.1460.78
Rain0.550.0622.1451.9724.1362.5450.4452.6030.3554.0733.2159.6230.5066.3358.19
0.735.2816.3632.8617.0253.7737.0636.4127.6545.5230.1547.4822.2561.7050.12
Disclaimer/Publisher’s Note: The statements, opinions and data contained in all publications are solely those of the individual author(s) and contributor(s) and not of MDPI and/or the editor(s). MDPI and/or the editor(s) disclaim responsibility for any injury to people or property resulting from any ideas, methods, instructions or products referred to in the content.

