1. Introduction
The drone industry has experienced explosive development, which is addressing technical, regulatory, control, and safety issues. The market for drones and their applications is constantly growing; their use raises new questions and requires new approaches [
1,
2,
3,
4,
5,
6]. Their application creates new opportunities for industrial [
7,
8], agricultural [
9,
10,
11,
12,
13], wildlife detection [
14,
15,
16,
17], research [
18,
19,
20,
21], public service [
22,
23,
24,
25], and defense applications [
26,
27].
Today, the airport, which is one of the most complex infrastructures in aviation, is still strictly protected from drone flights. But it is clear that the potential of the technology will allow unmanned aerial vehicles (UAV) to use airports within a few years (SORA analysis in Luxemburg airport [
28,
29]: at Luxemburg Airport, a drone operation was carried out, and according to European Union regulation, it was a “specific” category operation. For a “specific” category operation, it is mandatory to carry out a safety assessment. Operators chose “Specific Operations Risk Assessment”, which is a risk analysis procedure). Furthermore, the appearance of various small-scale drones at airports use camera and remote sensing sensor data, mainly for safety and security purposes.
The ‘Integrated Model Airport’ (hereinafter IMA) research, which has been running since 2022 in the aviation departments of the University of Public Service ‘Ludovika’, focuses on exploring the possibilities of piloted and unmanned aircraft operating together at the airport. One of our objectives is to survey what procedures are taken in force, within what time slots, and for what tasks drones can be integrated into the daily traffic flow of the airport. The purpose of the cooperation between researchers of the Eötvös Loránd University and University of Public Service Ludovika is to gain experience in different use cases of drones carrying out airport tasks, to demonstrate their effect on daily operations, as well as to collect data through remote sensing and other in situ spatial information measurements.
The data and traffic of the IMA are based on existing conditions in LHSN (Szolnok, Hungary), which is primarily open to military traffic.
The airport traffic generally follows the rules known from international standards; however, a range of special regulations are in force, supervised by the military aviation authority (hereafter MAA). The airspace structure of the airport and the surrounding and neighboring airspaces are complex [
30,
31] and do not favor drone flights due to the closure of critical infrastructure, nature reserves, non-towered airfields, and a medical heliport. The airport almost grew together with the city and several residential areas are located nearby. A concept of operation (ConOps) was established by our team before the flight operation. In this so-called ConOps, several factors were taken into account such as Ground Risk and Air Risk. According to European [
32,
33] and national regulations [
34], the majority of the airport maneuvering area is protected by a no-drone zone [
31], which serves to keep civil drones away and save manned flights from interactions with UAVs and mid-air collisions. The planned operation looked impossible because most of the commercial drones are pre-programmed to avoid the aforementioned areas. Nevertheless, this dual regulatory environment (military/civil) may provide an extensive basis for drone operations at airports. According to our hypothesis, the gained experience in the organization and operation of drone flights will provide us with a comprehensive view and take into account administrative challenges and potential benefits.
The airport is also interesting in terms of its environmental location and has plenty of wildlife risk. To maintain bird control and reduce wildlife risk, it is essential to control rodent numbers, the first stage of which is a thorough survey and mapping. One of today’s emerging technologies is the evaluation of data from drone-based imagery for agricultural purposes, which in this case can be a useful tool for mapping rodent populations. This information can take wildlife control to a more professional level.
The various remote sensing sensors (e.g., spectral, thermal, photogrammetric, or LiDAR sensors) installed on today’s modern drones also provide the possibility to assess the condition of aprons, taxiways, and runways, to monitor cracks in solid surfaces. More international studies deal with the applicability of these sensors for surface diagnostics. Spectral, visible, and thermal imaging is suitable for examining surface deformation, disintegration, and cracking damage, as well as moisture-related analyses. The LiDAR sensor, in addition to the former, can also carry out subsidence and sinkhole damage tests [
35,
36,
37,
38]. One of the aims of our experiment is to set up a reference database to make preplanned maintenance work more effectively. According to our assumptions, there has been no such research carried out or any reference database created in Hungary before, especially at military airports.
The survey described above can also assist in the detection of Foreign Object Debris (FOD). FOD could be any item that is found at the airside of the airport and could cause damage to the aircraft and injury to personnel. Airside covers that area of the airport where aircraft can safely move and park. A range of different objects can be FOD regardless of material, such as debris, any contaminations, cans, abandoned tools, pieces of luggage, rocks, and even mortal remains of wildlife [
39].
The above-listed use cases serve safety purposes, but drones can be effective in the security chain of the airport. Drones’ ability to quickly change position enables them to inspect large areas in a relatively short time or to conduct rapid ad hoc searches over a defined area. Thanks to the various camera sensors mounted on drones, high-resolution live images are provided through data links day and night, and, with the usage of artificial intelligence, these images can greatly facilitate threat detection and ultimately reduce the need for human resources.
The most important questions of this research are whether it is worth using work drones at the airport, for what purpose, and with what sensors. Airports are “no-drone zones” for a reason, but it is worth examining where the boundaries can be drawn in the issue of aviation safety versus innovation. The use of drones for this purpose can even support flight safety because, depending on the season or time of the day, the properly selected sensors are more likely to find, e.g., foreign objects than the current process of using human resources and vehicles.
Our long-term goal is to develop a complex flight strategy (with the ideal flight altitude and fastest, most energy-saving flight path), which can be used for airport security on a daily basis. The first step—which this manuscript is also about—was to select the most useful sensor(s) for certain assigned tasks. In this case, FOD and small mammal detection in any season with the expected accuracy.
2. Materials and Methods
2.1. Study Area
The location was the LHSN airport in Szolnok, Hungary (
Figure 1). The total surveyed area (Aerodrome Reference Point (ARP) coordinates: Lat = N 47°07′22″, Lon = E 20°14′08″) was 17.835 ha. The field study was carried out on 8–10 December 2023. As mentioned previously, the airport is mainly used by numerous helicopters and small aircraft on a daily basis. Although aircraft accommodated at the airport are mainly small sized, e.g., two-seater trainer aircraft (ZLIN142) and helicopters (H145, H225), the traffic peaks close to medium-sized airports on weekdays [
40,
41,
42]. This is because the airport serves a number of flight missions and training tasks. Moreover, it is the home base of the search and rescue service, which is why an experimental real drone flight can only be carried out during a non-flying weekend.
The location of the airport and its environment accompanies a range of wildlife risks. At the northern part of the airport, there is a pond, named Holt-Tisza, which has a large-scale water surface with a significant waterfowl population, affecting the approach path and climbing areas of the runway. At the eastern part of the airport, a neighboring farmland is located and serves as a feeding chamber for rodents. Because of significant rodent presence, many uphill warehouses had increased rodent populations, and hollows were dug under the surface of the movement area. The spread of the rodent population attracts birds of prey. In order to control the numbers of birds and reduce wildlife risk, it is necessary to determine rodent-polluted areas through mapping and a drone-observed survey. Ranges of emerging technologies support the evaluation of data, drone-based imagery for agricultural purposes, in this case for mapping the rodent population. This information can take bird control to a more professional level.
2.2. Used Equipment
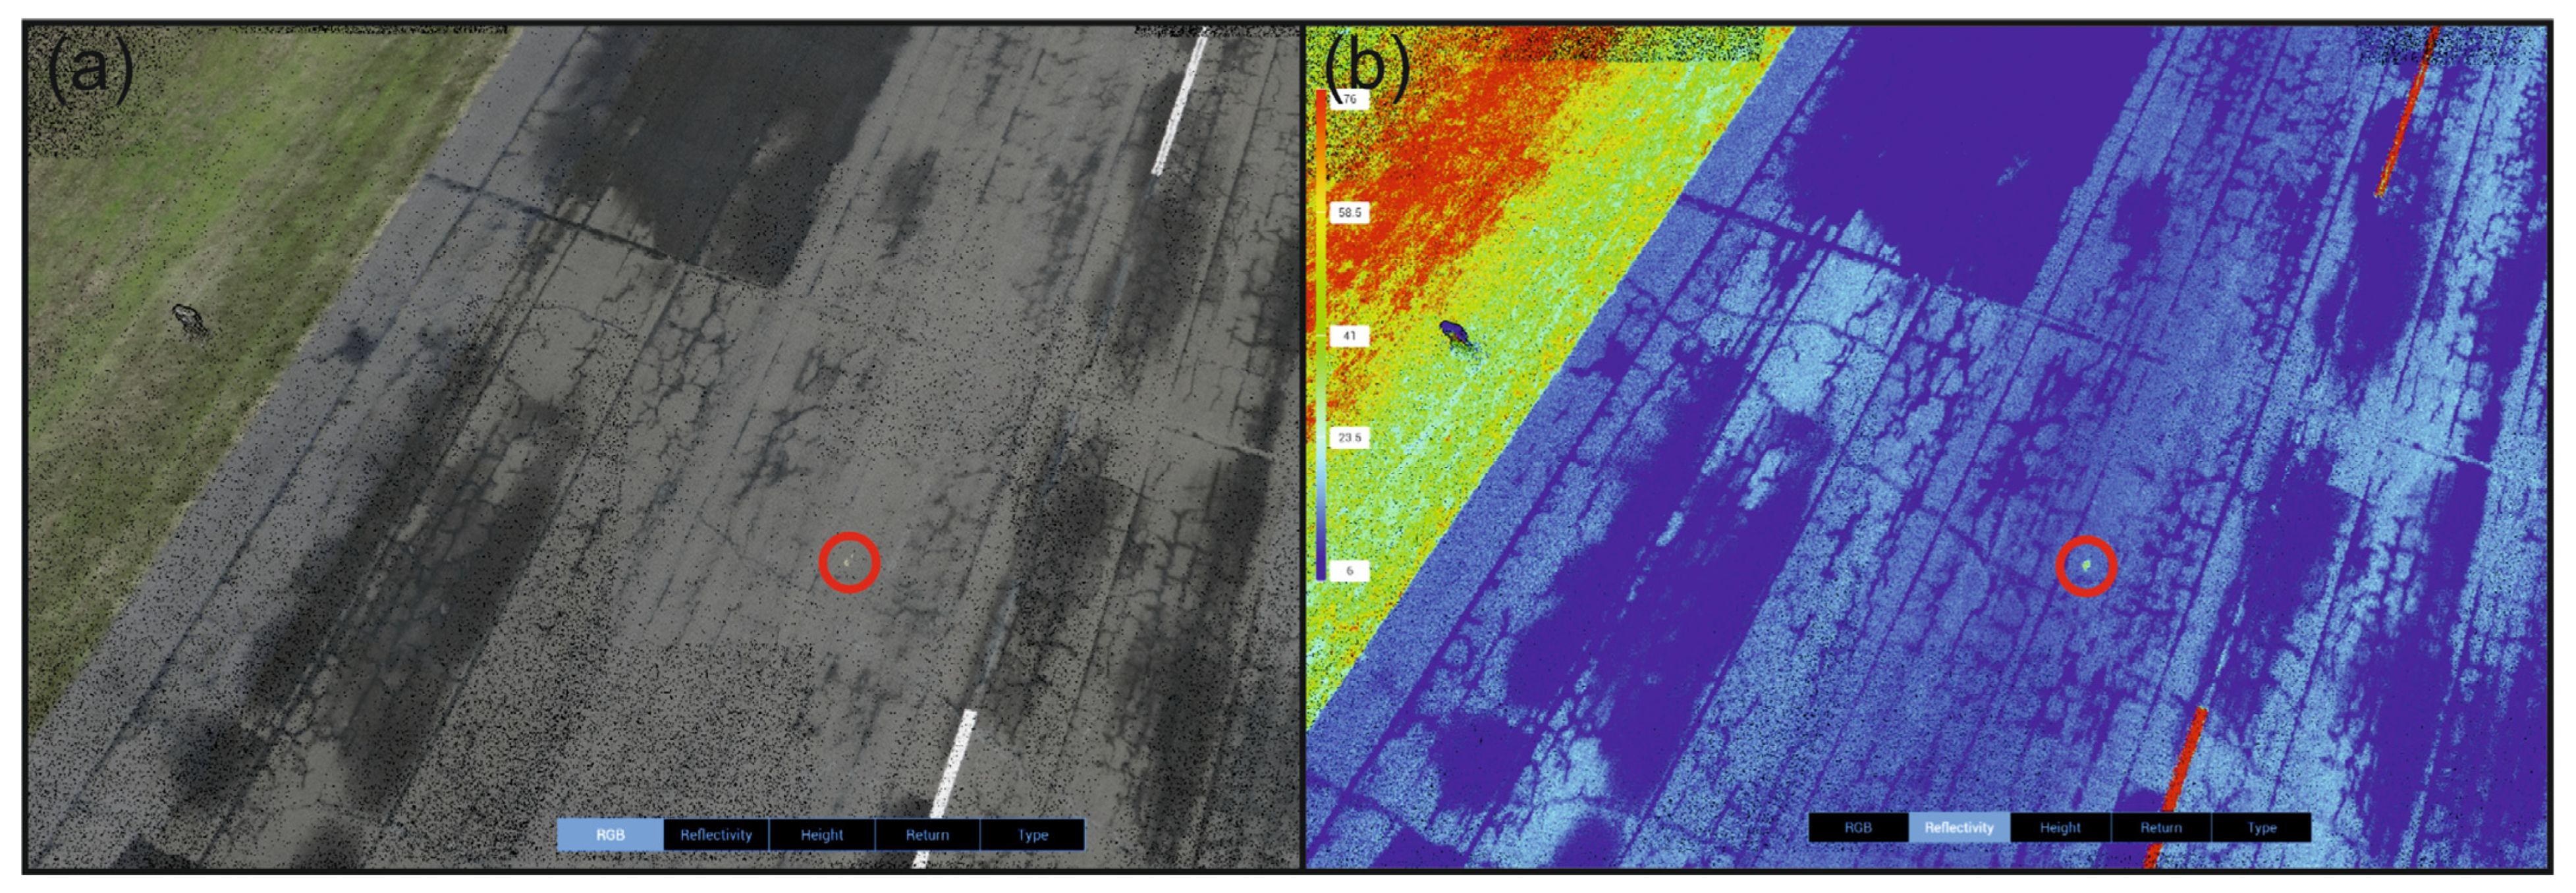
The field study was carried out with a DJI Matrice 350 RTK drone (due to its comparatively greater mass it can be used to lift a wide variety of sensors, which was cardinal from the point of view of the research) equipped with a Zenmuse P1 RGB camera, a Zenmuse L1 LiDAR sensor, and a Zenmuse H20T thermal camera. The almost same examined area was recorded separately with all three sensors (
Figure 2).
The DJI Matrice 350 RTK drone has a quadcopter design, which can reach a flight duration of up to 55 min, and it can also carry a maximum of 2.7 kg of extra weight. Thanks to the intelligent battery charging system of the new generation BS65, it speeds up the recharging of the batteries [
43]. The RTK GPS (Real-Time Kinematic) provides real-time three-dimensional positioning results of the station in the specified coordinate system and can achieve centimeter-level accuracy. During the survey, 3 pairs of batteries (6 pieces in total) were prepared, which were continuously recharged during the day.
The Zenmuse L1 LiDAR sensor is a dual camera, with a maximum of three signal return-supported LiDAR sensors and a high-resolution RGB camera [
44]. The LiDAR sensor’s ranging accuracy arrives at 3 cm from 100 m height/altitude. Its point rate arrives at the max. 240,000 pts/s (single mode) or the max. 480,000 pts/s (multiple return mode). Its detection range should arrive at 450 m. In scanning mode, it supports the repetitive and the non-repetitive mode too. For point cloud coloring, the reflectivity, height, distance, or RGB values can be selected as basic parameters. The highest accuracy is achieved in suitable light conditions and near-optimal flight speed. The standard file formats for LiDAR point clouds are
.las or
.laz. However, the DJI Zenmuse L1 uses a closed data format, so for data processing the DJI Terra software (V4.0.10) was needed to prepare or convert the results into a
.las point cloud. The software also enables some measurements and the creation of specific models (e.g., DSM), but it cannot perform the classification of the point cloud.
Zenmuse H20T dual thermal camera has a built-in high-resolution 20 MP RGB camera [
45]. The thermal camera arrives at 640 × 512 px resolution, its digital zoom can max 8x. Thanks to the dual camera, the resolution of the thermal data can be improved with the help of the high-resolution RGB image, with the so-called pansharpening interpolation procedure. The spectral sensibility of the thermal camera based on the microbolometer principle is in the 8–14 μm spectral range. An 85% image overlap is recommended during recording/capturing. Its image format is 16-bit
.R-JPG (radiometric JPG) or
.T-JPG (thermal JPG).
DJI Zenmuse P1 is a 45 MP high-resolution, full-frame RGB camera, designed for photogrammetry flight missions [
46]. Without any GCP points its accuracy can reach 3 cm horizontally and 5 cm vertically, if we take care when capturing to fix the 75% front and 55% side overlap rate. Its pixel size is 4.4 µm and it can take a photo every 0.7 s. Its photo size is 8192 × 5460 px resolution. The flight speed should be chosen according to the application scenario, as it may affect the quality. Regarding mission mode, a 2D orthomosaic mission, 3D oblique mission, detailed modeling mission, or real-time mapping mission can be chosen.
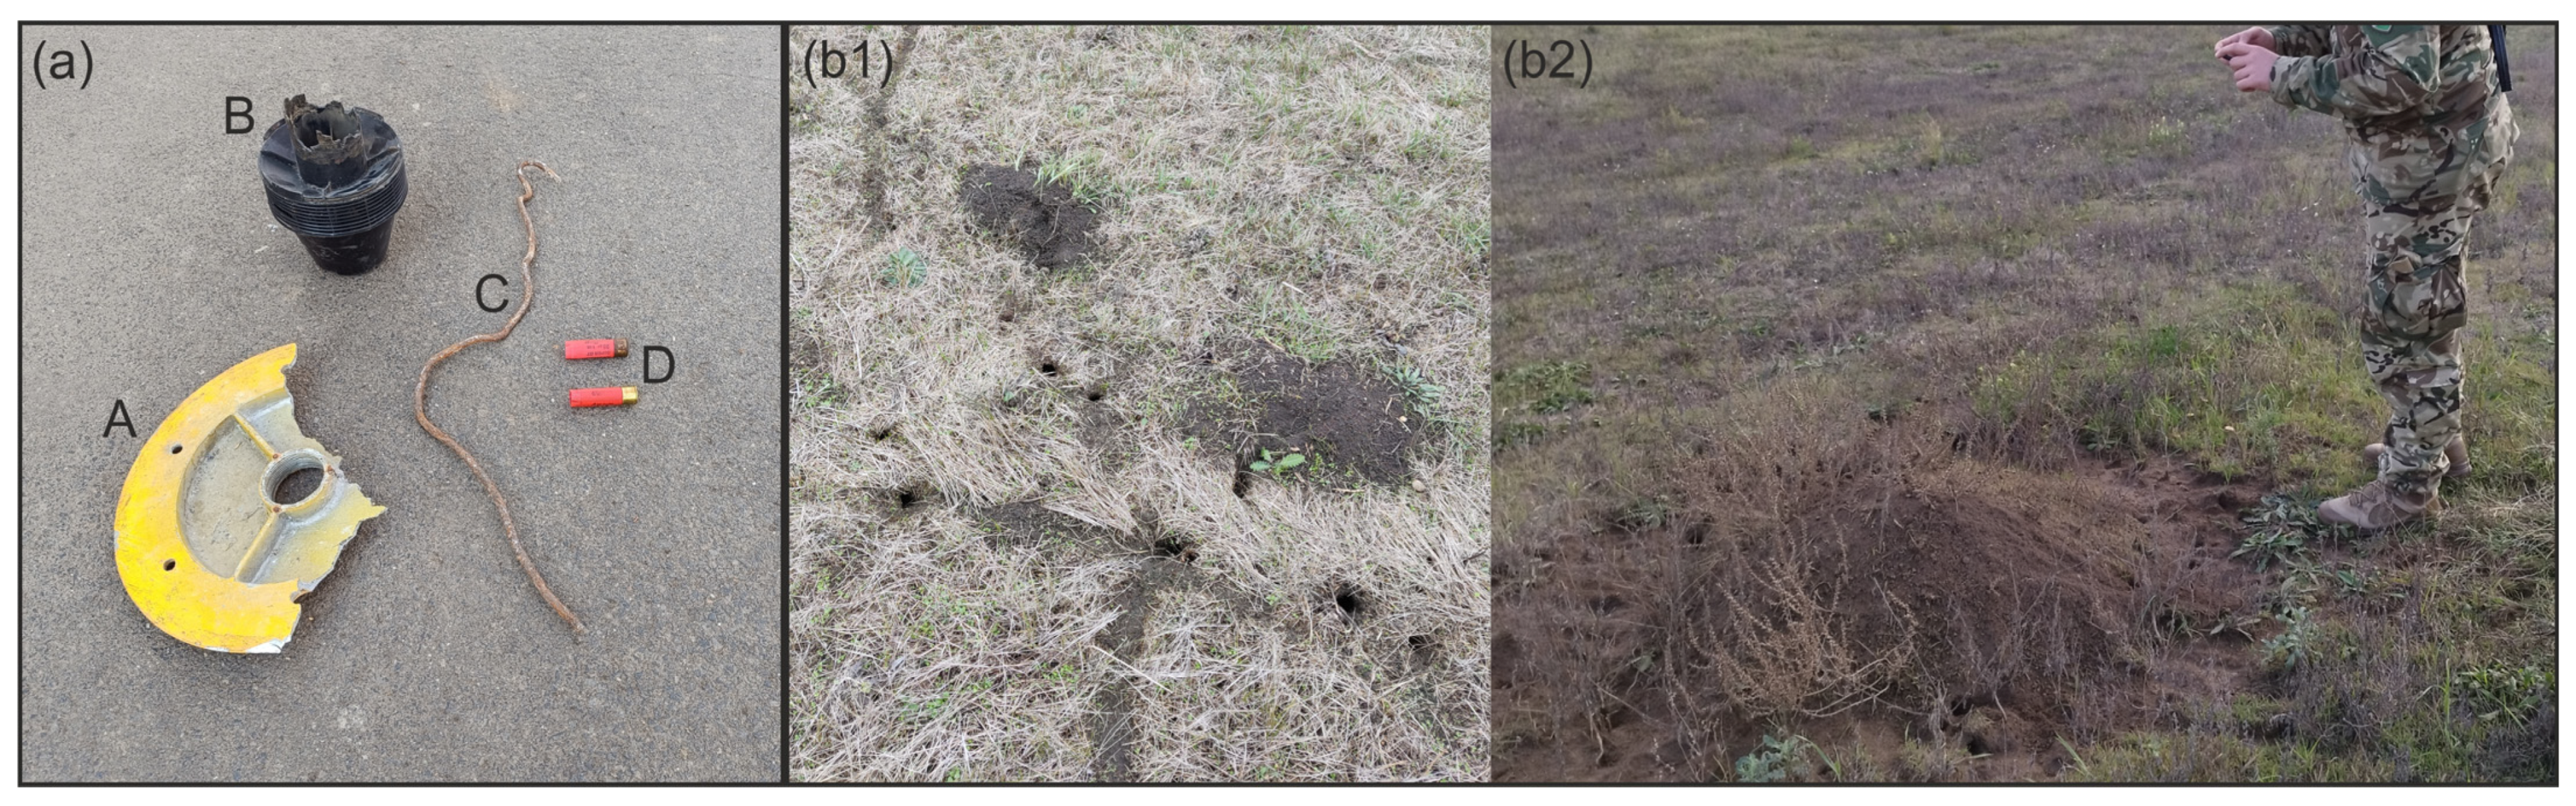
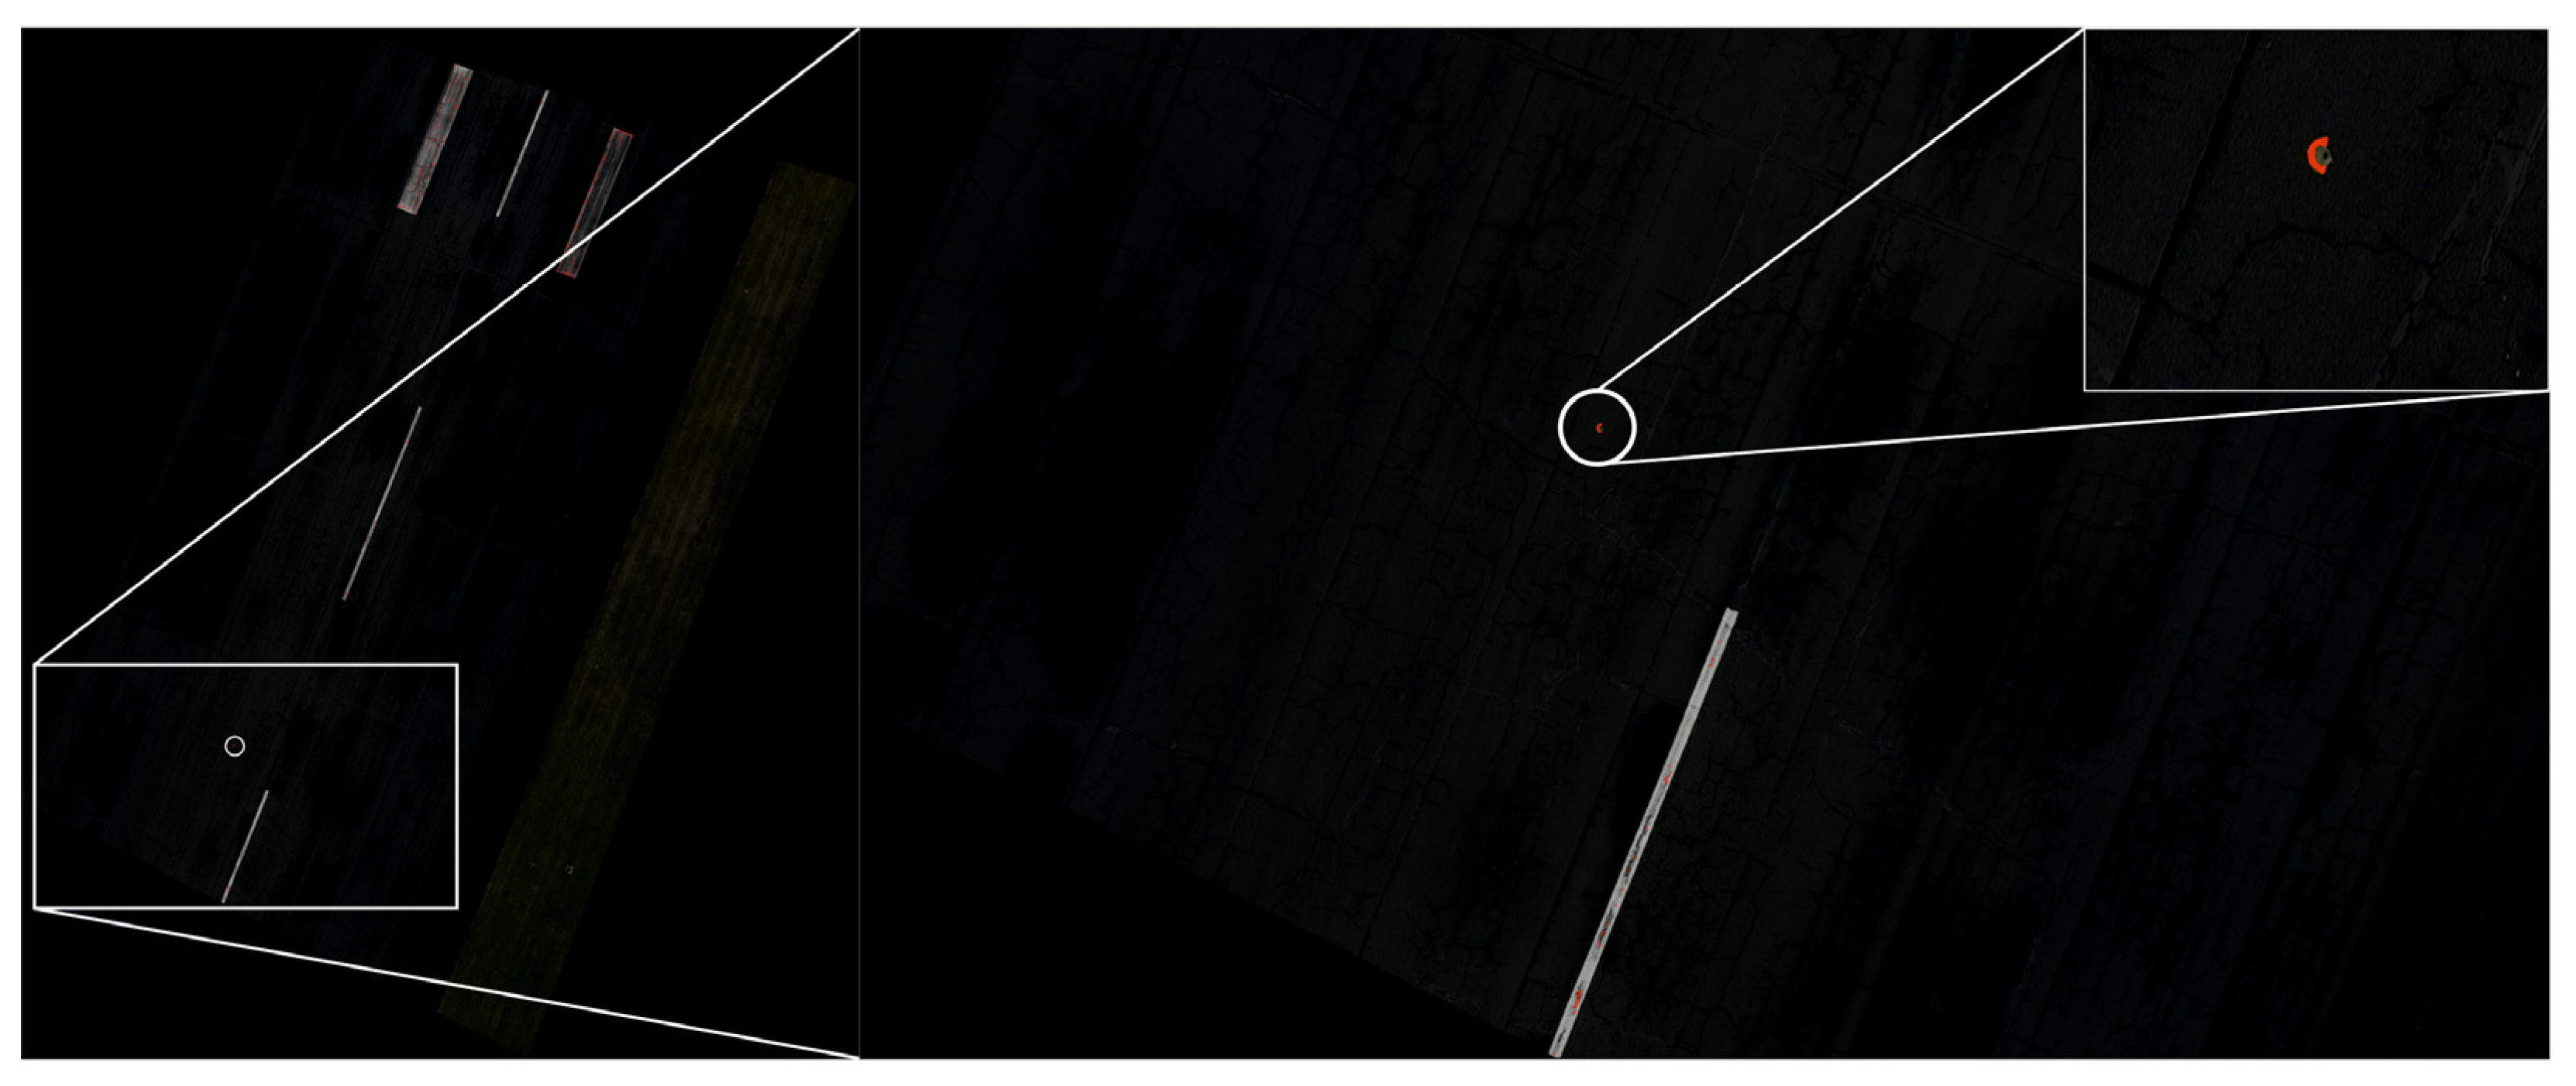
For FOD detection, four objects were put on the runway (
Figure 3a), and next to the runway, there are plenty of field-vole holes (bigger hill in b2, smaller with holes and routes in b1). When choosing the flight area, the following aspects were taken into account: the bases were the selected FOD and the sensitive areas of the runway, such as the “touch-down zones”, the vicinity of the most frequently used taxiways, and the areas where the decision speed is reached.
During the FOD selection process, the following criteria were considered: they were made from various materials (A (side light lamp subframe), C (wire) metal or metallic alloy, B (tractor engine air filter) plastic, D (shotgun cartridge case) mixed), their shapes varied (whereas A, B, D can be considered regular, enclosed bodies, C is irregular, with a thin linear form), and in terms of color, two differed from the surface (A—yellowish, D—red) while two were of similar shade to the surface (C—light gray, B—dark gray). The sizes of the FOD can be seen in
Table 1:
Due to the weather conditions, the first measurement was carried out with the LiDAR sensor in an effort to improve lighting conditions. The study area was recorded with two battery replacements (DJI TB65 Lithium-ion battery: 5880 mAh/piece; they must be used in pairs for one flight and they can be replaced one at a time so the running program is not interrupted, nor does the sensor require recalibration). The flight was performed with the Ground Sampling Distance (GSD) value set, so the flight altitude and speed were calculated by the system at an altitude of 30 m. The resulting image reached a resolution of under 1 cm, which was necessary to meet research purposes.
The second flight was carried out equipped with the H20T thermal sensor. Targeting the same GSD value, the system calculated a flight height of 50 m. In addition, due to the 85% image overlap, the duration would have been more than 10 h. Because of this, we overrode the flight parameter and flew at a height of 50 m with two battery replacements, thus reaching GSD ~5 cm.
The third flight was carried out equipped with the P1 sensor. Targeting the same GSD value, the system calculated a flight height of 50 m, with a 5.1 ms−1 flight speed.
The main characteristics of the data captured by the three sensor systems can be seen in
Table 2.
2.3. Legal Background
As the examined area is in Hungary, it is necessary to give some overview of the actual legal background of drone operations.
For a legal flight of drones before takeoff, it is necessary to register (1) the drone, and (2) the pilot (operator). After the registration, the authority gives an ID that must be placed on the drone in a visible part. The operator must have insurance and a valid EASA pilot license (see details in [
47,
48]). After having the above-mentioned documents, the “pre-flight” preparations can be started: in every case, to use controlled airspace, permission is needed. It is namely an ad hoc segregated area. It can be booked for 7 days, a minimum of 30 days before the planned flight. If the airspace is somehow special (e.g., nature reserve, around heliports/airports), this administration period can take more time. Before starting the specific flight, the use of a mobile application MyDroneSpace is mandatory as the experimental flight remained in a visual line-of-sight area that does not exceed ‘open’ category criteria according to Hungarian and European Union regulations.
Beyond these general necessities, in our case, other special permissions were needed from the military (MAA). Due to the planned drone flight taking place over the maneuvering area of LHSN, an ad hoc segregated area had to be designed. First, the coordinates of the designed ad hoc segregated area in Google Earth were marked and the area size was optimized in order to reduce the number of contributed agencies to the mandatory minimum. The shape of the planned ad hoc segregated area was a trapezoid, covering the runway length and related areas. Its height ranged from the ground level up to 800 feet. A total of 30 days before the planned drone flight, it is necessary to apply for airspace designation to the MAA through the national electronic client gateway [
34]. A form-filling application supports the applicant step-by-step in completing and entering the necessary information and offers to attach additional files. At the time of our application, the relevant legislation required to submitted the airport operator’s contribution, a risk assessment that contained the hazards, the risk determination by a barrier model, the safety objectives, and the risk mitigation methods. Finally, the proof of the payment of the procedural fee was also attached. The decision of the MAA about the designated ad hoc segregated area was received in a week. It contained contacts and procedures for airspace activation and cancelation. However, the decision of the MAA was not enough to engage in flight operation, because the “no-fly zone” geo awareness criteria denied the drone’s engine start. The only solution was to send a request to the manufacturer to lift the ban for the period of flight with a copy of the formal decision of the MAA. After receiving a positive reply from the manufacturer, it is possible to mark the planned area in the mission planner of the drone [
32].
The DJI system has built-in limitations where the software itself prohibits the flights in restricted areas, e.g., “no-flight zones” like airports. To unlock this, the above-mentioned flight permission has to be sent to the DJI office—they remotely unlock the requested territory through the drone controller software.
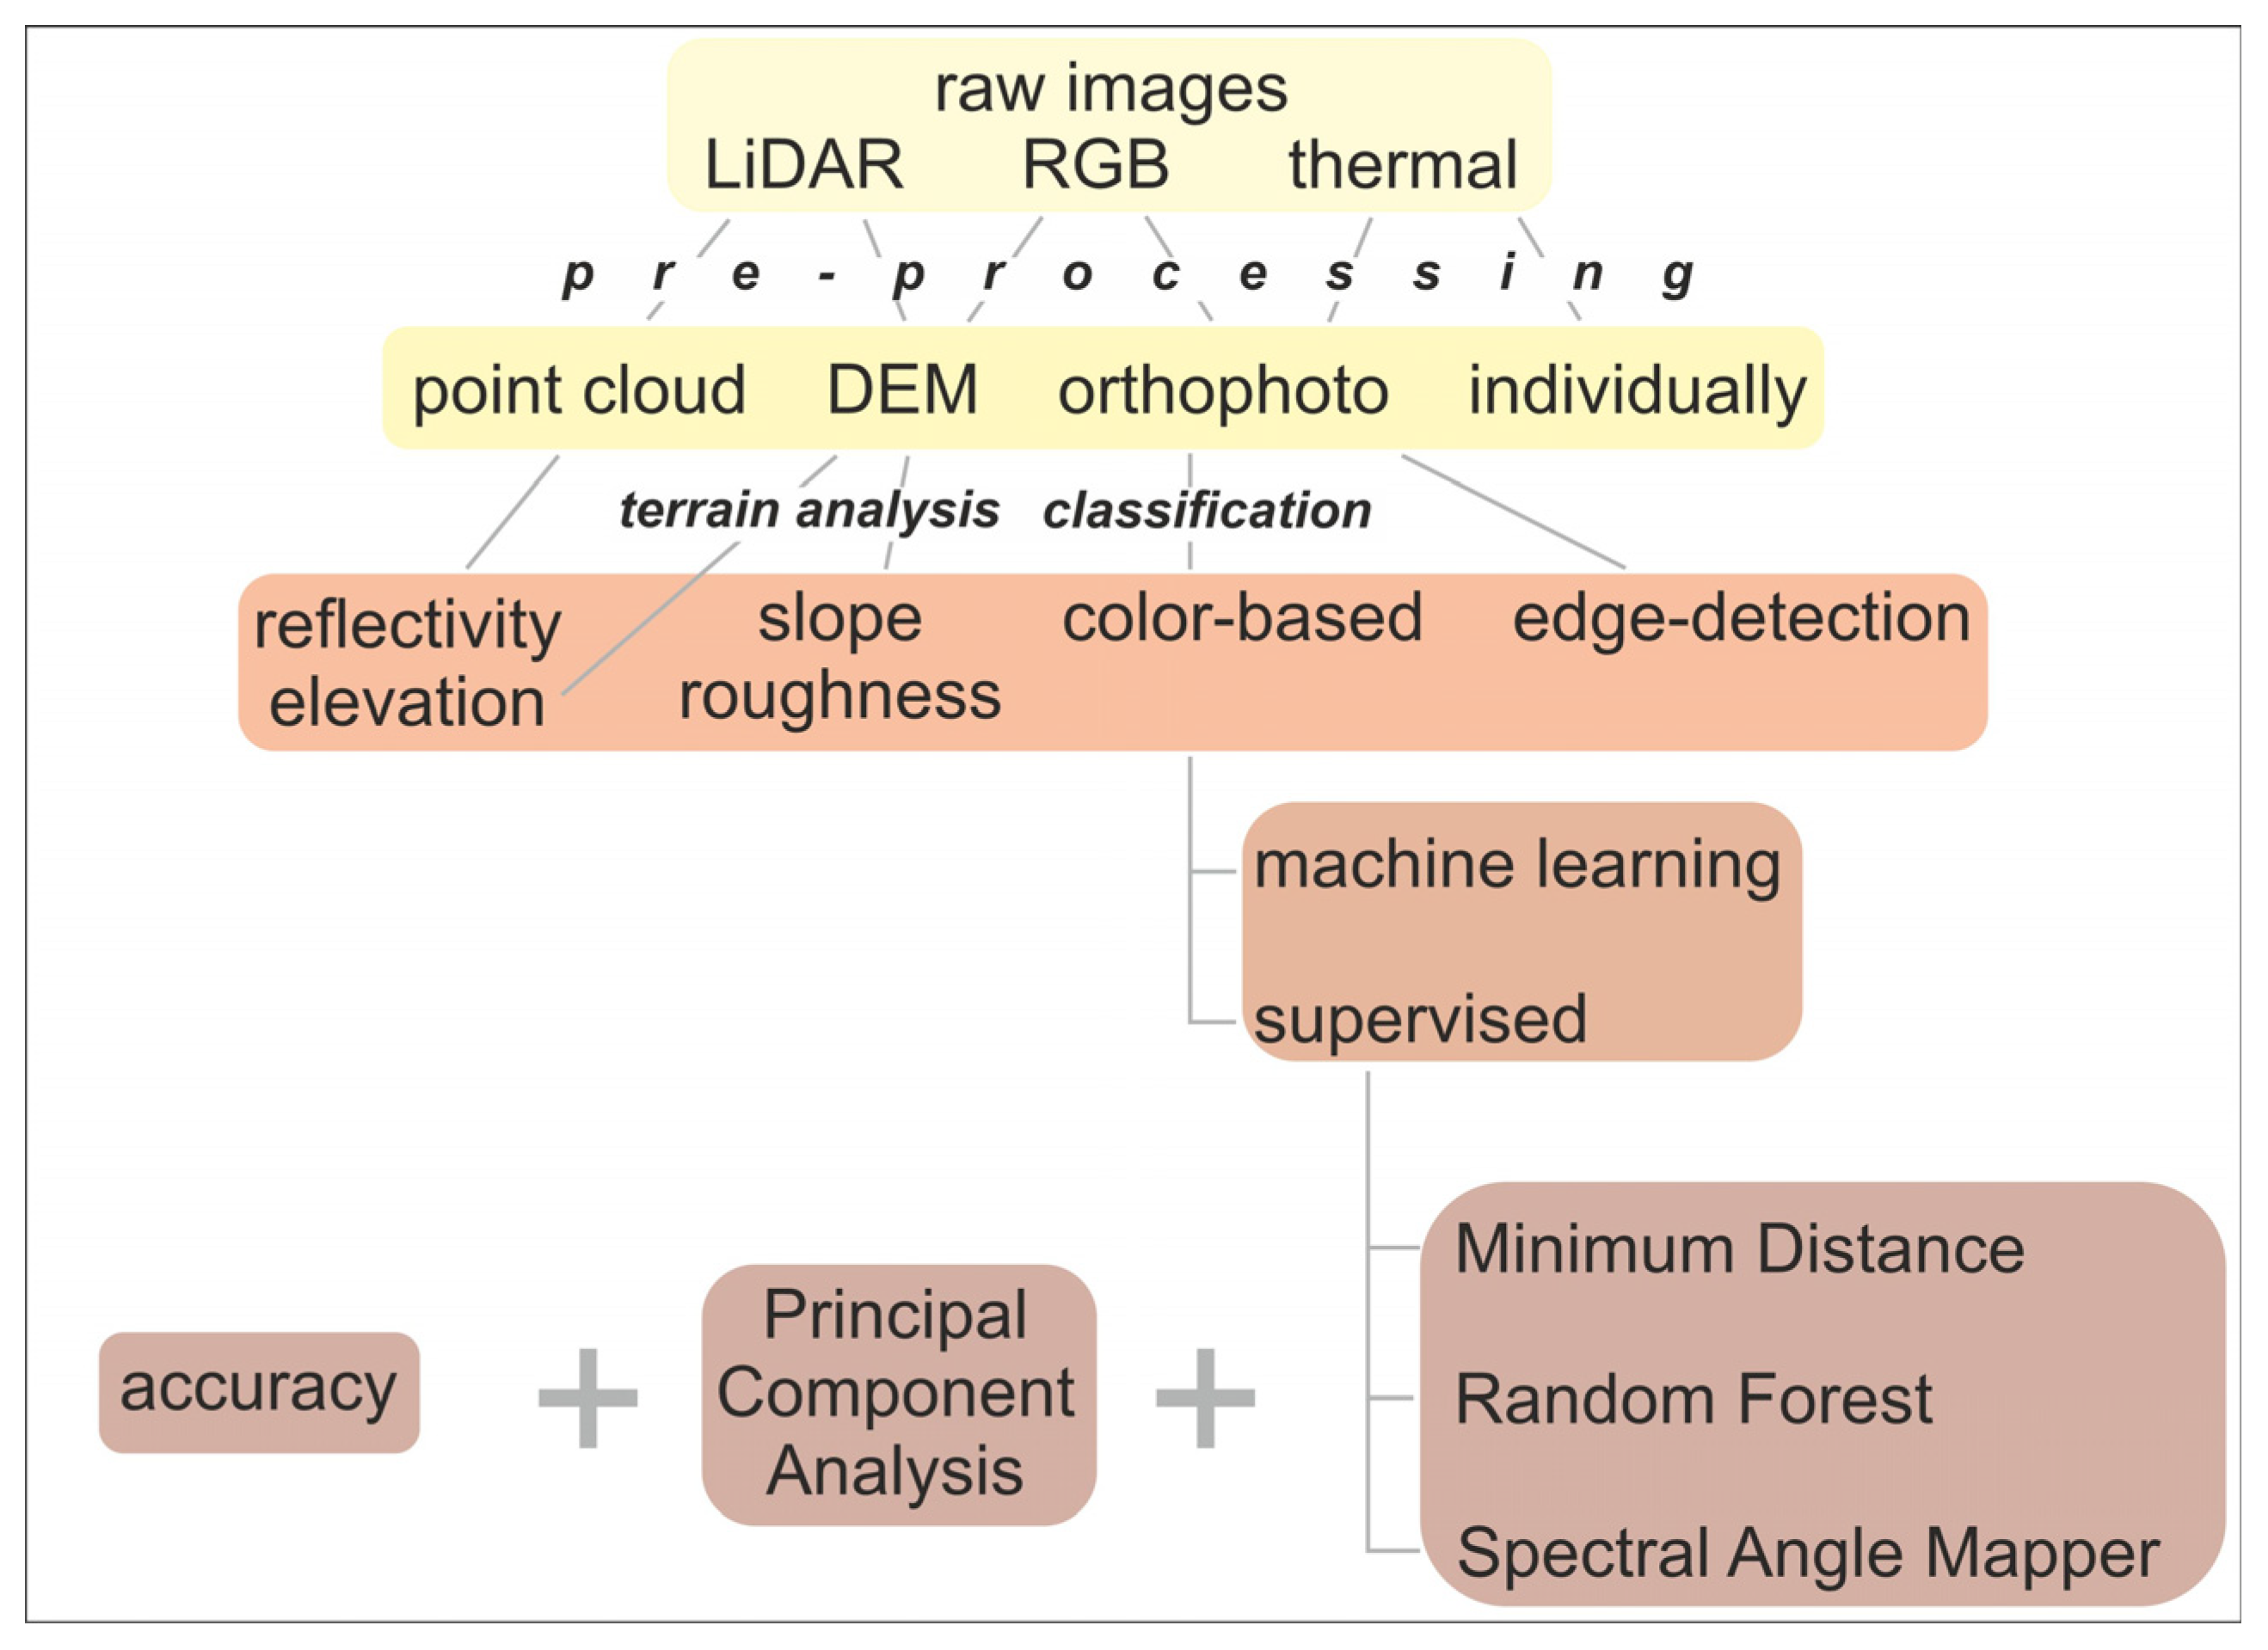
2.4. Data Processing Workflow
The acquired UAV P1 RGB images and the H20T thermal images were orthorectified using DJI Terra software, Prilly, Switzerland [
49]. The DSM models were generated from the RGB images.
The LiDAR point cloud was converted to
.las data format with the DJI Terra software. After that, the point cloud was analyzed with LASTools (Rapidlasso Gmbh, Germany [
50]) integrated into QGIS. The metadata collection was performed with the ‘lasinfo’ algorithm, and the resulting point cloud contained nearly 436 million points. The point cloud was analyzed using the ‘
lasground’, ‘
lasheight’, and ‘
lasclassify’ algorithms, and DEM models were also generated. On the DSM models, for terrain analysis, GDAL algorithms [
51] were used in QGIS, and slope, TRI, and roughness layers were generated.
For the purpose of FOD investigation and for more accurate analysis, data from the images using EXIFTOOL (developed by Phil Harvey [
52]) were extracted and applied as vector layers for the purpose of overlapping spatial elements. After identifying the FOD elements, it was also created as vector data layers to assist in verifying the differing sensor results.
For the identification of field-vole holes and to compare methodologies, as they affected scattered areas, target areas were specified. The field-vole holes and the thermal images overlapping the target FOD were separately analyzed using FlirTools and DJI Thermal Analysis software [
53].
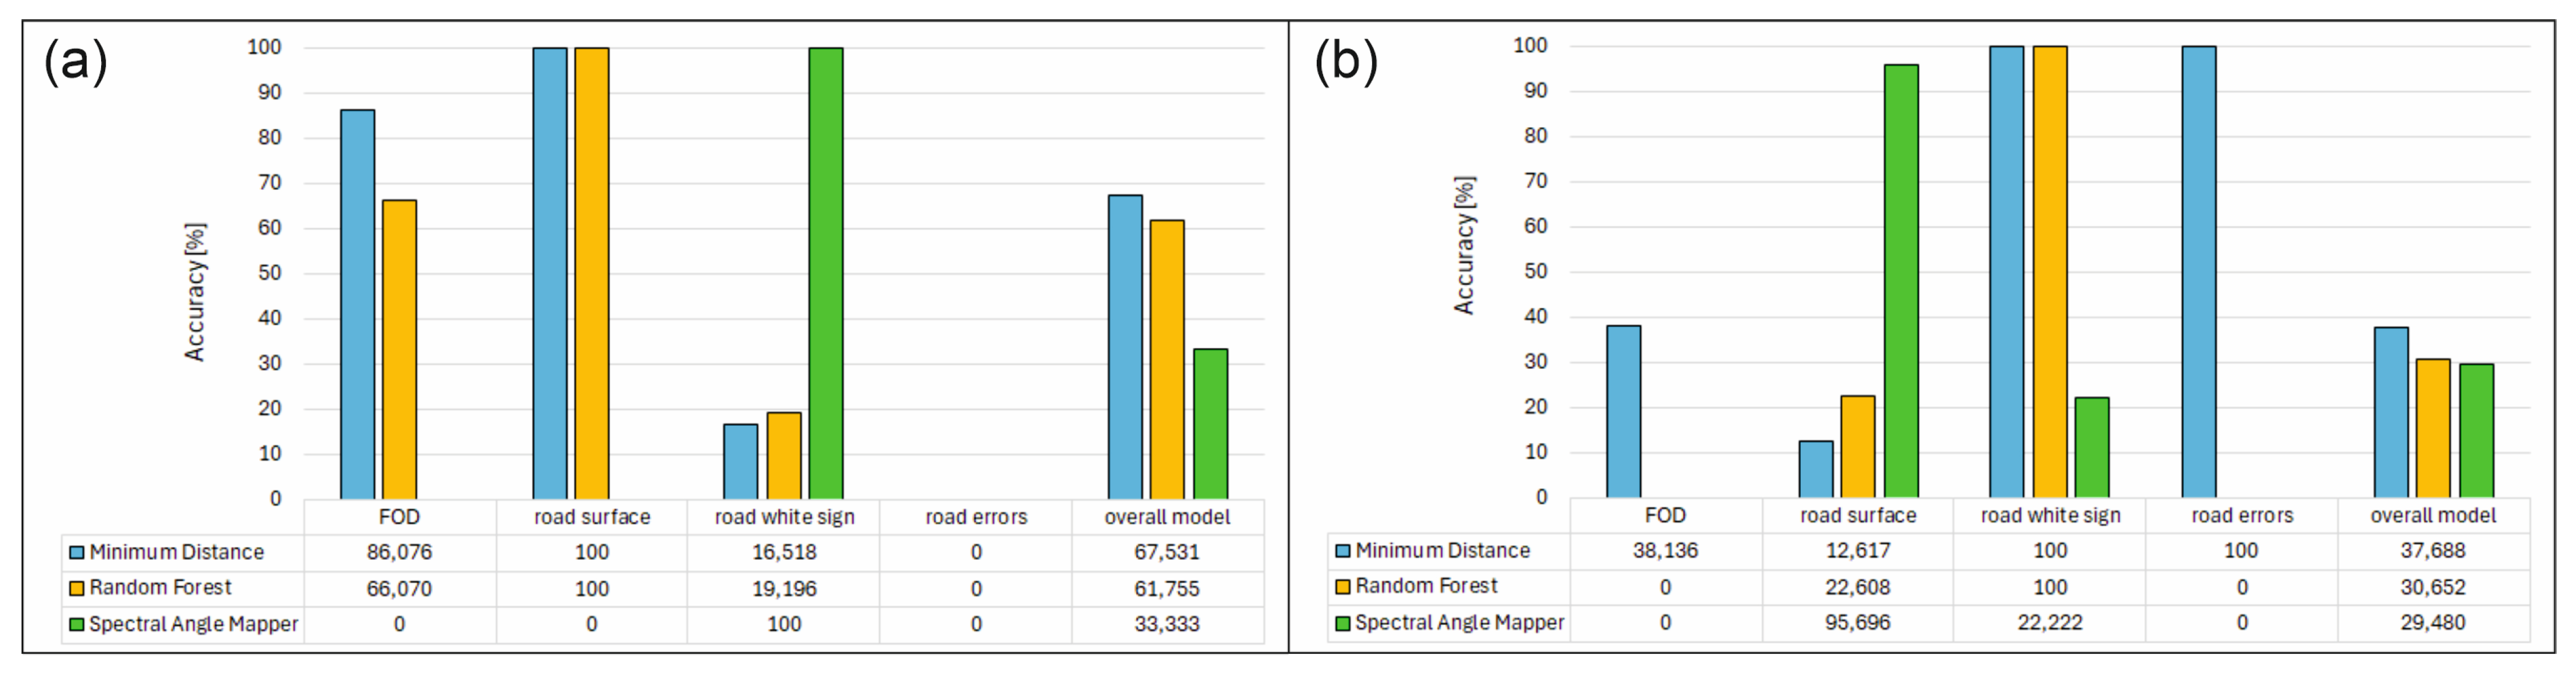
For the FOD test, different color searches were run on the orthomosaics, focusing primarily on the colors corresponding to the unique color composition of FOD A and FOD D. It was approached in two ways. In one case, a vector point layer was first created from the pixels of the bodies, then the band values of the overlapping raster pixels of both FOD were collected using the QGIS-‘Sample raster values’ algorithm. The procedure was performed based on both the RGB and LiDAR orthomosaics, and then the average, minimum, and maximum values characteristic of the bodies were determined for both cases. Based on the results of this color composition, a selection rule system was constructed and run on both orthomosaics using the Raster calculator.
In another case, the ROI polygons according to the bodies were trained using the QGIS SCP plugin [
54], and the image classification was run with the Minimum Distance, Spectral Angle Mapping, and Random Forest algorithm. The Minimum Distance (MD) classification calculates the Euclidean distance
d(
x,
y) between spectral signatures of image pixels and training spectral signatures, according to the following equation:
where
x is the first spectral signature vector,
y is the second spectral signature vector, and
n is the number of image bands. The SAM algorithms can be written as Equation (2):
where
x is the spectral signature vector of an image pixel,
y is the spectral signature vector of a training area, and
n shows the number of image bands. The Random Forest was based on decision trees and used the Gini index (Equation (3)) as the background of the calculations.
where
is the fraction of items labeled with class
i in the set. We created a confidence raster too where we can see the classification errors if pixels have low confidence values. After running the above classifications, the accuracy against the reference cover was assessed.
The created reference cover examined the results of PCA analysis, as in this case we were also working with a larger amount of data due to the spatial resolution. Principal Component Analysis (PCA) is a method for reducing the dimensions of measured variables (bands) to the principal components. The principal component transformation provides a new set of bands (principal components) having the following characteristic: principal components are uncorrelated and each component has a variance less than the previous component. The first principal components layers were first reclassified according to the classes used during training, and then used as the reference layer for accuracy assessment. The accuracy assessment is performed with the calculation of an error matrix. The error matrix can be evaluated from various perspectives. On one hand, it can gather data on how accurately a classification algorithm identifies the reference classes. On the other hand, it can examine how much the algorithm misclassifies. For FOD recognition, data were collected corresponding to the first perspective, and then graphically represented to assess which algorithm better facilitates FOD recognition.
Another way to find the FOD in the orthomosaic was edge detection. It is an image-processing technique that is used to identify the boundaries of objects. In a Python environment, OpenCV [
55] was used with the following important steps: The first step is to convert the original image into grayscale. The next step is to apply thresholding to convert this grayscale image to a binary file. In this step, it is important to choose the threshold and maximum value and the thresholding type, which can be, e.g., binary, binary_inv, trunc, tozero, otsu, or triangle. The last step is to find the contours.
The processing chain is summarized in
Figure 4.
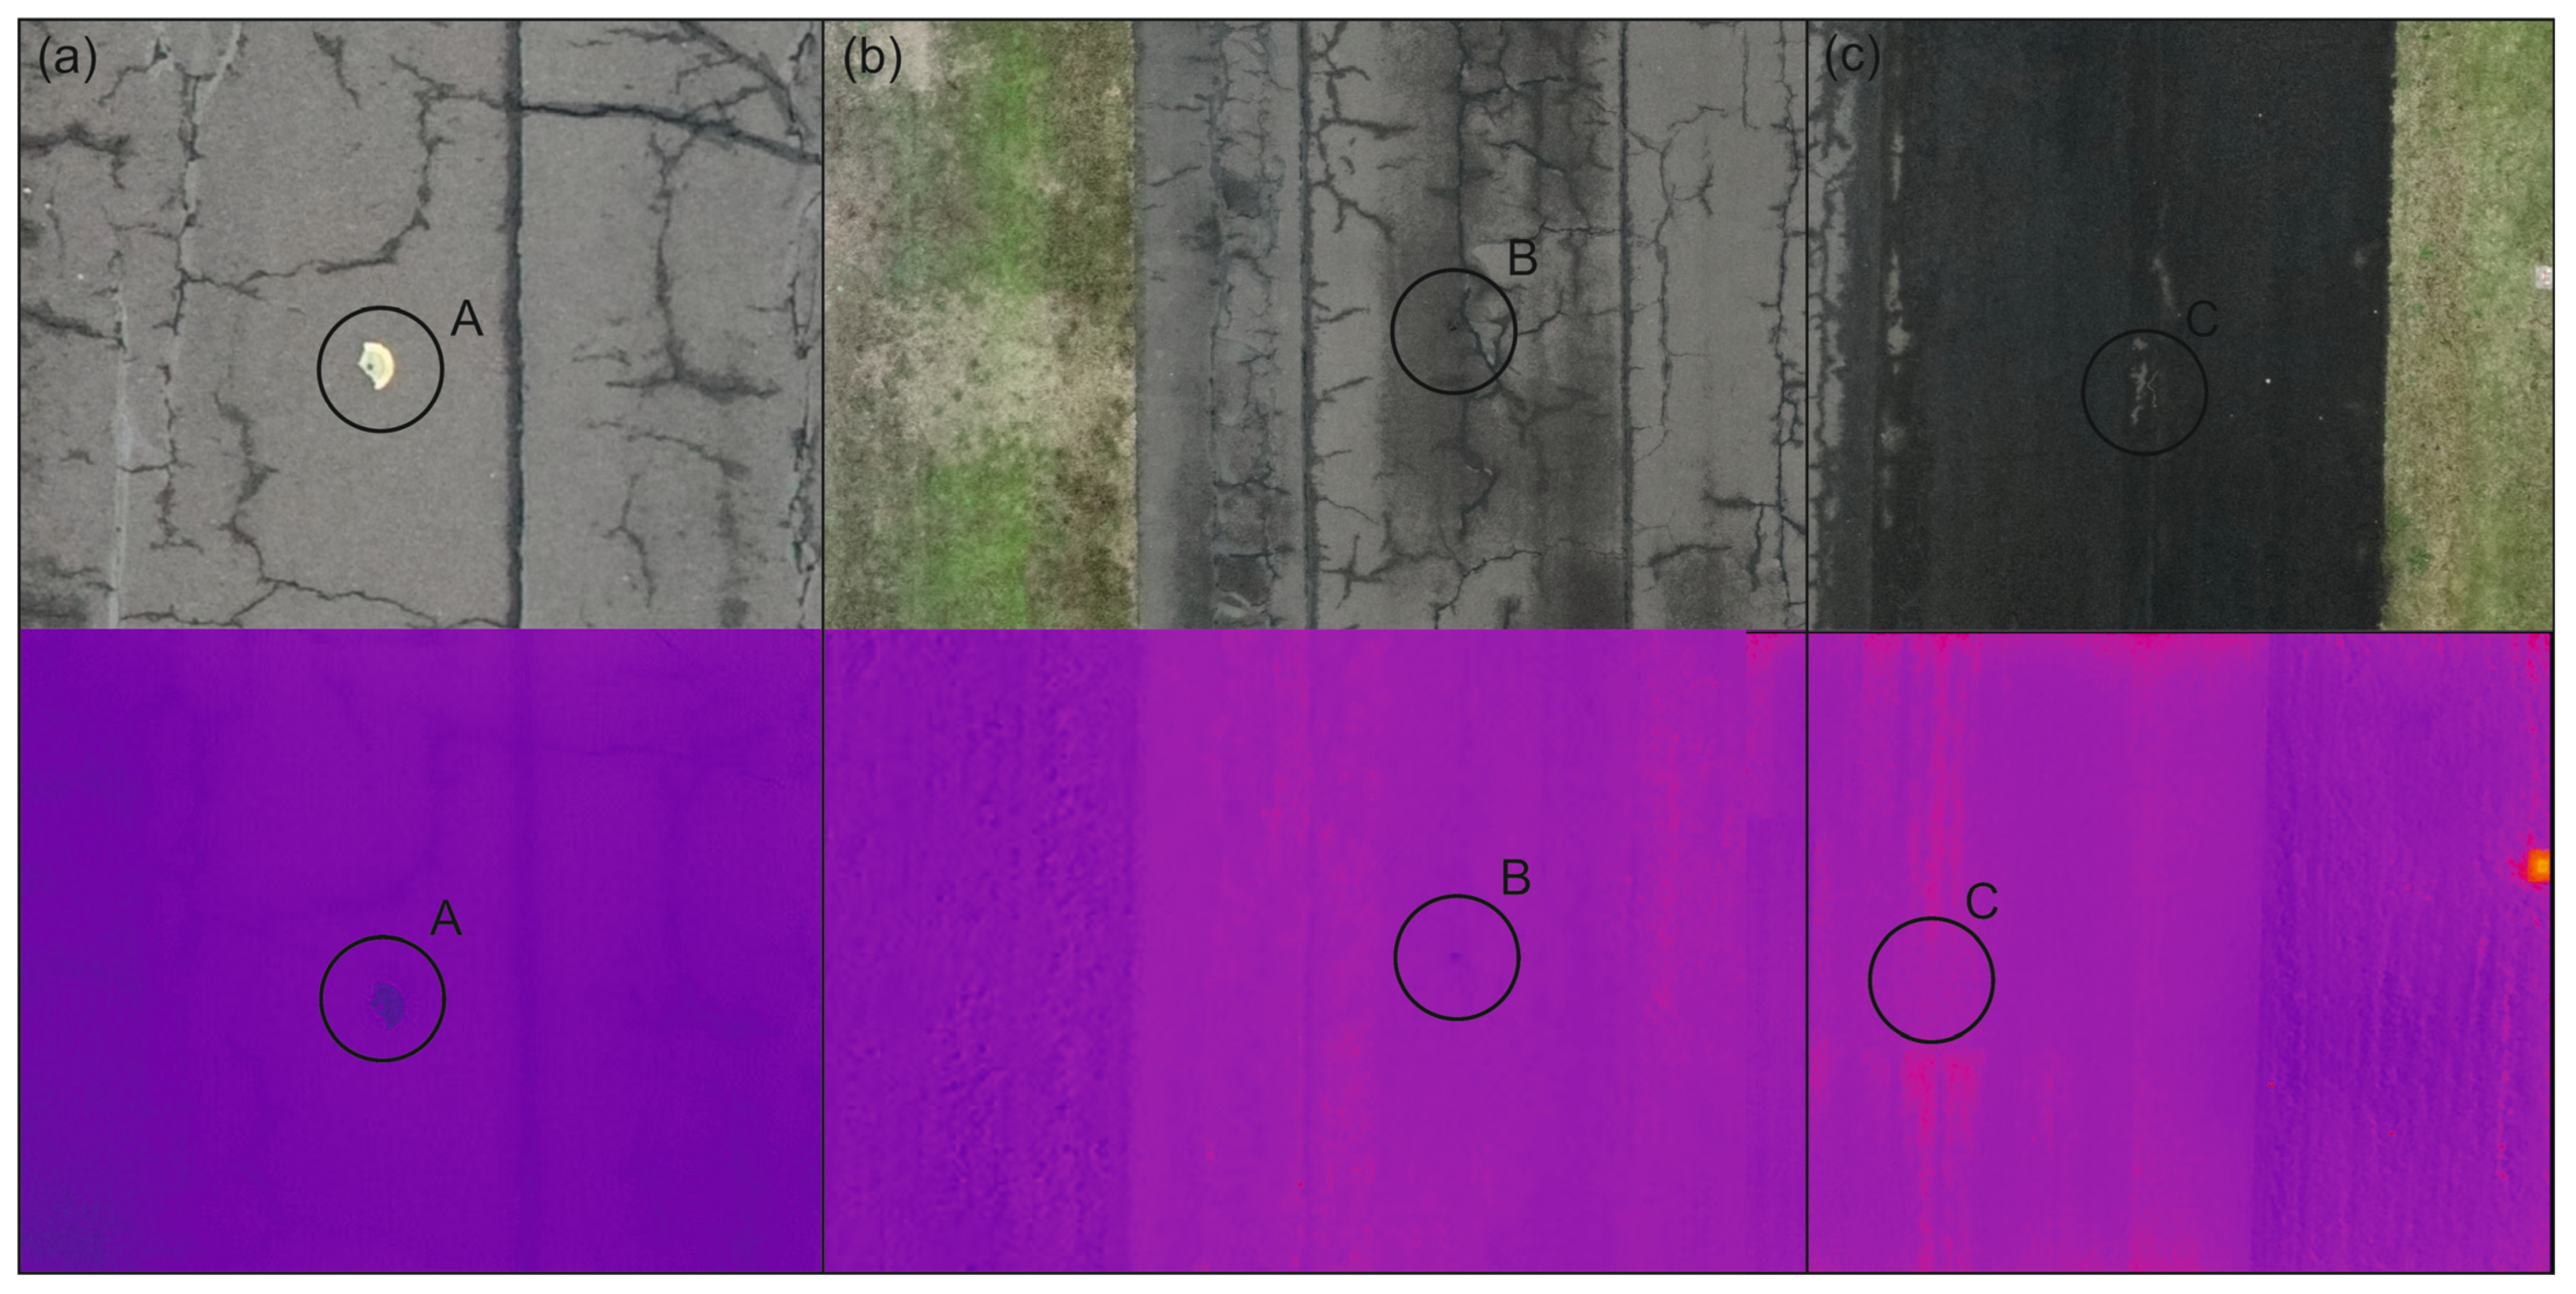
4. Discussion
Our main research goal is to create and integrate a complex drone flight plan into an airport environment. The first step of this—which is the goal of this manuscript—is the examination of the recognition ability of different sensor systems, both in the field of FOD (Foreign Object Debris), surface diagnostics, and animal populations. In addition, data have been collected on the methodological effects of different meteorological and weather conditions.
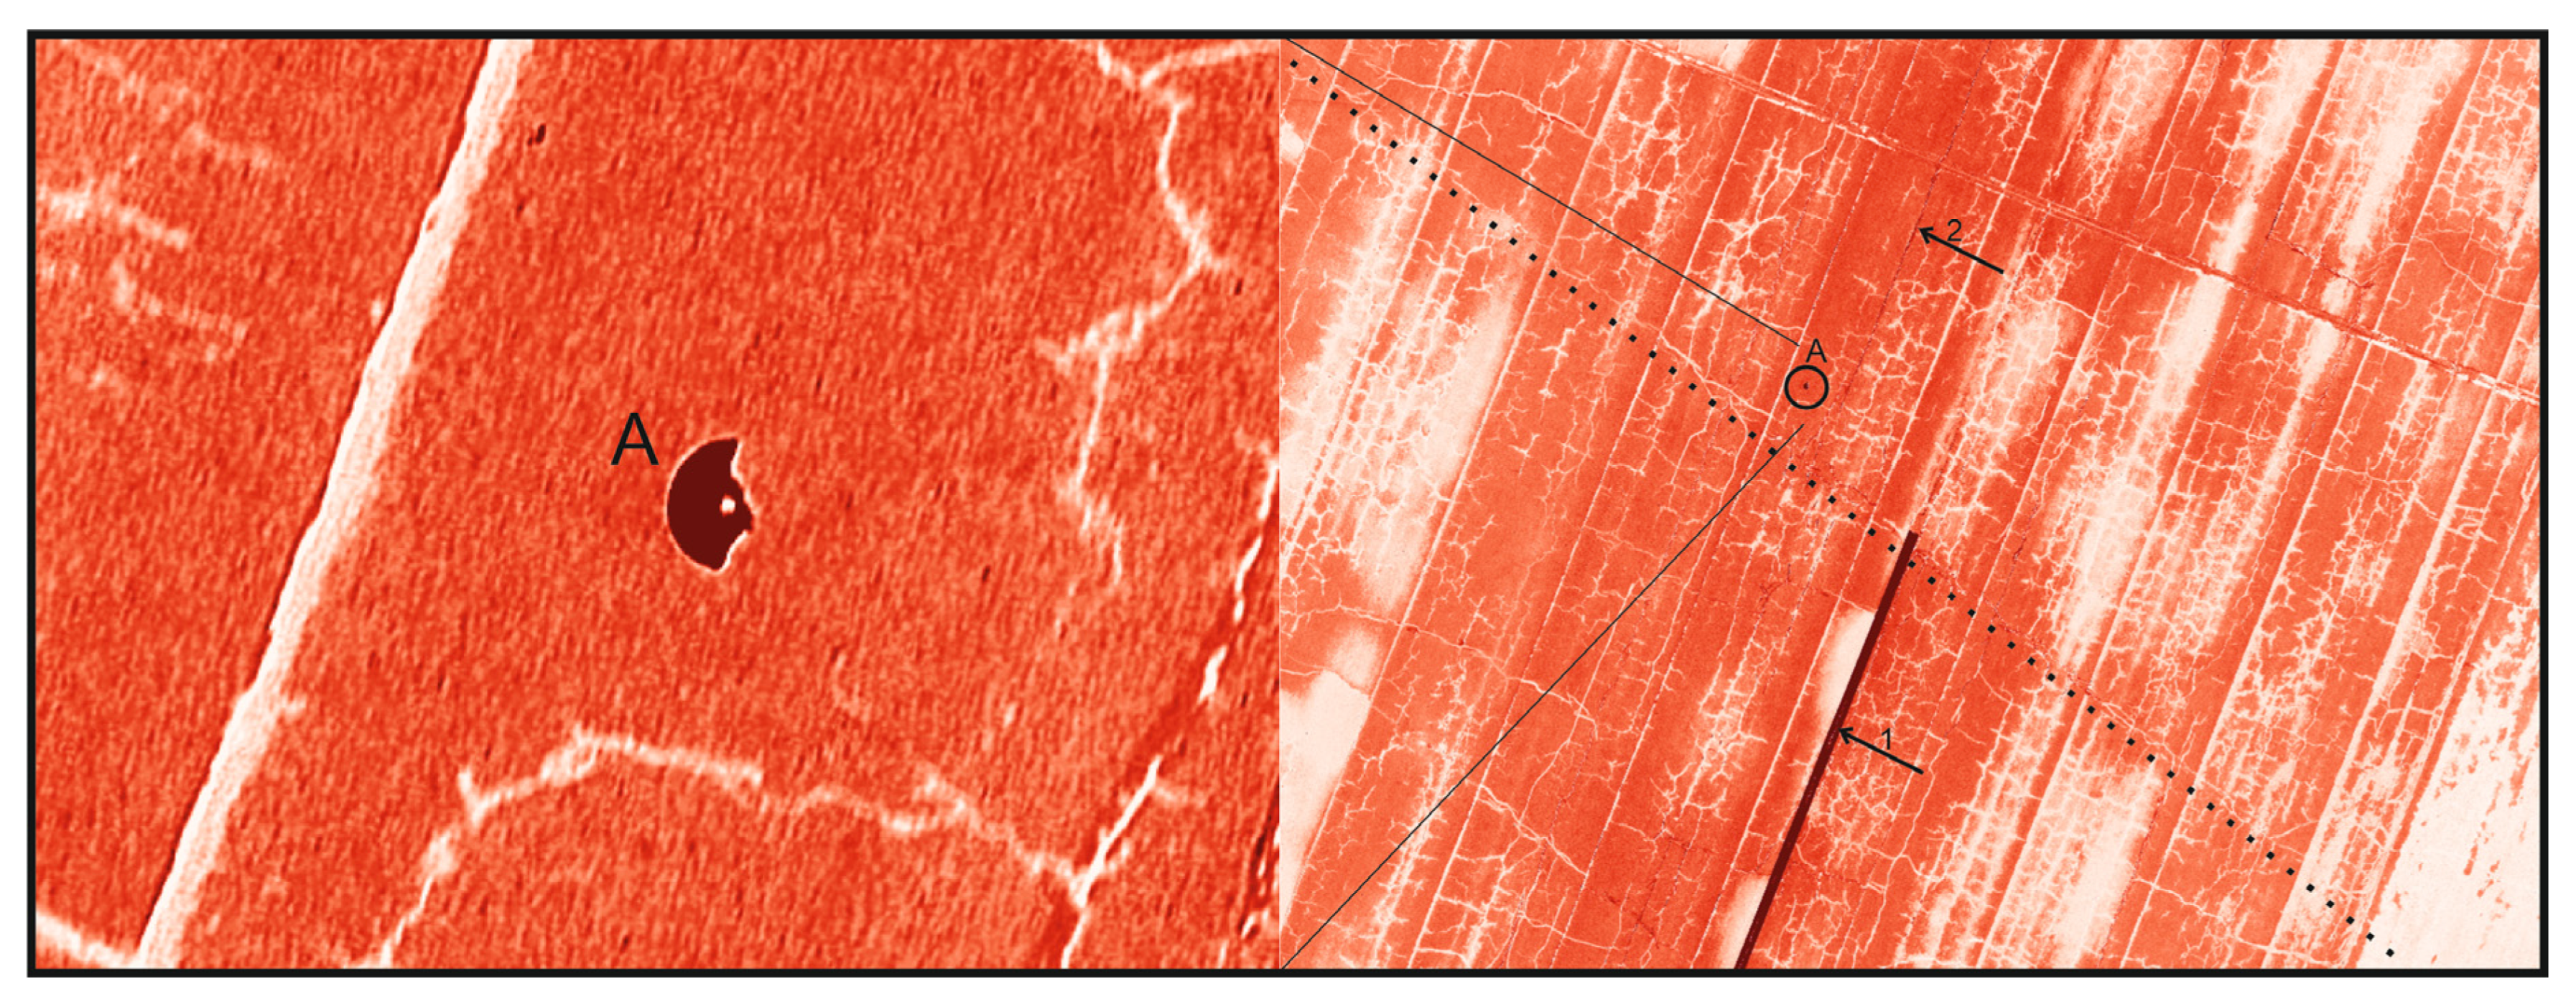
Although LiDAR analysis can achieve high accuracy and even small elevation differences can be measured, separating the different elements has proven difficult. Since most roads are designed to have some slope, methodological options to reduce the effect of slope should be further explored. For example, with mobile (car-mounted) LiDAR systems, an area of 20–30 m is scanned so that the base plane can be determined more easily, and classes that differ from it can be automatically searched with greater accuracy. Currently, although the LiDAR measurements, in addition to the nadir recording, were able to indicate the presence of stones, potholes, or microreflections, due to the difficulties in determining the base plane, the automatic methodology could not classify the surface deviations with sufficient accuracy. Overall, the analysis of LiDAR intensity values was found to be more beneficial compared to height values. The differences in the intensity values correlated with the road surface’s moisture content and repaired and unrepaired cracks. The examination of the absorption of plastic FOD objects by the LiDAR laser beam also requires further research. For this purpose, it will be advisable to check the recording using methods other than the nadir angle and to perform a LiDAR examination of different plastics.
According to the experience of the thermal sensors, the road surface in cold weather resulted in a too-uniform image, which is why the photogrammetric matching could not properly mosaic the area. This can be partially avoided at a higher flight height, but then the spatial resolution of the recordings deteriorates, which would make the examination of FOD impossible. Alternatively, the use of additional GCP points should be investigated. The result was primarily attributed to weather effects, as the unidentifiable FOD and the entire road surface became the same temperature. The thermal recording took place in the afternoon; however, there was not enough solar radiation, which could have been absorbed differently, so in winter and cold and cloudy weather, the thermal recordings may be associated with photogrammetric difficulties.
During the RGB image processing, no such difficulties have been experienced as in the case of previous sensors. The accuracy of the automatic sorting was challenged by a “color shift” (the image resolution is low for the size of the small object), so although all FOD were recognizable, during the automatic sorting, difficulties were experienced, mainly with road painting, but due to the different shape characteristics, the final conclusion could be drawn. The success of the FOD search with the presented sensors can be seen in
Table 3.
As part of the continuous data collection, it is necessary to carry out more precise reference checks, which we plan to supplement with the measurements of a multispectral camera in addition to the existing sensors. Currently, due to the difficulties of the thermal sensor—especially in cold weather conditions—it is challenging and time consuming to provide a reference for all surface deviations. Even though the LiDAR measurements indicated certain features such as rocks or microcracks, the additional image analysis could not fully help to confirm them. The success of the FOD search with the above-presented methods can be seen in
Table 4.
In the field of population analysis, the most versatile of the sensors and methods, besides RGB, are the results of the thermal sensor. In the future, it will be necessary to investigate how the measured data from the thermal sensor will be affected by the extent of vegetation. The thermal variations currently observed at the ground surface are currently attributed to subsurface tunnel but will need to be confirmed by field verification. The observability of these thermal differences under different vegetation cover and different weather conditions should be investigated.

 ,
, 


