Article

Insulator Extraction from UAV LiDAR Point Cloud Based on Multi-Type and Multi-Scale Feature Histogram

1
School of Smart City, Chongqing Jiaotong University, Chongqing 400047, China
2
Technology Innovation Center for Spatiotemporal Information and Equipment of Intelligent City, Ministry of Natural Resources, Chongqing 400047, China
*
Author to whom correspondence should be addressed.
Drones 2024, 8(6), 241; https://doi.org/10.3390/drones8060241
Submission received: 22 April 2024 / Revised: 22 May 2024 / Accepted: 27 May 2024 / Published: 4 June 2024
(This article belongs to the Section Drones in Ecology)

Abstract

:
Insulators are key components to ensure the normal operation of power facilities in transmission corridors. Existing insulator identification methods mainly use image data and lack the acquisition of three-dimensional information. This paper proposes an efficient insulator extraction method based on UAV (unmanned aerial vehicle) LiDAR (light detection and ranging) point cloud, using five histogram features: horizontal density (HD), horizontal void (HV), horizontal width (HW), vertical width (VW) and vertical void (VV). Firstly, a voxel-based method is employed to roughly extract power lines and pylons from the original point cloud. Secondly, the VV histogram is used to categorize the pylons into suspension and tension types, and the HD histogram is used to locate the tower crossarm and further refine the roughly extracted powerlines. Then, for the suspension tower, insulators are segmented based on the HV histogram and HD difference histogram. For the tension tower, the HW histogram is used to recognize the jumper conductor (JC) and transmission conductor (TC) from the power line. The HW histogram and VW histogram are used to extract the tension insulator in the TC and suspension insulator in the JC, respectively. Finally, considering the problem of setting a suitable grid width when constructing the feature histogram, an adaptive method of multi-scale histograms is proposed to refine the extraction result. Two 220 kV long transmission lines are used for the validation, and the overall object-based accuracy for suspension and tension towers are 100% and 97.3%, respectively. Compared with the point feature-based method, the mean F1 score of the proposed method improved by 0.3, and the runtime for each tower is within 2 s.

1. Introduction

Insulators, which are used in large quantities in transmission lines, play a key role in ensuring safe and stable operation. Due to the influence of harsh environmental erosion and mechanical stress, insulators are often at risk of damage and fracture, leading to large-scale power outages [1]. According to statistics, 81.3% of power system accidents are caused by insulator faults [2]. During regular inspections of transmission lines, damaged insulators need to be located and repaired in a timely manner, which makes the identification and measurement of insulators emergent and important.
With the development of small unmanned aerial vehicles (UAVs), some traditional and strenuous manual tasks are progressively substituted with these more flexible and efficient systems [3]. In the past ten years, optical images and thermal image-based methods for insulator identification and damage detection have been widely studied [4]. Some studies have achieved accurate segmentation of insulators based on image processing methods [5,6]. However, methods using traditional feature construction have poor extraction results in complex backgrounds. Most other studies are based on aerial imagery and use deep learning to identify insulators. For instance, Wei et al. [7] used nodes and lines to build an insulator string model and proposed a chain network for training to identify the rotating bounding box of insulators from drone images; Chen et al. [8] proposed a YOLOv5-3S-4PH model based on the fusion of lightweight networks and enhanced multi-scale features to identify insulator defects. Using SuperView-3 and WorldView-1 satellite images as the basis, Zhou et al. [9] engineered three deep learning models for the purpose of enhancing image resolution, identifying towers, and detecting insulators. These methods require high-resolution and high-quality images. In addition, before obtaining aerial images, the approximate spatial position of the insulator needs to be investigated in advance to plan the flight route.
Airborne laser scanning (ALS), as a non-contact active technology for quickly acquiring three-dimensional dense point clouds on the surface of objects, has become an important technical support for regular inspections, maintenance, and discovery of safety hazards in transmission lines [10]. Compared with aerial images, point clouds acquired by light detection and ranging (LiDAR) provide more accurate coordinate information for 3D objects [11,12] because image-based techniques can produce noisy results from the stereo-matching stage [13]. The geometric structure of 3D objects can be further retrieved from point clouds to achieve a fine 3D reconstruction of pylons and power lines [14,15]. Obtaining the spatial position of insulators from point clouds helps photography drones conduct route planning during power inspections [16]. However, current power inspection studies based on airborne LiDAR point cloud data are mainly focused on the extraction of towers and power lines. There are relatively few methods for extracting insulators, with the majority largely depending on manual labor [17]. Therefore, it is of great significance to study the automatic extraction algorithm of insulators from complex external environmental-based UAV point clouds.
In previous research on object classification in power transmission corridors using point clouds, insulators were usually regarded as part of the pylons or power lines rather than being separated [18,19,20]. Other methods separate the insulator based on the segmentation of poles and power lines. For instance, Ortega et al. [14] calculated the verticality of point clouds near tower crossarms and extracted pendant insulator point clouds by fitting power lines with vertical planes. However, the verticality of point clouds is less stable at the end points of the insulator. Zhang et al. [21] used regions growing in continuous vertical sections to calculate the approximate center position of the insulator. Yang et al. [22] fit the power lines on both sides, found the intersection points for insulator endpoint extraction, and built a KD tree with known insulator length and radius to search for insulator point clouds. However, for different voltage levels and tower types, the length and radius of insulators are difficult to obtain in advance. There are few existing studies on algorithms for separately extracting different types of pylons and their corresponding insulators. Ref. [23] uses intensity information to filter the pylon point cloud and then uses the linear characteristics of the point cloud to extract suspension insulators. Tang et al. [17] constructed multi-scale features and used regional erosion and region-growing algorithms to extract suspension and tensile insulators. In addition, some studies [24,25] use terrestrial laser scanning data to identify insulators, which are mainly used in intelligent robot operations and will not be discussed in detail in this article.
To sum up, current methods have achieved satisfying results while there are still some problems required to be addressed: (1) The commonly used point feature-based methods are easily affected by the obvious structure change at endpoints of the insulator and the significant point density variation resulted from the obstruction of pylon crossarm. This makes it difficult to set suitable parameters, e.g., search radius and algorithm threshold. (2) Current researchers mainly focus on the identification of the suspension insulator, while the extraction of tension and inclined insulators has been studied little.
In response to the above issues. The main contributions of our methods are as follows:
  • The multiple histogram features are constructed in place of single point features based on overall structure pylons and power lines.
  • Based on expert knowledge, a multi-scale grid width adaptive method is proposed to address the adaptability issue of grid width and achieve higher extraction accuracy. Segmentation thresholds are determined through adaptive methods to achieve the precise extraction of insulators.

2. Methods

As shown in red boxes in Figure 1, five histogram features, including horizontal density (HD), horizontal void (HV), horizontal width (HW), vertical width (VW), and vertical void (VV), are applied to achieve tower type recognition, crossarm positioning, and insulator extraction in various power lines. The workflow can be divided into two main parts with green boxes: refinement of towers and power lines and extraction of insulators.
  • Refinement of pylons and power lines: The voxel features method is first used on the original point cloud to achieve preliminary separation of pylons and power lines, then the single power line (SPL) is obtained through clustering. For each SPL, the VV histogram is used to identify whether it is associated with a tension tower or a suspension tower, and a histogram dislocation addition (HDA) method based on the HD histogram is proposed to locate the tower crossarm position and achieve refinement of the preliminary extraction results. For tension pylon, based on the position of the pylon crossarm, the crossarm edge is further fitted to achieve refined extraction.
  • Extraction of insulators: For the suspension pylon, HV histogram and HD difference histogram are used to extract the insulators. For the tension pylon, HW histogram is first used to separate the PL into jumper conductor (JC) and transmission conductor (TC). Based on the TC points, VW histogram is used to extract the tension insulators. Based on the JC points, the VW histogram and HDA method based on HW histogram are utilized to extract the suspension insulators.

2.1. Extraction of Pylon and PL

2.1.1. Preliminary Separation

In view that the current extraction algorithm for pylons and power lines is relatively mature and is not the main research object, this paper first uses the method in [21] to roughly extract power lines and towers as the input data of our method (Figure 2a). We refer to the point cloud, including the insulator, JC, and TC, as the single power line (SPL) (Figure 2b). Since the insulator is connected to the pylon and its length will not exceed a certain limit [16], this paper intercepts the power line within 10 m on both sides of the pylon as input data for subsequent insulator extraction. The Euclidean clustering algorithm [26] is used to cluster power lines into SPL. The typical clustering results of suspension towers and tension towers are shown in Figure 2b.
Due to the influence of parameter settings, point density, and other factors, the power line and pylon may be mis-divided. These errors mainly exist at the connection between the tower and the power line (see the red box in Figure 2).

2.1.2. Identification of Pylon Type

Based on the SPL, a method using VV histogram is proposed to identify the pylon type. To enhance the structural characteristics of the SPL on the projection plane, the method in [15] is used to reorientate the point cloud. Taking the reorientation of pylon points around the Z-axis as an example. Firstly, the point 3 m above the pylon points P = { p i | p i = ( x i , y i , z i ) } is projected to the XY plane and sampled uniformly. Then, the principal components analysis (PCA) algorithm is used to calculate the eigenvalue λ 1 , λ 2 ( λ 1 λ 2 ) and corresponding eigenvector v 1 , v 2 . The clockwise angle between the v 2 and the X-axis is calculated as the rotation angle θ. Finally, Formula (1) is used to calculate the coordinates ( x i , y i ) of P after rotation.
x i = x i cos ( θ ) y i sin ( θ ) y i = x i sin ( θ ) + y i cos ( θ )
After redirection, the direction of the crossarm is the X′-axis, and the direction of power line transmission is the Y′-axis. As shown in Figure 3a,b, due to the presence of JC, the tension pylon has a larger void in the vertical direction. Based on this, we project HSPL (half SPL) to the Y Z plane [27,28] with grid width w g (the following projections in this paper use the same grid width) to obtain binary images (Figure 3c,d). The number of zero pixels between the first and last non-zero pixels in each column of the images are counted to obtain VV histograms H 1 and H 2 (Figure 3e,f). It can be seen that the maximum frequency b m of H 1 is much larger than that of H 2 . The SPL is recognized as tension type if the length of the void corresponding to b m is larger than 0.5 m.

2.1.3. HDA Method to Locate Pylon Crossarm

Considering the crossarm has a larger width and fewer voids compared with other parts on the pylon, the HD histogram is used to locate the pylon crossarm for further refinement of the roughly extracted SPLs. Firstly, the redirected pylon points P = { p i | p i = ( x i , y i , z i ) } are projected to the X Z plane to obtain a binary image I (Figure 4a). For the upper half of I, the number of non-zero pixels in each row is counted to obtain the HD histogram (Figure 4b) H = { b i , i = 1 , , n } . Then, the horizontal density is enhanced by generating a histogram (Figure 4c) H d = { b j d , j = 1 , 2 , , n / 2 } with
b j d = b j max ( H ) / 3 , b j > max ( H ) / 3 0 , b j max ( H ) / 3
where represents rounding down. The crossarm can be recognized by clustering the neighboring bins. One cluster is removed if the horizontal density of it is less than 1/3 of max ( H d ) .

2.1.4. Refinement Based on Crossarm Edge Fitting

In view of the errors in the preliminary separation, the refinement of the power lines is achieved based on the extracted crossarm points. For the suspension pylon, the points below the lower end of the crossarm are relabeled as PL. For the tension pylon, as the power line is connected to the pylon transversally, refinement is achieved based on the horizontal boundary of the crossarm. For each crossarm, the pylon points are cut to obtain horizontal slice P c (red points in Figure 5a) by the rule
C z w d z i C z + w d
where C z is the Z coordinate of the lower end of the crossarm calculated in the previous section, and w d = 2 w g since the maximum error of the crossarm location will not exceed w g theoretically. Then, P c is projected onto the X′Y′ plane (the blue points in Figure 5b), and the alpha Shape algorithm [29] is utilized to extract the boundary points. The RanSaC algorithm [30] is utilized to fit the two longest lines for the extracted boundary points as the vertical boundaries (the two red lines in Figure 5b).
For transverse power lines not passing through the crossarm (the blue points in Figure 5c), the tower can be cut based on the Z coordinate of the lower end of the highest crossarm and the minimum Z coordinate of the power line. Similarly, the cut points are projected onto the Y′Z plane, and the edge lines can be fit, as shown in Figure 5d. Finally, the pylon and each SPL are segmented by spatial planes formed by the fitted lines.

2.2. Insulator Extraction Based on Multi-Type Feature Histograms

2.2.1. Insulator Extraction from Suspension Pylon

The SPLs may still have a variety of directions even after the redirection of pylon, as the direction of the transmission conductors may not be perpendicular to the section of the pylon. Thus, based on the fact that the TCs in the two transmission directions of the suspension pylon are collinear, we further redirect the SPL twice to unify its spatial orientation. As shown in Figure 6, the SPL points are projected onto the X′Y′ and Y′Z planes, and then θ 1 and θ 2 between the principal direction of the projected points and the Y′-axis are calculated, respectively. Then, the SPL is redirected around the Z-axis and the X′-axis using the method described in Section 2.1.2.
After redirection, the primary geometric structure of the SPL is concentrated on the Y′Z plane (Figure 6e). In the projection result on the Y′Z plane (Figure 7a), there are two significant differences between insulators and TC in the horizontal direction: (1) The number of zero pixels between the first and last non-zero pixels of the insulator is smaller (Figure 7b); (2) TC has more non-zero pixels and exhibits a mutation at the connection (Figure 7c,d). Therefore, we first count the number of zero pixels between the first and last non-zero pixels of each row to obtain the horizontal void histogram and calculate the position corresponding to 0 as the candidate segmentation position, as shown in Figure 7b. To identify the segmentation position, we then calculate the horizontal density histogram and subtract the adjacent bins to obtain the horizontal density difference (HDD) histogram, as shown in Figure 7d. Finally, the first candidate position above the maximum frequency in HDD is considered the real segmentation position.

2.2.2. Tension Pylon Insulator Extraction

In the tension tower, the tension insulator and suspension insulator may be present simultaneously. The suspension insulator is commonly contained in the JC part, and the tension insulator is located in the TC part. Thus, we first separate JC and TC from SPL and then extract the insulator from JC and TC. Similar to the extraction of the suspension insulator extraction, the SPLs also need redirection, but the TCs of the tension pylon in the two transmission directions may not be collinear since the tension pylons are generally located at the turns of the transmission corridor, so only one HSPL (red points in Figure 8a) is used to ensure unified spatial orientation. We cut the HSPL points into two parts equally based on the distance to the pylon center along the Y′ axis. The part farther from the pylon (orange points in Figure 8a) is used to calculate the principal direction, as involving the JC part may affect the calculation accuracy. Then, the same redirection method as in Section 2.1.1 is used to calculate the angles θ 1 and θ 2 (Figure 8b,d) between the principal direction of HSPL and the Y′ axis. Based on the redirection result (Figure 8c,e), the extraction is divided into three steps.
(1)
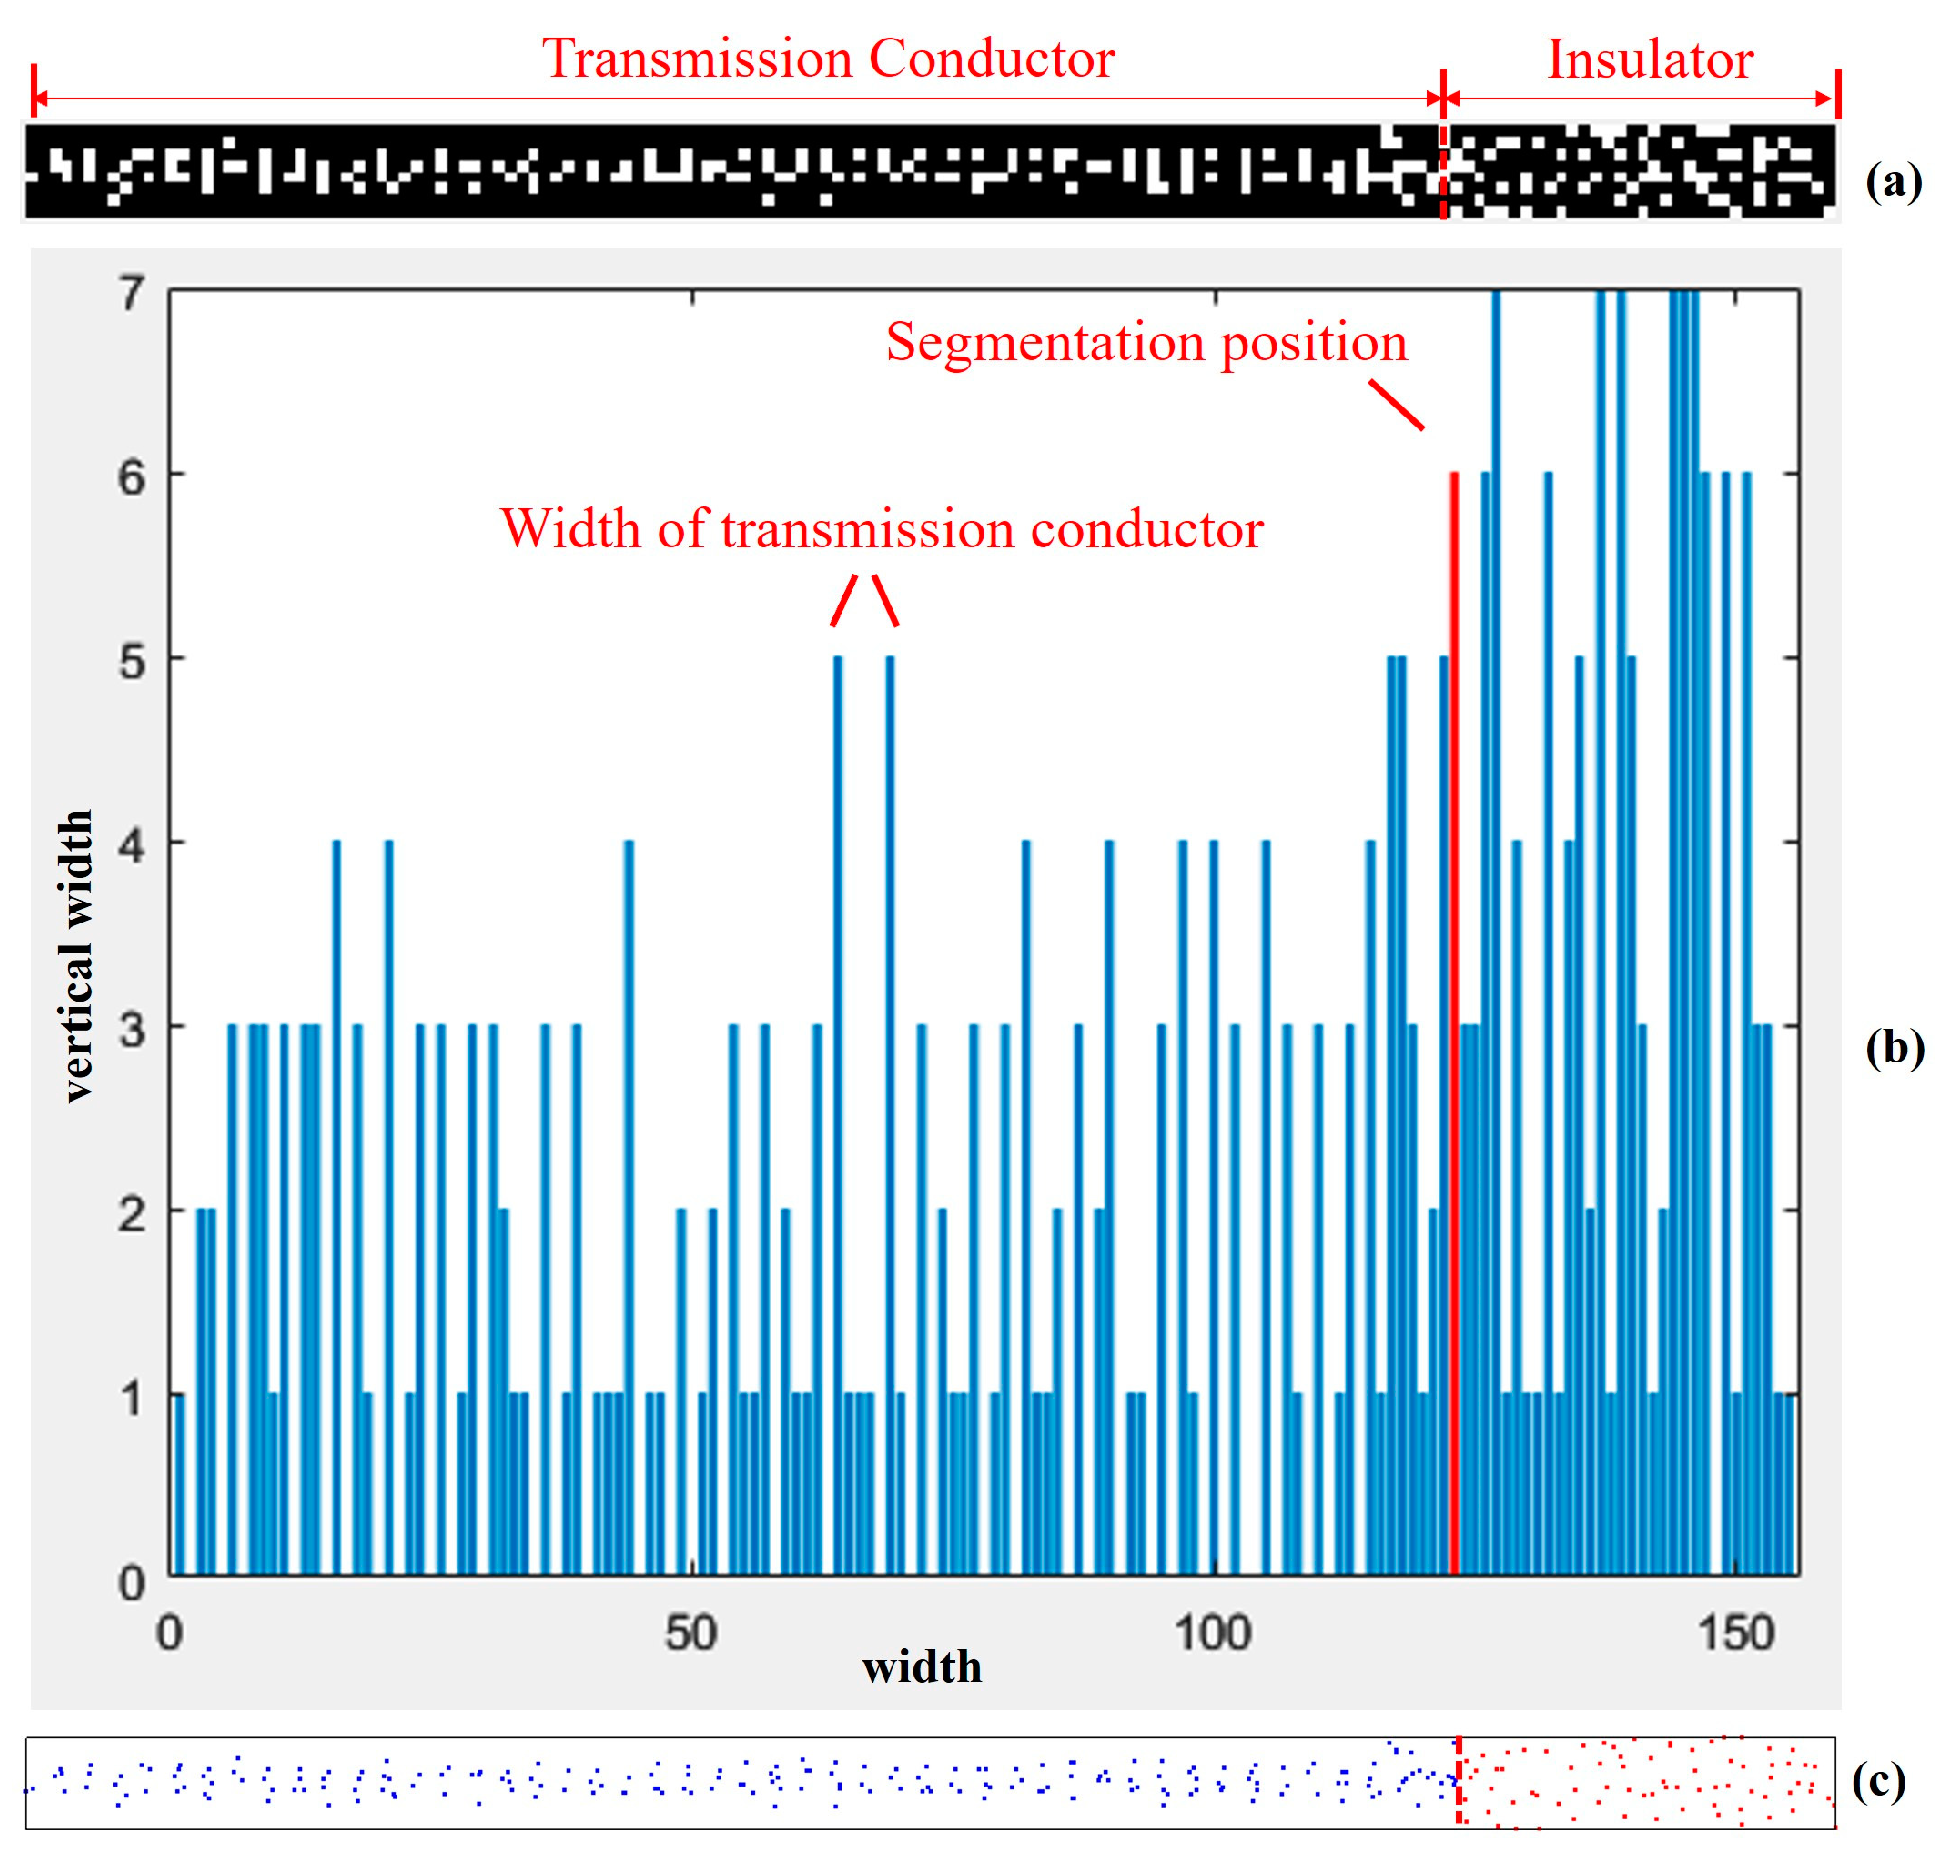
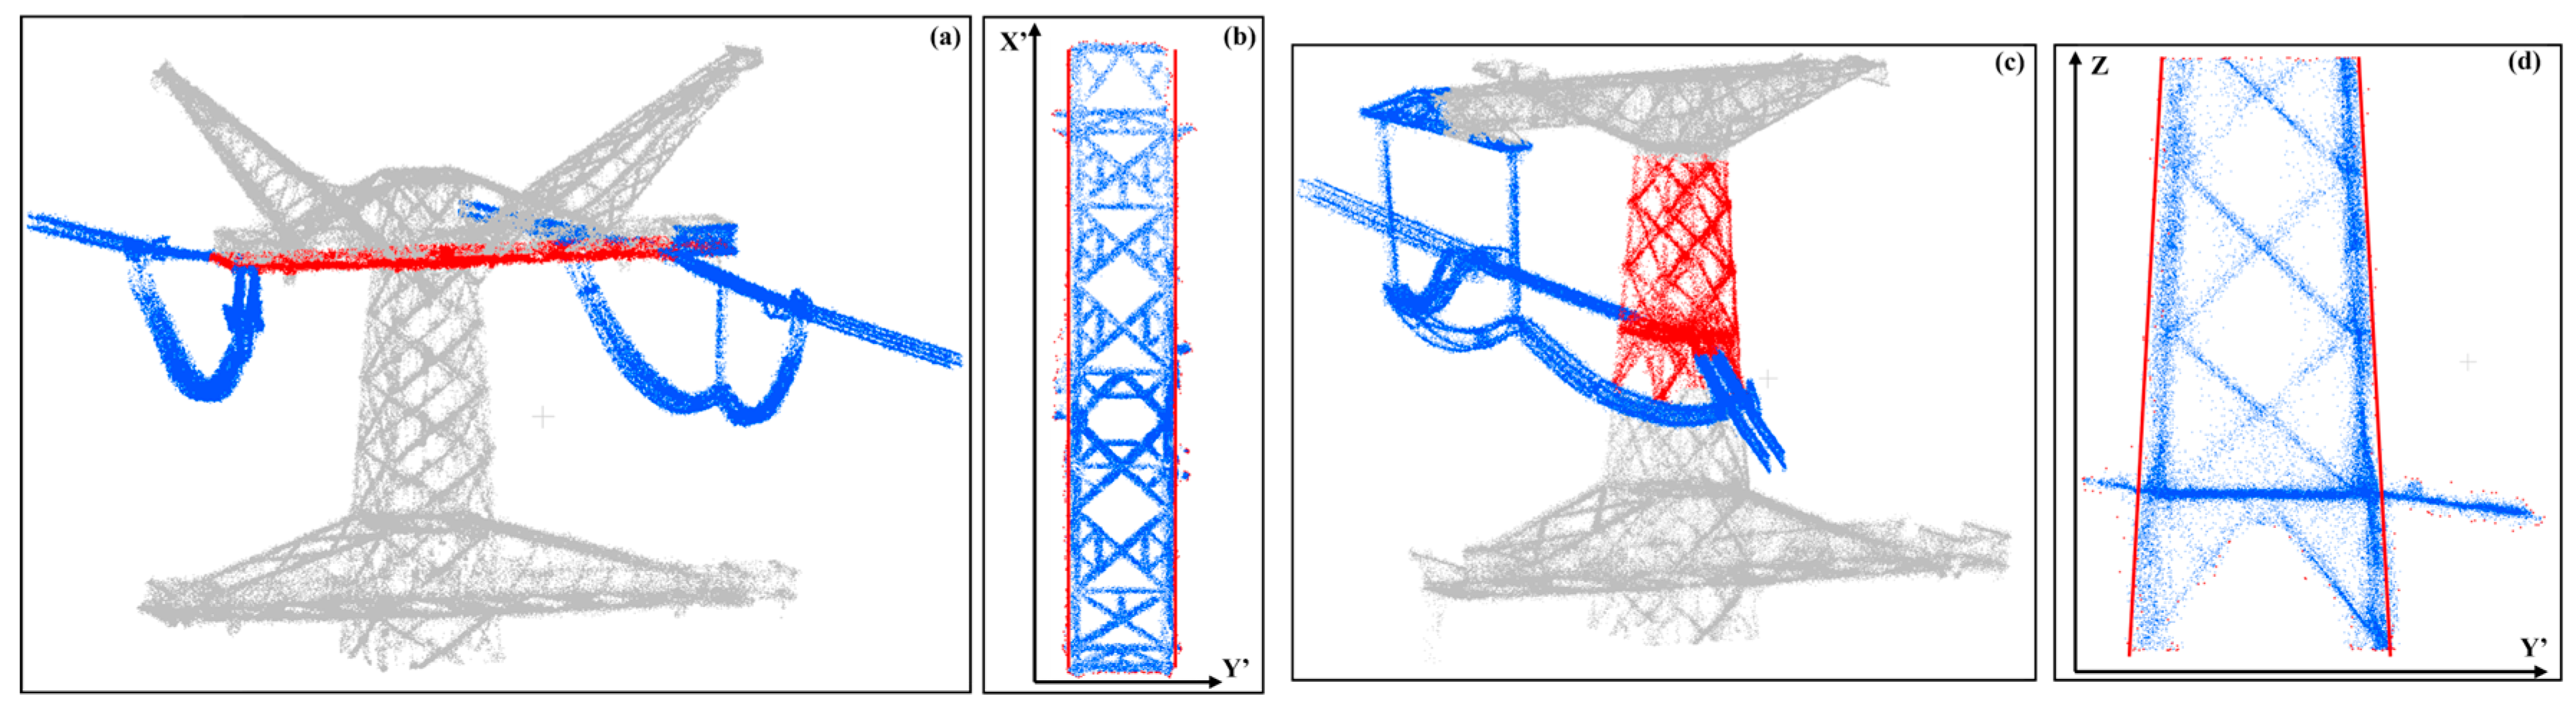
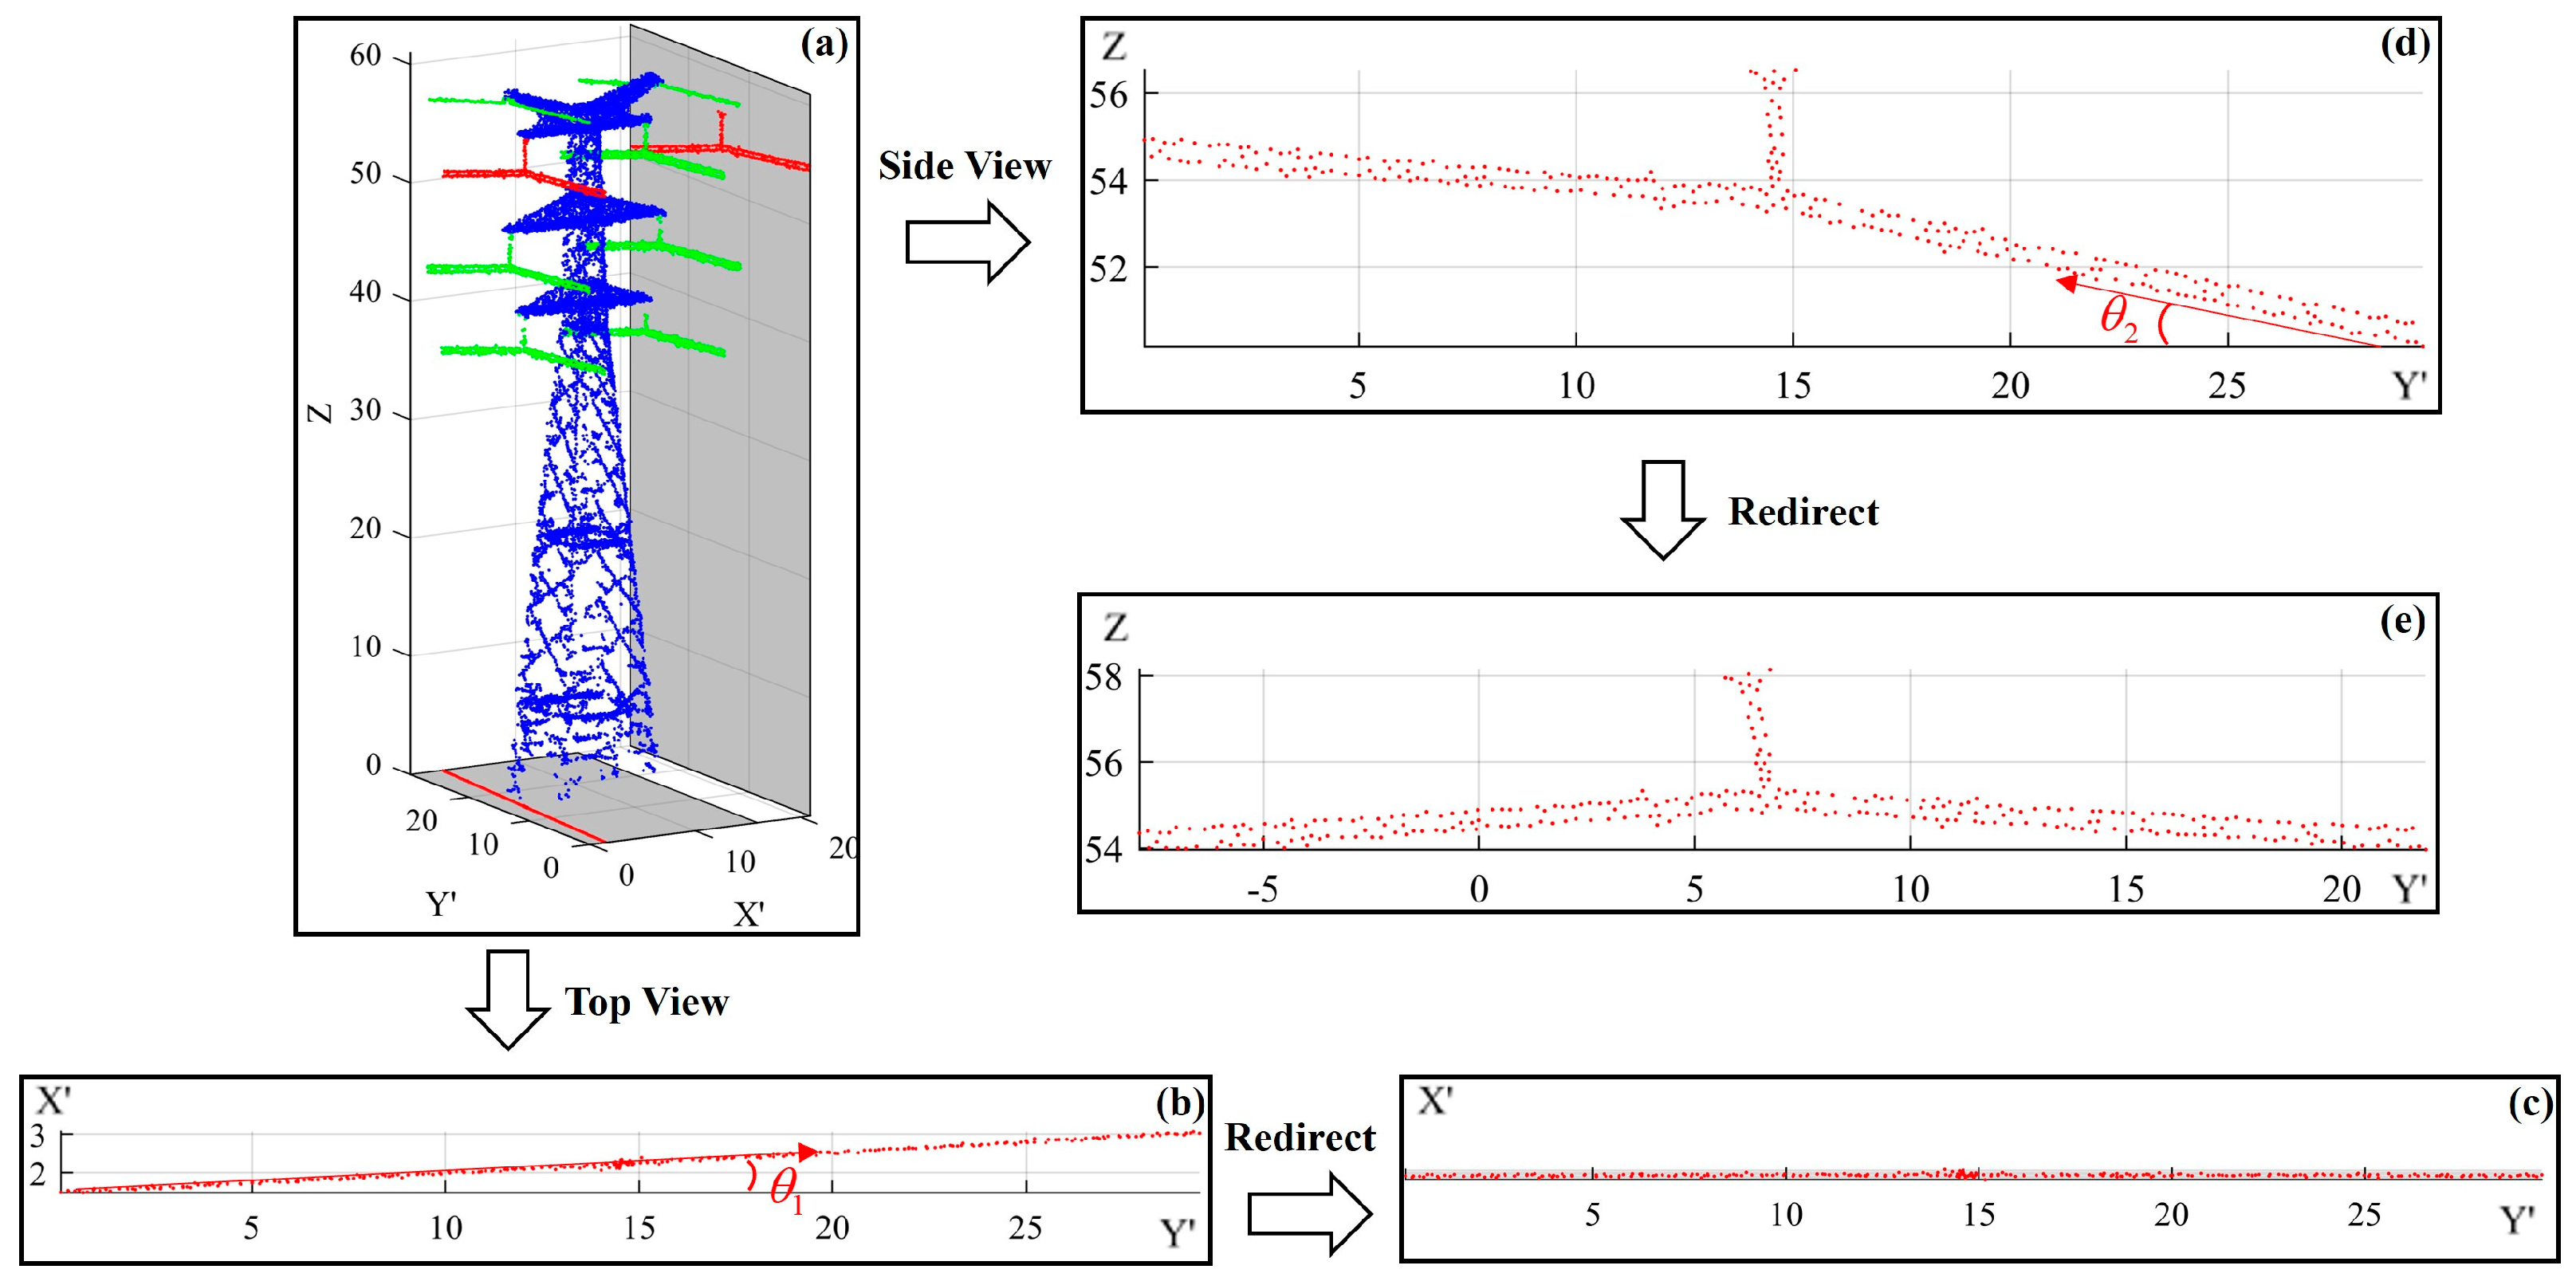
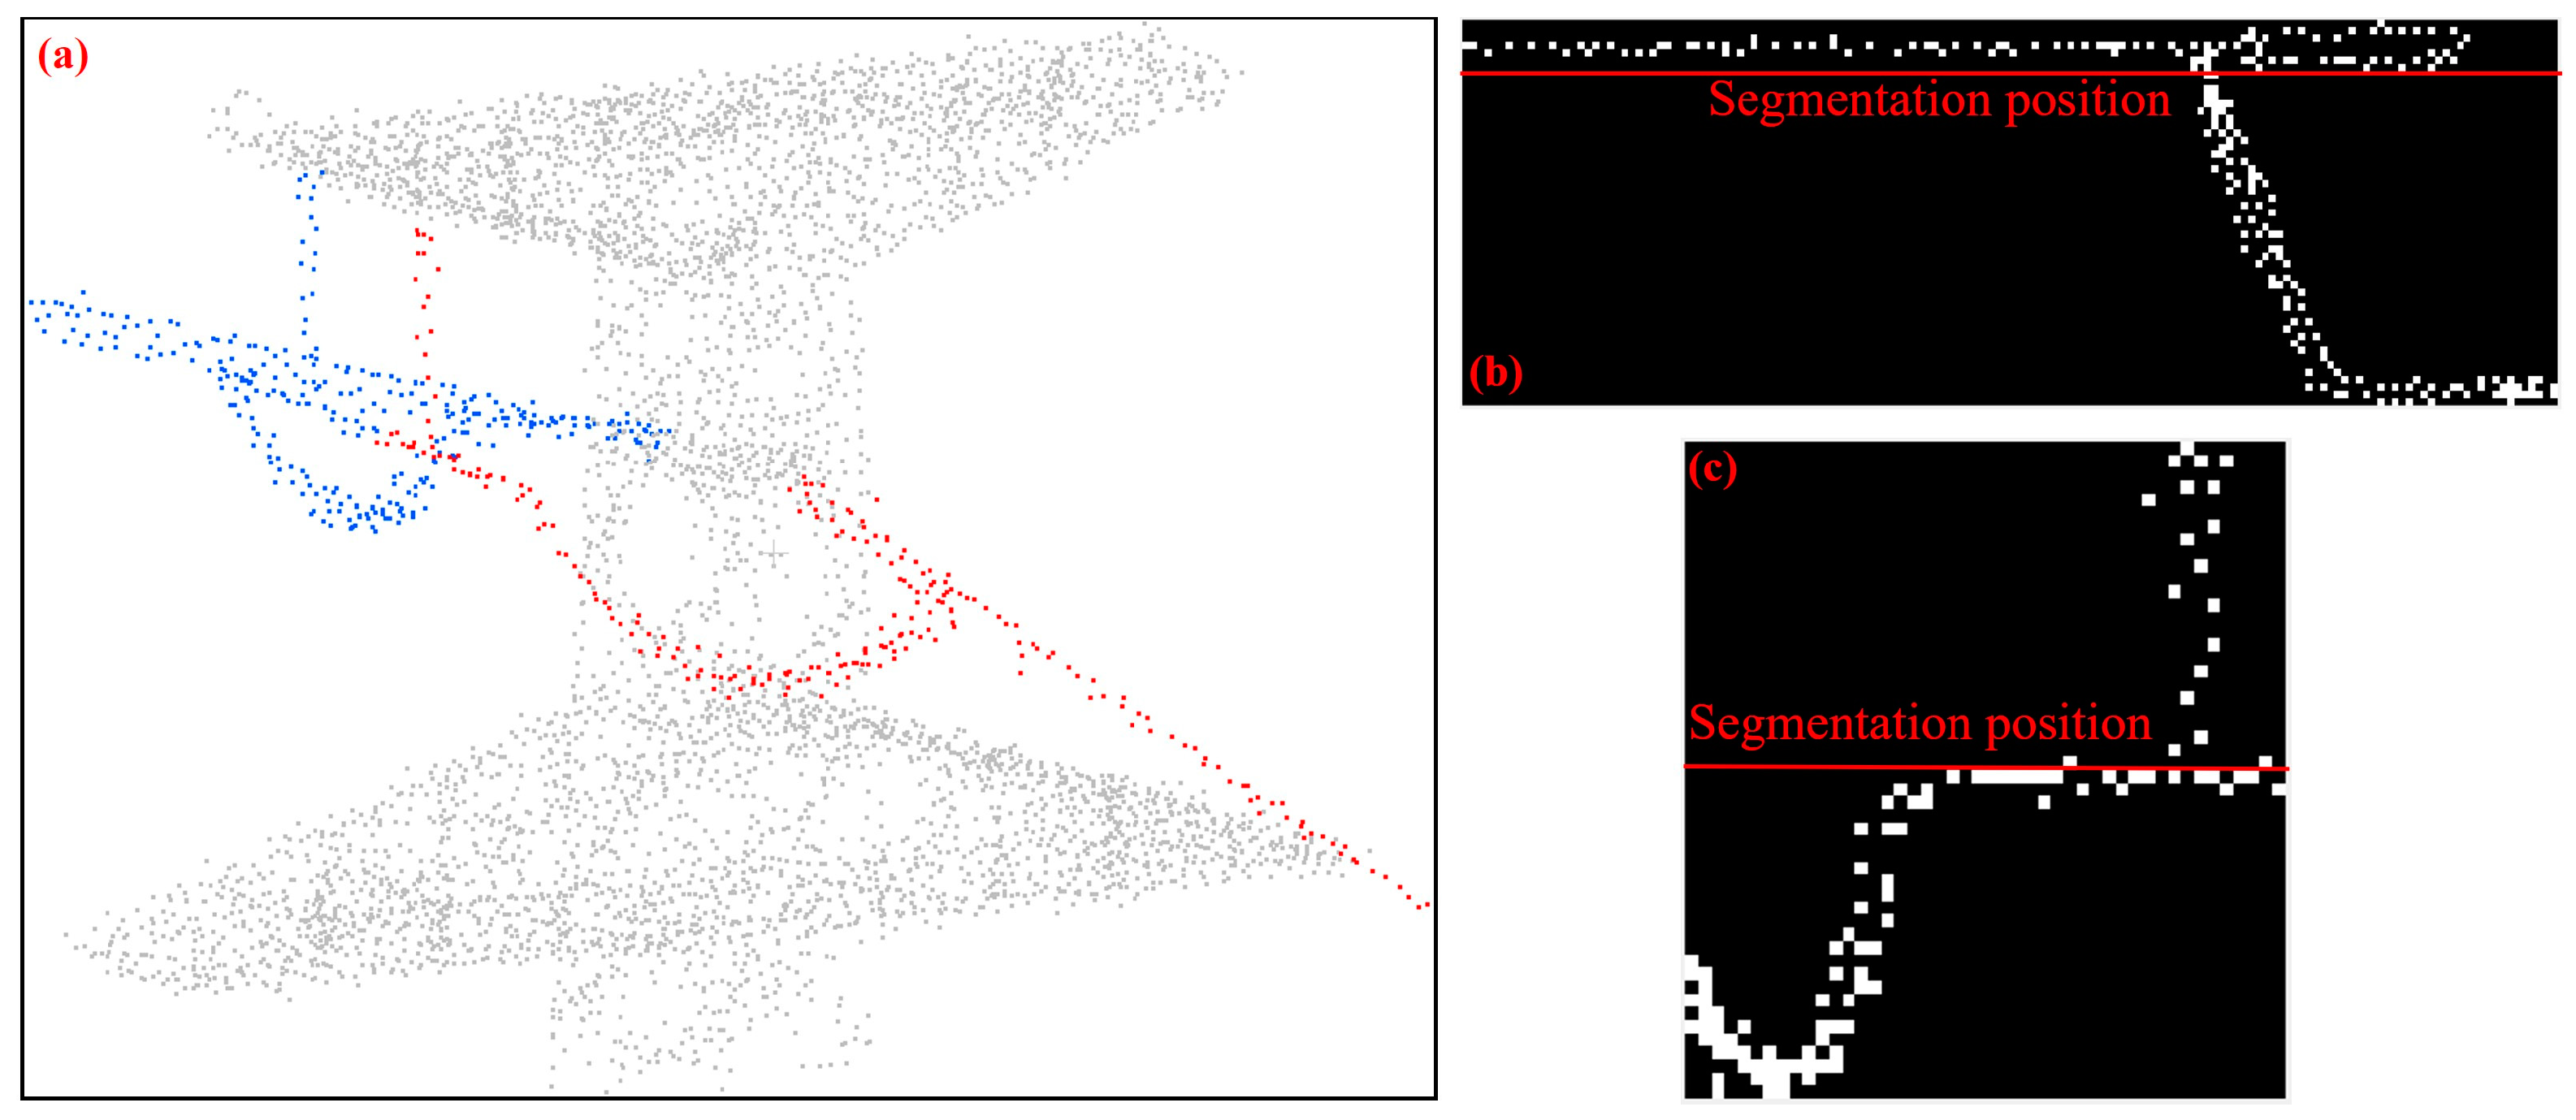
Separation of JC and TC. After the redirection, the HSPL points are projected onto the Y′Z plane, as shown in Figure 9a. Along the horizontal direction of the projection, the length between the first and last non-zero pixels of TC is larger than that of JC. Then, we count the number of pixels between the first and last non-zero pixels on each row to construct the horizontal width (HW) histogram, as shown in Figure 9b. The lowest bin with a width value larger than half of the maximum width is considered the segmentation position.
(2)
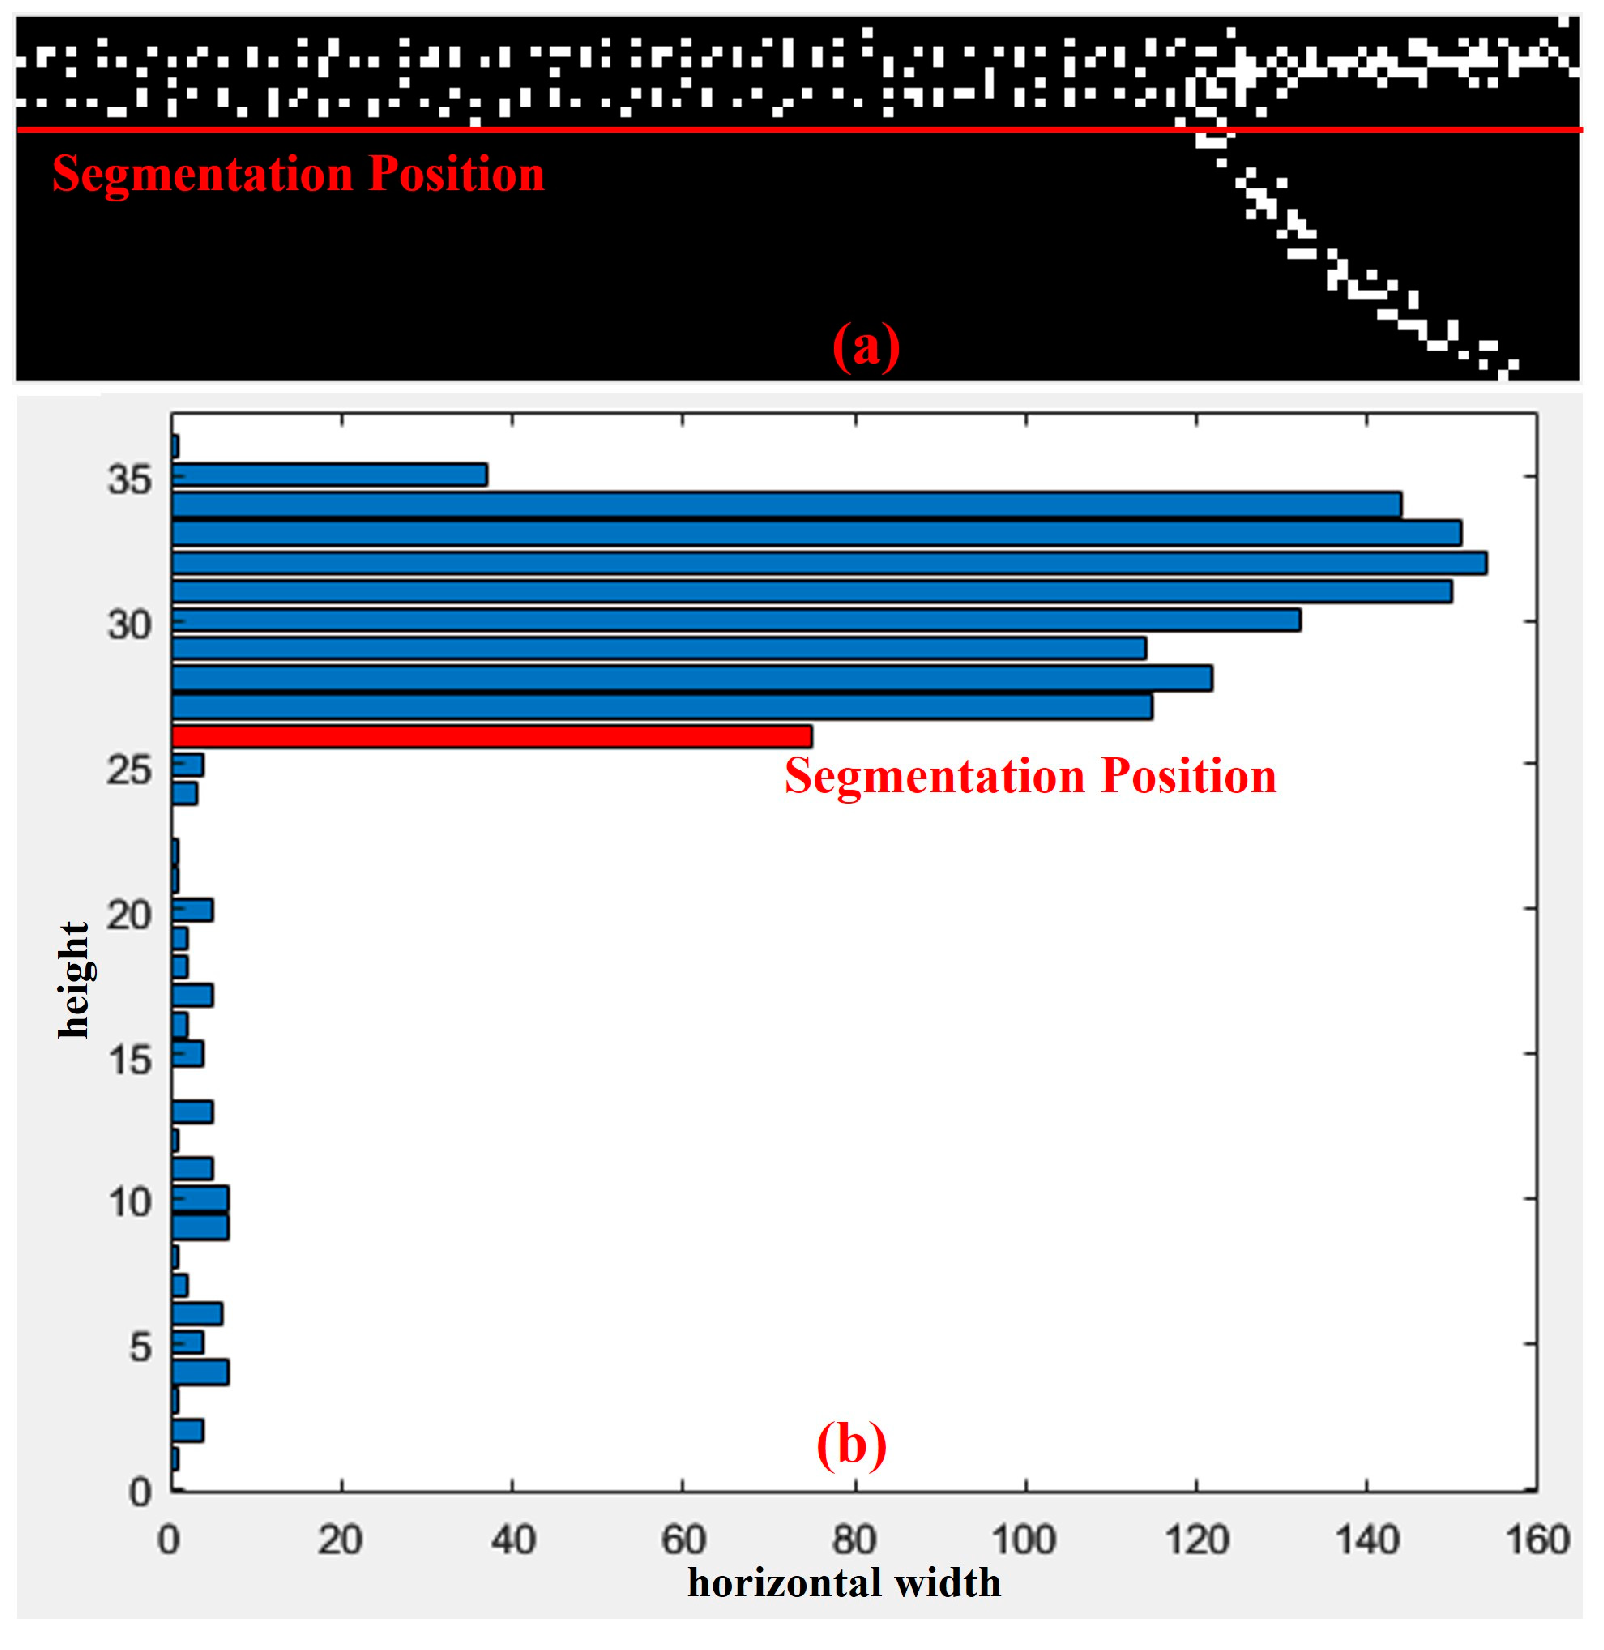
Extraction of tension insulator. The extracted TC points are projected onto the X′Y′ plane, as shown in Figure 10a. Along the vertical direction of the projection, the length between the first and last non-zero pixels of the insulator is larger than that of the transmission conductor. The vertical width (VW) histogram is constructed to recognize the segmentation position between the TC and insulator, as shown in Figure 10b. We pick the bins corresponding to the points used to calculate the principal direction and find the maximum width as the width of transmission conductor. In the VW histogram, the first position whose width is larger than the width of transmission conductor is considered the segmentation position.
(3)
Extraction of suspension insulator. As shown in Figure 11a, the extracted JC points are used to extract the suspension insulator. The suspension insulators in the projection result of JC on the Y′Z plane have 3 boundaries (Figure 11b) that need to be calculated. For b1 and b2, as the length of the insulator is larger than the jumper conductor in the vertical direction, we count the number between the first and last non-zero pixels in each column to construct the vertical width (VW) histogram, as shown in Figure 11c. The two insulators correspond to the two peaks that can be determined using the method described by Formula (2) in Section 2.1.3 for crossarm positioning.
Figure 8. Redirecting the half single power line (HSPL) of tension pylon. (a) Projection of HSPL (red: the projected HSPL; orange and yellow: points used to calculate the principal direction; green: other single power lines (SPLs); blue: pylon; grey: projection plane); (b) projection on the X′Y′ plane; (c) redirection result on the X′Y′ plane; (d) projection on the Y′Z plane; (e) redirection result on the Y′Z plane.
Drones 08 00241 g008
Figure 9. Separation of jumper conductor (JC) and transmission conductor (TC). (a) Projection of half single power line (HSPL) on the Y′Z plane; (b) horizontal width (HW) histogram.
Drones 08 00241 g009
Figure 10. Tension insulator extraction. (a) Projection of transmission conductor (TC) points on the X′Y′ plane; (b) vertical width (VW) histogram; (c) extraction result of tension insulator (red: insulator, blue: transmission conductor).
Drones 08 00241 g010
Figure 11. Calculation of horizontal segmentation position. (a) Suspension insulator connected to jumper conductor (JC) (grey: pylon, blue: transmission conductor, red: JC);.(b) projection of JC on the Y′Z plane; (c) vertical width (VW) histogram and horizontal segmentation position.
Drones 08 00241 g011
For b3, as shown in Figure 12a, the width of the insulator, w i , is calculated by taking the difference between b1 and b2. Then, we take the width w i horizontally at both ends of the insulator to obtain the sub-image (Figure 12b). Alone the horizontal direction, the length between the first and last non-zero pixels of insulators is smaller than that of JC. The HW histogram is calculated (Figure 12c), and the lowest bin position larger than w i is considered as the vertical segmentation position.

2.2.3. Extraction of Other Types of Insulators

In this paper, there are two special types of SPL that cannot be recognized using the above methods: the cable-stayed insulator in suspension pylon (Figure 13a) and the insulator where the SPL passes through the tower body in tension pylon (Figure 14a). For the cable-stayed insulator, as shown in Figure 13b, the SPL is projected to the X′Z plane. Along the horizontal direction, the horizontal width (HW) is larger than that of TC, so the HW histogram is constructed to recognize the segmentation position between the insulator and the TC, as shown in Figure 14c. If the maximum width of the HW histogram is larger than a given threshold T, it is considered that the SPL contains a cable-stayed insulator. Then, the maximum of the lower half of the HW histogram is considered the width of TC, and the lowest bin whose width is larger than the width of TC is considered as the segmentation position.
For the insulator where the SPL passes through the tower body, the HSPL is projected onto the X′Y′ plane (Figure 14b), and then the same method described in step (1) of Section 2.2.2 is used to separate the JC and TC. The tension insulator in the extracted TC points is detected using the same method described in step (2) of Section 2.2.2. The suspension insulator in JC is projected onto the Y′Z plane (Figure 14c), and then the HW histogram is constructed. The lowest bin whose width is larger than half of the maximum width is considered the segmentation position.

2.2.4. Adaptive Extraction Based on Multi-Scale Feature Histograms

The pylon crossarm positioning, tension pylon identification, insulator segmentation methods, and other methods proposed in this article are all performed based on multiple types of feature histograms. Obviously, the grid width w g for constructing the histogram is an important parameter that determines the extraction results. Generally speaking, setting w g for experience-based parameter tuning can achieve satisfactory insulator extraction for most towers. However, it is inevitable that the characteristics of a certain insulator boundary may disappear or be weakened under a fixed grid width. Since the design of towers on the same transmission line usually follows a consistent standard, the length of the same type of insulator on the same pylon is similar [16]. Based on such expert knowledge, we propose an adaptive method based on multi-scale feature histograms to enhance the applicability and obtain higher accuracy: (1) A series of w g are generated on the range of [0.05 m, 0.15 m] with an interval of 0.01 m to extract the insulators. (2) The median length values are calculated for suspension and tension insulators, respectively, under all grid widths, labeled as L s and L t . (3) For each insulator, we select the extraction result whose length is the closest to L s or L t among all w g values.

3. Results and Analysis

3.1. Experimental Data and Operating Environment

The experimental data were acquired on two 220 kV long transmission corridors by DJI drones equipped with AVIA Lidar. The random error is 2 cm, and the scanning rate is 720,000 points/s. Both sets of data were collected in Kunming, Yunnan, China. As shown in Figure 15, data 1 has a total length of 51,452 m and 238,486,804 points. Data 2 has a total length of 22,956 m and 104,473,964 points. After pre-extraction, data 1 has a total of 5,081,466 power lines and pylon points, while data 2 has 5,059,813 points. The details are illustrated in Table 1.
As shown in Figure 16, the experimental data includes eight types of towers, which are divided into suspension pylons (Figure 16a–e) and tension pylons (Figure 16f–h) according to the insulator installation method. Suspension pylon insulators are suspended vertically beneath the crossarm. Tension pylon insulators are primarily connected laterally to transmission conductors, and some jumper conductors contain suspension insulators, as shown in Figure 16h.
The method proposed in this article is implemented using MATLAB 2022b. The program runs in the Win11×64 system environment, configured with a CPU clocked at 3.4 GHz, 32 GB memory, and an RTX 3060 graphics card. We release the source code at https://github.com/c175044/Insulator-Segment-Using-Multi-histogram.git (accessed on 7 May 2024).

3.2. Results and Parameter Analysis

3.2.1. Evaluation Metrics

We employ both point-based and object-based evaluation in the proposed method. Reference insulator point clouds were manually labeled using CloudCompare. For point-based evaluation, precision (P), recall (R), and F1-score (F1) represented by Equation (4) are utilized according to the previous studies [31,32]. For object-based evaluation, similar to the previous research [14,17], we regard an insulator to be correctly identified if half of it has been extracted, and the recognition ratio R i is calculated using Equation (4)
P = T P T P + F P ,   R = T P T P + F N ,   F 1 = 2 P R P + R ,   R i = n i d e n t i f i e d n r e f e r e n c e × 100 %
where T P is the number of correctly extracted insulator points, F P is the number of incorrectly extracted insulator points, and F N is the number of unrecognized insulator points. n i d e n t i f i e d represents the total number of insulators correctly extracted, and n r e f e r e n c e represents the total number of reference insulators.

3.2.2. Experimental Results

In the two data sets, the number of insulators for suspension towers is 514 and 385, respectively, while the number of insulators for tension towers is 428 and 162. The extraction accuracy for suspension and tension pylons is presented in Table 2.
From the point-based results, the proposed method has high extraction accuracy. The F1 values for suspension towers and tension towers in the two datasets are 0.92, 0.90 and 0.89, 0.90, respectively. The precision and recall are approximative for each dataset of suspension towers or tension towers, indicating that our method can detect sufficient insulator points while ensuring accurate extraction. From the object-based results, the proposed method can detect all the insulators for the suspension tower, while a slightly lower accuracy is achieved for the tension tower. It is worth mentioning that over 90% of the insulators have more than 80% of their points extracted, not just 50%, indicating that the integrity of individual insulators is reliable. The overall accuracy of the suspension pylon is higher than the tension pylon. The probable reason is that the difference between the TC and the insulator in the vertical direction is more obvious. The insulator distribution in the tension pylon is more complicated, and the proposed method is more susceptible to noise during the multiple segmentation processes. This will be further discussed in Section 4.

3.2.3. Parameter Analysis

The performance of our method is also compared with the extraction results under different fixed grid width values. As shown in Figure 17, the F1-score for each pylon is calculated and divided into different intervals.
As can be seen: (1) The accuracy under the adaptive grid width is higher than that under fixed grid width. (2) For tension towers, the adaptive grid width can greatly improve the extraction accuracy. This largely compensates for the lack of fixed width in tension insulator extraction. For suspension towers, the effect of adaptive grid width is limited, but high-precision extraction can be achieved by empirically setting the grid width while considering efficiency. (3) The overall extraction accuracy of the suspension pylon is higher. This is consistent with the results in Table 2. (4) Without considering adaptive widths, the projection width changes, and the variation in each fixed width of F1 is small. This shows the adaptability of the proposed method. The tension pylon in data1 has the lowest accuracy, but at most projection widths, more than 75% of the tower insulators have an F1 value above 0.7. This proves that experimentally setting a fixed grid width can achieve accurate extraction of most insulator points.

3.2.4. Qualitative Assessment

The extraction results of various types of towers are shown in Figure 18 and Figure 19. It can be seen that most insulators can be accurately extracted. For suspension insulators, the data at the connection between the insulator and the tower are sparse or missing due to the obstruction of the crossarm. Our method can accurately identify those insulators. For tension towers with horizontally installed insulators, the method proposed in this paper can accurately identify and extract point clouds.

3.3. Comparison of Different Methods

In order to further verify the efficiency and accuracy, our approach is compared with a point feature-based method [17], in which a series of point features are utilized, including eigenvalues, dimensional features, and verticality.
We selected one tower from each of the eight types of pylons (Figure 16 except (c)) for comparison, and the results are shown in Table 3. It can be seen that our method achieves higher accuracy. The precision value of the point feature-based method is much higher than the recall value, mainly because the middle part of the insulator can be accurately extracted, while the two ends of the insulator cannot be effectively identified. The recall of our method is much higher, illustrating the effectiveness of our method in extracting the ends of the insulator. For different types of towers, the performance of our method is similar, and the F1 values are all above 0.89, indicating that our method has higher stability.
From the perspective of efficiency, since the point feature-based method needs to search the neighboring points at multi-radius and calculate the feature values point by point, the running time is much longer. Additionally, the efficiency is unstable, as the point-by-point processing is highly affected by the point density. The point density effect in our method is small, as the processing primitive is a histogram instead of a single point. The running time of our method is mainly related to the type of tower (tension or suspension tower). It takes a longer time to process the tension pylon, as extra steps are required, such as fitting the planes on both sides of the crossarm and separating the jumpers.

4. Discussion

Compared with the commonly used point feature-based method, our method has a much lower computing cost. Point feature extraction needs to construct a neighborhood for each point in the form of voxel space [21,33], spherical space [17], or k-nearest neighborhoods [14]. In order to obtain more accurate feature measurements, multiple scales are often calculated. This process is time consuming, so in many cases, the point cloud has to be subsampled, and some detailed information may be missing [34]. The proposed method also requires determining the grid width for feature computation. However, the grid width can be considered a two-dimensional search radius. The features we construct are tailored for objects such as towers and individual power lines rather than computing features for individual points. This significantly reduces the time cost.
Point features often face challenges in determining the segmentation threshold for target objects. In previous research, there has been little discussion on how to set these thresholds [14,17,21]. In this paper, most thresholds are adaptively adjusted based on the grid width, which has the greatest impact on the extraction results. To set a suitable grid width, we involve the prior knowledge that the same design standards are commonly adhered to on the same transmission line and the insulator length will be similar on the same tower. Among a series of predefined grid width values, the suitable setting can be decided by searching for the insulator length closest to the true value, which is set as the median value of those extraction results. Other parameters, such as the threshold for determining the type of tension tower, can be easily established.
Our method is stable by involving prior knowledge about the structure of the tower and the conductor. The separation of insulators based on point features is primarily influenced by two factors. Firstly, due to obstacles, such as towers and varying flight heights, the insulator points obtained by the UAV may be partially missing or have low density. As a result, the search radius of the point is difficult to determine, or the feature calculation results are inaccurate [14,17]. Secondly, other objects, such as transmission wires and pole-shaped objects, may have similar features as the insulator [17]. The proposed method determines the two boundary planes of the insulator based on the structure of the tower and conductor, avoiding the occurrence of the above two situations.
The data source is also an important factor for insulator extraction. Early studies mainly used terrestrial laser scanning (TLS) for insulator measuring [35,36]. As TLS can capture enough details of the insulator, our method can be used for the insulator extraction in the TLS point cloud theoretically, as long as the power line can be correctly separated. However, it is limited in wide applications on a large scale because of the complex environment along the transmission corridor and the low working efficiency. Cable inspection robot (CIR) LiDAR is another way to capture enough insulator points [37]. However, due to its high cost, low flexibility, and more complex data processing, there is little research on this type of data for now. Airborne laser scanning (ALS) has a similar scanning view as UAV Lidar, but as the flight height of ALS is much larger than UAV, the density of ALS point cloud is much smaller, e.g., several points/m2 (ALS) versus hundreds of points/m2 (UAV). In some cases, there is no point captured on the insulator. Thus, it is difficult to extract the insulator from an ALS point cloud, and recognition methods based on ALS mainly focus on large targets, such as pylons and powerlines [14,38].
In summary, the proposed method can achieve ideal results for UVA point clouds, which can well preserve the overall geometric characteristics of the insulator. Due to the gradual maturity and popularization of UAV LiDAR, the proposed method has great application prospects.

5. Conclusions

In this study, multiple types of feature histograms are proposed to extract the insulator in terms of different pylon types, insulator locations, and directions. Then, an adaptive method of multi-scale histograms is proposed based on prior knowledge about the design standard of the tower to solve the problem of parameter setting and improve efficiency. The experiments show that our method can extract various types of insulators (including suspension, tension, and inclined type) accurately and efficiently from both suspension and tension pylons. Compared with the commonly used point feature-based method, our method is much faster, as the processing primitive is a histogram rather than a single point and is more accurate, especially at the end position of the insulator. The results also show that involving prior knowledge about the pylon and powerline can improve the accuracy of object recognition.
For cases where the extraction accuracy from a minority of tension towers is low, future considerations may involve integrating more expert knowledge and developing additional histogram features, such as point density along the transmission direction, to address this issue. Additionally, for scenarios where surge arresters are present, further exploration is needed.

Author Contributions

Conceptualization, M.C. and J.L.; methodology, J.L.; software, J.L.; writing—original draft preparation, J.L.; writing—review and editing, M.C.; supervision, C.J.; project administration, W.M.; funding acquisition, J.P. All authors have read and agreed to the published version of the manuscript.

Funding

This research was Supported by grants from the National Natural Science Foundation of China (41801394), Key R&D Program of Ningxia Autonomous Region (2022CMG02014), Open Project of Technology Innovation Center for Spatiotemporal Information and Equipment of Intelligent City (STIEIC-KF202305), Chongqing Natural Science Foundation (CSTB2023NSCQ-MSX0967), Chongqing Natural Science Foundation (cstc2021jcyj-msxmX1147), and Chongqing Jiaotong University (2023S0127).

Data Availability Statement

No new data were created or analyzed in this study. Data sharing is not applicable.

Conflicts of Interest

The authors declare no conflicts of interest.

References

  1. Li, X.F.; Su, H.S.; Liu, G.H. Insulator Defect Recognition Based on Global Detection and Local Segmentation. IEEE Access 2020, 8, 59934–59946. [Google Scholar] [CrossRef]
  2. Zhai, Y.J.; Wang, D.; Zhang, M.L.; Wang, J.R.; Guo, F. Fault detection of insulator based on saliency and adaptive morphology. Multimed. Tools Appl. 2017, 76, 12051–12064. [Google Scholar] [CrossRef]
  3. Shakhatreh, H.; Sawalmeh, A.H.; Al-Fuqaha, A.; Dou, Z.; Almaita, E.; Khalil, I.; Othman, N.S.; Khreishah, A.; Guizani, M. Unmanned aerial vehicles (UAVs): A survey on civil applications and key research challenges. IEEE Access 2019, 7, 48572–48634. [Google Scholar] [CrossRef]
  4. Zhang, Z.X.; Zhu, L.X. A Review on Unmanned Aerial Vehicle Remote Sensing: Platforms, Sensors, Data Processing Methods, and Applications. Drones 2023, 7, 398. [Google Scholar] [CrossRef]
  5. Wu, Q.G.; An, J.B.; Lin, B. A Texture Segmentation Algorithm Based on PCA and Global Minimization Active Contour Model for Aerial Insulator Images. IEEE J. Sel. Top. Appl. Earth Observ. Remote Sens. 2012, 5, 1509–1518. [Google Scholar] [CrossRef]
  6. Liao, S.; An, J. A robust insulator detection algorithm based on local features and spatial orders for aerial images. IEEE Geosci. Remote Sens. Lett. 2014, 12, 963–967. [Google Scholar] [CrossRef]
  7. Wei, N.; Li, X.Y.; Jin, J.Q.; Chen, P.; Sun, S.F. Detecting Insulator Strings as Linked Chain Structure in Smart Grid Inspection. IEEE Trans. Ind. Inform. 2023, 19, 9019–9027. [Google Scholar] [CrossRef]
  8. Chen, K.; Liu, X.; Jia, L. Insulator defect detection based on lightweight network and enhanced multi-scale feature fusion. High Volt. Eng. 2023, 1, 1–14. [Google Scholar]
  9. Zhou, F.R.; Jin, W.S.; Zheng, Z.Z.; Mou, F.; Li, Z.N.; Ma, Y.T.; Wei, B.; Huang, S.D.; Wang, Q. Insulator Detection for High-Resolution Satellite Images Based on Deep Learning. IEEE Geosci. Remote Sens. Lett. 2023, 20, 5001105. [Google Scholar] [CrossRef]
  10. Bisheng, Y.; Fuxun, L.; Ronggang, H. Progress, challenges and perspectives of 3D LiDAR point cloud processing. Acta Geod. Et Cartogr. Sin. 2017, 46, 1509. [Google Scholar]
  11. Mills, S.J.; Castro, M.P.G.; Li, Z.R.; Cai, J.H.; Hayward, R.; Mejias, L.; Walker, R.A. Evaluation of Aerial Remote Sensing Techniques for Vegetation Management in Power-Line Corridors. IEEE Trans. Geosci. Remote Sens. 2010, 48, 3379–3390. [Google Scholar] [CrossRef]
  12. You, H.T.; Tang, X.; You, Q.X.; Liu, Y.; Chen, J.J.; Wang, F. Study on the Differences between the Extraction Results of the Structural Parameters of Individual Trees for Different Tree Species Based on UAV LiDAR and High-Resolution RGB Images. Drones 2023, 7, 317. [Google Scholar] [CrossRef]
  13. Toth, C.; Józków, G. Remote sensing platforms and sensors: A survey. ISPRS—J. Photogramm. Remote Sens. 2016, 115, 22–36. [Google Scholar] [CrossRef]
  14. Ortega, S.; Trujillo, A.; Santana, J.M.; Suarez, J.P.; Santana, J. Characterization and modeling of power line corridor elements from LiDAR point clouds. ISPRS—J. Photogramm. Remote Sens. 2019, 152, 24–33. [Google Scholar] [CrossRef]
  15. Chen, S.C.; Wang, C.; Dai, H.Y.; Zhang, H.B.; Pan, F.F.; Xi, X.H.; Yan, Y.G.; Wang, P.; Yang, X.B.; Zhu, X.X.; et al. Power Pylon Reconstruction Based on Abstract Template Structures Using Airborne LiDAR Data. Remote Sens. 2019, 11, 1579. [Google Scholar] [CrossRef]
  16. Guan, H.C.; Sun, X.L.; Su, Y.J.; Hu, T.Y.; Wang, H.T.; Wang, H.P.; Peng, C.G.; Guo, Q.H. UAV-lidar aids automatic intelligent powerline inspection. Int. J. Electr. Power Energy Syst. 2021, 130, 11. [Google Scholar] [CrossRef]
  17. Tang, J.; Tan, J.X.; Du, Y.Y.; Zhao, H.J.; Li, S.D.; Yang, R.H.; Zhang, T.; Li, Q.T. Quantifying Multi-Scale Performance of Geometric Features for Efficient Extraction of Insulators from Point Clouds. Remote Sens. 2023, 15, 3339. [Google Scholar] [CrossRef]
  18. Liu, X.N.; Shuang, F.; Li, Y.; Zhang, L.Q.; Huang, X.W.; Qin, J.C. SS-IPLE: Semantic Segmentation of Electric Power Corridor Scene and Individual Power Line Extraction From UAV-Based Lidar Point Cloud. IEEE J. Sel. Top. Appl. Earth Observ. Remote Sens. 2023, 16, 45–50. [Google Scholar] [CrossRef]
  19. Zhao, W.B.; Dong, Q.; Zuo, Z.L. A point cloud segmentation method for power lines and towers based on a combination of multiscale density features and point-based deep learning. Int. J. Digit. Earth 2023, 16, 620–644. [Google Scholar] [CrossRef]
  20. Zhu, S.; Li, Q.; Zhao, J.W.; Zhang, C.G.; Zhao, G.; Li, L.; Chen, Z.H.; Chen, Y.P. A Deep-Learning-Based Method for Extracting an Arbitrary Number of Individual Power Lines from UAV-Mounted Laser Scanning Point Clouds. Remote Sens. 2024, 16, 393. [Google Scholar] [CrossRef]
  21. Zhang, R.Z.; Yang, B.S.; Xiao, W.; Liang, F.X.; Liu, Y.; Wang, Z.M. Automatic Extraction of High-Voltage Power Transmission Objects from UAV Lidar Point Clouds. Remote Sens. 2019, 11, 2600. [Google Scholar] [CrossRef]
  22. Yang, S.Y. Research on Classification Method of Insulators Based on Point Cloud; North China Electric Power University: Beijing, China, 2020. [Google Scholar]
  23. Zeng, X.; Chen, B.J.; Pan, L.; Li, C.L.; Jiang, B. Power grid insulator identification method based on airborne laser point cloud. Laser Technol. 2023, 47, 80–86. [Google Scholar]
  24. Li, J.B.; Jian, X.; Chen, J.; Wu, C.Q.; Chen, X.; Hu, C.Y. Precise Positioning Method for Insulator Sheds Based on Depth Horizontal Histogram. IEEE Access 2022, 10, 59522–59533. [Google Scholar] [CrossRef]
  25. Sun, Y.P.; Chen, X.; Jian, X.; Xiao, Z. Identification and localization method of the insulator based on three-dimensional point cloud modeling. In Proceedings of the 38th Chinese Control Conference (CCC), Guangzhou, China, 27–30 July 2019; pp. 7051–7056. [Google Scholar]
  26. Ester, M.; Kriegel, H.P.; Sander, J.; Xu, X. A Density-Based Algorithm for Discovering Clusters in Large Spatial Databases with Noise. In Proceedings of the National Conferences on Aritificial Intelligence, Portland, OR, USA, 2–4 August 1999. [Google Scholar]
  27. Feng, H.F.; Chen, Y.P.; Luo, Z.P.; Sun, W.T.; Li, W.; Li, J. Automated extraction of building instances from dual-channel airborne LiDAR point clouds. Int. J. Appl. Earth Obs. Geoinf. 2022, 114, 11. [Google Scholar] [CrossRef]
  28. Chen, M.L.; Zhang, X.Y.; Ji, C.C.; Pan, J.P.; Mu, F.Y. Using Relative Projection Density for Classification of Terrestrial Laser Scanning Data with Unknown Angular Resolution. Remote Sens. 2022, 14, 6043. [Google Scholar] [CrossRef]
  29. dos Santos, R.C.; Galo, M.; Carrilho, A.C. Extraction of Building Roof Boundaries From LiDAR Data Using an Adaptive Alpha-Shape Algorithm. IEEE Geosci. Remote Sens. Lett. 2019, 16, 1289–1293. [Google Scholar] [CrossRef]
  30. Fischler, M.A.; Bolles, R.C. Random Sample Consensus: A Paradigm for Model Fitting with Applications To Image Analysis and Automated Cartography. Commun. ACM 1981, 24, 381–395. [Google Scholar] [CrossRef]
  31. Tan, J.X.; Zhao, H.J.; Yang, R.H.; Liu, H.; Li, S.D.; Liu, J.F. An Entropy-Weighting Method for Efficient Power-Line Feature Evaluation and Extraction from LiDAR Point Clouds. Remote Sens. 2021, 13, 3446. [Google Scholar] [CrossRef]
  32. Chen, M.L.; Pan, J.P.; Xu, J.Z. Classification of Terrestrial Laser Scanning Data With Density-Adaptive Geometric Features. IEEE Geosci. Remote Sens. Lett. 2018, 15, 1795–1799. [Google Scholar] [CrossRef]
  33. Chen, M.L.; Liu, X.J.; Pan, J.P.; Mu, F.Y.; Zhao, L.D. Stem Detection from Terrestrial Laser Scanning Data with Features Selected via Stem-Based Evaluation. Forests 2023, 14, 2035. [Google Scholar] [CrossRef]
  34. Jung, J.; Che, E.Z.; Olsen, M.J.; Shafer, K.C. Automated and efficient powerline extraction from laser scanning data using a voxel-based subsampling with hierarchical approach. ISPRS—J. Photogramm. Remote Sens. 2020, 163, 343–361. [Google Scholar] [CrossRef]
  35. Arastounia, M.; Lichti, D. Automatic extraction of insulators from 3D LiDAR data of an electrical substation. ISPRS Ann. Photogramm. Remote Sens. Spat. Inf. Sci. 2013, 2, 19–24. [Google Scholar] [CrossRef]
  36. Arastounia, M.; Lichti, D.D. Automatic object extraction from electrical substation point clouds. Remote Sens. 2015, 7, 15605–15629. [Google Scholar] [CrossRef]
  37. Qin, X.Y.; Wu, G.P.; Lei, J.; Fan, F.; Ye, X.H. Detecting Inspection Objects of Power Line from Cable Inspection Robot LiDAR Data. Sensors 2018, 18, 1284. [Google Scholar] [CrossRef]
  38. Awrangjeb, M.; Gao, Y.; Lu, G. Classifier-free extraction of power line wires from point cloud data. In Proceedings of the 2018 Digital Image Computing: Techniques and Applications (DICTA), Canberra, Australia, 10–13 December 2018; pp. 1–7. [Google Scholar]
Figure 1. Insulator extraction process.
Drones 08 00241 g001
Figure 2. Preliminary separation. (a) Rough separation of power line and tower. (red: ground; grey: pylon; cyan: power line) (b) Resulting single power lines (SPLs) from clustering (red: ground; grey: pylon; rendered with random color: SPL).
Drones 08 00241 g002
Figure 3. Pylon type identification: (a) single power line (SPL) in tension pylon; (b) SPL in suspension pylon; (c,d) projection of the half SPLs (HSPLs); (e,f) vertical void (VV) histograms.
Drones 08 00241 g003
Figure 4. Horizontal density histogram: (a) projection of pylon points on X′Z plane; (b) horizontal density histogram; (c) enhanced horizontal density histogram.
Drones 08 00241 g004
Figure 5. Crossarm boundary fitting: (a) cutting pylon points (red: resulted slice; blue: power line); (b) edge fitting result; (c) cutting pylon points for transverse power line (red: resulted slice; blue: power line); (d) edge fitting result.
Drones 08 00241 g005
Figure 6. Redirecting the single power lines (SPLs) of suspension pylon. (a) Projection of SPL (red: the projected SPL; green: other SPLs; blue: pylon; grey: projection plane); (b,d) projection results; (c,e) results of redirection.
Drones 08 00241 g006
Figure 7. Histogram characteristics of insulator in suspension pylon: (a) projection of single power line (SPL) points on the Y′Z plane; (b) void histogram (red boxes: zero-valued bin); (c) horizontal density (HD) histogram; (d) horizontal density difference (HDD) histogram.
Drones 08 00241 g007
Figure 12. Calculation of vertical segmentation position. (a) Projection of jumper conductor (JC) on the Y′Z plane; (b) projection of points near the insulator; (c) horizontal width (HW) histogram and vertical segmentation position; (d) extraction result of suspension insulator.
Drones 08 00241 g012
Figure 13. Extraction of cable-stayed insulator: (a) Cable-stayed single power lines (SPL) (grey: pylon, red: SPL); (b) Projection on the X′Z plane; (c) horizontal width (HW) histogram.
Drones 08 00241 g013
Figure 14. Extraction of insulator connected to the tower. (a) Power line on one side of the tower (grey: pylon, bule and red: HSPL). (b) Jumper conductor (JC) and transmission conductor (TC) separation position. (c) Horizontal insulator separation position.
Drones 08 00241 g014
Figure 15. Experimental data (grey: ground, red: pylon, green: power line). (a) Transmission corridor 1. (b) Transmission corridor 2.
Drones 08 00241 g015
Figure 16. Types of pylons (grey: pylon, bule: power line, red: insulator).
Drones 08 00241 g016
Figure 17. Comparison between the adaptive extraction and the extraction using fixed grid width. (a) Results of the suspension pylon in Data 1. (b) Results of the tension pylon in Data 1. (c) Results of the suspension pylon in Data 2. (d) Results of the tension pylon in Data 2.
Drones 08 00241 g017
Figure 18. Extraction results for different types of suspension tower in Figure 16 (grey: pylons, red: insulators, green: power lines).
Drones 08 00241 g018
Figure 19. Extraction results of tension tower (grey: pylons, red: insulators, green: power lines). (a,b) Extraction results of two types of tension insulators; (c,d) projection of results on the X′Y′ plane; (e,f) projection of results on the Y′Z plane.
Drones 08 00241 g019
Table 1. Data information.
Length of TC (m)Number of Original PointsNumber of Pre-Extraction PointsNumber of Suspension PylonsNumber of
Tension Pylons
Point Density (pts/m2)
Data 151,452238,486,8045,081,4669543106.3
Data 222,956104,473,9645,059,8132938223.6
Table 2. Extraction accuracy.
Suspension PylonsTension Pylons
PRF1RiPRF1Ri
Data 10.930.920.92100%0.880.900.8997.3%
Data 20.920.880.90100%0.870.930.9096.5%
Table 3. Comparison result.
Tower LabelPts NumPoint Feature-Based MethodProposed Method
PRF1T(s)PRF1T(s)
tower a89010.830.530.65584.80.980.900.940.212
tower b788310.680.81485.10.980.940.960.192
tower c29,7200.810.410.557213.90.960.820.890.332
tower d15,6550.830.240.371947.80.930.850.890.212
tower e472010.480.53157.410.900.950.192
tower f761910.520.69434.40.860.960.911.157
tower g12,8260.850.370.521040.50.970.830.901.170
tower h22,1460.800.620.693373.60.880.900.891.728
Disclaimer/Publisher’s Note: The statements, opinions and data contained in all publications are solely those of the individual author(s) and contributor(s) and not of MDPI and/or the editor(s). MDPI and/or the editor(s) disclaim responsibility for any injury to people or property resulting from any ideas, methods, instructions or products referred to in the content.

