Article

ID-Det: Insulator Burst Defect Detection from UAV Inspection Imagery of Power Transmission Facilities

1
State Key Laboratory of Information Engineering in Surveying, Mapping and Remote Sensing, Wuhan University, Wuhan 430072, China
2
Engineering Research Centre for Spatio-Temporal Data Acquisition and Smart Application (STSA), Ministry of Education in China, Wuhan 430072, China
3
Institute of Artificial Intelligence in Geomatics, Wuhan University, Wuhan 430072, China
4
Institute of Artificial Intelligence, School of Computer Science, Wuhan University, Wuhan 430072, China
5
China Electric Power Research Institute Co., Ltd., Wuhan 430074, China
*
Author to whom correspondence should be addressed.
Drones 2024, 8(7), 299; https://doi.org/10.3390/drones8070299
Submission received: 28 May 2024 / Revised: 26 June 2024 / Accepted: 2 July 2024 / Published: 5 July 2024
(This article belongs to the Special Issue Resilient UAV Autonomy and Remote Sensing: 2nd Edition)

Abstract

:
The global rise in electricity demand necessitates extensive transmission infrastructure, where insulators play a critical role in ensuring the safe operation of power transmission systems. However, insulators are susceptible to burst defects, which can compromise system safety. To address this issue, we propose an insulator defect detection framework, ID-Det, which comprises two main components, i.e., the Insulator Segmentation Network (ISNet) and the Insulator Burst Detector (IBD). (1) ISNet incorporates a novel Insulator Clipping Module (ICM), enhancing insulator segmentation performance. (2) IBD leverages corner extraction methods and the periodic distribution characteristics of corners, facilitating the extraction of key corners on the insulator mask and accurate localization of burst defects. Additionally, we construct an Insulator Defect Dataset (ID Dataset) consisting of 1614 insulator images. Experiments on this dataset demonstrate that ID-Det achieves an accuracy of 97.38%, a precision of 97.38%, and a recall rate of 94.56%, outperforming general defect detection methods with a 4.33% increase in accuracy, a 5.26% increase in precision, and a 2.364% increase in recall. ISNet also shows a 27.2% improvement in Average Precision (AP) compared to the baseline. These results indicate that ID-Det has significant potential for practical application in power inspection.

1. Introduction

Electricity is a major energy source consumed worldwide, with demand projected to increase by more than 80–150% by 2050 [1]. However, there is a global imbalance between the supply and demand of power resources. For instance, in China, energy resources are primarily located in the west and north, whereas the demand centers are in the east and south [2]. Consequently, transmission corridors play a crucial role in the allocation of power resources. Insulators are critical components of transmission lines, serving to suspend the wires and insulate them from the towers and the ground. However, since insulators are predominantly used in outdoor transmission lines, they are susceptible to failures such as bursting during prolonged operation, introducing potential safety risks like transmission line interruptions and widespread power outages, and insulator defects can be classified into various types, including burst, pollution, flashover, leakage current, and other defects [3]. Burst can potentially cause the loss of insulator discs. Traditional transmission line inspections, which rely on manual field inspections [4], are inefficient. These conventional methods face numerous limitations, such as harsh environmental conditions, and pose significant safety risks to the inspection personnel.
Power inspection is increasingly adopting unmanned systems [4], with their technological development progressing rapidly [5,6,7,8,9,10,11]. As one of the important unmanned system platforms, UAVs are widely used for real-time mapping [5] and power inspection [6]. UAV technology can significantly reduce the workload of operation and maintenance personnel while enhancing efficiency, making unmanned power inspections a current trend. Recent advancements have led to the development of multi-modal UAVs for power line inspections [12]. By optimizing energy consumption and designing hardware and algorithms to enhance time efficiency, UAVs significantly reduce the operational costs associated with power line inspections. Their efficiency greatly surpasses that of traditional manual inspection methods. UAVs can significantly enhance the efficiency of power line inspections. They are capable of flying at speeds of up to 12 km/h for durations ranging from 20 to 40 min, which is considerably faster than manual inspection methods [13]. This increased speed and efficiency allow UAVs to cover larger areas in less time, improving the overall effectiveness of the inspection process. Currently, transmission line inspection workers gather extensive image, video, and other data through UAVs and similar aerial platforms. However, the reliance on manual interpretation of this data results in low levels of automation and introduces substantial instability. This manual process is prone to major omissions and misjudgments, posing significant risks and increasing costs. Due to the small size of insulator defects, automating insulator defect detection is challenging, and there are currently few studies addressing this issue [14].
To address the problem, we propose ID-Det, an insulator defect detection framework, to efficiently detect insulator bursts in UAV images and accurately locate the position of the bursts. Firstly, insulator detection is performed on UAV tilted images using object detection to obtain insulator instance images in UAV inspection images, then the detected insulators are rotated to horizontal by the principal component analysis (PCA) module. To reduce the labeling cost of training and improve the training efficiency, we propose an Insulator Clipping Module (ICM), where individual insulators and their labels are fed to the Insulator Segmentation Network (ISNet) after passing through the ICM. ISNet is trained, which uses polar coordinate-based data representation to improve training efficiency. The segmented resultant image chunks (i.e., chips) are re-obtained from a Chips Stitching Module (CSM). Then, the segmentation results are fed to the Insulator Burst Detector (IBD), which is based on the periodic feature distribution of the corner points to obtain the exact location of the insulator burst. The main contributions of this work can be summarized as follows:
  • Insulator Segmentation Network (ISNet) is proposed to achieve insulator segmentation from cluttered background. The performance of insulator segmentation far exceeds that of the Baseline method, and the edges of the segmentation result are refined.
  • Insulator Burst Detector (IBD) is proposed based on corner point detection and periodic feature distribution of corner points to realize insulator burst detection and localization in transmission lines. The experimental results show that IBD achieves robust and better detection and localization of insulator bursts compared to direct detectors based on deep learning.
  • An Insulator Defect Dataset (ID dataset) with 1614 insulator instances is constructed for experiment. ISNet achieves edge-refined insulator segmentation results with a 27.2% improvement in AP compared to baseline [15]. The proposed insulator defect detection framework ID-Det achieves 97.27% accuracy, 97.38% precision, and 94.56% recall on the ID dataset and outperforms the general object detection-based methods.
This paper is organized into six sections. Section 1 introduces the research background and methodology. In Section 2, we summarize related work on UAV power inspection and insulator defect detection. Section 3 provides a detailed description of the ID-Det structure. Section 4 presents experiments conducted to validate the effectiveness of the proposed method, and Section 5 discusses the impact of ID-Det. Finally, Section 6 concludes the paper.

2. Related Work

In this section, we summarize the current state of research on UAV power inspection and insulator defect detection.

2.1. UAV Power Inspection

To alleviate the pressure of power system maintenance, several mature technical solutions have been developed to address UAV power inspection. In terms of power inspection data utilization, Yang et al. proposed an automatic alignment method for airborne sequence images and LiDAR data [16], which realize the high-precision and robust alignment of sequence images and LiDAR point cloud data captured by UAV and provide a multi-source database for power inspection. Chen et al. proposed an automatic gap anomaly detection method using LiDAR point clouds collected by unmanned aerial vehicles (UAVs) [17], which can effectively detect clearing hazards such as tree encroachment in power corridors, and the accuracy of clearing measurements reaches the decimeter level. In order to improve the intelligence of power inspection and relieve the work pressure of power personnel, Kähler et al. proposed a multimodal sensor system that integrated multiple data sources and digitally displayed power equipment, facilitating indoor inspection of equipment status [18]. Avila et al. proposed an above-ground, indoor autonomous power inspection system using the Quanser Qdrone [19], which is designed for inspections of internal facilities such as indoor distribution rooms and relay protection rooms. Guan et al. proposed a LIDAR-assisted UAV-autonomous power line inspection system to complete the whole process of power line inspection, demonstrating that LIDAR can contribute to the intelligence of power line inspection [20]. In addition to the single-device/robot power line inspection system, Vemula et al. proposed a human–robot cooperative power line inspection system by using a heterogeneous system consisting of humans, unmanned vehicles, and UAVs to perform the inspection of power facilities within a certain area [21].
There are also several methods aimed at the automated identification of key components in power facilities, significantly reducing the labor costs associated with power inspections. References [22,23,24] utilize traditional image processing techniques to segment insulators from UAV images, achieving clear edge delineation. However, these methods are complex and lack robustness. Gao et al. proposed an improved insulator pixel-level segmentation conditional generative adversarial network, achieving good segmentation results, though the edges remain insufficiently detailed [25]. Tan et al. used SSD for insulator detection, followed by DenseNet for classification, effectively enhancing the efficiency of power line inspections through accurate insulator detection and classification [26].
Although existing power inspection programs and systems have enhanced the intelligence of power inspections, they still fall short in fully automating power data processing. The intelligence level for insulator defect detection remains limited. The comprehensive process of an intelligent power inspection system, particularly for image defect detection, requires further exploration.

2.2. Insulator Defect Detection

Since insulators are exposed to the external environment for a long time, insulators are prone to burst defects. Insulator defect detection primarily focuses on identifying burst defects in transmission line insulators. Most detection algorithms are implemented using object detection and semantic segmentation techniques.

2.2.1. Object Detection-Based Methods

As one of the fundamental tasks in computer vision, object detection has received much attention and is widely used in all walks of life. Deep learning technology has greatly advanced the field of object detection [27]. Since AlexNet [28] was proposed in 2012, object detection technology has developed rapidly. YOLO [29] represents a pioneering approach that achieves a remarkably fast inference speed while maintaining a certain level of accuracy. However, it is important to note that YOLO still lags behind second-order object detection methods in terms of accuracy. Nevertheless, subsequent enhancements [30,31,32,33,34,35,36,37] have significantly improved the speed and accuracy of object detection, utilizing a single forward pass and a unified architecture to enable real-time processing. The introduction of SSD [38] has led to the development of multi-resolution detection methods, which have resulted in a notable enhancement in the accuracy of detecting small objects using multi-scale feature maps and default boxes, achieving a balance between speed and accuracy. RetinaNet [39] introduces a focal loss function, which directs the network’s attention towards samples containing errors during the training process to address class imbalance. This results in a notable improvement in detection accuracy. CornerNet [40] and CenterNet [41] both utilize key point-based approaches for object detection, identifying objects through their corners and centers, respectively, to improve accuracy and localization. DETR-based methods [42,43] employ transformers for object detection, thereby expanding the receptive field of neural networks. This marks the advent of an anchorless frame for object detection. The aforementioned single-stage object detection methods are employed with great frequency due to their remarkable efficacy.
Some researchers employ object detection techniques for the purpose of insulator defect detection. Prates et al. used CNN to detect insulators, achieving high accuracy in multi-task learning that simultaneously locates defects and classifies insulators, but the data used as well as verified were low-altitude simulations of the power plant [44]. Wang et al. constructed a new network based on ResNeSt [45] and added an improved RPN to detect insulator defects, significantly enhancing the detection accuracy and recall rate, but the images used were not those of real power plants [46]. Tao et al. proposed a CNN cascade detection network and constructed a CPLID dataset to localize and detect defects in insulators [47]. The data used were collected from real-world scenarios, indicating the proposed algorithm’s potential for practical application. Liu et al. proposed a CSPD-YOLO model [48], which utilizes a feature pyramid network and an improved loss function for defect detection. This approach significantly improves defect detection in insulator images with complex backgrounds. However, it is not effective enough for detecting small objects. Yi et al. proposed a lightweight model YOLO-S [49] based on YOLO for the detection of insulators and their defects. Although the model incorporates many lightweight operations, its accuracy is not very high. Similarly, Zhang et al. improved YOLOv5 for insulator defect detection, reducing the number of parameters in the original model. This allows for real-time detection on UAV-embedded computing units, although the accuracy is limited [50]. Chen et al. proposed a method [51] using attention feedback and a dual-pyramid structure, which can identify insulator defects and obscured insulators in complex backgrounds. However, the prediction speed is relatively slow.
Although methods based on object detection can detect insulator defects relatively quickly, the effect in the actual application process is not particularly good because of the many false detection and leakage detection phenomena in the process of insulator defect detection.

2.2.2. Segmentation-Based Methods

Semantic segmentation is one of the basic tasks of computer vision, which is the task of clustering pixels in an image. U-Net [52] is a very typical semantic segmentation model, which realizes an image segmentation method with fewer training samples by proposing a U-shaped codec structure. To solve the problem of rough segmentation results, DeepLab series is proposed. Deeplabv1 [53] solves the problem of information loss caused by pooling by proposing null convolution, which does not increase the number of parameters while increasing the sensing field, and further optimizes the segmentation accuracy by using the Conditional Random Fields (CRF); deeplabv2 [54] adds the Atrous Spatial Pyramid Pooling (ASPP) module on the basis of this, which improves the segmentation adaptability to objects of different scales; deeplabv3 [55] applies the atrous convolution to the cascade module and uses the improved ASPP module to obtain better results; deeplabv3+ [56] adds a simple but effective decoder module to deeplabv3 to optimize the segmentation result boundaries. With the introduction of the attention mechanism and diffusion model into computer vision, some new segmentation methods have emerged, and VLTSeg [57] and MetaPrompt-SD [58] models have achieved good results on the CityScape benchmark dataset [59]. However, the semantic segmentation task concentrates on the global pixel classification problem and not on the segmentation of some specific individual instances, so it tends to focus less on the segmentation performance of the instances and often has coarse segmentation edges. Some instance segmentation methods make up for this deficiency and improve the segmentation accuracy for individual instances. YOLACT [60] is mainly improved based on RetinaNet [39], SOLO [61,62] predicts the class of each pixel within an instance based on the position and size of the instance, TensorMask [63] uses a dense sliding window to separate instances for each pixel in a localized window, and Lei Ke et al. present Mask Transfiner [64], which uses a quadtree to represent image regions and handles only the tree nodes that are prone to error detection, improving efficiency and accuracy. Swin transformerv2 [65] improves the training stability on the basis of swin transformer [66], the model parameter scale reaches 3 billion, and a state-of-the-art (SOTA) result is realized on the COCO minival dataset. PolarMask [15] is a representative anchorless frame method, which uses polar coordinates to represent the instance segmentation result mask for the first time and reduces the complexity of instance segmentation simplified to almost the same as the target detection, both of which can obtain relatively accurate target mask edges.
Some researchers employed semantic segmentation or instance segmentation techniques for the purpose of insulator defect detection. Zuo et al. used the semantic segmentation method, directly through the segmentation results, to take affine transformations and other operations to determine the insulator defects, but the segmentation method used is a traditional digital image processing method, less efficient [67]. Cheng et al. employed color characteristics to segment the insulator, subsequently evaluating the insulator defect based on the length relationship of the insulator disks in space [68]. Li et al. utilized U-Net to segment the insulator and integrated the segmentation results with the target detection results to identify insulator defects [69]. Liu et al. proposed an insulator defect detection method based on unsupervised learning, though it was limited to contact ceramic insulators [70]. Alahyari et al. proposed a defect detection method based on semantic segmentation and image classification to classify the defects of insulators but did not locate the defects [71]. Antwi-Bekoe et al. proposed an insulator defect classification method based on instance segmentation, which only classified the defects of the insulator and did not locate the defects [72]. Guo et al. proposed an insulator defect segmentation head network [73] for segmenting insulator defect regions, achieving instance-level mask prediction. This approach significantly reduces the impact of complex backgrounds, but the prediction speed is relatively slow.
The summary of related work on insulator defect detection is presented in Table 1.
In general, the application of semantic segmentation technology for the purpose of defect detection is often impeded by the presence of rough segmentation edges, which has a detrimental impact on the efficacy of the defect detection process. Especially for narrow and long-shaped objects, such as insulators, some segmentation methods like PolarMask do not perform well. In this paper, ICM and CSM modules are proposed to effectively improve the segmentation performance for insulators. Current insulator defect detection methods lack sufficient localization accuracy for insulator detection in aerial images with complex backgrounds, or they simply assess the insulator status by predicting a defect score without pinpointing specific defects. To address these issues, we propose ID-Det, a method designed to detect and accurately localize insulator defects in complex backgrounds.

3. Methodology

Detecting and localizing insulator defects in UAV images with complex backgrounds has always been challenging. To address this, we propose ID-Det, a framework for insulator defect detection. ID-Det comprises two components, i.e., ISNet, an Insulator Segmentation Network based on the Insulator Clipping Module (ICM), and IBD, an Insulator Burst Detector that utilizes corner detection and the periodic distribution of corner features. Both processes are automated and do not require manual interaction. ISNet segments the insulator images into insulator masks, with the proposed ICM and CSM components effectively improving the segmentation of long and narrow objects, resulting in better-defined edges. Subsequently, the segmented insulator mask is used by the Insulator Burst Detector (IBD) to detect and precisely locate defects, utilizing corner extraction and the periodic distribution of corner features. The overall framework of the method is illustrated in Figure 1.

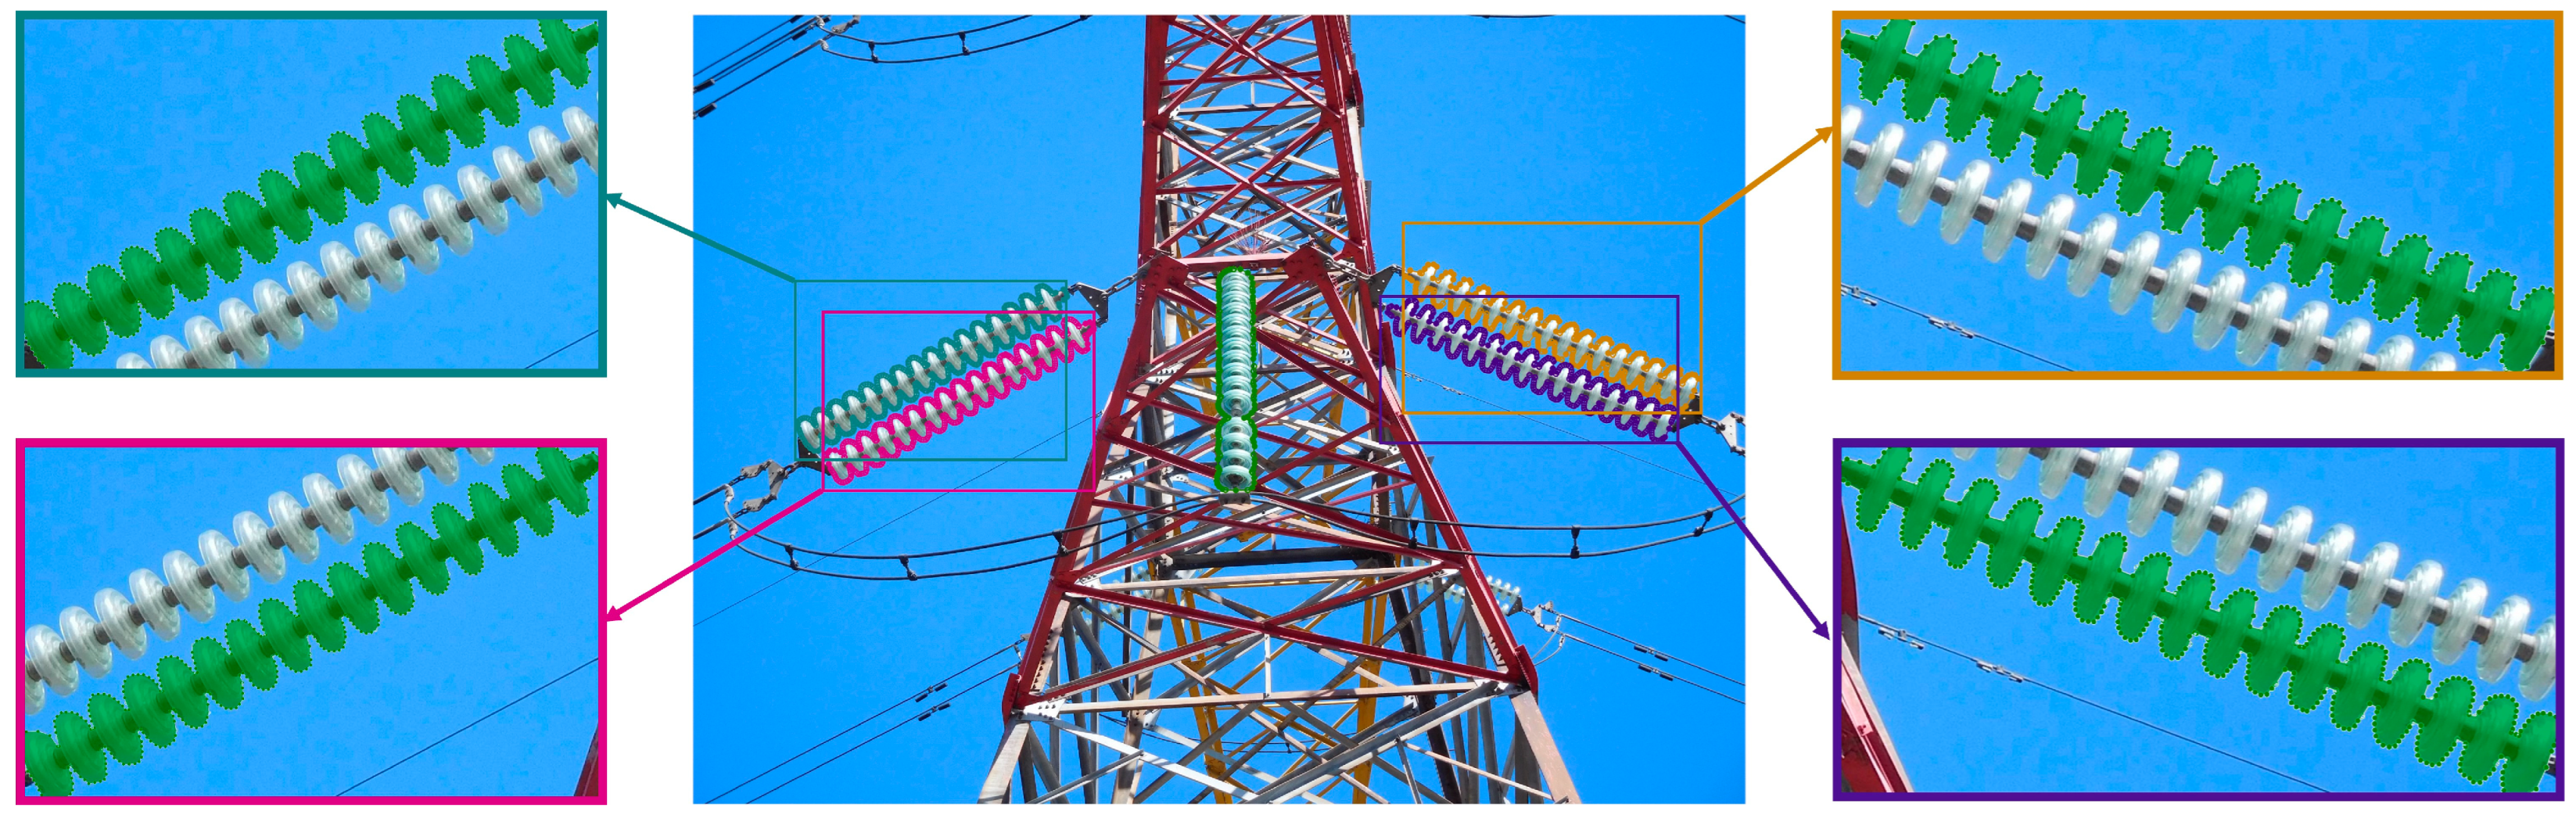
3.1. Insulator Segmentation Network (ISNet)

Before ISNet, a classic object detection network (in this paper, we use YOLOv8 [36]) is used to detect the insulator regions, which are then input into ISNet. As shown in Figure 1, ISNet consists of three parts, namely the Insulator Clipping Module (ICM), the network structure (backbone, neck, and head), and the Chips Stitching Module (CSM). Figure 2 shows the detailed structure of ISNet.

3.1.1. Insulator Clipping Module (ICM)

Although traditional segmentation methods with backbone network + neck structure and encoder–decoder structure (e.g., PolarMask [15], SegNet [74], U-Net [52], and ERFNet [75]) can fully access the multi-scale features of the image to improve the segmentation effect of targets with scale changes, for insulator targets that are long and narrow with large curvature-changing edges, this type of segmentation method is unable to accurately segment the edges, resulting in a degradation of the segmentation performance, and cannot be used to accurately access insulator edges and perform analysis. Considering the significant aspect ratio differences in insulator images, directly inputting them into the neural network may result in uneven feature extraction. Similar to the concept of token [76], we attempt to convert the elongated insulator instance into smaller unit chips. This allows the neural network to fully extract features from each part, thereby achieving better segmentation performance. ICM is innovatively proposed, which consists of a PCA Module and a Chips Module as shown in Figure 3. In the PCA Module, the insulators are first processed by preliminary binarization filtering, and then a PCA operator and a rotation operation are fused to output the insulator image rotated to horizontal by calculating the main orientation features of the input insulator image to obtain its orientation information in the image. Then, it is fed into the Chips Module, which is able to extract the length information of the shorter edges of the insulators and thus slice them into square insulator chips. We enhance the sensitivity of the network to insulator edges by processing insulator chips individually to improve the performance of the edges of the insulator segmentation results.

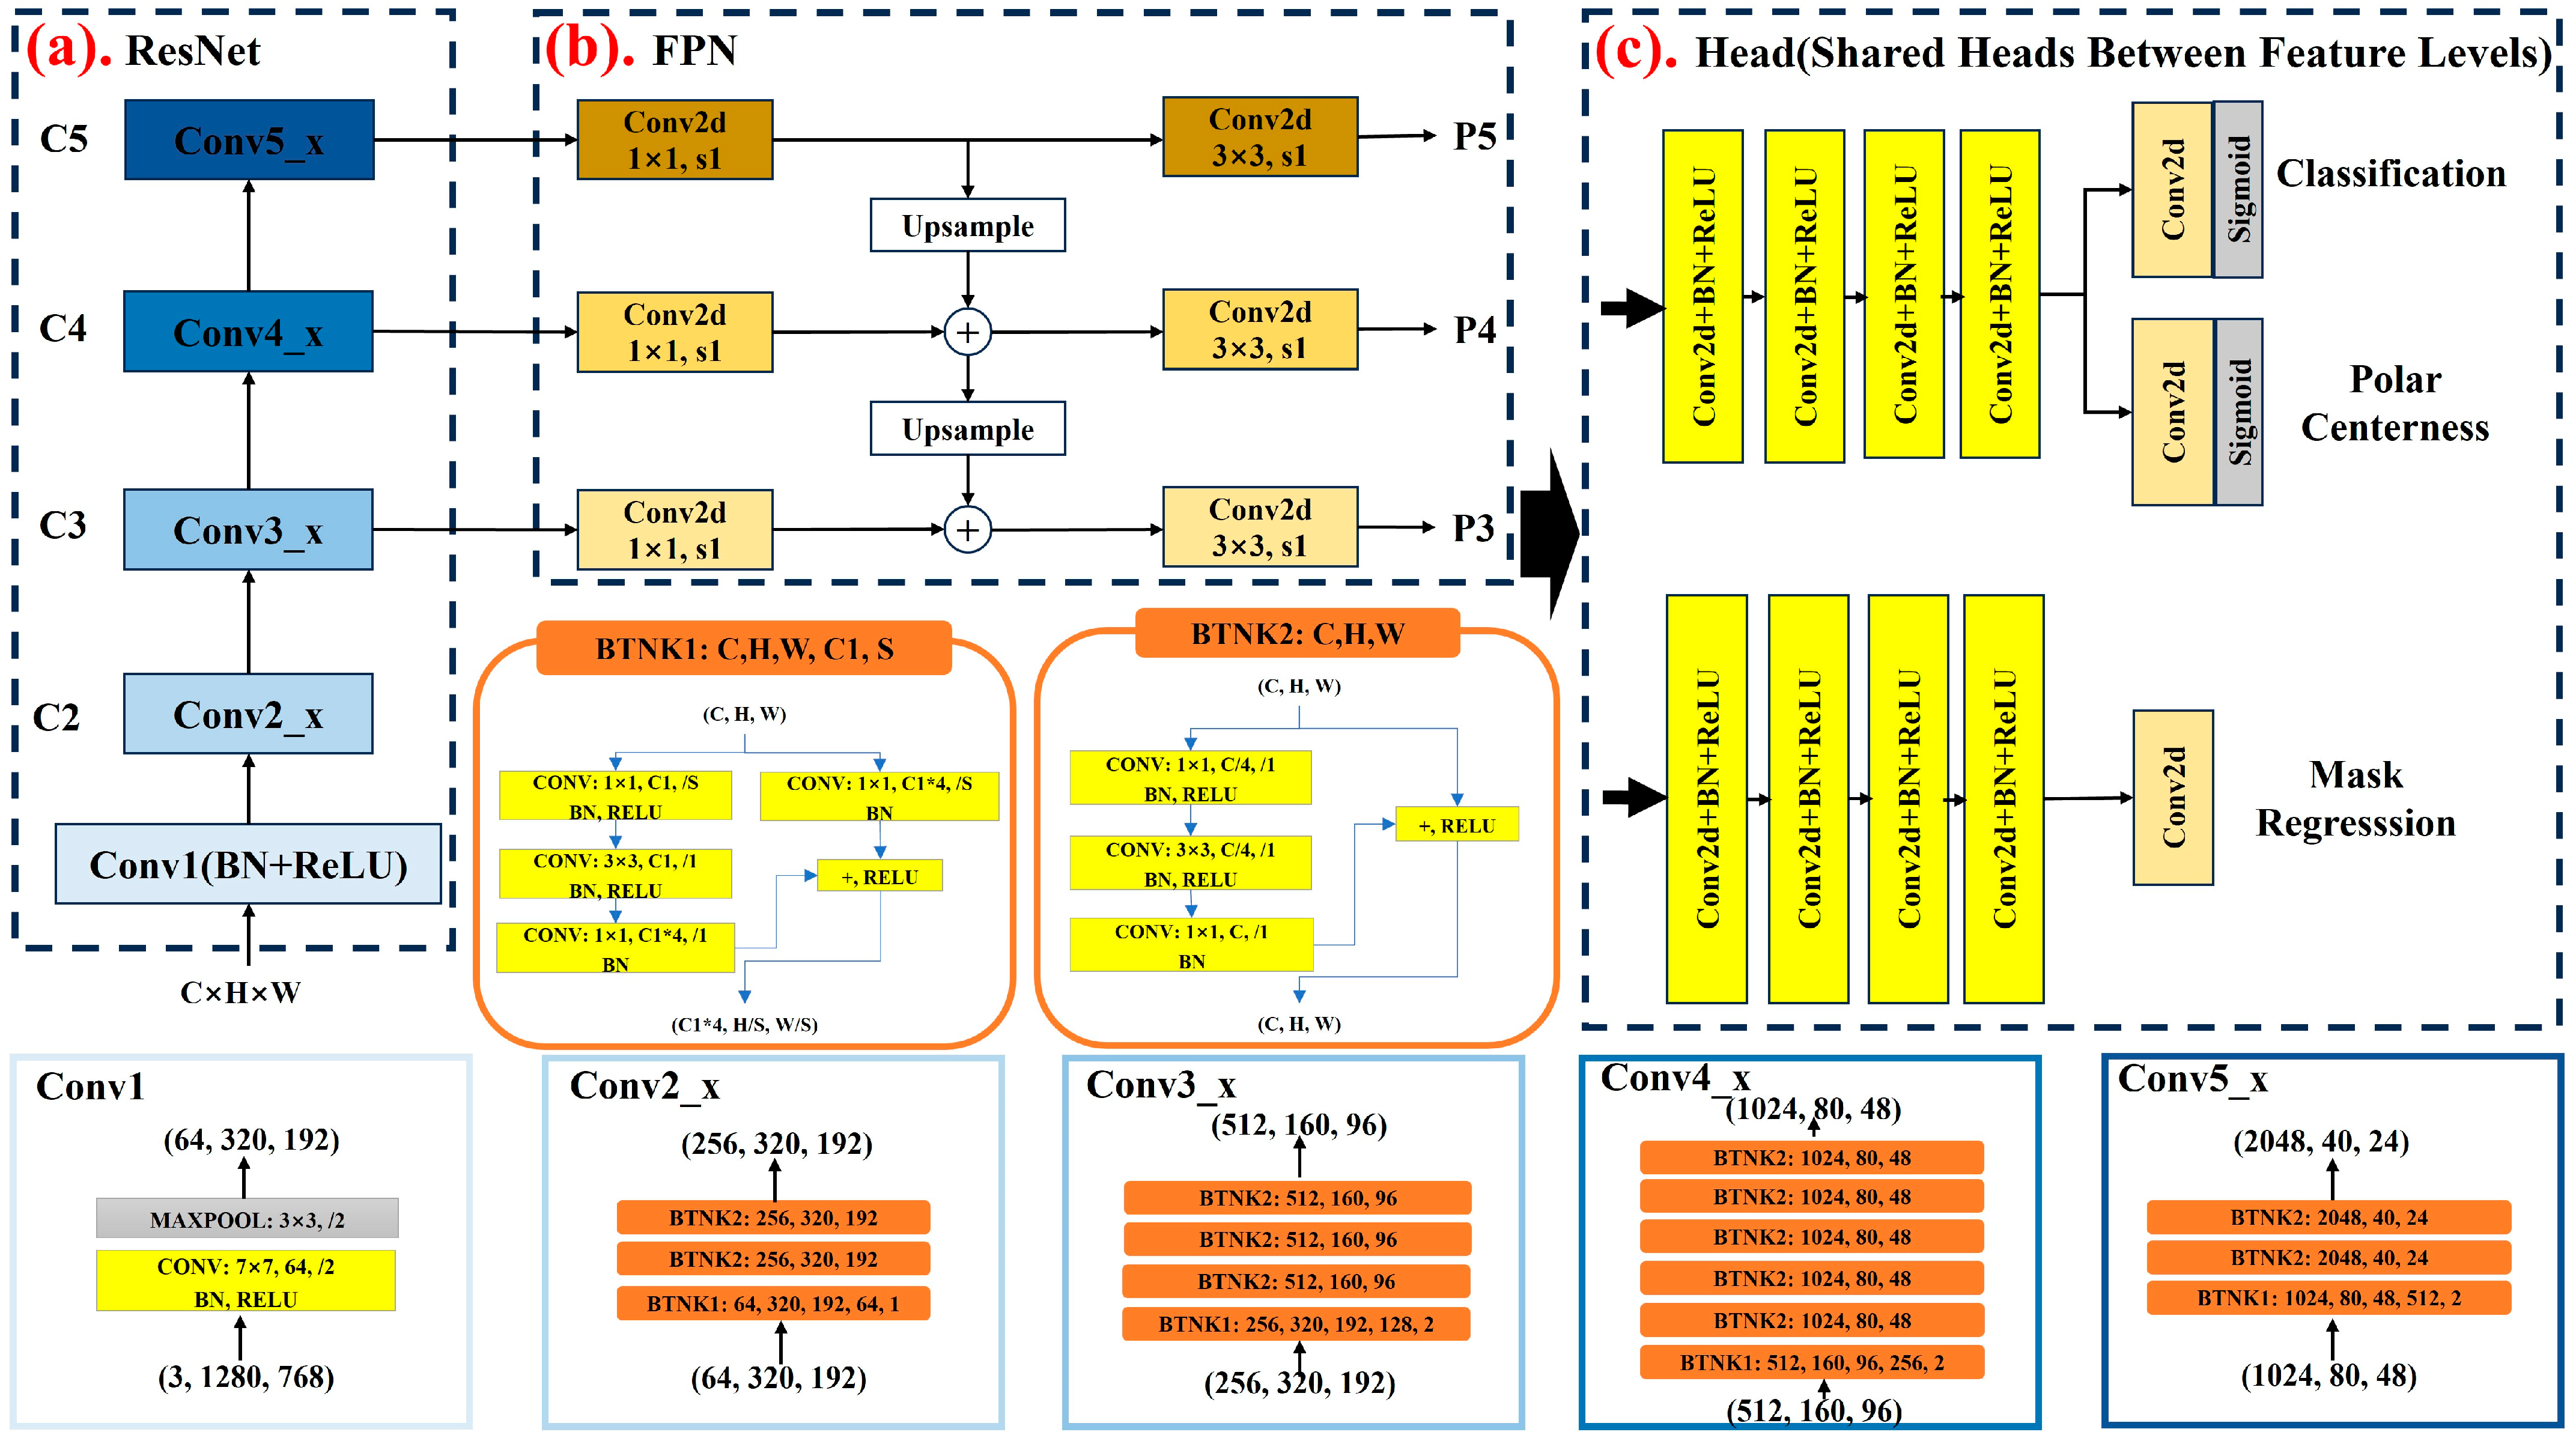
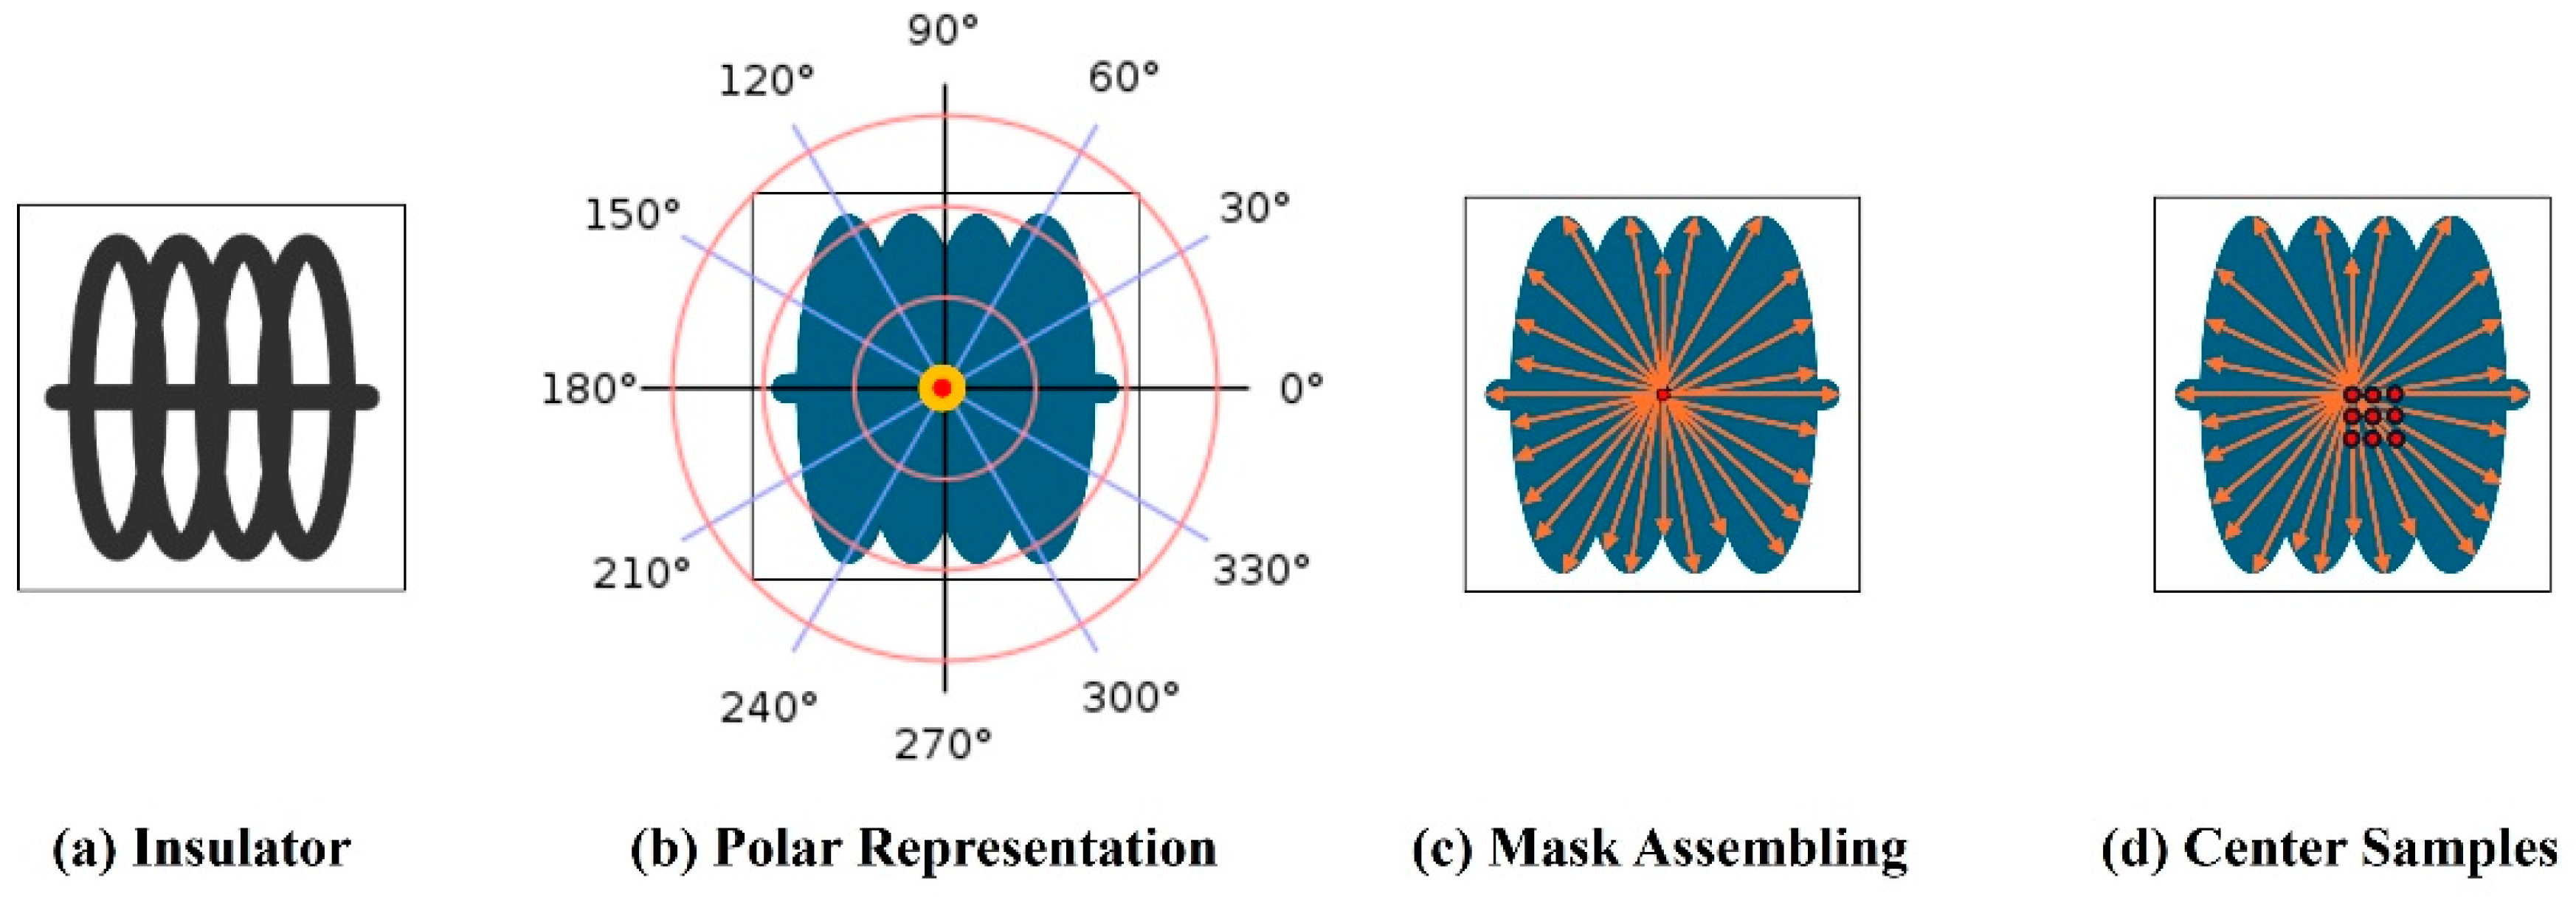
3.1.2. Backbone Network Structure and Insulator Polar Representation

Insulator chips are then fed into the backbone. As shown in Figure 4, the specific settings of convolutional layer components are inspired by FCOS [77]. The backbone part uses the basic ResNet50 [78] with downsampling ratios of 1/8, 1/16, and 1/32 for each convolutional level, and the corresponding levels of the feature pyramid network [79] also have the same ratios. We employed the image features extracted from the final three layers of ResNet50 to extract feature, in addition to the P3, P4, and P5 layers corresponding to the FPN. As illustrated in Figure 4a, the fundamental structure of ResNet50 employs the default configuration (the legend in Figure 4 delineates the intricate structure of ResNet50), while FPN encompasses a series of 2D convolutions, addition operations, and upsampling procedures in Figure 4b. In Figure 4c, the detection head predicts the category and polar centerness of the center point of the instance through a four-layer 2D convolution basic structure. It then predicts the mask of the instance through another four-layer convolutional basic structure.
As shown in Figure 4c, ISNet is divided into three branching layers in the head part for classification prediction, polar centerness prediction, and mask prediction. In the head, we use the polar coordinate representation [15] to improve the simplicity and efficiency of training. Using polar coordinates to represent masks, we simplify the mask of the target to the main key points of the target’s main body. This approach can greatly improve training efficiency and provides a foundation for subsequent defect detection modules. As shown in Figure 5b,c, given an instance mask of an insulator, its candidate centers C x ,   C y and contour points X i , Y i ,   i = 1 ,   2 ,   ,   N are first obtained by sampling, and then n rays are uniformly sent out from the centers at intervals of angle θ. The length of these n rays is determined by the distance from the center point to the contour edge points. In this way, the insulator mask can be represented by a center point and n rays. The angular intervals between the rays are predefined so that only the lengths of the rays need to be predicted to visualize the mask. Such a polar representation allows to transform the instance segmentation task into a task of classifying the center of instances in the predicted polar coordinate system and a task of regressing distances that are dense at uniform angles. When regressing distances, special cases are considered where if a ray in a given direction has multiple intersections with the edge of the mask, then the intersection with the largest distance is chosen as the edge point.
Choosing the center of mass of the mask instead of the center of the bounding box as the center of the instance gives better segmentation performance [15]. As shown in Figure 5d, we take the pixel falling in the center of the instance as the center sample and take the sampling area of 1.5 steps from the center of the feature map to the left, top, right, and bottom directions as the center positive sample, so there are about 9–16 pixels that can be used as the center samples, which increases the number of center samples and reduces the phenomenon of imbalance of positive and negative samples.
In the mask prediction process, the head outputs category scores and polar centerness, and the category scores and polar centerness are multiplied together as the final confidence score. The threshold of the confidence score is then set to 0.05, the 1000 highest scoring predictions at each level of the FPN are used to construct the mask, and the highest scoring predictions at all levels are merged, and then non-maximization suppression (NMS) with a threshold of 0.5 is used to produce the final mask prediction results. Given a center sample point C x ,   C y and the distances of n rays d 1 ,   d 2 ,   ,   d n , we can compute the edge contour points X i , Y i ,   i = 1 ,   2 ,   ,   N of the corresponding rays according to Equations (1) and (2). We can then connect the contour points one by one to form the edges of the mask, and then the excess masks are removed by extreme value suppression according to the IoU threshold.
X i = cos θ × d i + C x ,
Y i = sin θ × d i + C y ,
For a set of ray distances d 1 ,   d 2 ,   ,   d n , for instance, we define insulator polar centeredness, computed as in Equation (3).
I n s u l a t o r   P o l a r   C e n t e r n e s s = m i n d 1 ,   d 2 ,   ,   d n m a x d 1 ,   d 2 ,   ,   d n ,
When the maximum and minimum values d 1 ,   d 2 ,   ,   d n are closer to each other, it means that the quality of the positive sample points is higher, and they can be given higher weights. The weight of low-quality masks is reduced by multiplying the predicted polar centerness by the category scores.
The loss function used in the training process directly uses the IoU and its corresponding binary cross-entropy loss function in the polar coordinate system defined in PolarMask, as in Equations (4) and (5), where d ^ i denotes the predicted values.
I n s u l a t o r   P o l a r   I o U = i = 1 n min d i , d ^ i i = 1 n max d i , d ^ i ,
I n s u l a t o r   P o l a r   I o U   L o s s = log i = 1 n max d i , d ^ i i = 1 n min d i , d ^ i ,
After obtaining the insulator chip mask by backbone, neck, and head, the insulator chip mask is assembled into a complete insulator mask by CSM, and the predicted masks of different instances are adjusted to a uniform color to obtain the final insulator segmentation result. The CSM structure is shown in Figure 6.

3.2. Insulator Burst Detector (IBD) Based on Periodic Distribution of Corner Points

After obtaining the insulator mask, we use morphological methods to inflate the mask to complement possible segmentation voids in the results. Then, we perform insulator defect detection and localization based on the insulator mask contour. Considering that the normal insulator disk has symmetry and periodic distribution, we propose an Insulator Burst Detector (IBD) composed of corner point extraction, distance clustering module, and periodic distribution feature discriminator. First, we extract the corner points of the insulator mask based on the FAST CPDA algorithm [80] as the corner point extraction module. Then, we cluster the corner points based on the distance from each corner point to a straight line given an arbitrary main direction line outside the insulator mask. Then, based on the distance between neighboring points within the same group, we discriminate the corner points that do not conform to the periodic distribution, i.e., the location of insulator defects. The workflow of IBD is shown in Figure 7.

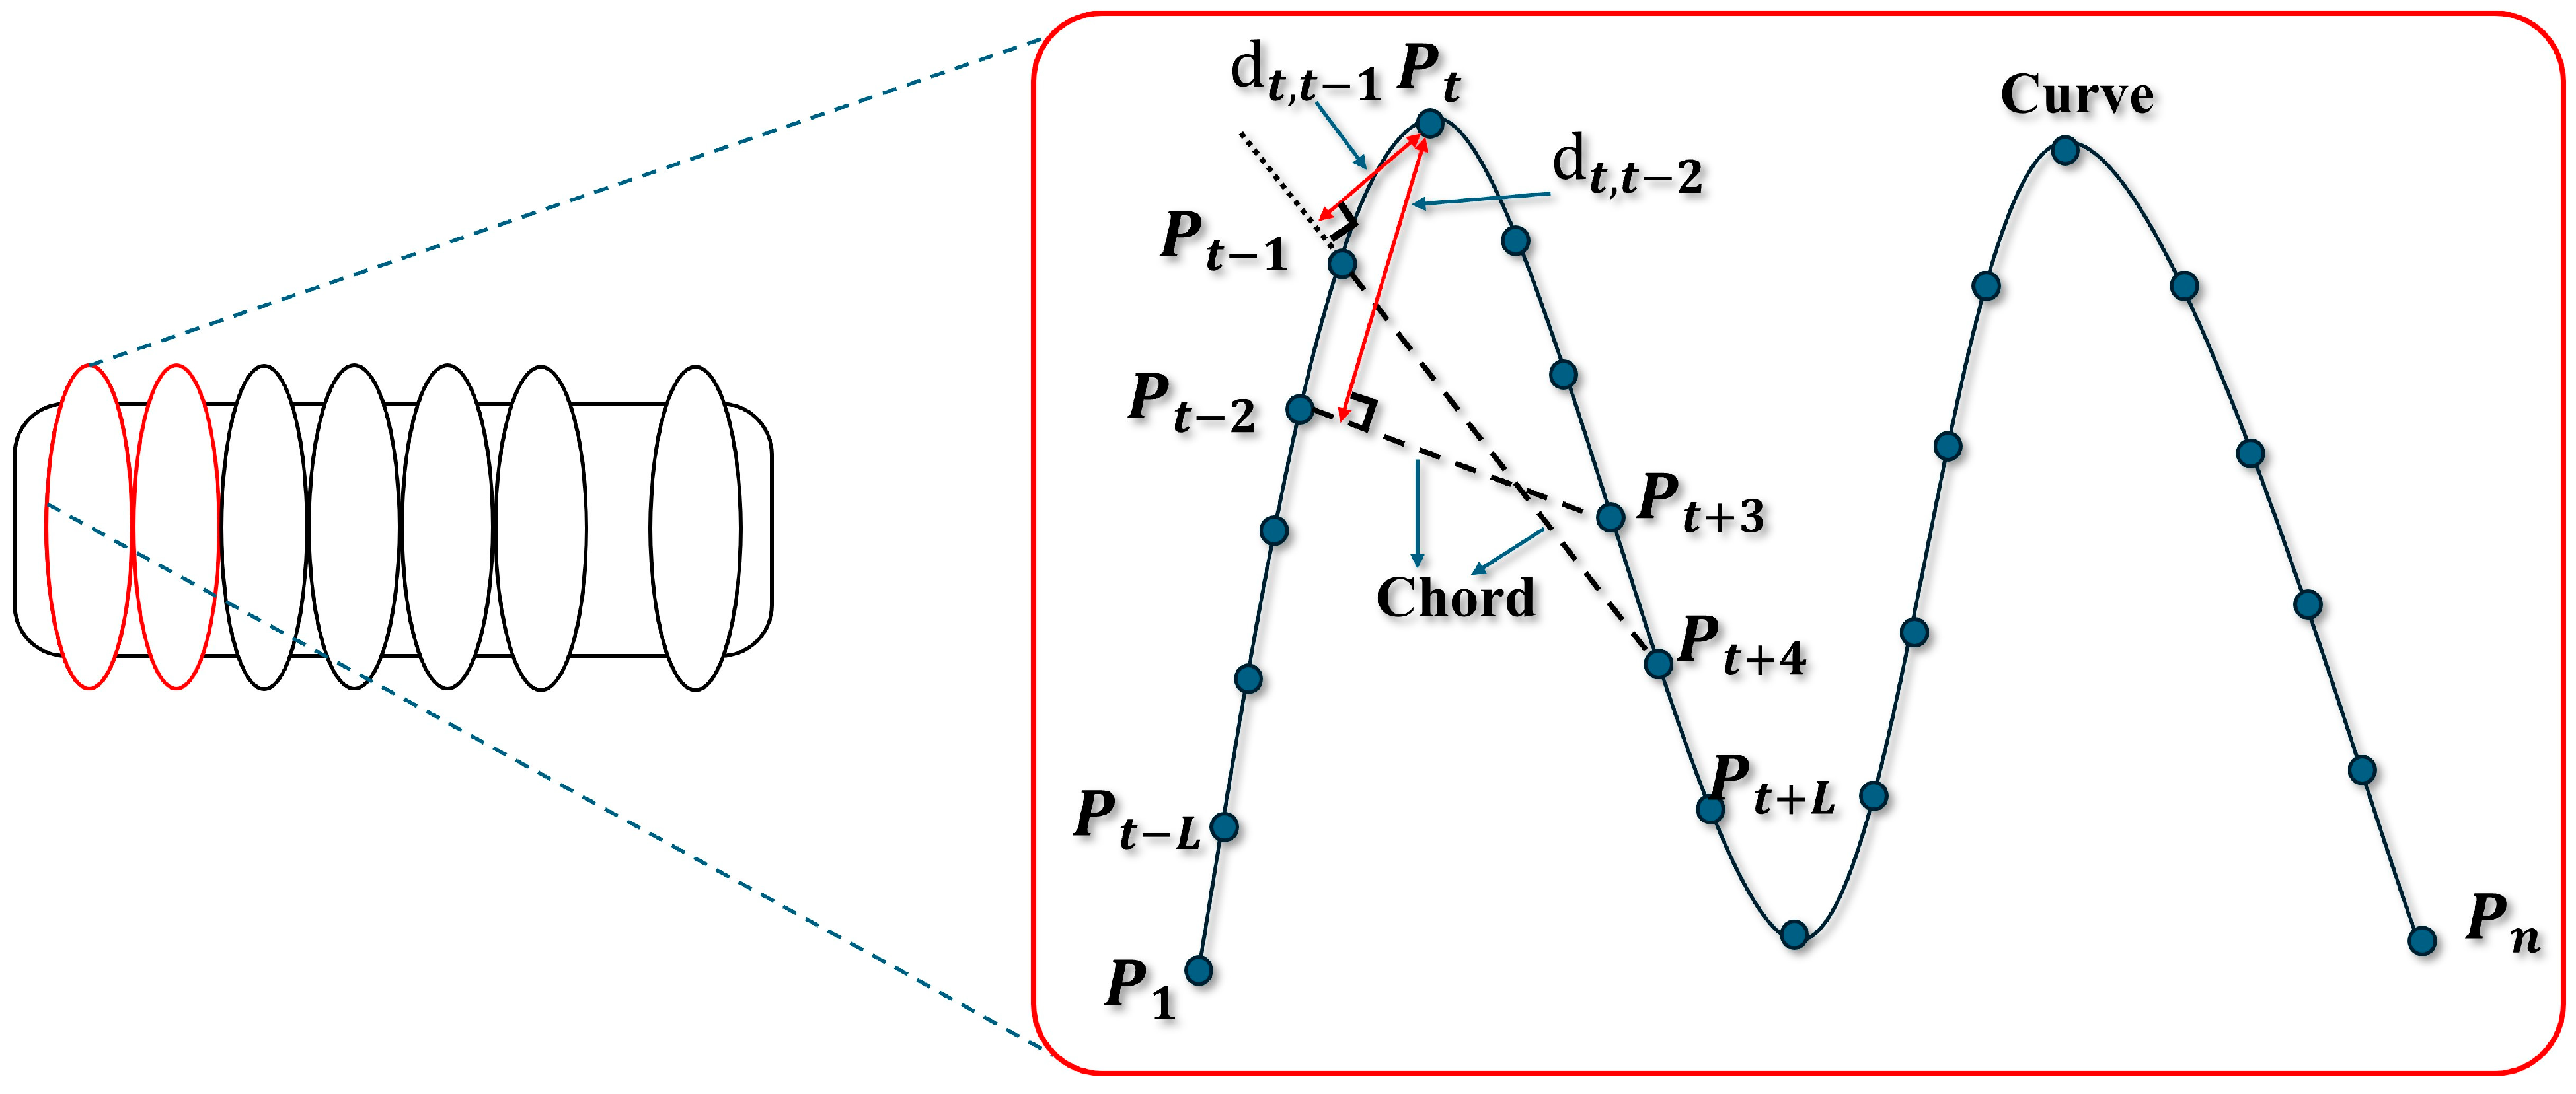
3.2.1. Corner Point Extraction

Fast CPDA [80] is to extract the vertices of the insulator mask. The original CPDA algorithm [81] consists of five specific steps. The Canny operator [82] is employed for edge extraction, whereby the edges of the extracted region are selected and those with a short length are eliminated. The extracted edge is then smoothed, after which the edge curvature is estimated. Candidate corner points are then selected according to the estimated curvature, and finally, the possible corner points on the closed curve are extracted to obtain the final corner point set.
The Canny edge detection is used to screen out short edges and weak edges that do not contain strong corners, and curves of length n must satisfy the conditions in Equation (6) in order to be retained.
n > w + h α ,
In Equation (6), w is the width of the image, h is the height of the image, and α is the edge length control index, which is set to 25 by default.
The curve is then smoothed using a Gaussian convolution operation to remove noise. The curvature of the curve is calculated according to the curvature estimation technique in the CPDA algorithm, where the chord is moved along the curve and the perpendicular distance from each point on the curve to the chord is summed to represent the curvature at that point. As shown in Figure 8, for a chord corresponding to an arc length of L , the chord is moved on both sides of the point P t for which the curvature is to be evaluated (the corresponding arc length of the chord is always L , while the point is always kept in the inner point corresponding to the chord), and the sum of the distances from the point to the chord is calculated cumulatively as h L t . The CPDA algorithm performs the calculation of the cumulative distances of the three arc lengths (10, 20, and 30) for each point for which the curvature is to be evaluated, and the corresponding distance function is h j t (j = 1, 2, 3), and then normalized according to Equation (8), and then the normalized values are cumulatively multiplied to obtain the final curvature evaluation value H t according to Equation (9). In Equation (7), j is the index of the first intersection point between the string and the curve each time the string is moved, and d t , j is the distance from the point P t to the corresponding chord.
h L t   =   j = t L + 1 t 1 d t , j ,
h j t = h j t max 0 j 3 h j ,
H t = h 1 t · h 2 t · h 3 t ,
Curvature threshold and angle threshold are set to screen out the error points to obtain the candidate point set. Finally, the possible corner points and special types of corner points on the closed curve are screened and included in the candidate point set to obtain the final point set. However, the CPDA algorithm has to calculate the curvature of each point on the curve, which has a large computational complexity, so we use the improved Fast CPDA algorithm, and before curvature estimation of the original CPDA algorithm, we calculate the distance between the points on the curves of the processed two images by performing Gaussian smoothing on the images at two different scales, and then we obtain the distance set, and the points corresponding to the extreme values of the points are used as candidate points. The points corresponding to the extreme values in the set are taken as candidate points for curvature calculation, which can realize fast calculation.

3.2.2. Distance-Based Clustering

Since the insulator principal direction features obtained by the PCA Module in ISNet may not be completely accurate, the principal direction of the mask is obtained by least squares fitting before distance filtering. By taking the pixel coordinates of the insulator mask foreground results as observations, the slope and intercept of the main direction straight line are calculated according to Equations (10) and (11), and the straight line can be expressed by Equation (12).
a ^ = x i 2 y i x i x i y i N x i 2 x i 2 ,
b ^ = N x i y i x i y i N x i 2 x i 2 ,
y = b ^ x + a ^ ,
We added a distance greater than half the width of the insulator to the intercept of the main direction line to translate it to either side of the insulator in the image and reduce the translated main direction line to a general linear equation in the form of Equation (13).
A x + B y + C = 0 ,
The distance of the extracted vertices from the main direction line after translation is counted, and for each vertex x i ,   y i on the extracted insulator, the distance D i from the main direction line is calculated as in Equation (14).
D i = A x i + B y i + C A 2 + B 2 ,
As shown in Figure 9, there are four types of distance classification. The corner points extracted from the insulator image are categorized according to the size of the distance D i . The green line indicates the main direction line, and the blue line indicates the main direction line after translation. The corner points extracted from the insulator part of the image are thus classified, and similar corner points are represented by the same color.

3.2.3. Periodic Distribution Feature Discriminator

After classifying the neighboring corner points, within the arrays of each class, the corner points within the group are sorted according to a certain coordinate direction similar to the main direction straight line, and the distances L i of the neighboring corner points within each group are separately calculated and stored in the distance array of each corner point group. As shown in the figure, only the intra-class neighborhood distances of the vertices in the first and fourth groups are shown in Figure 10.
The formula for calculating the distance between adjacent corner points is shown in Equation (15).
L i = x i x i + 1 2 + y i y i + 1 2 ,
After obtaining the distances between neighboring corner points of each group, the average distance L m of neighboring corner points of each group is calculated separately as in Equation (16).
L m = L i i 1 ,
According to the geometric characteristics of a single disk in the insulator, set 2.5 times the average distance within the group as the threshold L T for each group, as shown in Equation (17). If there is greater than the threshold L T within the group neighboring point distance array within the neighboring point distance L i , then there is the phenomenon of burst in the insulator image of this insulator, greater than the threshold of the neighboring point distance corresponding to the two points, that is, the defective point. Record the defective neighboring point coordinates of the point, identified in the corresponding image, that is, the location of the insulator burst.
L T = 2.5 L m ,
The pseudocode of IBD is as follows in Algorithm 1.
Algorithm 1: Insulator Burst Detector
Input: Insulator Mask M i
1 P 0 corner point set from FAST_CPDA ( M i )
2 a i ,   b i main direction line parameter from M i
3 D i   distance from main direction line parameter a i ,   b i and corner point set P0
4 d A ,   d B ,   d C ,   d D four distances from D i
d e t in D r e r e m a i n  do
5 P A ,   P B ,   P C ,   P D four corner point groups from d A ,   d B ,   d C ,   d D and P 0
6forPoint in P A ,   P B ,   P C ,   P D
7 L A ,   L B ,   L C ,   L D   distance set from every two adjacent points in P A ,   P B ,   P C ,   P D
8 L A m ,   L B m ,   L C m ,   L D m average distance from L A ,   L B ,   L C ,   L D
9Set threshold L A m T ,   L B m T ,   L C m T ,   L D m T     2.5 L A m ,   2.5 L B m ,   2.5 L C m ,   2.5 L D m
10forL in L A ,   L B ,   L C ,   L D
11 Check if there is an L > L A m T ,   L B m T ,   L C m T   o r   L D m T
12 ifTRUE then
13 P d 1 i ,   P d 2 i mark the corresponding two adjacent points in P A ,   P B ,   P C ,   P D
14 end
15 P d defect points set from P d 1 i ,   P d 2 i
16return: P d

4. Experiments and Results

In this section, an Insulator Defect Dataset (ID dataset) based on UAV images is constructed, and extensive experiments are performed on it. To verify the segmentation performance of the proposed ISNet, ablation experiments are carried out on the ID dataset. The Baseline method, which did not include the ICM module, is also compared to assess the accuracy of the detection bounding box and segmentation mask. Subsequently, the trained ISNet is employed to segment all insulator images within the dataset, yielding masks. The segmentation results are used to implement the IBD, which is employed to detect and localize instances of insulator bursts. This process is undertaken to assess the performance and accuracy of ID-Det’s insulator defect detection.

4.1. Experiment Setup
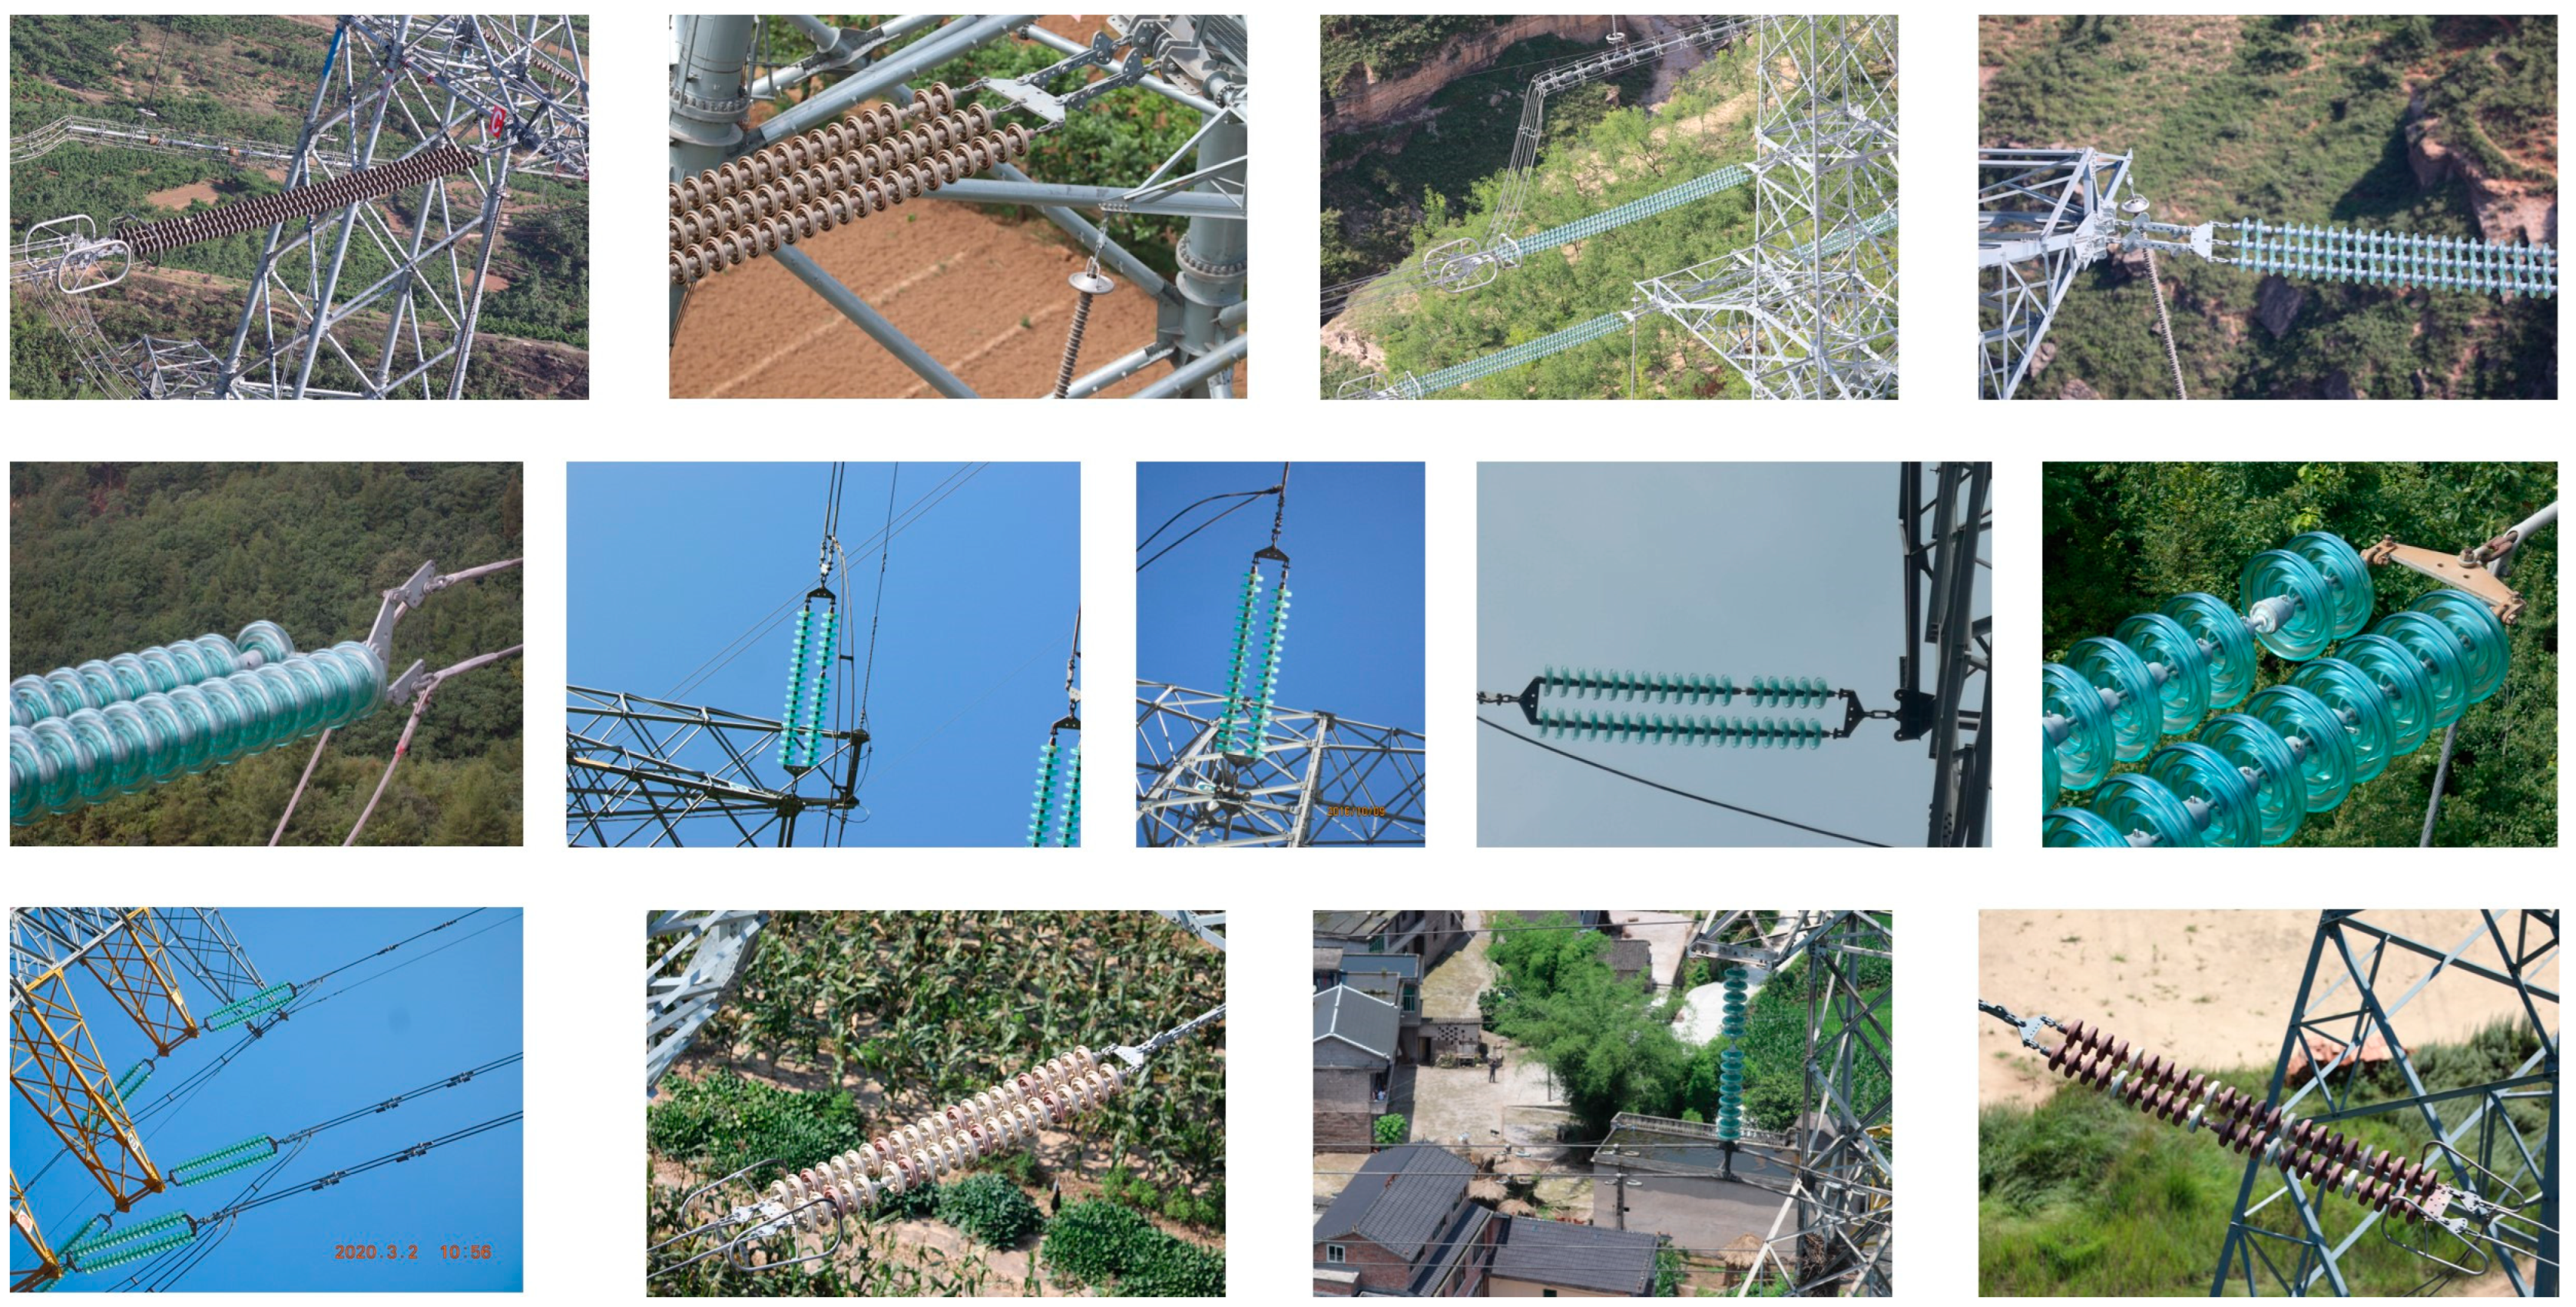
4.1.1. ID Dataset

UAV imagery data used in the experiment are primarily captured by DJI Phantom 4 RTK [83], with a smaller portion taken using a handheld camera. As shown in Figure 11, the DJI Phantom 4 RTK is equipped with a 1-inch 20-megapixel RGB camera sensor for capturing RGB images. Utilizing this data, we constructed the ID dataset.
An ID dataset consisting of 1614 individual insulator instances is constructed. ID dataset format is the COCO dataset format, and the images in the dataset are from UAV images of transmission lines captured. The training set consists of 1453 images, and the validation set consists of 161 images. There are a total of 1614 images of insulators, of which 551 images contain defective insulators, accounting for 34.14%. To ensure the applicability of the method, the UAV images are selected with different shooting angles, shooting distances, and resolutions, as shown in Figure 12 and Figure 13. Figure 12 shows examples of data collected by UAVs, while Figure 13 provides a zoomed-in view of examples of the images and labels from our constructed dataset.

4.1.2. Server Configuration

The experiments are conducted on a custom-built Linux system server. The CPU used in the experiments is a 5-core Intel Core i9, and the GPU used in the experiments is a single NVIDIA GeForce RTX 2080 Ti with NVIDIA Turing™ GPU architecture and 11 GB of GDDR6 graphics memory. The server memory used is 32 GB.

4.1.3. Training Details

During the training of all network models in the experiments, we use ResNet50-FPN as the backbone network and use the hyperparameters with the total epochs of 20 and weight decay of 0.0001. Also, the network models used in the experiments are trained iteratively using Stochastic Gradient Descent (SGD), with 20 epochs set in the experiments. Since the experiments are trained using a single card instead of distributed training, the initial learning rate is set to 0.0025 and the batch size is set to 4. The backbone network is initialized with the pre-trained weights on ImageNet.

4.2. Ablation Experiment

To verify the extent of segmentation performance improvement by the proposed ICM module, we conduct ablation experiments to verify the extent of performance improvement by the PCA Module and Chips Module submodules in the ICM for the model. The ablation experiments are conducted on the basis of PolarMask (Baseline), and the Baseline method with PCA Module and Chips Module alone is set up to compare with the Baseline method including the complete ICM (ISNet) for qualitative and quantitative experiments, respectively. First, we use the Baseline method to train the training set of the ID dataset alone and predict the segmentation results on the data in the validation set and evaluate the accuracy on the validation set. Then, we set up the experimental control groups of Baseline + PCA Module and Baseline + Chips Module to verify the degree of improvement of segmentation and localization performance by the two sub-modules of ICM, PCA Module, and Chips Module, respectively. Finally, we use the proposed ISNet to train on the training set and validate on the validation set. Overall, we set up the following four sets of experimental methods as A, B, C, and D.
A: Baseline method. The Baseline method we use in the ablation experiments is PolarMask. The backbone uses ResNet50 and the corresponding FPN.
B: Baseline + PCA Module method. The Baseline + PCA Module method is based on the Polarmask with the addition of the PCA Module, a sub-module of our proposed ICM, to obtain the main orientation features in the image to improve the polar representation of the mask.
C: Baseline + Chips Module method. The Baseline + Chips Module method is based on the PolarMask method with the addition of the Chips Module to verify the extent to which the Chips Module improves the baseline performance.
D: Baseline + PCA Module and Chips Module method (ISNet). This experimental setup directly uses our proposed ISNet with full ICM and CSM to verify the excellent performance of our proposed method for isolator instance segmentation.

4.2.1. Qualitative Evaluation

The data in the validation set are predicted separately after the network model is trained using the four experimental settings A, B, C, and D. The resulting prediction results are presented in the Figure 14. The results of the prediction demonstrate that the proposed ICM module is capable of improving the quality of insulator segmentation. Furthermore, the experimental setup D yields insulator masks with edge refinement.

4.2.2. Quantitative Evaluation

Considering that the segmentation results are for defect identification and localization using IBD, we evaluate the accuracy in the ablation experiments to assess the accuracy of the segmentation mask and the detection bounding box, respectively; a high-quality segmentation mask can provide a better basis for defect detection and localization for IBD, while the detection frame can reflect the accuracy of target localization. To ensure the fairness of the comparison, we make sure that the other parameters (hyper-references) of the network are consistent, except for the different network structures. By validating each group of experiments after setting 20 epochs, we obtain the following results.
Table 2 presents a comparison of the AP between the segmentation mask results for the four different experimental setups. It can be observed that the Baseline with PCA Modules and the Baseline with Chips Modules are capable of enhancing the mAP of the segmentation results by over 10%, whereas the improvement achieved by the Baseline with PCA Modules is more pronounced. In terms of small, medium, and large instances, the results are also significant. ISNet achieves a 0.575 mAP score, which represents a 27.2% improvement over the baseline approach. Furthermore, it demonstrates a notable enhancement in performance across different-sized instances. The results in Table 3 demonstrate that the Baseline with PCA Modules and the Baseline with Chips Modules are capable of achieving a maximum mAP improvement of 12% in detection frame prediction relative to the Baseline method. Additionally, they exhibit a performance improvement in the detection of instances of different sizes. In contrast, the ISNet method demonstrates a significant performance improvement in the detection of insulator instances of medium and large insulator instances. Furthermore, it exhibits a significant improvement in medium and large insulator instances.
Table 4 and Table 5 demonstrate that the proposed module is capable of markedly enhancing the recall of segmentation masks and detection frames. Notably, the ISNet method, comprising two submodules, exhibits the most pronounced improvement in segmentation masks. However, while ISNet displays a somewhat less pronounced success in predicting detection frames, it still achieves a notable enhancement in predicting detection frames for medium- and large-sized insulator instances. The quantitative results of the ablation experiments demonstrate that the PCA Module and the Chips Module are capable of markedly enhancing the performance of the Baseline method in predicting the mask and predicting the detection frame, respectively. The integration of both modules into the Baseline method resulted in a further enhancement of the model’s ability to predict the mask, accompanied by an improvement in AP and AR metrics. However, the enhancement of the model’s ability to predict the detection frame was subject to certain limitations, with the AP and AR enhancements being constrained yet still superior to those of the Baseline method.
The results of the ablation experiments demonstrate that ISNet is capable of markedly enhancing the performance of insulator segmentation, thereby providing a robust foundation for IBD in the detection of insulator defects.

4.3. Insulator Burst Detection

The efficacy of the ID-Det framework for defect detection is evaluated on all 1614 insulator images in the IS dataset. The evaluation is conducted in both qualitative and quantitative manners. The trained ISNet is employed to segment all images in the IS dataset, thereby obtaining the segmentation mask. Subsequently, the performance of IBD is evaluated by detecting defects in the obtained masks using the proposed IBD. The number of defective insulators in 1614 insulator images is counted, as will the number of defective insulators detected by ID-Det, the number of defective insulators not detected by ID-Det, and the number of defective insulators incorrectly detected by ID-Det. These figures are used to compute the precision and recall of ID-Det for defective insulator detection on the IS dataset. Additionally, we compare ID-Det with existing methods that have demonstrated efficacy in insulator defect detection to illustrate the superiority of ID-Det.

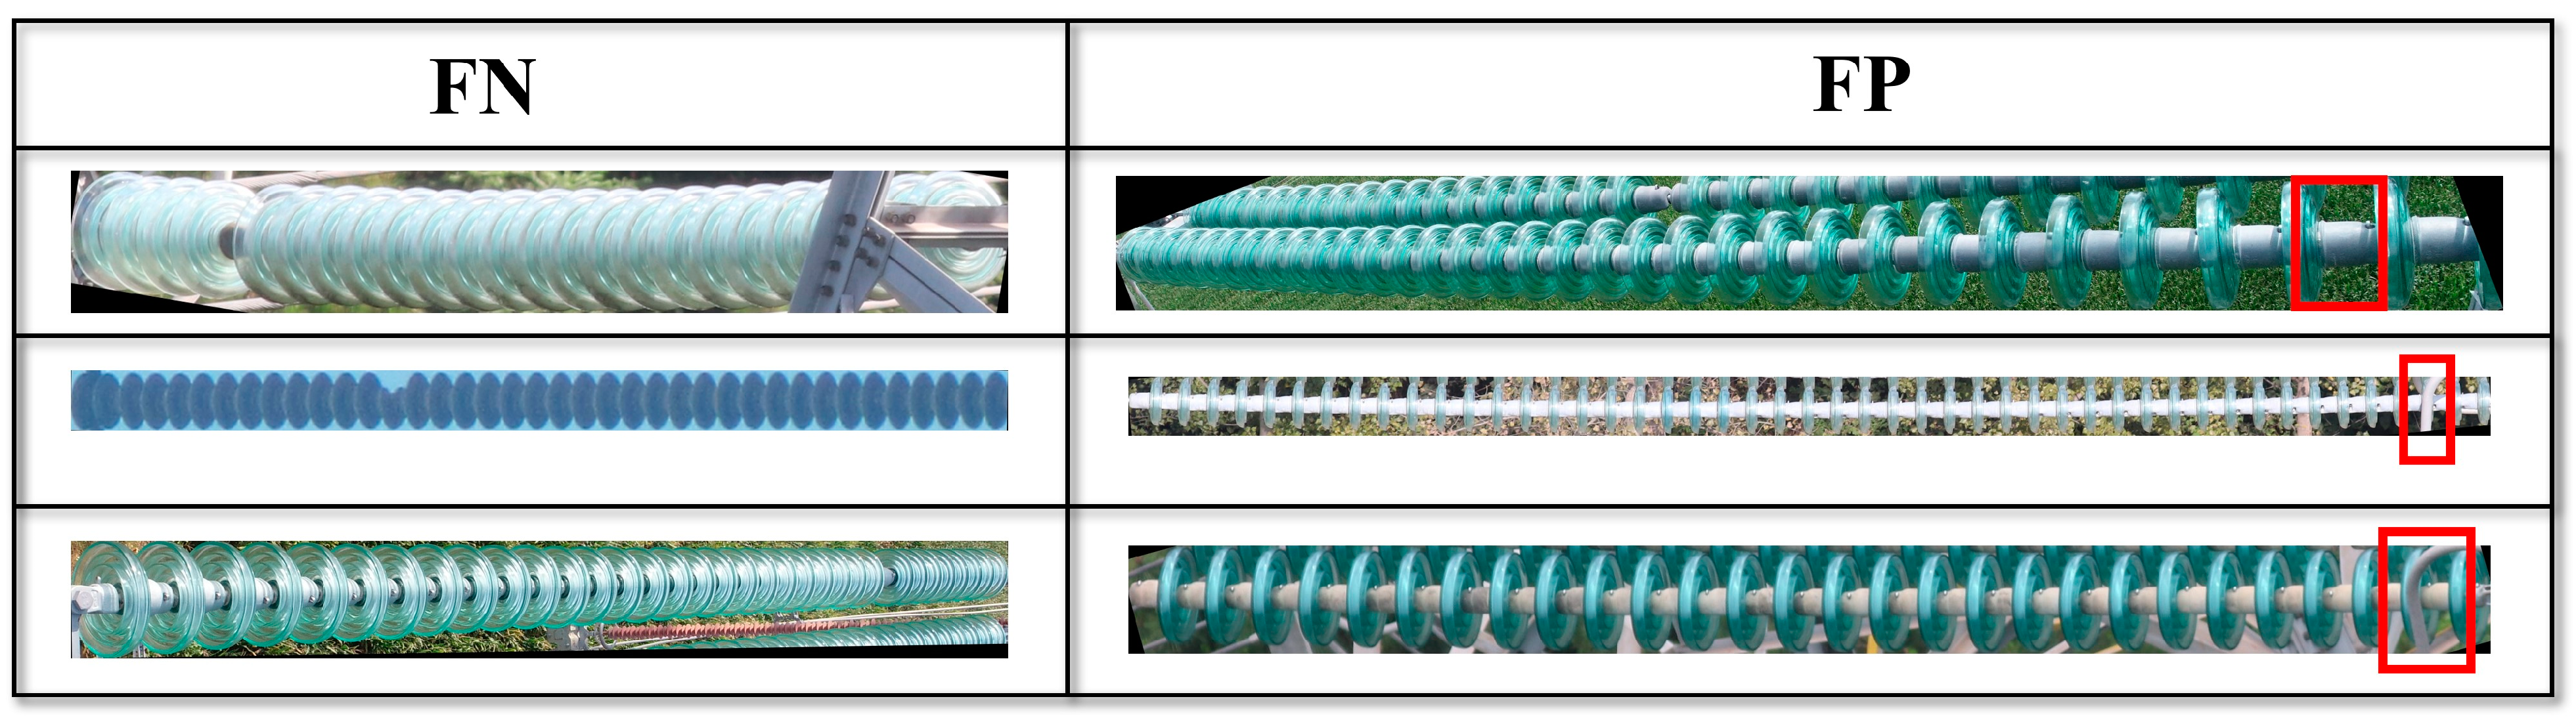
4.3.1. Qualitative Evaluation

The obtained mask is first subjected to morphological expansion in order to address any potential voids. Subsequently, the proposed IBD is employed to detect insulator bursting defects. The results of the defect detection process, including two illustrative examples of the mask and the associated defect detection results, are presented below. It can be observed that the ID-Det framework, which is our proposed approach, is capable of accurately identifying and localizing insulator defects. In Figure 15, the extracted key corner points are identified with red hollow circles, while the corner points at the defect location are indicated by red-edged, yellow-centered circles. The four key corner points at the detected defect location are connected to indicate the location of the insulator bursting defect. As the curvature of the edge of the segmentation results is not uniform, each insulator disk may be extracted with one to two additional corner points (in the figure, only the key corner points have been marked). These additional points are grouped together according to the distance to the main direction of the straight line. Due to the existence of these additional points, the average distance between the additional corner points within the same group is smaller than the actual distance between the neighboring insulator disks. After consulting with the electric power staff, we empirically set 2.5 times the average distance as a threshold to judge the discs at the burst. Qualitative experiments have demonstrated that the ID-Det framework is capable of effectively judging and locating insulator bursting defects.

4.3.2. Quantitative Evaluation

The proposed ID-Det was utilized to identify insulator defects in 1614 insulator images within the IS dataset. According to statistical analysis, the total number of insulators included in the IS dataset is 1614, with 551 identified as defective. The ID-Det algorithm correctly identifies 521 defective insulators (true positives, or TP), 14 false positives (FP), and 30 undetected defective insulators (false negatives, or FN). After calculation, the indicators of ID-Det on the IS dataset are as shown in the Table 6. The accuracy, precision, and recall are 97.274%, 97.383%, and 94.555%, respectively. We compare ID-Det with general object detection methods (YOLOv5 [33], YOLOv7 [35], YOLOv8 [36], YOLOv9 [37], swin transformer [66]) and demonstrate that ID-Det significantly outperforms them in terms of precision, accuracy, and recall. The results are shown in Table 7.
The performance of the ID-Det method is demonstrably superior to that of the general object detection-based methods.
Additionally, we compared the processing time of ID-Det with these general object detection algorithms for insulator defects. Experimental results indicate that ID-Det can achieve comparable processing speed to general object detection algorithms while maintaining high accuracy in insulator defect prediction, demonstrating its high efficiency. The YOLO series of methods are relatively fast because they do not predict masks and perform defect detection steps. However, this is also why the accuracy of YOLO series methods for insulator burst defect detection and localization is not as high as our method. Although Swin Transformer can generate masks, it is not specifically designed for insulator burst detection, and therefore its accuracy is not as good as ID-Det.

5. Discussion

The experimental results demonstrate that the proposed ISNet is an effective method for insulator image segmentation, yielding precise insulator edge delineation. The results demonstrate an accuracy rate of 97.27%, an accuracy of 97.38%, and a recall rate of 94.56%. The quantitative results demonstrate that ID-Det is capable of achieving a high defect detection rate and has the potential for practical application.
Furthermore, the ICM module has been shown to significantly enhance segmentation performance. In comparison to the Baseline method, the segmented AP and AR on the ID dataset exhibited a notable enhancement. However, in the ablation experiment, the incorporation of the Chips Module into the Baseline method does not consistently result in an improvement in the detection frame performance. This is due to the alteration in the size of the predicted target box subsequent to the addition of the Chips Module, which in turn constrained the performance of the detection frame prediction for the smaller instance.
In addition, the ID-Det framework is employed to assess the efficacy of the method by performing defect detection on all insulator images within the entire dataset. In qualitative experiments, it is observed that the ID-Det framework is capable of accurately identifying and locating insulator poppers. In order to verify the defect detection performance of ID-Det, we evaluate the defect detection-related indicators of ID-Det on the ID dataset.
Nevertheless, instances of false positives and negatives have been observed in defect detection experiments. Upon analysis of specific image examples shown in Figure 16, it has been determined that these errors(the red boxes indicate false detections) and omissions are commonly observed in insulator images with excessive brightness, inconsistent scale due to shooting angle, low resolution, and obscured insulator. These issues during photography may result in insulators being distributed at very oblique angles near the edges of the images. If the angle is excessively steep, it can significantly impact the proposed defect detection method, potentially leading to missed detections or false detections. Additionally, defective insulator detection failures may also be attributed to the presence of a burst at the edge of the insulator. The occurrence of false detection and missed detection of defective insulators indicates that our method has certain requirements for the shooting conditions of insulator images. For example, positioning the insulator as centrally as possible within the UAV camera’s field of view during photography will achieve better results. This is closely related to the UAV’s automated inspection technology [84]. Moreover, extreme weather conditions, such as rain, fog, and snow, can adversely affect UAV data collection. Images captured under these low-visibility conditions may be rendered unusable, thereby potentially impacting the performance of the proposed method. This issue can be mitigated with multi-sensor fusion techniques.
To further support our paper and validate our method, we compared ISNet with a recent open-source insulator segmentation algorithm [85]. This work utilized the Box2Mask [86], which integrates the classical level-set evolution model into deep neural network learning to achieve accurate mask prediction with only bounding box supervision. As shown in Table 8, quantitative experimental results demonstrate that our method achieves superior segmentation performance, further highlighting the advantages of ISNet.
In general, ID-Det is capable of achieving high accuracy in the detection of insulator defects. To address false positives (FP) and false negatives (FN) in insulator defect detection, we will explore image super-resolution and multi-sensor data fusion methods in the future.

6. Conclusions

This paper presents a novel insulator defect detection method, ID-Det. ID-Det comprises two main components, i.e., the Insulator Segmentation Network (ISNet) and the Insulator Burst Detector (IBD). The performance of ID-Det was validated on insulator images through qualitative and quantitative experiments. It achieved a 27.2% improvement in segmentation AP compared to the baseline, an accuracy rate of 97.27%, an accuracy of 97.38%, and a recall rate of 94.56% for insulator defect detection. Results of ablation experiments demonstrate that our proposed ICM significantly enhances insulator segmentation performance. Comparative experiments on insulator defect detection show that our method outperforms the general object detection methods. These results indicate that ID-Det can achieve high-quality insulator defect detection and is suitable for practical industrial applications. However, ID-Det has not been validated on UAV imagery captured under extreme weather conditions, such as rain, fog, and snow, and its performance may be influenced by the clarity of the UAV images. Considering the potential impacts of extreme weather conditions, it is necessary to employ multiple sensors, including near-infrared, thermal infrared, and radar imaging techniques. This ensures comprehensive monitoring and data acquisition under various adverse conditions. Future work will explore the application of image super-resolution technology and multi-sensor data fusion technology to improve the robustness and generalization of ID-Det in processing UAV imagery.

Author Contributions

Conceptualization, S.S. and C.C.; methodology, S.S.; software, S.S.; validation, S.S., C.C., Z.Y. and Z.W.; formal analysis, S.S.; investigation, S.S.; resources, S.S., C.C. and B.Y.; data curation, S.S. and J.F.; writing—original draft preparation, S.S.; writing—review and editing, S.S., C.C., Y.H., S.W. and L.L.; visualization, S.S.; supervision, C.C. and B.Y.; project administration, C.C.; funding acquisition, C.C. and B.Y. All authors have read and agreed to the published version of the manuscript.

Funding

This research was funded by the National Natural Science Foundation of China (No. 42071451 and No. U22A20568), the National Key RESEARCH and Development Program (No. 2022YFB3904101), the National Natural Science Foundation of China (No. 42130105), the National Natural Science Foundation of Hubei China (No. 2022CFB007), the Key Research and Development Program of Hubei Province (No. 2023BAB146), the Research Program of State Grid Corporation of China (5500-202316189A-1-1-ZN), the Fundamental Research Funds for the Central Universities, the China Association for Science and Technology Think Tank Young Talent Program, and the European Union’s Horizon 2020 Research and Innovation Program (No. 871149).

Data Availability Statement

Due to the nature of this research, participants of this study did not agree for their data to be shared publicly, so supporting data is not available.

Acknowledgments

The authors would like to thank the Supercomputing Center of Wuhan University for providing the supercomputing system for the numerical calculations in this paper.

Conflicts of Interest

Author Jing Fu was employed by the company China Electric Power Research Institute Co., Ltd. The remaining authors declare that the research was conducted in the absence of any commercial or financial relationships that could be construed as a potential conflict of interest.

References

  1. International Energy Agency. World Energy Outlook 2023. 2023. Available online: https://www.iea.org/reports/world-energy-outlook-2023 (accessed on 24 October 2023).
  2. Zhang, N.; Dai, H.; Wang, Y.; Zhang, Y.; Yang, Y. Power System Transition in China under the Coordinated Development of Power Sources, Network, Demand Response, and Energy Storage. WIREs Energy Environ. 2021, 10, e392. [Google Scholar] [CrossRef]
  3. Liu, J.; Hu, M.; Dong, J.; Lu, X. Summary of Insulator Defect Detection Based on Deep Learning. Electron. Power Syst. Res. 2023, 224, 109688. [Google Scholar] [CrossRef]
  4. Yang, L.; Fan, J.; Liu, Y.; Li, E.; Peng, J.; Liang, Z. A Review on State-of-the-Art Power Line Inspection Techniques. IEEE Trans. Instrum. Meas. 2020, 69, 9350–9365. [Google Scholar] [CrossRef]
  5. Cong, Y.; Chen, C.; Yang, B.; Li, J.; Wu, W.; Li, Y.; Yang, Y. 3D-CSTM: A 3D Continuous Spatio-Temporal Mapping Method. ISPRS J. Photogramm. Remote Sens. 2022, 186, 232–245. [Google Scholar] [CrossRef]
  6. Ma, R.; Chen, C.; Yang, B.; Li, D.; Wang, H.; Cong, Y.; Hu, Z. CG-SSD: Corner Guided Single Stage 3D Object Detection from LiDAR Point Cloud. ISPRS J. Photogramm. Remote Sens. 2022, 191, 33–48. [Google Scholar] [CrossRef]
  7. Wu, W.; Li, J.; Chen, C.; Yang, B.; Zou, X.; Yang, Y.; Xu, Y.; Zhong, R.; Chen, R. AFLI-Calib: Robust LiDAR-IMU Extrinsic Self-Calibration Based on Adaptive Frame Length LiDAR Odometry. ISPRS J. Photogramm. Remote Sens. 2023, 199, 157–181. [Google Scholar] [CrossRef]
  8. Xu, Y.; Chen, C.; Wang, Z.; Yang, B.; Wu, W.; Li, L.; Wu, J.; Zhao, L. Pmlio: Panoramic Tightly-Coupled Multi-Lidar-Inertial Odometry and Mapping. ISPRS Ann. Photogramm. Remote Sens. Spatial Inf. Sci. 2023, X-1/W1-2023, 703–708. [Google Scholar] [CrossRef]
  9. Wang, H.; Chen, C.; He, Y.; Sun, S.; Li, L.; Xu, Y.; Yang, B. Easy Rocap: A Low-Cost and Easy-to-Use Motion Capture System for Drones. Drones 2024, 8, 137. [Google Scholar] [CrossRef]
  10. Chen, C.; Jin, A.; Wang, Z.; Zheng, Y.; Yang, B.; Zhou, J.; Xu, Y.; Tu, Z. SGSR-Net: Structure Semantics Guided LiDAR Super-Resolution Network for Indoor LiDAR SLAM. IEEE Trans. Multimed. 2024, 26, 1842–1854. [Google Scholar] [CrossRef]
  11. Wu, W.; Chen, C.; Yang, B. LuoJia-Explorer: Unmanned Collaborative Localization and Mapping System. In Proceedings of the 3rd 2023 International Conference on Autonomous Unmanned Systems (3rd ICAUS 2023), Nanjing, China, 8–11 September 2023; Qu, Y., Gu, M., Niu, Y., Fu, W., Eds.; Lecture Notes in Electrical Engineering. Springer Nature Singapore: Singapore, 2024; Volume 1176, pp. 66–75, ISBN 978-981-9710-98-0. [Google Scholar]
  12. Wang, Y.; Qin, X.; Jia, W.; Lei, J.; Wang, D.; Feng, T.; Zeng, Y.; Song, J. Multiobjective Energy Consumption Optimization of a Flying–Walking Power Transmission Line Inspection Robot during Flight Missions Using Improved NSGA-II. Appl. Sci. 2024, 14, 1637. [Google Scholar] [CrossRef]
  13. Nguyen, V.N.; Jenssen, R.; Roverso, D. Intelligent Monitoring and Inspection of Power Line Components Powered by UAVs and Deep Learning. IEEE Power Energy Technol. Syst. J. 2019, 6, 11–21. [Google Scholar] [CrossRef]
  14. Luo, Y.; Yu, X.; Yang, D.; Zhou, B. A Survey of Intelligent Transmission Line Inspection Based on Unmanned Aerial Vehicle. Artif. Intell. Rev. 2023, 56, 173–201. [Google Scholar] [CrossRef]
  15. Xie, E.; Sun, P.; Song, X.; Wang, W.; Liang, D.; Shen, C.; Luo, P. PolarMask: Single Shot Instance Segmentation with Polar Representation. arXiv 2020, arXiv:1909.13226. [Google Scholar]
  16. Yang, B.; Chen, C. Automatic Registration of UAV-Borne Sequent Images and LiDAR Data. ISPRS J. Photogramm. Remote Sens. 2015, 101, 262–274. [Google Scholar] [CrossRef]
  17. Chen, C.; Yang, B.; Song, S.; Peng, X.; Huang, R. Automatic Clearance Anomaly Detection for Transmission Line Corridors Utilizing UAV-Borne LIDAR Data. Remote Sens. 2018, 10, 613. [Google Scholar] [CrossRef]
  18. Kähler, O.; Hochstöger, S.; Kemper, G.; Birchbauer, J. Automating Powerline Inspection: A Novel Multisensor System for Data Analysis Using Deep Learning. Int. Arch. Photogramm. Remote Sens. Spat. Inf. Sci. 2020, XLIII-B4-2020, 747–754. [Google Scholar] [CrossRef]
  19. Avila, J.; Brouwer, T. Indoor Autonomous Powerline Inspection Model. In Proceedings of the 2021 IEEE/AIAA 40th Digital Avionics Systems Conference (DASC), San Antonio, TX, USA, 3 October 2021; pp. 1–5. [Google Scholar]
  20. Guan, H.; Sun, X.; Su, Y.; Hu, T.; Wang, H.; Wang, H.; Peng, C.; Guo, Q. UAV-Lidar Aids Automatic Intelligent Powerline Inspection. Int. J. Electron. Power Energy Syst. 2021, 130, 106987. [Google Scholar] [CrossRef]
  21. Vemula, S.; Marquez, S.; Avila, J.D.; Brouwer, T.A.; Frye, M. A Heterogeneous Autonomous Collaborative System for Powerline Inspection Using Human-Robotic Teaming. In Proceedings of the 2021 16th International Conference of System of Systems Engineering (SoSE), Västerås, Sweden, 14 June 2021; pp. 19–24. [Google Scholar]
  22. Wang, B.; Gu, Q. A Detection Method for Transmission Line Insulators Based on an Improved FCM Algorithm. Telkomnika 2015, 13, 164. [Google Scholar] [CrossRef]
  23. Wronkowicz, A. Vision Diagnostics of Power Transmission Lines: Approach to Recognition of Insulators. In Proceedings of the 9th International Conference on Computer Recognition Systems CORES 2015, Wroclaw, Poland, 25–27 May 2015; Burduk, R., Jackowski, K., Kurzyński, M., Woźniak, M., Żołnierek, A., Eds.; Advances in Intelligent Systems and Computing. Springer International Publishing: Cham, Switzerland, 2016; Volume 403, pp. 431–440, ISBN 978-3-319-26225-3. [Google Scholar]
  24. Zhang, K.; Yang, L. Insulator Segmentation Algorithm Based on K-Means. In Proceedings of the 2019 Chinese Automation Congress (CAC), Hangzhou, China, 22–24 November 2019; pp. 4747–4751. [Google Scholar]
  25. Gao, Z.; Yang, G.; Li, E.; Shen, T.; Wang, Z.; Tian, Y.; Wang, H.; Liang, Z. Insulator Segmentation for Power Line Inspection Based on Modified Conditional Generative Adversarial Network. J. Sens. 2019, 2019, 1–8. [Google Scholar] [CrossRef]
  26. Tan, J. Automatic Insulator Detection for Power Line Using Aerial Images Powered by Convolutional Neural Networks. J. Phys. Conf. Ser. 2021, 1748, 042012. [Google Scholar] [CrossRef]
  27. Zou, Z.; Chen, K.; Shi, Z.; Guo, Y.; Ye, J. Object Detection in 20 Years: A Survey. Proc. IEEE 2023, 111, 257–276. [Google Scholar] [CrossRef]
  28. Krizhevsky, A.; Sutskever, I.; Hinton, G.E. ImageNet Classification with Deep Convolutional Neural Networks. Commun. ACM 2017, 60, 84–90. [Google Scholar] [CrossRef]
  29. Redmon, J.; Divvala, S.; Girshick, R.; Farhadi, A. You Only Look Once: Unified, Real-Time Object Detection. In Proceedings of the 2016 IEEE Conference on Computer Vision and Pattern Recognition (CVPR), Las Vegas, NV, USA, 27–30 June 2016; pp. 779–788. [Google Scholar]
  30. Redmon, J.; Farhadi, A. YOLO9000: Better, Faster, Stronger. arXiv 2016, arXiv:1612.08242. [Google Scholar]
  31. Redmon, J.; Farhadi, A. YOLOv3: An Incremental Improvement. arXiv 2018, arXiv:1804.02767. [Google Scholar]
  32. Bochkovskiy, A.; Wang, C.-Y.; Liao, H.-Y.M. YOLOv4: Optimal Speed and Accuracy of Object Detection. arXiv 2020, arXiv:2004.10934. [Google Scholar]
  33. Ultralytics/Yolov5: YOLOv5 🚀 in PyTorch > ONNX > CoreML > TFLite. Available online: https://github.com/ultralytics/yolov5 (accessed on 13 March 2024).
  34. Li, C.; Li, L.; Jiang, H.; Weng, K.; Geng, Y.; Li, L.; Ke, Z.; Li, Q.; Cheng, M.; Nie, W.; et al. YOLOv6: A Single-Stage Object Detection Framework for Industrial Applications. arXiv 2022, arXiv:2209.02976. [Google Scholar]
  35. Wang, C.-Y.; Bochkovskiy, A.; Liao, H.-Y.M. YOLOv7: Trainable Bag-of-Freebies Sets New State-of-the-Art for Real-Time Object Detectors. In Proceedings of the 2023 IEEE/CVF Conference on Computer Vision and Pattern Recognition (CVPR), Vancouver, BC, Canada, 17–24 June 2023; pp. 7464–7475. [Google Scholar]
  36. Ultralytics/Ultralytics: NEW-YOLOv8 🚀 in PyTorch > ONNX > OpenVINO > CoreML > TFLite. Available online: https://github.com/ultralytics/ultralytics (accessed on 13 March 2024).
  37. Wang, C.-Y.; Yeh, I.-H.; Liao, H.-Y.M. YOLOv9: Learning What You Want to Learn Using Programmable Gradient Information. arXiv 2024, arXiv:2402.13616. [Google Scholar]
  38. Liu, W.; Anguelov, D.; Erhan, D.; Szegedy, C.; Reed, S.; Fu, C.-Y.; Berg, A.C. SSD: Single Shot MultiBox Detector. In Computer Vision–ECCV 2020; Springer: Berlin/Heidelberg, Germany, 2016; Volume 9905, pp. 21–37. [Google Scholar]
  39. Lin, T.-Y.; Goyal, P.; Girshick, R.; He, K.; Dollár, P. Focal Loss for Dense Object Detection. arXiv 2018, arXiv:1708.02002. [Google Scholar]
  40. Law, H.; Deng, J. CornerNet: Detecting Objects as Paired Keypoints. Int. J. Comput. Vis. 2020, 128, 642–656. [Google Scholar] [CrossRef]
  41. Duan, K.; Bai, S.; Xie, L.; Qi, H.; Huang, Q.; Tian, Q. CenterNet: Keypoint Triplets for Object Detection. arXiv 2019, arXiv:1904.08189. [Google Scholar]
  42. Carion, N.; Massa, F.; Synnaeve, G.; Usunier, N.; Kirillov, A.; Zagoruyko, S. End-to-End Object Detection with Transformers. In Computer Vision–ECCV 2020; Vedaldi, A., Bischof, H., Brox, T., Frahm, J.-M., Eds.; Lecture Notes in Computer Science; Springer International Publishing: Cham, Switzerland, 2020; Volume 12346, pp. 213–229. ISBN 978-3-030-58451-1. [Google Scholar]
  43. Zhao, Y.; Lv, W.; Xu, S.; Wei, J.; Wang, G.; Dang, Q.; Liu, Y.; Chen, J. DETRs Beat YOLOs on Real-Time Object Detection. arXiv 2024, arXiv:2304.08069. [Google Scholar]
  44. Prates, R.M.; Cruz, R.; Marotta, A.P.; Ramos, R.P.; Simas Filho, E.F.; Cardoso, J.S. Insulator Visual Non-Conformity Detection in Overhead Power Distribution Lines Using Deep Learning. Comput. Electron. Eng. 2019, 78, 343–355. [Google Scholar] [CrossRef]
  45. Zhang, H.; Wu, C.; Zhang, Z.; Zhu, Y.; Lin, H.; Zhang, Z.; Sun, Y.; He, T.; Mueller, J.; Manmatha, R.; et al. ResNeSt: Split-Attention Networks. In Proceedings of the 2022 IEEE/CVF Conference on Computer Vision and Pattern Recognition Workshops (CVPRW), New Orleans, LA, USA, 19–20 June 2022; pp. 2735–2745. [Google Scholar]
  46. Wang, S.; Liu, Y.; Qing, Y.; Wang, C.; Lan, T.; Yao, R. Detection of Insulator Defects with Improved ResNeSt and Region Proposal Network. IEEE Access 2020, 8, 184841–184850. [Google Scholar] [CrossRef]
  47. Tao, X.; Zhang, D.; Wang, Z.; Liu, X.; Zhang, H.; Xu, D. Detection of Power Line Insulator Defects Using Aerial Images Analyzed with Convolutional Neural Networks. IEEE Trans. Syst. Man Cybern Syst. 2020, 50, 1486–1498. [Google Scholar] [CrossRef]
  48. Liu, C.; Wu, Y.; Liu, J.; Sun, Z.; Xu, H. Insulator Faults Detection in Aerial Images from High-Voltage Transmission Lines Based on Deep Learning Model. Appl. Sci. 2021, 11, 4647. [Google Scholar] [CrossRef]
  49. Yi, W.; Ma, S.; Li, R. Insulator and Defect Detection Model Based on Improved Yolo-S. IEEE Access 2023, 11, 93215–93226. [Google Scholar] [CrossRef]
  50. Zhang, T.; Zhang, Y.; Xin, M.; Liao, J.; Xie, Q. A Light-Weight Network for Small Insulator and Defect Detection Using UAV Imaging Based on Improved YOLOv5. Sensors 2023, 23, 5249. [Google Scholar] [CrossRef] [PubMed]
  51. Chen, J.; Fu, Z.; Cheng, X.; Wang, F. An Method for Power Lines Insulator Defect Detection with Attention Feedback and Double Spatial Pyramid. Electron. Power Syst. Res. 2023, 218, 109175. [Google Scholar] [CrossRef]
  52. Ronneberger, O.; Fischer, P.; Brox, T. U-Net: Convolutional Networks for Biomedical Image Segmentation. In Medical Image Computing and Computer-Assisted Intervention–MICCAI 2015; Navab, N., Hornegger, J., Wells, W.M., Frangi, A.F., Eds.; Lecture Notes in Computer Science; Springer International Publishing: Cham, Switzerland, 2015; Volume 9351, pp. 234–241. ISBN 978-3-319-24573-7. [Google Scholar]
  53. Chen, L.-C.; Papandreou, G.; Kokkinos, I.; Murphy, K.; Yuille, A.L. Semantic Image Segmentation with Deep Convolutional Nets and Fully Connected CRFs. arXiv 2016, arXiv:1412.7062. [Google Scholar]
  54. Chen, L.-C.; Papandreou, G.; Kokkinos, I.; Murphy, K.; Yuille, A.L. DeepLab: Semantic Image Segmentation with Deep Convolutional Nets, Atrous Convolution, and Fully Connected CRFs. IEEE Trans. Pattern Anal. Mach. Intell. 2018, 40, 834–848. [Google Scholar] [CrossRef] [PubMed]
  55. Chen, L.-C.; Papandreou, G.; Schroff, F.; Adam, H. Rethinking Atrous Convolution for Semantic Image Segmentation. arXiv 2017, arXiv:1706.05587. [Google Scholar]
  56. Chen, L.-C.; Zhu, Y.; Papandreou, G.; Schroff, F.; Adam, H. Encoder-Decoder with Atrous Separable Convolution for Semantic Image Segmentation. In Computer Vision–ECCV 2018; Ferrari, V., Hebert, M., Sminchisescu, C., Weiss, Y., Eds.; Lecture Notes in Computer Science; Springer International Publishing: Cham, Switzerland, 2018; Volume 11211, pp. 833–851. ISBN 978-3-030-01233-5. [Google Scholar]
  57. Hümmer, C.; Schwonberg, M.; Zhou, L.; Cao, H.; Knoll, A.; Gottschalk, H. VLTSeg: Simple Transfer of CLIP-Based Vision-Language Representations for Domain Generalized Semantic Segmentation. arXiv 2023, arXiv:2312.02021. [Google Scholar]
  58. Wan, Q.; Huang, Z.; Kang, B.; Feng, J.; Zhang, L. Harnessing Diffusion Models for Visual Perception with Meta Prompts. arXiv 2023, arXiv:2312.14733. [Google Scholar]
  59. Cordts, M.; Omran, M.; Ramos, S.; Rehfeld, T.; Enzweiler, M.; Benenson, R.; Franke, U.; Roth, S.; Schiele, B. The Cityscapes Dataset for Semantic Urban Scene Understanding. In Proceedings of the 2016 IEEE Conference on Computer Vision and Pattern Recognition (CVPR), Las Vegas, NV, USA, 27–30 June 2016; pp. 3213–3223. [Google Scholar]
  60. Bolya, D.; Zhou, C.; Xiao, F.; Lee, Y.J. YOLACT: Real-Time Instance Segmentation. In Proceedings of the 2019 IEEE/CVF International Conference on Computer Vision (ICCV), Seoul, Republic of Korea, 27 October–2 November 2019; pp. 9156–9165. [Google Scholar]
  61. Wang, X.; Kong, T.; Shen, C.; Jiang, Y.; Li, L. SOLO: Segmenting Objects by Locations. In Computer Vision–ECCV 2020; Vedaldi, A., Bischof, H., Brox, T., Frahm, J.-M., Eds.; Lecture Notes in Computer Science; Springer International Publishing: Cham, Switzerland, 2020; Volume 12363, pp. 649–665. ISBN 978-3-030-58522-8. [Google Scholar]
  62. Wang, X.; Zhang, R.; Kong, T.; Li, L.; Shen, C. SOLOv2: Dynamic and Fast Instance Segmentation. Adv. Neural Inf. Process. Syst. 2020, 33, 17721–17732. [Google Scholar]
  63. Chen, X.; Girshick, R.; He, K.; Dollar, P. TensorMask: A Foundation for Dense Object Segmentation. In Proceedings of the 2019 IEEE/CVF International Conference on Computer Vision (ICCV), Seoul, Republic of Korea, 27 October–2 November 2019; pp. 2061–2069. [Google Scholar]
  64. Ke, L.; Danelljan, M.; Li, X.; Tai, Y.-W.; Tang, C.-K.; Yu, F. Mask Transfiner for High-Quality Instance Segmentation. In Proceedings of the 2022 IEEE/CVF Conference on Computer Vision and Pattern Recognition (CVPR), New Orleans, LA, USA, 18–24 June 2022; pp. 4402–4411. [Google Scholar]
  65. Liu, Z.; Hu, H.; Lin, Y.; Yao, Z.; Xie, Z.; Wei, Y.; Ning, J.; Cao, Y.; Zhang, Z.; Dong, L.; et al. Swin Transformer V2: Scaling up Capacity and Resolution. In Proceedings of the 2022 IEEE/CVF Conference on Computer Vision and Pattern Recognition (CVPR), New Orleans, LA, USA, 18–24 June 2022; pp. 11999–12009. [Google Scholar]
  66. Liu, Z.; Lin, Y.; Cao, Y.; Hu, H.; Wei, Y.; Zhang, Z.; Lin, S.; Guo, B. Swin Transformer: Hierarchical Vision Transformer Using Shifted Windows. In Proceedings of the 2021 IEEE/CVF International Conference on Computer Vision (ICCV), Montreal, QC, Canada, 11–17 October 2021; pp. 9992–10002. [Google Scholar]
  67. Zuo, D.; Hu, H.; Qian, R.; Liu, Z. An Insulator Defect Detection Algorithm Based on Computer Vision. In Proceedings of the 2017 IEEE International Conference on Information and Automation (ICIA), Macau, China, 18–20 July 2017; pp. 361–365. [Google Scholar]
  68. Cheng, H.; Zhai, Y.; Chen, R.; Wang, D.; Dong, Z.; Wang, Y. Self-Shattering Defect Detection of Glass Insulators Based on Spatial Features. Energies 2019, 12, 543. [Google Scholar] [CrossRef]
  69. Li, X.; Su, H.; Liu, G. Insulator Defect Recognition Based on Global Detection and Local Segmentation. IEEE Access 2020, 8, 59934–59946. [Google Scholar] [CrossRef]
  70. Liu, W.; Liu, Z.; Wang, H.; Han, Z. An Automated Defect Detection Approach for Catenary Rod-Insulator Textured Surfaces Using Unsupervised Learning. IEEE Trans. Instrum. Meas. 2020, 69, 8411–8423. [Google Scholar] [CrossRef]
  71. Alahyari, A.; Hinneck, A.; Tariverdizadeh, R.; Pozo, D. Segmentation and Defect Classification of the Power Line Insulators: A Deep Learning-Based Approach. In Proceedings of the 2020 International Conference on Smart Grids and Energy Systems (SGES), Perth, Australia, 23–26 November 2020; pp. 476–481. [Google Scholar]
  72. Antwi-Bekoe, E.; Liu, G.; Ainam, J.-P.; Sun, G.; Xie, X. A Deep Learning Approach for Insulator Instance Segmentation and Defect Detection. Neural Comput. Appl. 2022, 34, 7253–7269. [Google Scholar] [CrossRef]
  73. Guo, J.; Li, T.; Du, B. Segmentation Head Networks with Harnessing Self-Attention and Transformer for Insulator Surface Defect Detection. Appl. Sci. 2023, 13, 9109. [Google Scholar] [CrossRef]
  74. Badrinarayanan, V.; Kendall, A.; Cipolla, R. SegNet: A Deep Convolutional Encoder-Decoder Architecture for Image Segmentation. arXiv 2016, arXiv:1511.00561. [Google Scholar] [CrossRef] [PubMed]
  75. Romera, E.; Alvarez, J.M.; Bergasa, L.M.; Arroyo, R. ERFNet: Efficient Residual Factorized ConvNet for Real-Time Semantic Segmentation. IEEE Trans. Intell. Transport. Syst. 2018, 19, 263–272. [Google Scholar] [CrossRef]
  76. Dosovitskiy, A.; Beyer, L.; Kolesnikov, A.; Weissenborn, D.; Zhai, X.; Unterthiner, T.; Dehghani, M.; Minderer, M.; Heigold, G.; Gelly, S.; et al. An Image Is Worth 16x16 Words: Transformers for Image Recognition at Scale. arXiv 2021, arXiv:2010.11929. [Google Scholar]
  77. Tian, Z.; Shen, C.; Chen, H.; He, T. FCOS: Fully Convolutional One-Stage Object Detection. In Proceedings of the 2019 IEEE/CVF International Conference on Computer Vision (ICCV), Seoul, Republic of Korea, 27 October–2 November 2019; pp. 9626–9635. [Google Scholar]
  78. He, K.; Zhang, X.; Ren, S.; Sun, J. Deep Residual Learning for Image Recognition. In Proceedings of the 2016 IEEE Conference on Computer Vision and Pattern Recognition (CVPR), Las Vegas, NV, USA, 27–30 June 2016; pp. 770–778. [Google Scholar]
  79. Lin, T.-Y.; Dollar, P.; Girshick, R.; He, K.; Hariharan, B.; Belongie, S. Feature Pyramid Networks for Object Detection. In Proceedings of the 2017 IEEE Conference on Computer Vision and Pattern Recognition (CVPR), Honolulu, HI, USA, 21–26 July 2017; pp. 936–944. [Google Scholar]
  80. Awrangjeb, M.; Lu, G.; Fraser, C.S.; Ravanbakhsh, M. A Fast Corner Detector Based on the Chord-to-Point Distance Accumulation Technique. In Proceedings of the 2009 Digital Image Computing: Techniques and Applications, Melbourne, Australia, 1–3 December 2009; pp. 519–525. [Google Scholar]
  81. Han, J.H.; Poston, T. Chord-to-Point Distance Accumulation and Planar Curvature: A New Approach to Discrete Curvature. Pattern Recognit. Lett. 2001, 22, 1133–1144. [Google Scholar] [CrossRef]
  82. Canny, J. A Computational Approach to Edge Detection. IEEE Trans. Pattern Anal. Mach. Intell. 1986, PAMI-8, 679–698. [Google Scholar] [CrossRef]
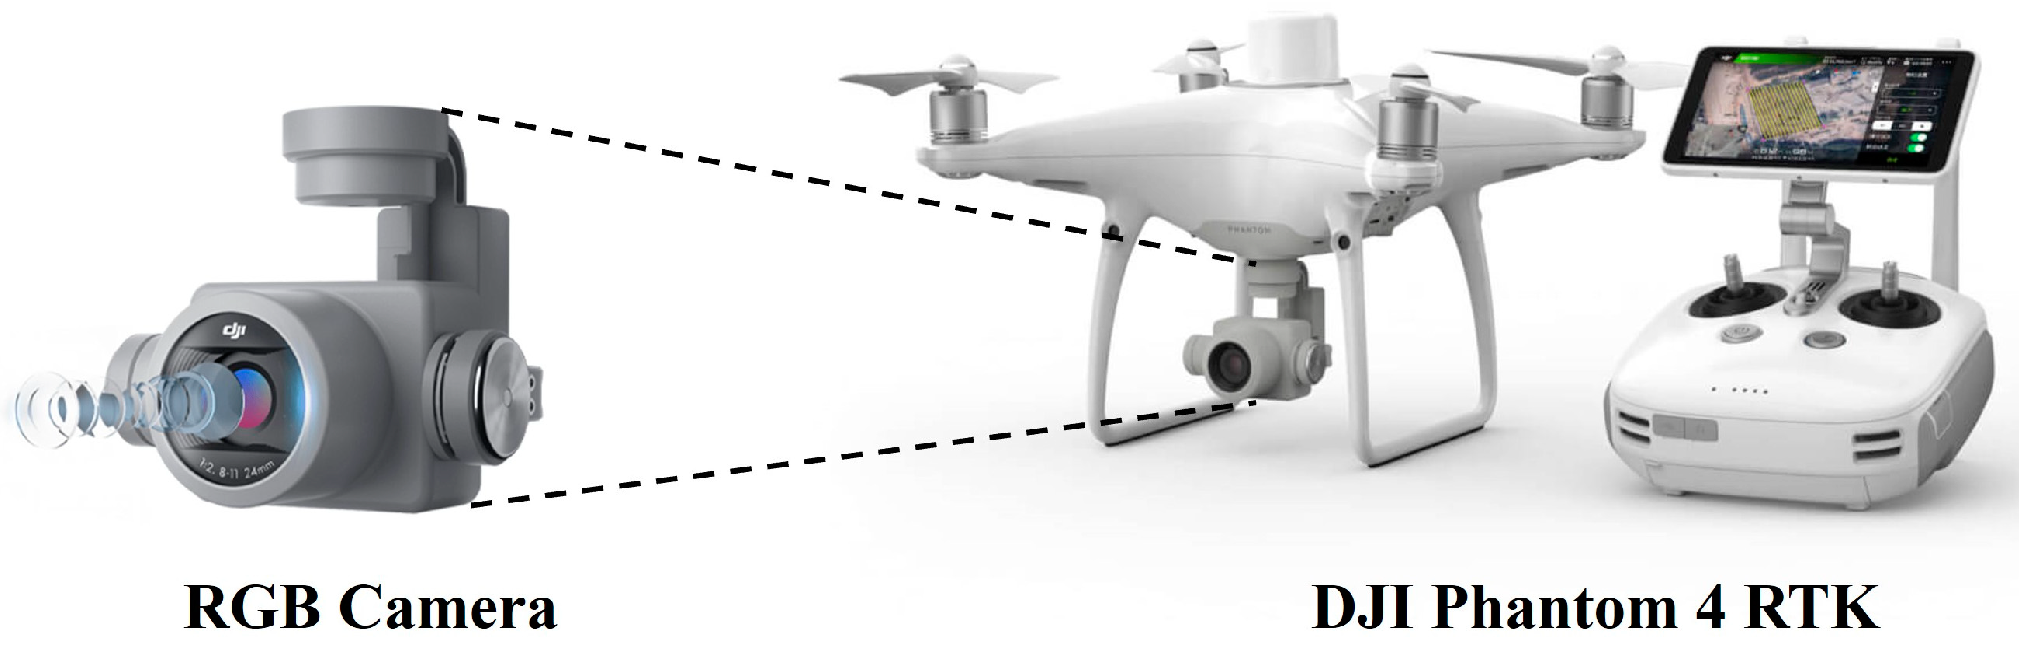
  83. DJI Phantom 4 rtk-DJI Innovations. Available online: https://enterprise.dji.com/cn/photo (accessed on 22 June 2024).
  84. Xie, X.; Liu, Z.; Xu, C.; Zhang, Y. A Multiple Sensors Platform Method for Power Line Inspection Based on a Large Unmanned Helicopter. Sensors 2017, 17, 1222. [Google Scholar] [CrossRef] [PubMed]
  85. Mojahed, A. Alimojahed/Insulator-Instance-Segmentation. 2023. Available online: https://Github.Com/Alimojahed/Insulator-Instance-Segmentation (accessed on 28 October 2023).
  86. Li, W.; Liu, W.; Zhu, J.; Cui, M.; Yu, R.; Hua, X.; Zhang, L. Box2Mask: Box-Supervised Instance Segmentation via Level-Set Evolution. 2022. arXiv 2022, arXiv:2212.01579. [Google Scholar]
Figure 1. Framework of ID-Det.
Drones 08 00299 g001
Figure 2. Overall structure of ISNet.
Drones 08 00299 g002
Figure 3. Insulator Clipping Module.
Drones 08 00299 g003
Figure 4. Main network’s detailed structure.
Drones 08 00299 g004
Figure 5. Insulator polar representation.
Drones 08 00299 g005
Figure 6. Chips Stitching Module.
Drones 08 00299 g006
Figure 7. Workflow of the Insulator Burst Detector.
Drones 08 00299 g007
Figure 8. Schematic diagram of curvature calculation.
Drones 08 00299 g008
Figure 9. Schematic diagram of distance-based clustering calculations.
Drones 08 00299 g009
Figure 10. Schematic diagram of Periodic Distribution Feature.
Drones 08 00299 g010
Figure 11. UAV system used in the experiment.
Drones 08 00299 g011
Figure 12. Raw image samples.
Drones 08 00299 g012
Figure 13. ID dataset samples in the zoomed-in view.
Drones 08 00299 g013
Figure 14. Comparison of A, B, C, and D.
Drones 08 00299 g014
Figure 15. Burst detection result samples.
Drones 08 00299 g015
Figure 16. Instances of FN and FP.
Drones 08 00299 g016
Table 1. Comparison of different insulator defect detection methods.
YearNameTypeMethodologyFeature
2019Prates’ method [44]Detection-BasedNon-Conformity DetectionSimple and lightweight model
2020Wang’s method [46]Detection-BasedResNeSt-based MethodHigh accuracy
2020Tao’s method [47]Detection-BasedCascade MethodData augmentation to adapt to complex backgrounds
2021CSPD-YOLO [48]Detection-BasedYOLOv3-based MethodHigh accuracy
2023Yi’s method [49]Detection-BasedYOLO-S-based MethodLightweight and high speed
2023Zhang’s method [50]Detection-BasedYOLOv5-based MethodLightweight and high speed
2023Chen’s method [51]Detection-BasedAttention Feedback-based MethodAdapting to complex backgrounds
2017Zuo’s method [67]Segmentation-BasedFilter-based MethodSimple traditional image processing-based method
2019Cheng’s method [68]Segmentation-BasedSpatial Features-based MethodHigh accuracy
2020Li’s method [69]Segmentation-BasedDefect Recognition MethodSegmenting defect areas individually
2020Liu’s method [70]Segmentation-BasedUnsupervised MethodImproving the ambiguity of the edges of the recovered images
2020Alahyari’s method [71]Segmentation-BasedTwo-stage MethodTwo-stage and simple model
2022Antwi-Bekoe’s method [72]Segmentation-BasedAttention-based MethodHigh accuracy
2023HST-Net [73]Segmentation-BasedHarnessing self-attention and transformerAdapting to complex backgrounds
2024Ours (ID-Det)Segmentation-BasedInsulator Segmentation Network (ISNet) and Insulator Burst Detector (IBD)Fine edge segmentation, high precision, lightweight model, potential for application
Note: The bold text indicates our proposed method.
Table 2. Comparison of AP for ablation experiment of segmentation.
MethodAP (segm)AP50 (segm)AP75 (segm)APS (segm)APM (segm)APL (segm)
Baseline0.3030.7090.2400.10.32
Baseline with PCA Module0.4770.9490.3620.30.2560.497
Baseline with Chips Module0.4660.8610.3890.1810.4070.498
Baseline with PCA Module and Chips Module0.575 (27.2%↑)0.914 (20.5%↑)0.687 (44.7%↑)0.128 (12.8%↑)0.545 (44.5%↑)0.693 (37.3%↑)
Note: The bold text indicates the results obtained by our method and the upward arrows indicate relative improvement.
Table 3. Comparison of AP for ablation experiment of bounding box.
MethodAP (bbox)AP50 (bbox)AP75 (bbox)APS (bbox)APM (bbox)APL (bbox)
Baseline0.8580.8680.86800.850.863
Baseline with PCA Module0.9730.980.980.80.4330.997
Baseline with Chips Module0.8670.8890.8860.5660.6580.956
Baseline with PCA Module and Chips Module0.911 (5.3%↑)0.949 (8.1%↑)0.915 (4.7%↑)0.419 (41.9%↑)0.989 (13.9%↑)0.999 (13.6%↑)
Note: The bold text indicates the results obtained by our method and the upward arrows indicate relative improvement.
Table 4. Comparison of AR for ablation experiment of segmentation.
MethodAR (segm)ARS (segm)ARM (segm)ARL (segm)
Baseline0.37700.150.384
Baseline with PCA Module0.5240.30.40.54
Baseline with Chips Module0.550.2120.5460.547
Baseline with PCA Module and Chips Module0.602 (22.5%↑)0.204 (20.4%↑)0.585 (43.5%↑)0.703 (31.9%↑)
Note: The bold text indicates the results obtained by our method and the upward arrows indicate relative improvement.
Table 5. Comparison of AR for ablation experiment of bounding box.
MethodAR (bbox)ARS (bbox)ARM (bbox)ARL (bbox)
Baseline0.9800.850.983
Baseline with PCA Module0.9910.80.8670.998
Baseline with Chips Module0.9610.5750.8640.987
Baseline with PCA Module and Chips Module0.944 (−3.6%↑)0.603 (60.3%↑)0.994 (14.4%↑)0.999 (1.6%↑)
Note: The bold text indicates the results obtained by our method and the upward arrows indicate relative improvement.
Table 6. Evaluation results.
MethodTotal QuantityNumber of Defective InsulatorsTPFPTNFNAccuracyPrecisionRecall
ID-Det16145515211410493097.27%97.38%94.56%
Table 7. Comparison results.
MethodAccuracyPrecisionRecallSegmentation
/Detection Speed (ms)
Corner
Extraction Speed (ms)
Defect
Detection Speed (ms)
YOLOv5 [33]85.068%92.12%61.525%17.7--
YOLOv7 [35]91.078%90.946%82.033%31.3--
YOLOv8 [36]91.326%88.555%85.662%39.5--
YOLOv9 [37]90.892%88.550%84.211%49.8--
Swin transformer [66]92.937%87.737%92.196%394.1--
ID-Det97.27%97.38%94.56%213.844.0231.7
Note: The bold text indicates the results obtained by our method.
Table 8. Comparison with an open-source method.
MethodAPAP50AP75APSAPMAPL
Box2Mask [86] (segm)0.1930.5980.0690.2000.2750.200
Ours (ISNet) (segm)0.575 (38.2%↑)0.914 (31.6%↑)0.687 (61.8%↑)0.128 (−7.2%↑)0.545 (27.0%↑)0.693 (49.3%↑)
Box2Mask [86] (bbox)0.8470.8500.8500.9000.8080.851
Ours (ISNet) (bbox)0.911 (6.4%↑)0.949 (9.9%↑)0.915 (6.5%↑)0.419 (−48.1%↑)0.989 (18.1%↑)0.999 (14.8%↑)
Note: The bold text indicates the results obtained by our method and the upward arrows indicate relative improvement.
Disclaimer/Publisher’s Note: The statements, opinions and data contained in all publications are solely those of the individual author(s) and contributor(s) and not of MDPI and/or the editor(s). MDPI and/or the editor(s) disclaim responsibility for any injury to people or property resulting from any ideas, methods, instructions or products referred to in the content.

