Effect of Surface Modification with Different Acids on the Functional Groups of AF 5 Catalyst and Its Catalytic Effect on the Atmospheric Leaching of Enargite
Abstract
:1. Introduction
2. Materials and Experimental Methods
2.1. Materials
2.2. Pre-Treatment and Leaching Tests
2.3. Solid Analysis
3. Results and Discussion
3.1. Pre-Treated AF 5 Surface Characterization
3.1.1. Infrared (IR) Spectroscopy Analysis
3.1.2. Surface Analysis by XPS
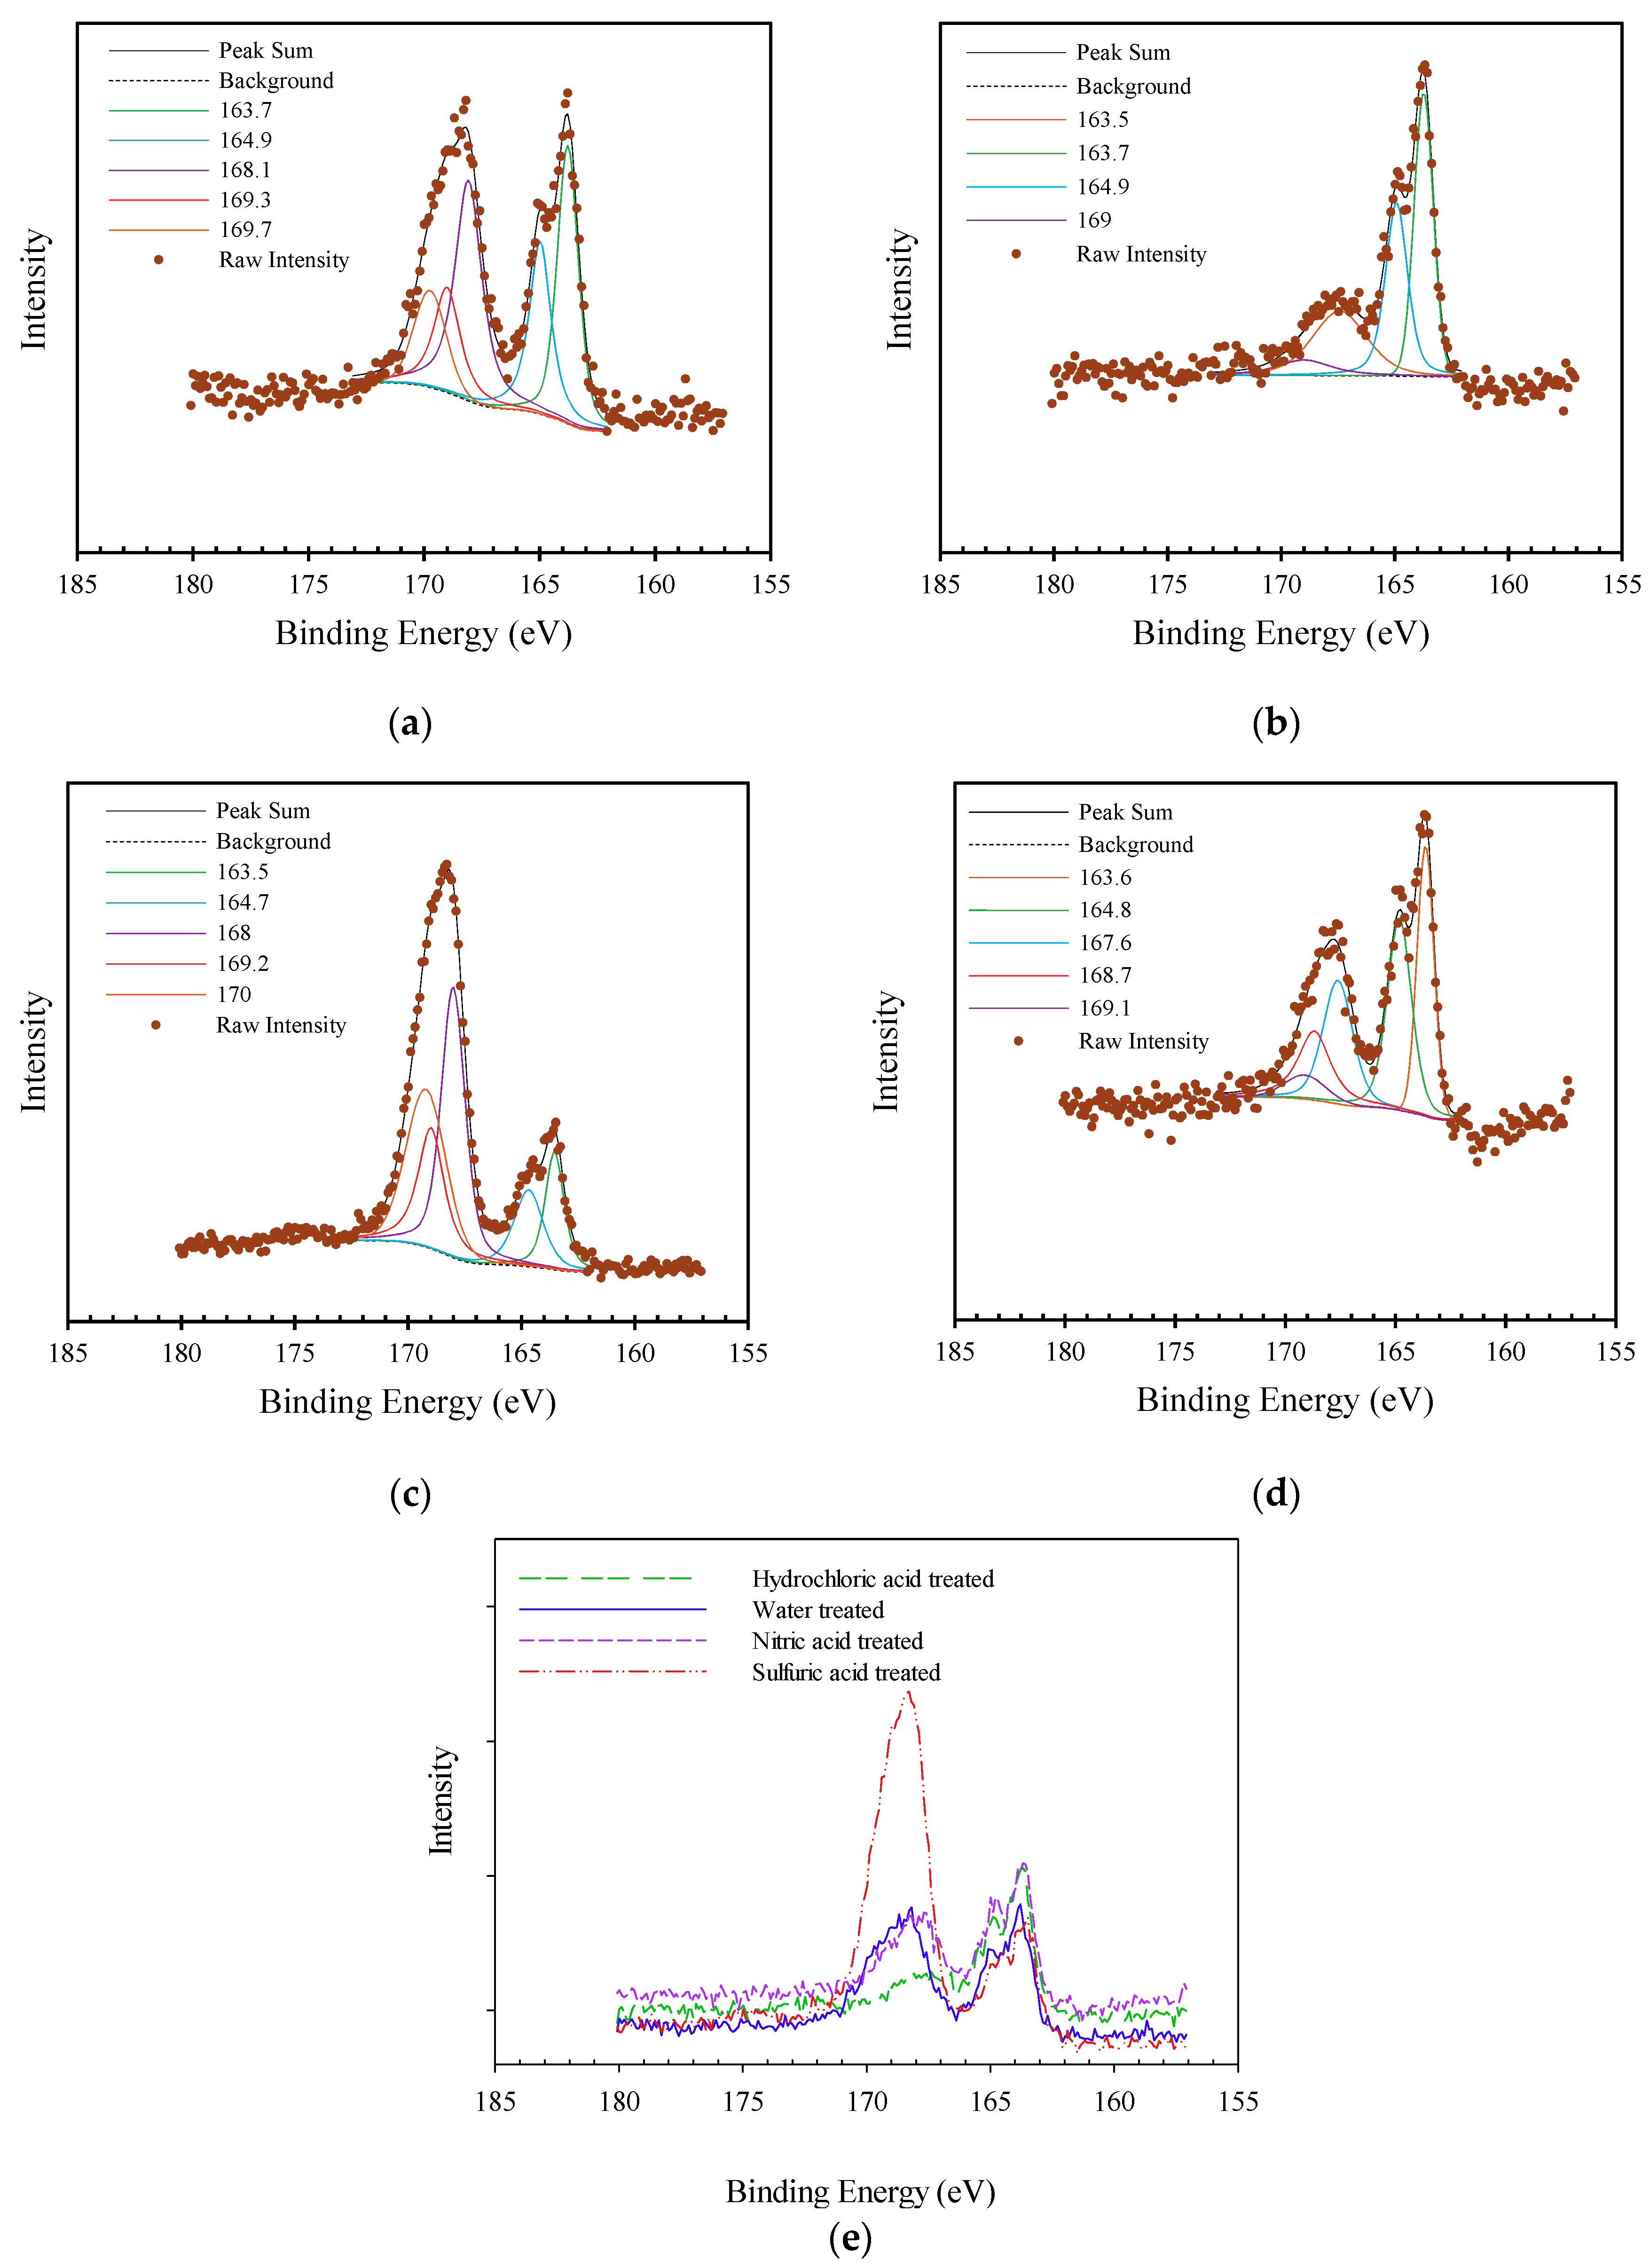
3.1.3. Sulfur Analysis
3.2. Effect of Catalyst Pre-Treatment and Leaching Media on Enargite Leaching
3.2.1. Oxidative Enargite Leaching with AF 5 catalyst
3.2.2. In-Situ Arsenic Oxidation with AF 5 Catalyst
3.2.3. Elemental Sulfur Adsorption onto AF 5 during Leaching Tests
4. Conclusions
Author Contributions
Funding
Conflicts of Interest
References
- Jahromi, F.G.; Cowan, D.H.; Ghahreman, A. Lanxess Lewatit® AF 5 and activated carbon catalysis of enargite leaching in chloride media; a parameters study. Hydrometallurgy 2017, 174, 184–194. [Google Scholar] [CrossRef]
- Cowan, D.H.; Jahromi, F.G.; Ghahreman, A. Atmospheric oxidation of pyrite with a novel catalyst and ultra-high elemental sulphur yield. Hydrometallurgy 2017, 173, 156–169. [Google Scholar] [CrossRef]
- Montes-Morán, M.A.; Suárez, D.; Menéndez, J.A.; Fuente, E. On the nature of basic sites on carbon surfaces: An overview. Carbon N. Y. 2004, 42, 1219–1225. [Google Scholar] [CrossRef]
- Andreas, H.A.; Conway, B.E. Examination of the double-layer capacitance of an high specific-area C-cloth electrode as titrated from acidic to alkaline pHs. Electrochim. Acta 2006, 51, 6510–6520. [Google Scholar] [CrossRef]
- Karatepe, N.; Orbak, I.; Yavuz, R.; Özyuǧuran, A. Sulfur dioxide adsorption by activated carbons having different textural and chemical properties. Fuel 2008, 87, 3207–3215. [Google Scholar] [CrossRef]
- Hulicova-Jurcakova, D.; Seredych, M.; Lu, G.Q.; Bandosz, T.J. Combined effect of nitrogen- and oxygen-containing functional groups of microporous activated carbon on its electrochemical performance in supercapacitors. Adv. Funct. Mater. 2009, 19, 438–447. [Google Scholar] [CrossRef]
- Shim, J.W.; Park, S.J.; Ryu, S.K. Effect of modification with HNO3 and NaOH on metal adsorption by pitch-based activated carbon fibers. Carbon N. Y. 2001, 39, 1635–1642. [Google Scholar] [CrossRef]
- Fu, K.; Yue, Q.; Gao, B.; Wang, Y.; Li, Q. Activated carbon from tomato stem by chemical activation with FeCl2. Colloids Surf. A Physicochem. Eng. Asp. 2017, 529, 842–849. [Google Scholar] [CrossRef]
- Prestidge, C.A.; Thiel, A.G.; Ralston, J.; Smart, R.S.C. The interaction of ethyl xanthate with copper(II)—Activated zinc sulphide: Kinetic effects. Colloids Surf. A Physicochem. Eng. Asp. 1994, 85, 51–68. [Google Scholar] [CrossRef]
- Bandosz, T.J.; Ania, C.O. Activated Carbon Surfaces in Environmental Remediation. Interface Sci. Technol. 2006, 7, 159–229. [Google Scholar] [CrossRef]
- Mangun, C.L.; DeBarr, J.A.; Economy, J. Adsorption of sulfur dioxide on ammonia-treated activated carbon fibers. Carbon N. Y. 2001, 39, 1689–1696. [Google Scholar] [CrossRef]
- Boudou, J.-P.P.; Chehimi, M.; Broniek, E.; Siemieniewska, T.; Bimer, J. Adsorption of H2S or SO2 on an activated carbon cloth modified by ammonia treatment. Carbon N. Y. 2003, 41, 1999–2007. [Google Scholar] [CrossRef]
- Rosas, J.M.; Ruiz-Rosas, R.; Rodríguez-Mirasol, J.; Cordero, T. Kinetic study of SO2 removal over lignin-based activated carbon. Chem. Eng. J. 2017, 307, 707–721. [Google Scholar] [CrossRef]
- Sun, F.; Gao, J.; Liu, X.; Tang, X.; Wu, S. A systematic investigation of SO2 removal dynamics by coal-based activated cokes: The synergic enhancement effect of hierarchical pore configuration and gas components. Appl. Surf. Sci. 2015, 357, 1895–1901. [Google Scholar] [CrossRef]
- Bai, B.C.; Lee, C.W.; Lee, Y.S.; Im, J.S. Metal impregnate on activated carbon fiber for SO2 gas removal: Assessment of pore structure, Cu supporter, breakthrough, and bed utilization. Colloids Surf. A Physicochem. Eng. Asp. 2016, 509, 73–79. [Google Scholar] [CrossRef]
- Ahumada, E.; Lizama, H.; Orellana, F.; Suarez, C.; Huidobro, A.; Seoulveda-Escribano, A.; Rodriquez-Reinoso, F. Catalytic oxidation of Fe (II) by activated carbon in the presence of oxygen. Effect of the surface oxidation degree on the catalytic activity. Carbon N. Y. 2002, 40, 2827–2834. [Google Scholar] [CrossRef]
- Biniak, S.; Szymański, G.; Siedlewski, J.; Światkoski, A. The characterization of activated carbons with oxygen and nitrogen surface groups. Carbon N. Y. 1997, 35, 1799–1810. [Google Scholar] [CrossRef]
- Sun, Z.; Chai, L.; Shu, Y.; Li, Q.; Liu, M.; Qiu, D. Chemical bond between chloride ions and surface carboxyl groups on activated carbon. Colloids Surf. A Physicochem. Eng. Asp. 2017, 530, 53–59. [Google Scholar] [CrossRef]
- Wang, Q.; Lei, X.; Pan, F.; Xia, D.; Shang, Y.; Sun, W.; Liu, W. A new type of activated carbon fibre supported titanate nanotubes for high-capacity adsorption and degradation of methylene blue. Colloids Surf. A Physicochem. Eng. Asp. 2018, 555, 605–614. [Google Scholar] [CrossRef]
- Lu, X.; Jiang, J.; Sun, K.; Zhu, G.; Lin, G. Enhancement of Pb2+ removal by activating carbon spheres/activated carbon composite material with H2O vapor. Colloids Surf. A Physicochem. Eng. Asp. 2016, 506, 637–645. [Google Scholar] [CrossRef]
- Pevida, C.; Plaza, M.G.; Arias, B.; Fermoso, J.; Rubiera, F.; Pis, J.J. Surface modification of activated carbons for CO2 capture. Appl. Surf. Sci. 2008, 254, 7165–7172. [Google Scholar] [CrossRef]
- Chingombe, P.; Saha, B.; Wakeman, R.J. Surface modification and characterisation of a coal-based activated carbon. Carbon N. Y. 2005, 43, 3132–3143. [Google Scholar] [CrossRef]
- Shin, S.; Jang, J.; Yoon, S.-H.; Mochida, I. A study on the effect of heat treatment on functional groups of pitch based activated carbon fiber using FTIR. Carbon N. Y. 1997, 35, 1739–1743. [Google Scholar] [CrossRef]
- Terzyk, A.P. The influence of activated carbon surface chemical composition on the adsorption of acetaminophen (paracetamol) in vitro. Part II. TG, FTIR, and XPS analysis of carbons and the temperature dependence of adsorption kinetics at the neutral pH. Colloids Surf. A Physicochem. Eng. Asp. 2001, 177, 23–45. [Google Scholar] [CrossRef]
- Zhou, J.H.; Sui, Z.J.; Zhu, J.; Li, P.; Chen, D.; Dai, Y.C.; Yuan, W.K. Characterization of surface oxygen complexes on carbon nanofibers by TPD, XPS and FT-IR. Carbon N. Y. 2007, 45, 785–796. [Google Scholar] [CrossRef]
- Kundu, S.; Wang, Y.; Xia, W.; Muhler, M. Thermal Stability and Reducibility of Oxygen-Containing Functional Groups on Multiwalled Carbon Nanotube Surfaces: A Quantitative High-Resolution XPS and TPD/TPR Study. J. Phys. Chem. C 2008, 112, 16869–16878. [Google Scholar] [CrossRef]
- Puziy, A.M.; Poddubnaya, O.I.; Socha, R.P.; Gurgul, J.; Wisniewski, M. XPS and NMR studies of phosphoric acid activated carbons. Carbon N. Y. 2008, 46, 2113–2123. [Google Scholar] [CrossRef]
- Figueiredo, J.L.; Pereira, M.F.R.; Freitas, M.M.; Órfão, J.J.M. Modification of the surface chemistry of activated carbons. Carbon N. Y. 1999, 37, 1379–1389. [Google Scholar] [CrossRef]
- Figueiredo, J.L.; Pereira, M.F.R. The role of surface chemistry in catalysis with carbons. Catal. Today 2010, 150, 2–7. [Google Scholar] [CrossRef]
- Safarzadeh, M.S.; Moats, M.S.; Miller, J.D. An Update to “Recent Trends in the Processing of Enargite Concentrates”. Miner. Process. Extr. Metall. Rev. 2012, 35, 390–422. [Google Scholar] [CrossRef]
- Ruiz, M.C.; Vera, M.V.; Padilla, R. Mechanism of enargite pressure leaching in the presence of pyrite. Hydrometallurgy 2011, 105, 290–295. [Google Scholar] [CrossRef]
- Jahromi, F.G.; Ghahreman, A. In-situ oxidative arsenic precipitation as scorodite during carbon catalyzed enargite leaching process. J. Hazard. Mater. 2018, 360, 631–638. [Google Scholar] [CrossRef] [PubMed]
- Demopoulos, G.P. Aqueous precipitation and crystallization for the production of particulate solids with desired properties. Hydrometallurgy 2009, 96, 199–214. [Google Scholar] [CrossRef]
- le Berre, J.F.; Gauvin, R.; Demopoulos, G.P. A study of the crystallization kinetics of scorodite via the transformation of poorly crystalline ferric arsenate in weakly acidic solution. Colloids Surf. A Physicochem. Eng. Asp. 2008, 315, 117–129. [Google Scholar] [CrossRef]


| Element | Copper | Iron | Arsenic | Sulfur | Zinc | Silver |
|---|---|---|---|---|---|---|
| Composition | wt% | ppm | ||||
| 24.4 | 20.1 | 8.5 | 39.0 | 0.7 | 99 | |
| Mineral | Chemical Formula | Mass% |
|---|---|---|
| Enargite | Cu3AsS4 | 45.6 |
| Pyrite | FeS2 | 43.0 |
| Sphalerite Iron | (Zn, Fe)S | 2.6 |
| Quartz | SiO2 | 2.5 |
| Chalcopyrite | CuFeS2 | 2.4 |
| Tennantite | (Cu, Fe)12As4S13 | 1.4 |
| Bornite | Cu5FeS4 | 0.8 |
| Arsenopyrite | FeAsS | 0.6 |
| Galena | PbS | 0.6 |
| Covellite | CuS | 0.5 |
| Total | 100.0 |
| Sample | O 1s Relative Concentration (%) | ||
|---|---|---|---|
| Peak 1 | Peak 2 | Peak 3 | |
| Water-treated | 36.8 | 30.7 | 32.5 |
| Hydrochloric acid-treated | 29.8 | 33.9 | 36.3 |
| Sulfuric acid-treated | 45.4 | 17.3 | 37.3 |
| Nitric acid-treated | 23.5 | 49.0 | 27.5 |
| Sample | C 1s Relative Concentration (%) | |||||
|---|---|---|---|---|---|---|
| Peak 1 | Peak 2 | Peak 3 | Peak 4 | Peak 5 | Oxygenated Carbon | |
| Water-treated | 64.7 | 16.2 | 5.1 | 5.9 | 8.1 | 27.2 |
| Hydrochloric acid-treated | 64.3 | 17.7 | 5.1 | 5.6 | 7.3 | 28.3 |
| Sulfuric acid-treated | 61.8 | 15.9 | 8.3 | 6.5 | 7.5 | 30.6 |
| Nitric acid-treated | 65.7 | 12.8 | 8.7 | 7.7 | 5.1 | 29.2 |
| Catalyst | Sulfur Content (%) |
|---|---|
| Water-treated (Fresh) AF 5 | 1.06 |
| Sulfuric acid-treated AF 5 | 2.12 |
| Hydrochloric acid-treated AF 5 | 0.97 |
| Nitric acid-treated AF 5 | 0.88 |
| Experiment | S in Residue (%) | S in Solution (%) | S Collected by AF 5 (%) |
|---|---|---|---|
| Water-treated AF 5 hydrochloric acid leach | 16.9 | 51.8 | 30.9 |
| Water-treated AF 5 sulfuric acid leach | 9.5 | 39.2 | 51.1 |
| Nitric acid-treated AF 5 sulfuric acid leach | 0.4 | 54.6 | 45.1 |
© 2019 by the authors. Licensee MDPI, Basel, Switzerland. This article is an open access article distributed under the terms and conditions of the Creative Commons Attribution (CC BY) license (http://creativecommons.org/licenses/by/4.0/).
Share and Cite
Jahromi, F.G.; Ghahreman, A. Effect of Surface Modification with Different Acids on the Functional Groups of AF 5 Catalyst and Its Catalytic Effect on the Atmospheric Leaching of Enargite. Colloids Interfaces 2019, 3, 45. https://doi.org/10.3390/colloids3020045
Jahromi FG, Ghahreman A. Effect of Surface Modification with Different Acids on the Functional Groups of AF 5 Catalyst and Its Catalytic Effect on the Atmospheric Leaching of Enargite. Colloids and Interfaces. 2019; 3(2):45. https://doi.org/10.3390/colloids3020045
Chicago/Turabian StyleJahromi, Fazel G., and Ahmad Ghahreman. 2019. "Effect of Surface Modification with Different Acids on the Functional Groups of AF 5 Catalyst and Its Catalytic Effect on the Atmospheric Leaching of Enargite" Colloids and Interfaces 3, no. 2: 45. https://doi.org/10.3390/colloids3020045
APA StyleJahromi, F. G., & Ghahreman, A. (2019). Effect of Surface Modification with Different Acids on the Functional Groups of AF 5 Catalyst and Its Catalytic Effect on the Atmospheric Leaching of Enargite. Colloids and Interfaces, 3(2), 45. https://doi.org/10.3390/colloids3020045


