Article

Catalytic Production of Levulinic and Formic Acids from Fructose over Superacid ZrO2–SiO2–SnO2 Catalyst

Institute for Sorption and Problems of Endoecology, National Academy of Sciences of Ukraine, 13 General Naumov Str., 03164 Kyiv, Ukraine
*
Author to whom correspondence should be addressed.
Colloids Interfaces 2022, 6(1), 4; https://doi.org/10.3390/colloids6010004
Submission received: 17 November 2021 / Revised: 29 December 2021 / Accepted: 4 January 2022 / Published: 8 January 2022

Abstract

:
Catalytic conversion of fructose to levulinic and formic acids over tin-containing superacid (H0 = −14.52) mixed oxide was studied. Mesoporous ZrO2–SiO2–SnO2 (Zr:Si:Sn = 1:2:0.4) was synthesized by the sol–gel method. The fructose transformation was carried out in a rotated autoclave at 160–190 °C for 1–5 h using a 20 wt.% aqueous solution. The results showed that doping ZrO2–SiO2 samples with Sn4+ ions improved both fructose conversion and selectivity toward levulinic and formic acids. Under optimal conditions of 180 °C, 3.5 h and fructose to catalyst weight ratio 20:1, levulinic and formic acids yields were 80% and 90%, respectively, at complete fructose conversion. At this, humic substances formed in the quantity of 10 wt.% based on the target products.

1. Introduction

The acid catalyzed hydrolysis of various biomass fractions such as starch sugars, cellulose, and fatty acids followed by conversions has long been known to produce useful platform chemicals [1]. The most prevalent products reported are glucose, fructose, furfural, 5–hydroxymethylfurfural, levulinic acid, and formic acid [1,2]. Levulinic acid is a bifunctional chemical substance containing ketone and carboxylic acid groups, which are important for the production of a wide range of chemicals such as levulinate esters, γ-valerolactone, acrylic acid, 1,4-pentanediol, angelica lactone, 2-methyl tetrahydrofuran, δ-aminolevulinic acid, etc. [1,2,3]. Formic acid is a low value commodity chemical substance used in the production of formaldehyde, rubber, plasticizers, pharmaceuticals, and textiles [4,5], but in the future may find increased utilization in fuel cell applications [5].
The semi-commercial process for the production of levulinic and formic acids from cellulosic feedstocks is based on the Biofine process [6]. The process claims to produce a levulinic acid yield from cellulose that is 70–80% of the theoretical maximum, and formic acid and tars make up the remainder [6]. The Biofine process involves the use of a homogeneous catalyst—dilute sulfuric acid—but it cannot be considered as a promising catalyst due to its limited recyclability, reactor corrosion, and waste generation.
Therefore, one of the tasks of commercializing levulinic acid is the synthesis of new environmentally-friendly efficient solid catalysts to replace the traditional mineral acids that may offer advantages due to their stability, reduced equipment corrosion issues, and the ability to be easily separated and recycled.
Nowadays, few solid acids have been tested as catalysts for the conversion of carbohydrates to yield levulinic acid. For example, Thapa et al. investigated polystyrene based on sulfonic acid resins as catalysts for fructose conversion (9% aqueous solution) and reached 58 mol% levulinic acid yield (near 60 mol% formic acid, fructose conversion—99%) after 24 h at 120 °C [7]. Upare et al. tested the sulfonated graphene oxide for glucose conversion (13% aqueous solution) at 200 °C for 2 h, leading to a remarkable levulinic acid yield of 74 mol% (16 mol% formic acid, glucose conversion—91%) [8]. A HY zeolite modified by metal halides was employed as a catalyst for converting 0.5–1% glucose with 62–66 wt.% of levulinic acid yield at 160–180 °C at 3–4 h [9,10]. A high yield (53.9 mol%) of levulinic acid with excellent accountability and total conversion of cellulose (2% aqueous solution) was achieved at 180 °C for 3 h on zirconium dioxide as a recyclable solid acid catalyst [11]. Additionally, the Ga salt of molydophosphoric acid was also used as a catalyst for the conversion of various carbohydrates (glucose, starch, and cellulose) and rice straw via a hydrothermal process at 175 °C for 10 h [12]. The maximum yield of 56 wt.% of levulinic acid was obtained from 3.3% aqueous glucose [12].
Levulinic acid yield is influenced by the textural characteristics of the catalyst and accessibility of acid sites on the surface [13,14,15]. The nature and strength of these acid sites play an important role in the selectivity toward target products. For example, Brønsted acid sites led to high selectivity in the dehydration of fructose to 5–hydroxymethylfurfural [14]. Lewis acids are assumed to be more efficient concerning levulinic acid production [15]. A combination of Brønsted and Lewis sites was effective for the chemical conversion of carbohydrates in water [13]. Solid superacids consist of both the Bronsted and Lewis acids sites. Chen et al. applied solid superacid, S2O42−/ZrO2−SiO2−Sm2O3, to catalyze the decomposition of steam exploded rice straw for the production of levulinic acid [16] and achieved the LA yield of 70% of the theoretical yield under optimal reaction conditions (200 °C, 10 min, 13.3% of solid superacid to pretreated rice straw, and 1:15 of solid–liquid ratio). The magnetic solid acid S2O82−/ZrO2–TiO2-Fe3O4 catalyst provides 70.2% yield of levulinic acid from glucose (30 g/L) at 200 °C for 2 h [17].
In our previous work, the new ternary acid ZrO2–SiO2–SnO2 oxides, stronger than 100% H2SO4 (H0 ≤ −12), were presented [18]. The highest strength (H0 = −14.52) and content (1.6–1.1 mmol/g) of acid sites were observed for samples with 20 ≤ Zr4+ ≤ 29, 60 ≤ Si4+ ≤ 67, 11 ≤ Sn4+ ≤ 20 at.%. It was shown that the surface of superacid ZrO2–SiO2–SnO2 oxides possess both Lewis and Brönsted acid sites, high surface area, and developed mesoporous structure [18]. The aim of this work was the investigation of the catalytic activity of a new superacid ZrO2–SiO2–SnO2 catalyst in the process of the chemical conversion of fructose as typical monosaccharides obtained from biomass to levulinic and formic acids, the search for optimal reaction conditions (reaction temperature, reaction time, substrate to catalyst ratio), and the study of the solid superacid reusability.

2. Materials and Methods

The ZrO2–SiO2 (atomic ratio Zr:Si = 1:2) and ZrO2–SiO2–SnO2 (atomic ratio Zr:Si:Sn = 1:2:0.4) oxides were synthesized by the sol–gel method [18]. In a typical procedure, zirconium oxychloride octahydrate (ZrOCl2·8H2O), tetraethyl orthosilicate (TEOS), tin (IV) chloride pentahydrate (SnCl4·5H2O), if necessary, and urea ((NH2)2CO) were used as starting materials. For pre-hydrolysis, TEOS was mixed with an aqueous ethanol solution with a weight ratio of TEOS:C2H5OH:H2O = 15:8:77; the pH was adjusted using a 1 M solution of HCl. The resulting solution was added to an aqueous solution of zirconium oxychloride and tin chloride. To prevent rapid precipitation of metal hydroxides, a three-fold excess of urea was added to the mixture and aged within 2 days at 93 °C. The obtained gel was washed to remove Cl ions, dried at 120 °C, and calcined at 750 °C for 2 h. As a result of sol–gel synthesis, the sample was obtained in the form of irregular granules with sizes of 0.5–2 mm.
The textural parameters of the samples were calculated from the adsorption–desorption isotherms of nitrogen using the Brunauer–Emmett–Teller method (BET) (Quantachrome Nova 2200e Surface Area and Pore Size Analyzer, Quantachrome, Bryton Beach, FL, USA). The computational error for specific surface area determination was ≤2%.
X-ray diffraction patterns of the samples were recorded with a DRON-4-07 diffractometer (CuKα radiation with Ni filter, Burevestnik, St. Petersburg, Russia) with Brag–Brentano registration geometry (2θ = 10–85°). Diffraction patterns were identified through a comparison with those from the JCPDS (Joint Committee of Powder Diffraction Standards PDF-2, 1998, Newtown Square, PA, USA) database.
The morphology of the calcined powder particles was observed using transmission electron microscopy (TEM) (JEM-1200 EX (JEOL, Tokyo, Japan)). The average size of the particles was estimated from the TEM micrographs using standard software (ImageJ [19]).
The total number of acid sites was determined by reverse titration using n-butylamine or 2,4-dinitrophenol solution in cyclohexane, respectively, with bromothymol blue as an indicator. The highest acid strength and concentration-strength acid site distribution were examined by the Hammett indicators method [20] using 0.1% solution of the corresponding indicators in cyclohexane.
For catalytic experiments, a relatively concentrated solution of 20 wt.% solution of D-fructose (N98%, Merck Life Science Sp.z.o.o., an affiliate of Merck KGaA, Darmstadt, Germany) in deionized water was used as a reaction mixture. The experiments were carried out in a rotated autoclave (60 rpm) at 160–190 °C for 1–5 h. Usually, 2 g of fructose, 10 g of deionized water, and the sieved fraction (0.5–1 mm) of the catalyst were placed into a 25 mL Teflon can (Kyiv, Ukraine). When the reaction ended, the reactor was immediately put into an ice water bath to decrease the temperature. Then, the reaction mixture was filtered, the residue was washed with deionized water, and then dried at 110 °C for reserve.
The concentrations of fructose and reaction products were analyzed using 13C NMR spectroscopy (Bruker Avance 400, Karlsruhe, Germany using D2O as a solvent) and by HPLC (Waters HPLC system; Alliance, MA, USA) with an Aminex HPX-87H chromatographic column (300 × 7.8 mm, Bio-Rad Laboratories, Inc. Richmond, CA, USA) equipped with a Waters 2414 refractive index detector, Waters 717plus autosampler, and Waters 1515 isocratic HPLC pump. The conditions for the analysis were set as follows: 4 mM H2SO4 as the mobile phase with a flow rate of 0.5 mL min−1 at 40 °C. The peaks for the different compounds were confirmed and quantified using external standards.
The conversion values of fructose (X) and yields of products (Y, mol%) were calculated as follows:
X   ( mol % ) = [ f r u c t o s e ] i [ f r u c t o s e ] p r [ f r u c t o s e ] i × 100
Y   ( mol % ) = [ product ] [ f r u c t o s e ] i × 100

3. Results and Discussion

The physicochemical characteristics of the synthesized catalysts are given in Table 1.
The structural analysis for the ZrO2–SiO2–SnO2 oxide, obtained from the X-ray diffraction patterns, shows the intensity of diffuse halos at 2θ = 30° and 51°, which is associated with the amorphous structure of the ZrO2–SiO2 matrix (Figure 1).
The absence of characteristic peaks assigned to tin oxide for ZrO2–SiO2–SnO2 indicates its high dispersion on the surface or in the volume of the ZrO2–SiO2 matrix. Adsorption data revealed that the introduction of tin ions into the ZrO2–SiO2 matrix led to a reduction in the specific surface area and pore volume of the ternary oxide (Table 1). The reduction can be attributed to the presence of SnO2 species within the ZrO2–SiO2 pores and channels. Both samples were mesoporous with an average pore diameter of 2.4–3.0 nm.
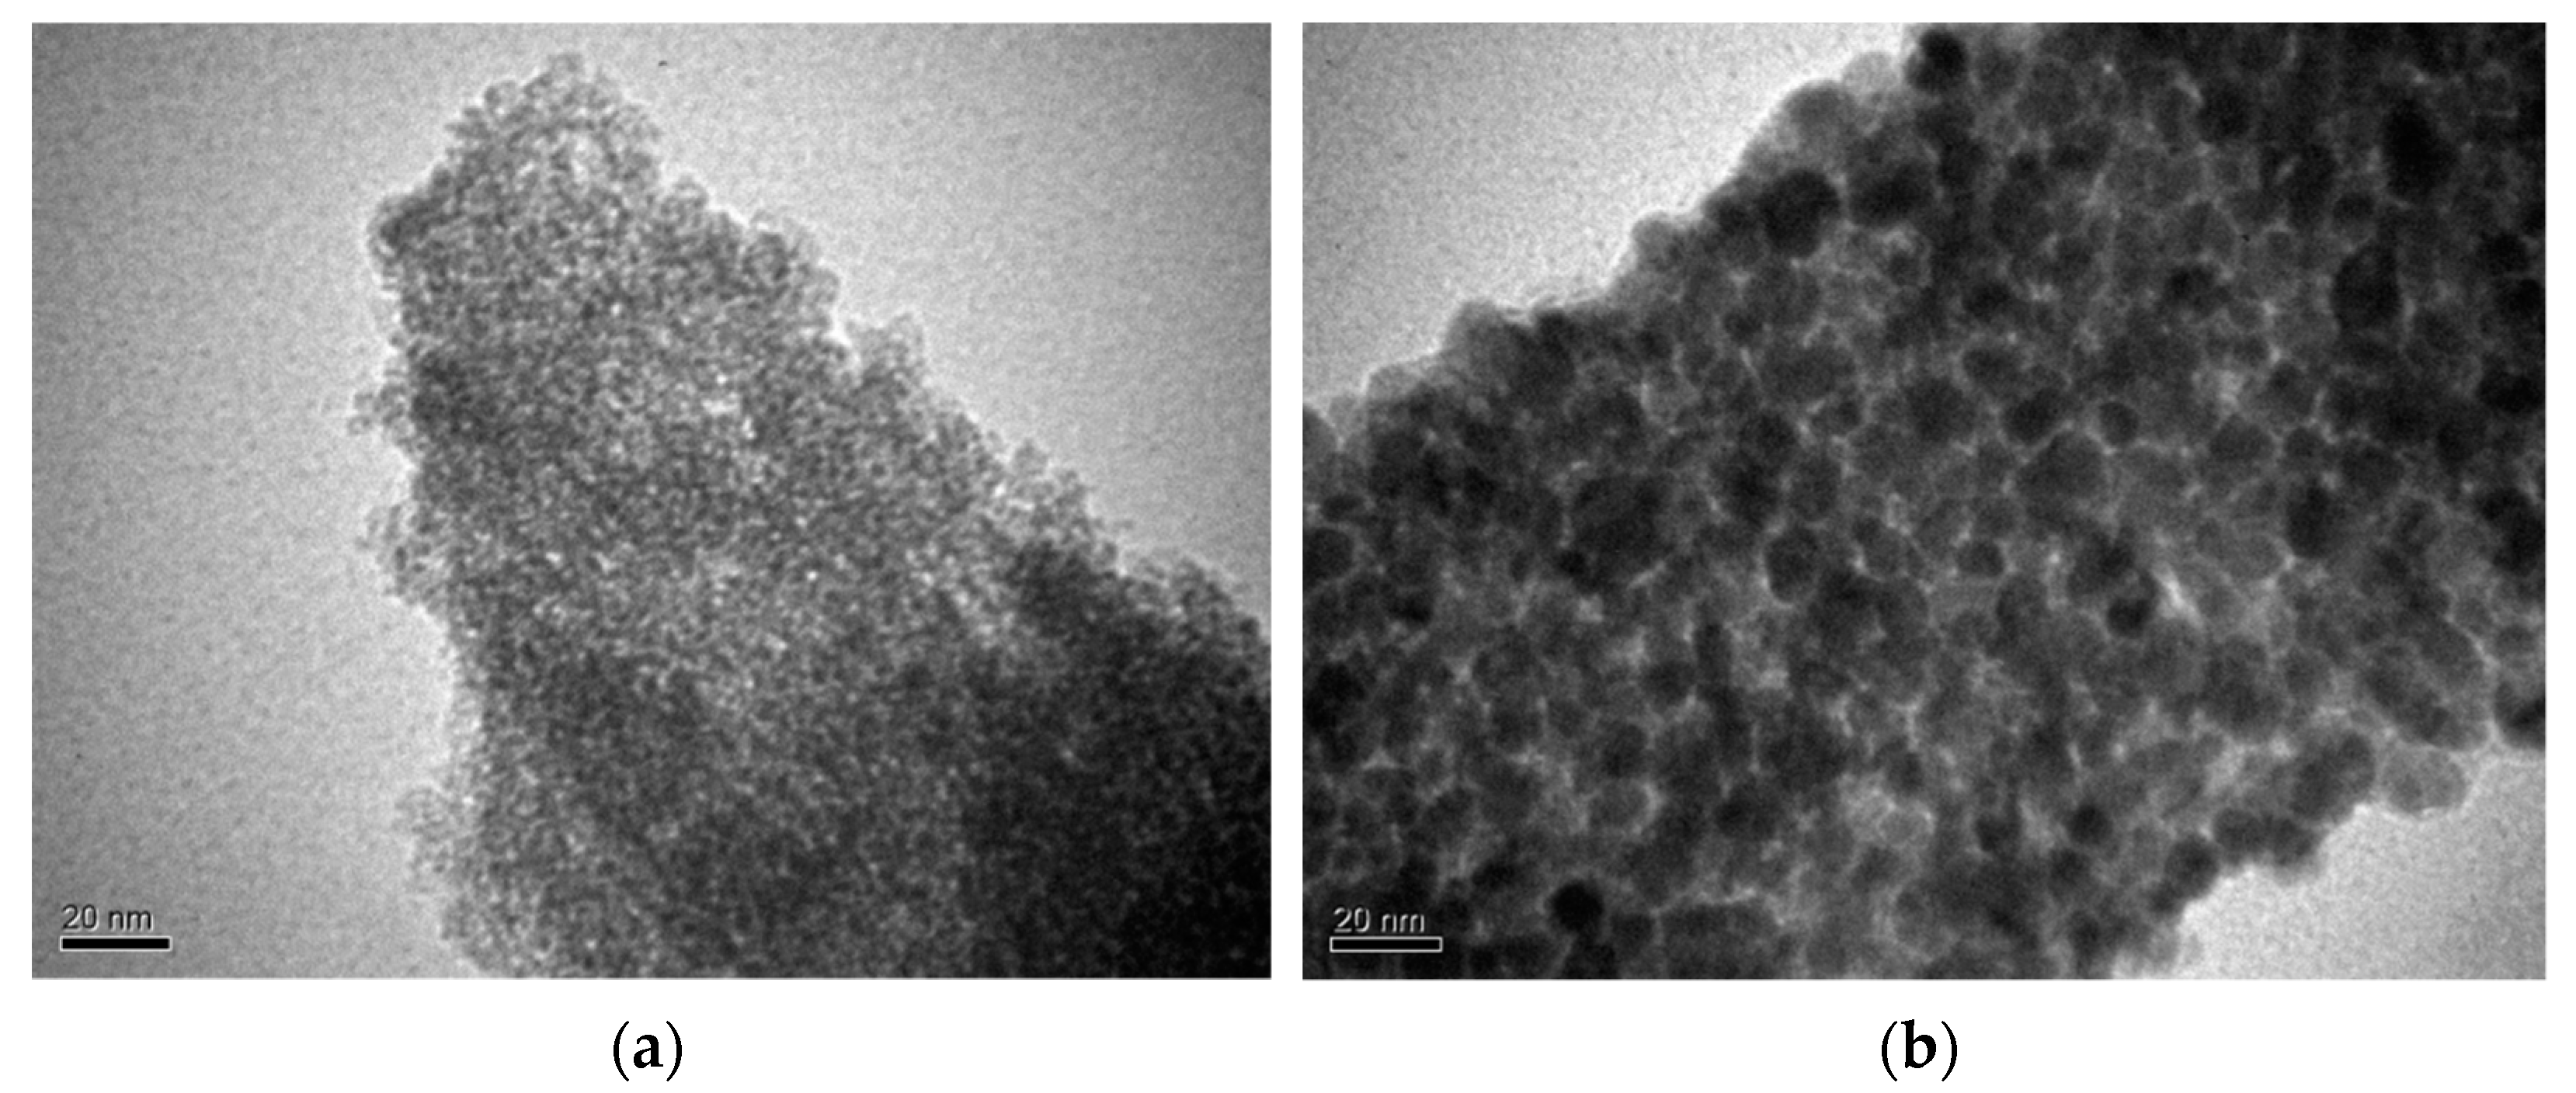
According to TEM, the ZrO2–SiO2 binary (Figure 2a) and ZrO2–SiO2–SnO2 ternary (Figure 2b) oxides consist of spherical particles. Modification of ZrO2–SiO2 with tin led to an increase in the average particle size from 3–4 nm to 8–12 nm.
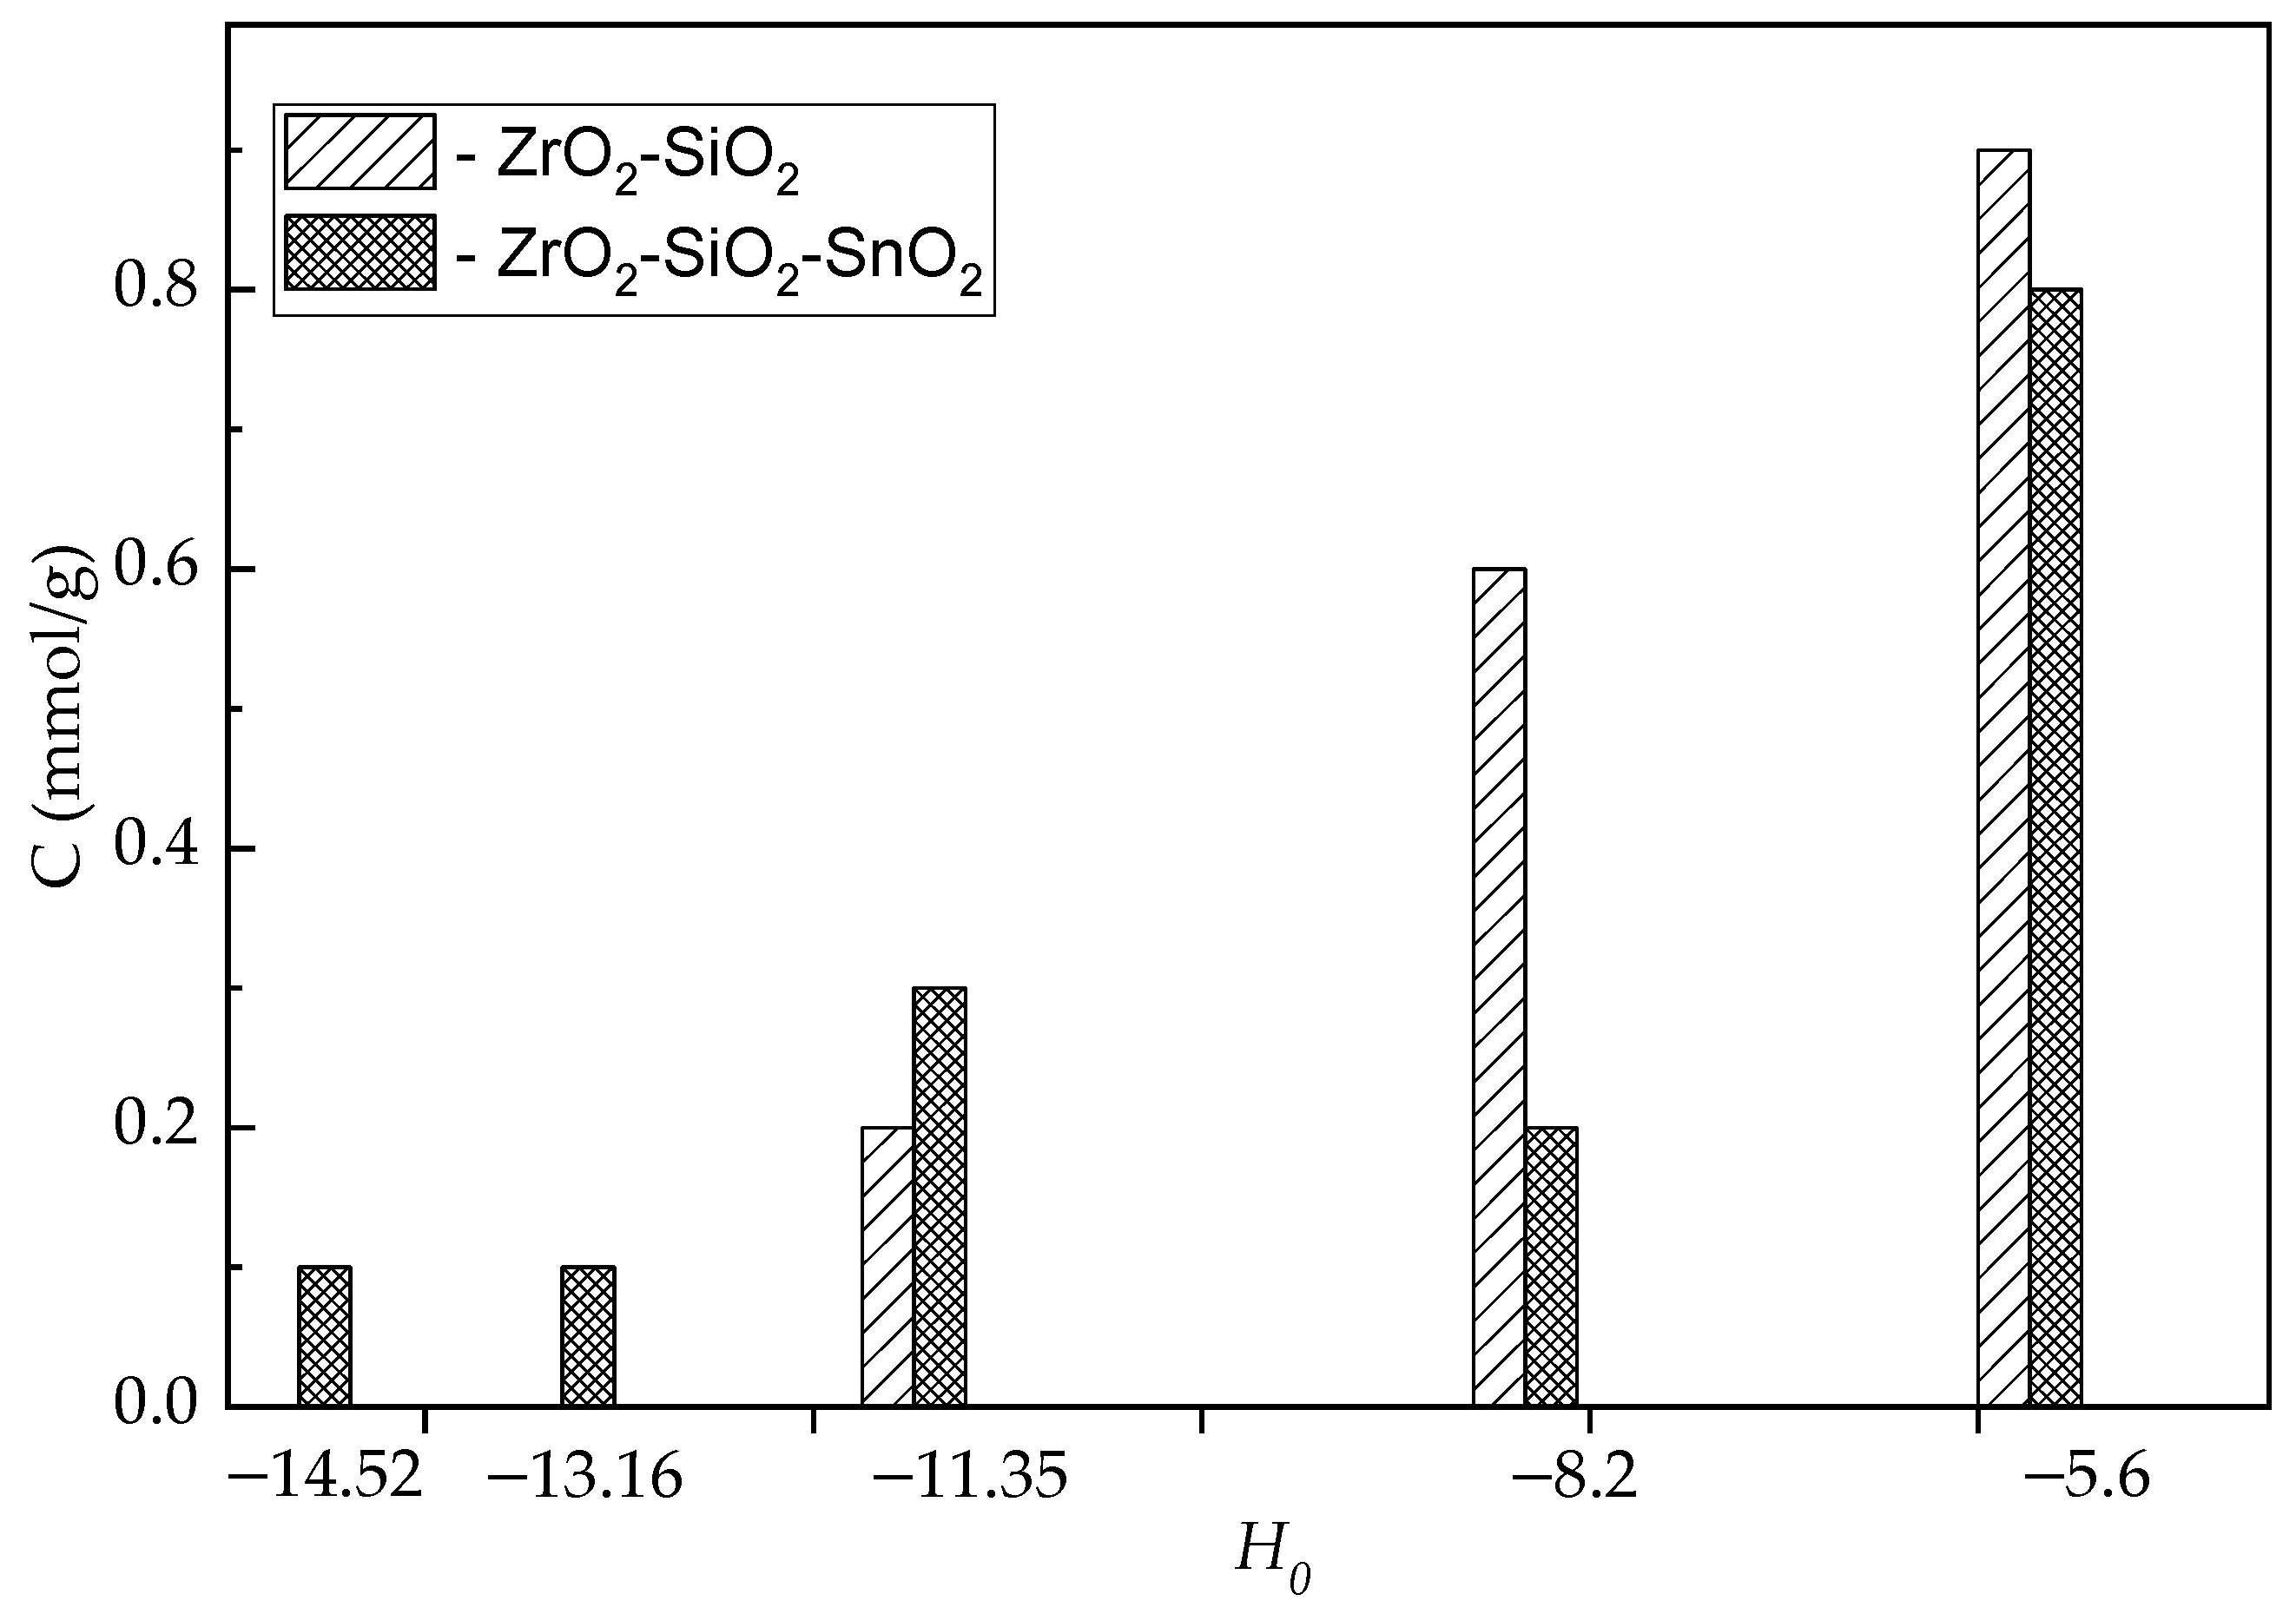
The introduction of tin ions into the ZrO2–SiO2 matrix also led to an increase in the acidity of the samples (Table 1). According to the concentration–strength acid site distribution for the synthesized ZrO2–SiO2–SnO2 sample, about 13% of acid sites corresponded to the superacid range (−13.16 ≥ H0 ≥ −14.52) and ~33%—to medium strength (−8.2 ≥ H0 ≥ −11.35) (Figure 3).
In comparison, the ZrO2–SiO2 surface contained acid sites of only medium strength (~45%) (Figure 3). The presence of octahedral and tetrahedral-coordinated Sn4+ on the surface of the ZrO2–SiO2–SnO2 oxides refers to Brönsted and Lewis acid sites [18]. Based on the obtained data in [18], it was supposed that the bridging –OH groups on the VIIIZr4+ and IVSn4+ cations could be assigned to Bronsted sites, but the induced positive charge on zirconium ions in ZrO2–SiO2–SnO2 could form the strong L–sites (H0 = −14.52).
The acid ZrO2–SiO2 and superacid ZrO2–SiO2–SnO2 mixed oxides were tested as catalysts for the conversion of 20 wt.% fructose in an aqueous medium to yield levulinic (LA) and formic (FA) acids. Based on experimental data, the most widely described route for the formation of levulinic and formic acids from fructose is as follows (Scheme 1): (1) formation of 5–hydroxymethylfurfural (5–HMF) by acid catalyzed dehydration of fructose via cyclic [21,22,23] or acyclic intermediates [23,24,25] as the first step, in which three water molecules are consecutively removed from the fructose molecule; and (2) the 5–HMF is then rehydrated to FA and LA, also requiring two moles of water according to the mechanism described by Horvat el al. [26]. Additionally, 5–HMF easily condenses, together with fructose and fructose degradation products, into brown insoluble charred materials often called “humins” [27].
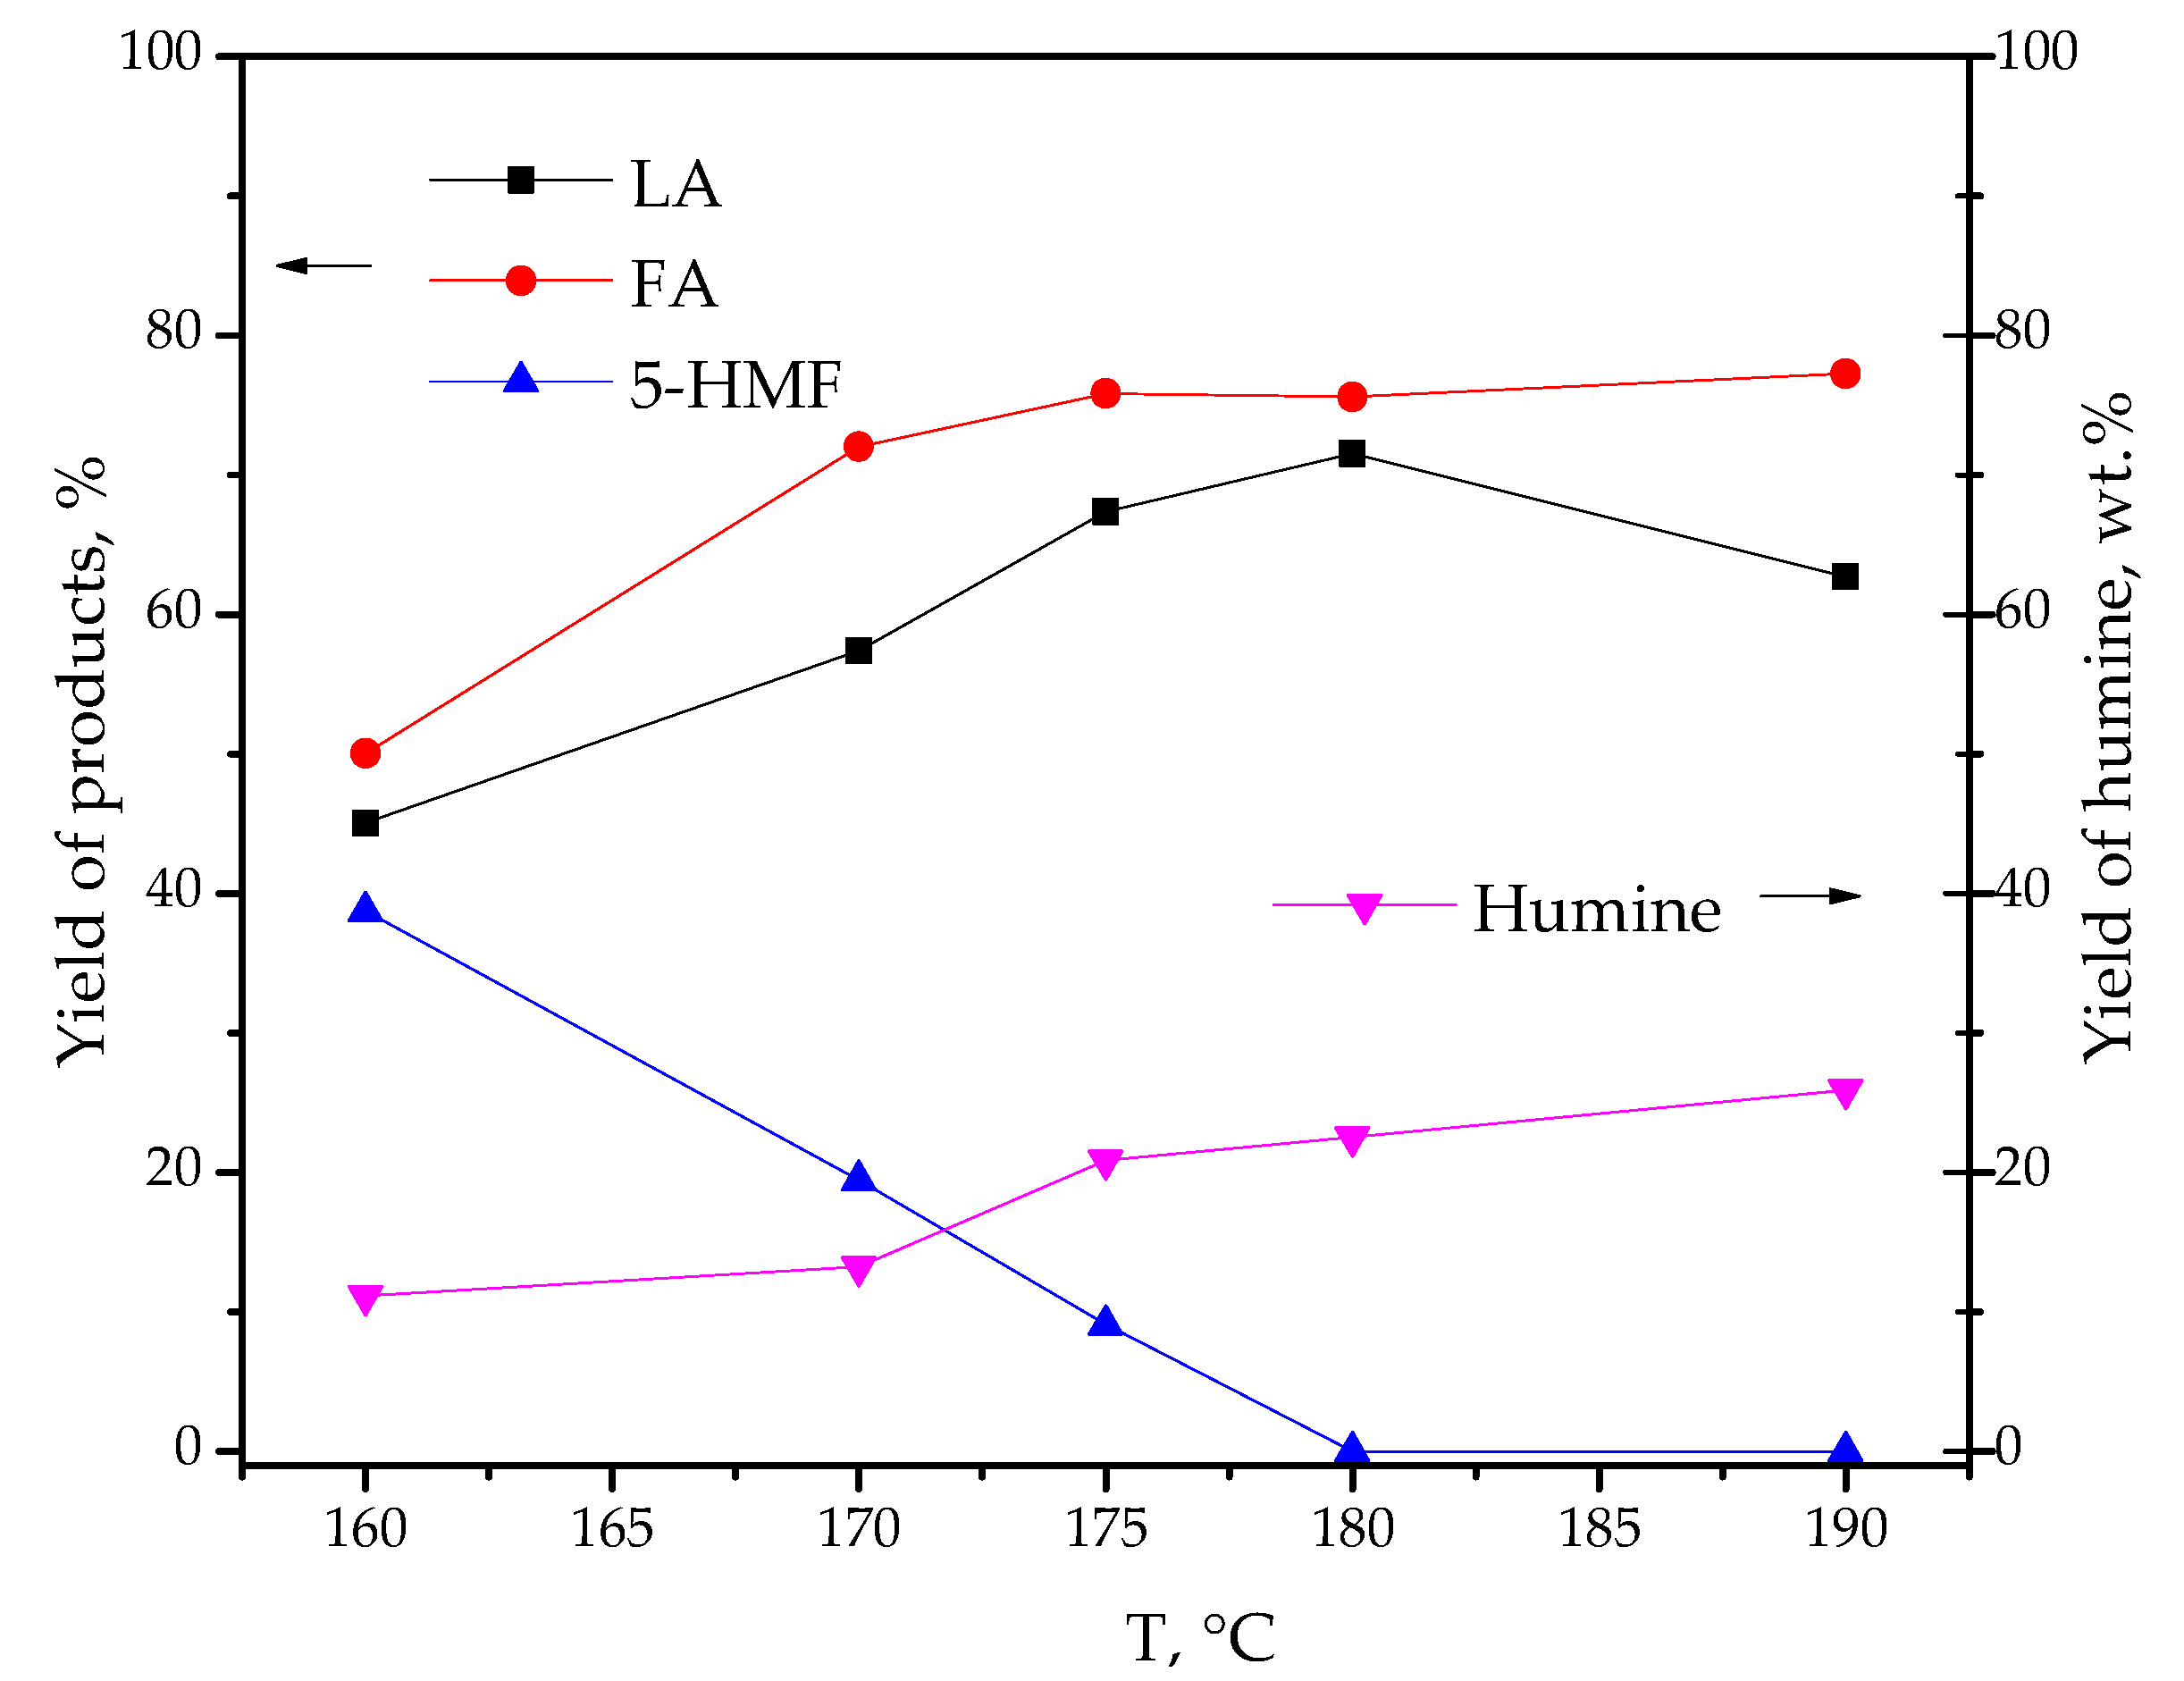
The influences of the reaction temperature on fructose conversion and product yield are presented in Figure 4. It should be noted that for theZrO2–SiO2–SnO2 catalyst, fructose conversion was >99% in the range of the investigated temperature. The yield of both LA and FA grew with an increase in the reaction temperature, 5–HMF was not observed after 180 °C. Fructose conversion for the less acidic ZrO2–SiO2 catalyst was <90% in the range of the investigated temperature.
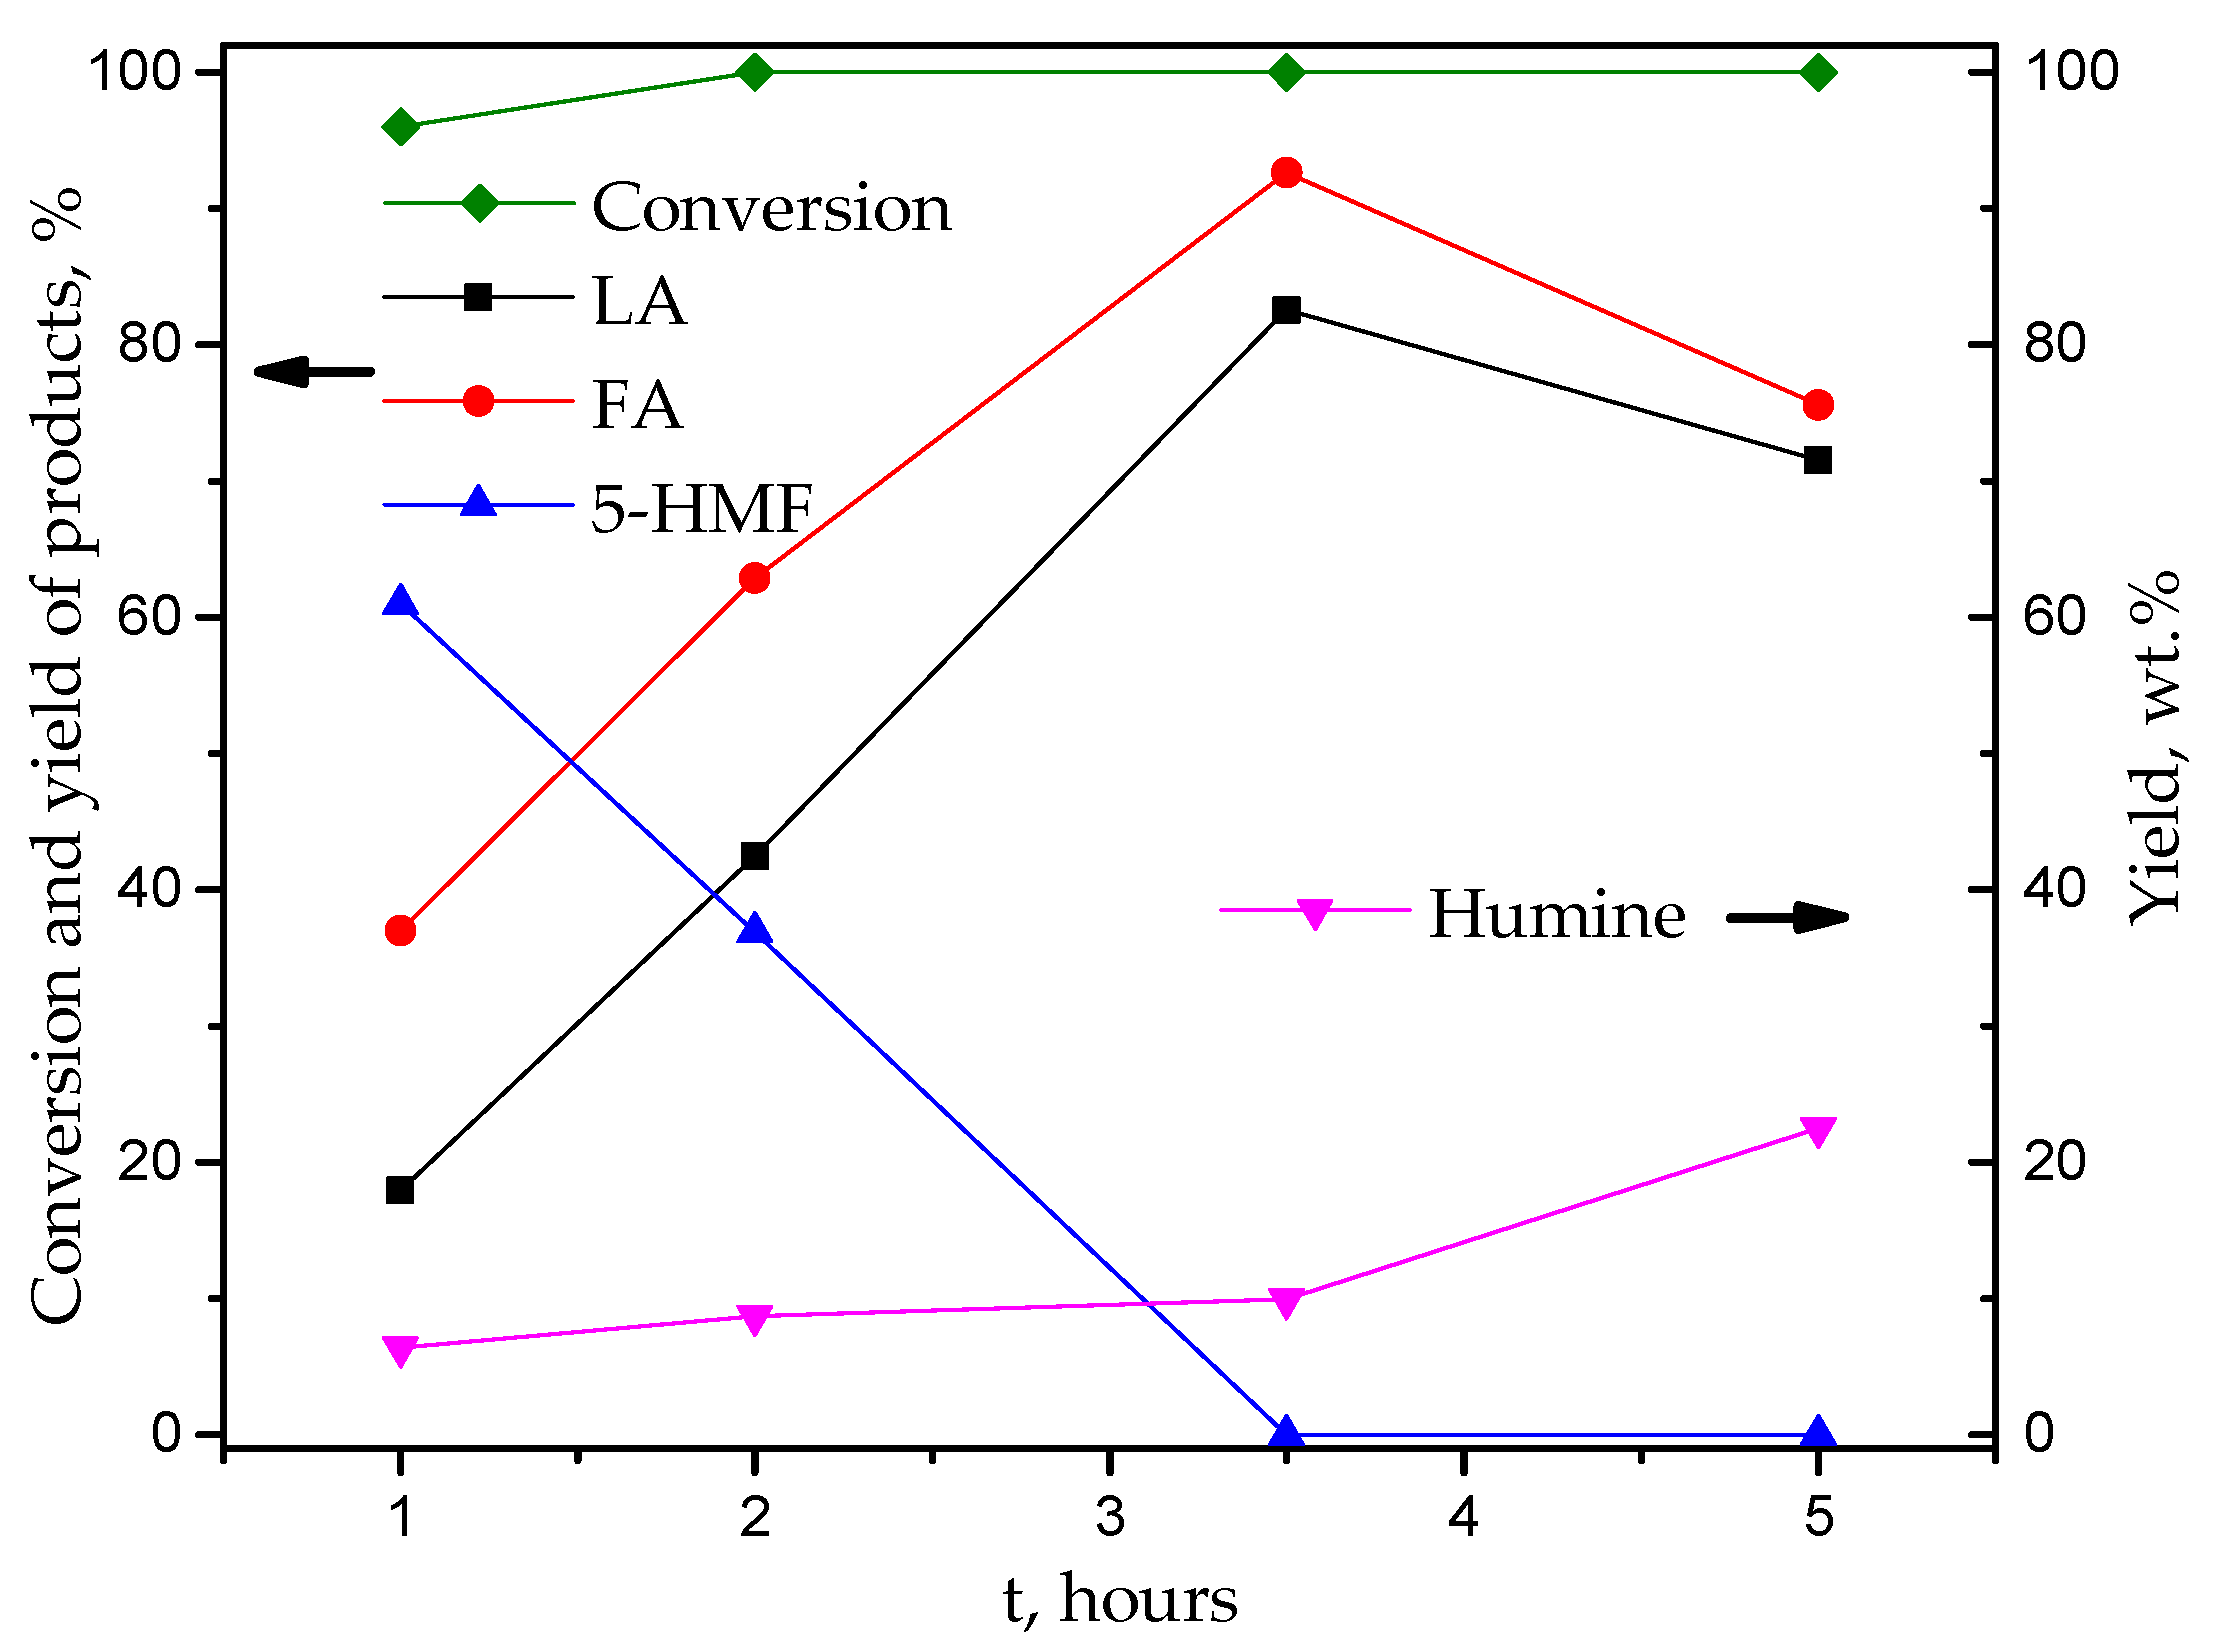
Figure 5 shows a fructose conversion and yield of products versus reaction time in the presence of the ZrO2–SiO2–SnO2 catalyst. The conversion of fructose and yield of LA and FA gradually increased as the reaction progressed. The LA yield reached the maximum of 82%, and the yield of FA was 92% after 3.5 h, whereas the 5-HMF yield gradually decreased and after 3.5 h of reaction time was not observed in the 13C NMR spectra. On the less acidic ZrO2–SiO2 catalyst after 3.5 h, 90% conversion of fructose occurred with the formation of the following products—formic and levulinic acids, 5–hydroxymethylfurfural, acetic and lactic acids, and some furanic products.
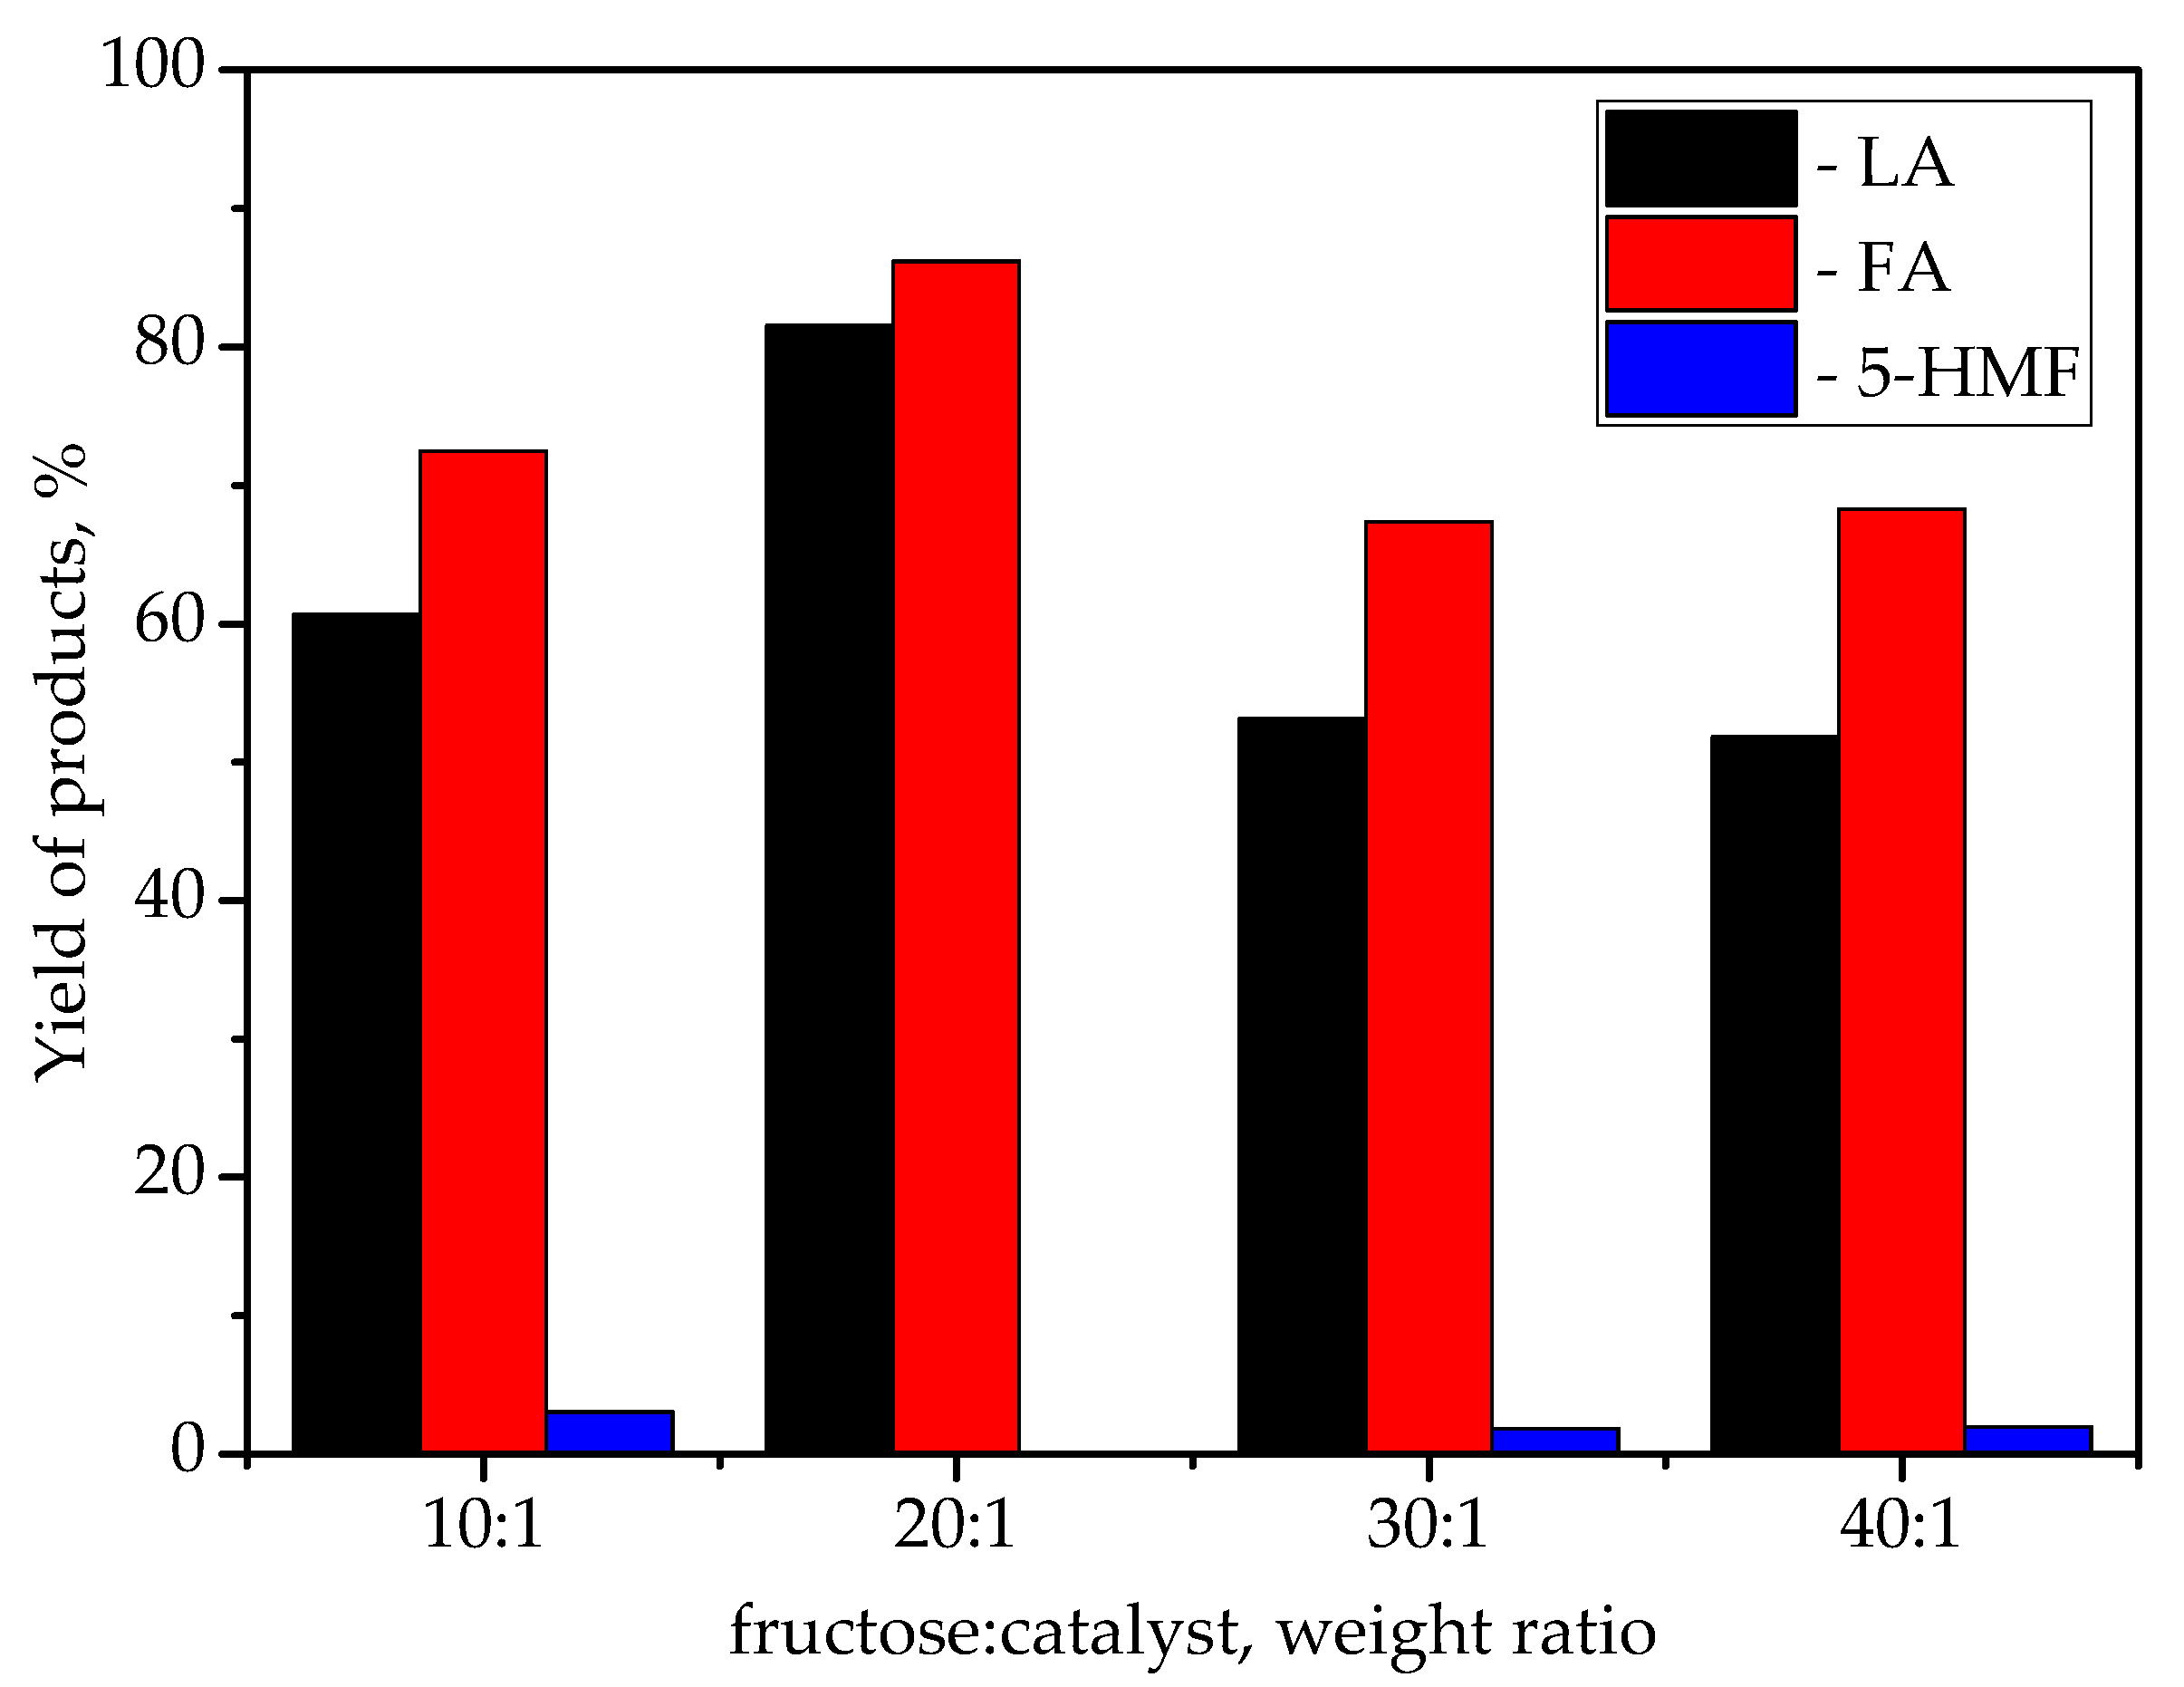
The fructose to catalyst ratio is an important parameter to be studied to obtain the optimal product yield. In [7], it was reported that a fructose to catalyst ratio of 1:1 was optimal for the dehydration of fructose to LA using various polystyrene-based sulfonic acid resin catalysts in pure water. In [28,29], it was shown that for catalyst loadings below 1:1, the LA yield gradually decreased. Under our experimental conditions (180 °C, 5 h) without a catalyst, a slight dehydration of fructose to 5–HMF (21 mol%) was observed at 27% fructose conversion. Varying the concentration of the ZrO2–SiO2–SnO2 catalyst showed that complete fructose conversion and about 80% and 90% LA and FA yield, respectively, occurred with a fructose to catalyst weight ratio of 20:1 (Figure 6). Such a relatively small amount of catalyst can be explained by the presence of superacid sites on its surface (Table 1), since it is known that the stronger the acid sites, the greater the amount of LA yield [30,31].
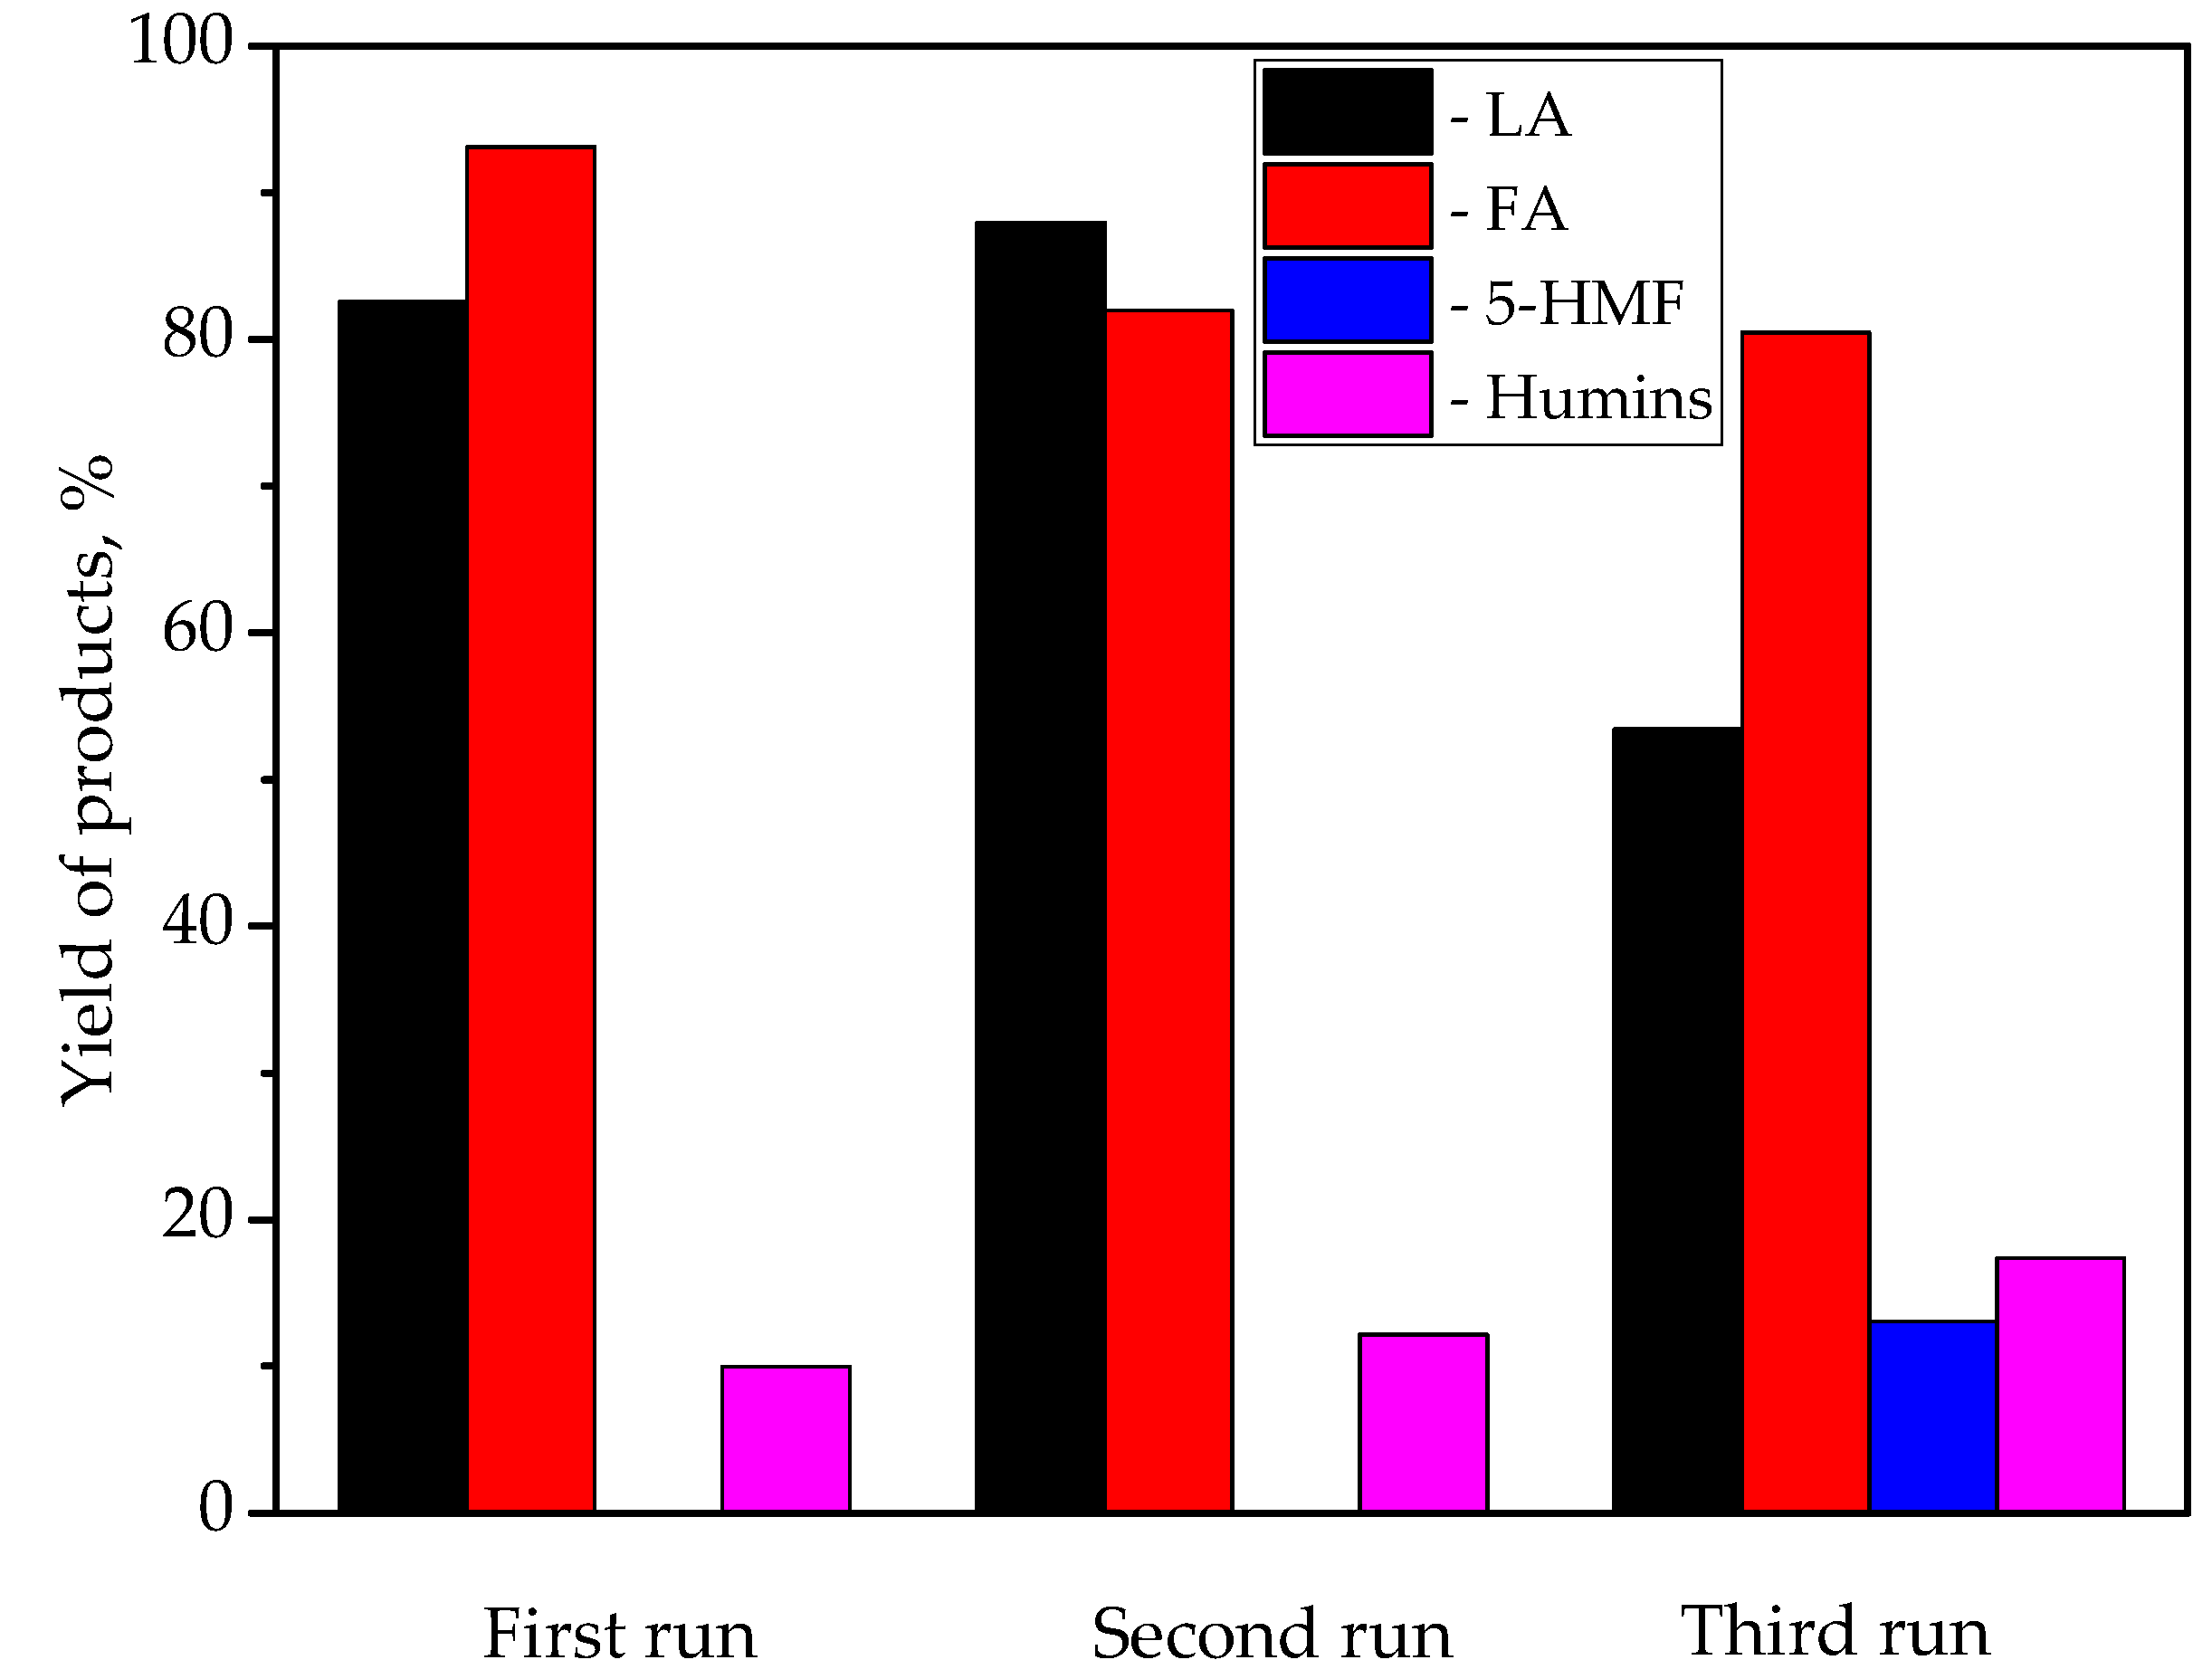
Theoretically, one molecule of fructose converts into one molecule of each formic and levulinic acids. However, numerous experimental data showed that the real yields of LA and FA were far from the 1:1 ratio [7,8,11,28,32]. Tarabanko proposed that levulinic acid reacts with fructose, producing humic substances [33]. The formation of humins is inevitable in LA production. Humic substances form in the quantity of at least 5–10 wt.% based on the target products during the acid-catalyzed conversion [33]. Our experiment showed that the increase in temperature and extension in the reaction time led to an increase in insoluble humins (Figure 4 and Figure 5). Additionally, the increase in the catalyst amount, and, accordingly, the number of superacid sites, also led to an increase in insoluble humins from 10 to 17 wt.% for the fructose to catalyst ratios of 20:1 and 10:1, respectively.
Stability of the ZrO2–SiO2–SnO2 was investigated by recycling the catalyst for three consecutive batch reactions for fructose conversion at optimal conditions (Figure 7). Due to the granular shape of the sample, the product is easily and quickly filtered. For reutilization of the solid superacid, the dried filter residues were calcined at 550 °C for 1 h to separate the solid superacid catalyst from the residues. The regenerated solid superacid was reused to produce LA under the optimal conditions. Fructose conversion remained 100% during all three consecutive batch reactions. However, the yield of LA dropped significantly during the third run and the FA yield remained unchanged. At the same time, during the third run, a significant amount of HMF was formed, and the amount of insoluble humins also increased. This could be a likely confirmation that levulinic acid reacts with fructose to form humins.

4. Conclusions

Mixed acid ZrO2–SiO2 and ZrO2–SiO2–SnO2 oxides were synthesized by the sol–gel method. The introduction of tin ions into the ZrO2–SiO2 (Zr:Si = 1:2) matrix leads to an increase in the average particle size and acidity of the ZrO2–SiO2–SnO2 (Zr:Si:Sn = 1:2:0.4) sample. The acid ZrO2–SiO2 and superacid ZrO2–SiO2–SnO2 mixed oxides were tested as catalysts for the conversion of 20 wt.% fructose in aqueous medium to levulinic and formic acids. Superacid ZrO2–SiO2–SnO2 oxide (H0 = −14.52) provides levulinic and formic acid yields of 80% and 90%, respectively, with full fructose conversion at 180 °C for 3.5 h and a fructose to catalyst weight ratio of 20:1. Due to the granular shape of the obtained catalyst, the product is easily and quickly separated. Therefore, it is possible to achieve a relatively low level of humic substance formation under optimal conditions, even using a concentrated solution containing 20 wt.% fructose.

Author Contributions

Conceptualization, S.P.; Methodology, S.P. and N.H.; Investigation, A.M. and N.H.; Writing—original draft preparation, S.P.; Writing—review and editing, S.P. All authors have read and agreed to the published version of the manuscript.

Funding

This research received no external funding.

Institutional Review Board Statement

Not applicable.

Informed Consent Statement

Not applicable.

Conflicts of Interest

The authors declare no conflict of interest.

References

  1. Signoretto, M.; Taghavi, S.; Ghedini, E.; Menegazzo, F. Catalytic Production of Levulinic Acid (LA) from Actual Biomass. Molecules 2019, 24, 2760. [Google Scholar] [CrossRef] [PubMed] [Green Version]
  2. Gérardy, R.; Debecker, D.P.; Estager, J.; Luis, P.; Monbaliu, J.-C.M. Continuous Flow Upgrading of Selected C2–C6 Platform Chemicals Derived from Biomass. Chem. Rev. 2020, 120, 7219–7347. [Google Scholar] [CrossRef] [PubMed]
  3. Antonetti, C.; Licursi, D.; Fulignati, S.; Valentini, G.; Galletti, A.M.R. New Frontiers in the Catalytic Synthesis of Levulinic Acid: From Sugars to Raw and Waste Biomass as Starting Feedstock. Catalysts 2016, 6, 196. [Google Scholar] [CrossRef]
  4. Hietala, J.; Vuori, A.; Johnsson, P.; Pollari, I.; Reutemann, W.; Kieczka, H. Formic Acid. In Ullmann’s Encyclopedia of Industrial Chemistry; Wiley-VCH Verlag GmbH & Co. KGaA: Weinheim, Germany, 2016. [Google Scholar] [CrossRef]
  5. Bulushev, D.A.; Ross, J.R.H. Towards Sustainable Production of Formic Acid. ChemSusChem 2018, 11, 821–836. [Google Scholar] [CrossRef] [PubMed] [Green Version]
  6. Hayes, D.J.; Fitzpatrick, S.; Hayes, M.H.B.; Ross, J.R.H. The Biofine Process—Production of Levulinic Acid, Furfural, and Formic Acid from Lignocellulosic Feedstocks. In Biorefineries-Industrial Processes and Products: Status Quo and Future Directions; Kamm, B., Gruber, P.R., Kamm, M., Eds.; John Wiley & Sons: Weinheim, Germany, 2006; pp. 139–163. [Google Scholar] [CrossRef]
  7. Thapa, I.; Mullen, B.; Saleem, A.; Leibig, C.; Baker, R.T.; Giorgi, J.B. Efficient green catalysis for the conversion of fructose to levulinic acid. Appl. Catal. A Gen. 2017, 539, 70–79. [Google Scholar] [CrossRef]
  8. Upare, P.P.; Yoon, J.-W.; Kim, M.Y.; Kang, H.-Y.; Hwang, D.W.; Hwang, Y.K.; Kung, H.H.; Chang, J.-S. Chemical conversion of biomass-derived hexose sugars to levulinic acid over sulfonic acid-functionalized graphene oxide catalysts. Green Chem. 2013, 15, 2935–2943. [Google Scholar] [CrossRef]
  9. Ramli, N.A.S.; Amin, N.A.S. Kinetic study of glucose conversion to levulinic acid over Fe/HY zeolite catalyst. Chem. Eng. J. 2016, 283, 150–159. [Google Scholar] [CrossRef]
  10. Ya’Aini, N.; Amin, N.A.S.; Endud, S. Characterization and performance of hybrid catalysts for levulinic acid production from glucose. Microporous Mesoporous Mater 2013, 171, 14–23. [Google Scholar] [CrossRef]
  11. Joshi, S.S.; Zodge, A.D.; Pandare, K.V.; Kulkarni, B.D. Efficient Conversion of Cellulose to Levulinic Acid by Hydrothermal Treatment Using Zirconium Dioxide as a Recyclable Solid Acid Catalyst. Ind. Eng. Chem. Res. 2014, 53, 18796–18805. [Google Scholar] [CrossRef]
  12. Kumar, V.B.; Pulidindi, I.N.; Mishra, R.K.; Gedanken, A. Development of Ga Salt of Molybdophosphoric Acid for Biomass Conversion to Levulinic Acid. Energy Fuels 2016, 30, 10583–10591. [Google Scholar] [CrossRef]
  13. Weingarten, R.; Tompsett, G.A.; Conner, W.C.; Huber, G.W. Design of solid acid catalysts for aqueous-phase dehydration of carbohydrates: Therole of Lewis and Brønsted acid sites. J. Cata. 2011, 279, 174–182. [Google Scholar] [CrossRef]
  14. Ordomsky, V.V.; van der Schaaf, J.; Schouten, J.C.; Nijhuis, T.A. Fructose Dehydration to 5-Hydroxymethylfurfural over Solid Acid Catalysts in a Biphasic System. ChemSusChem 2012, 5, 1812–1819. [Google Scholar] [CrossRef] [PubMed]
  15. Weingarten, R.; Conner, W.C.; Huber, G.W. Production of levulinic acid from cellulose by hydrothermal decomposition combined with aqueous phase dehydration with a solid acid catalyst. Energy Environ. Sci. 2012, 5, 7559–7574. [Google Scholar] [CrossRef]
  16. Hongzhang, C.; Bin, Y.; Shengying, J. Production of levulinic acid from steam exploded rice straw via solid superacid, S2O82−/ZrO2–SiO2–Sm2O3. Bioresour. Technol. 2011, 102, 3568–3570. [Google Scholar] [CrossRef]
  17. Wang, Y.; Nie, X. Preparation of magnetic solid acid catalyst S2O82−/ZrO2–TiO2–Fe3O4 and its application to synthesis of levulinic acid. J. Cent. South Univ. Sci. Technol. 2016, 1, 26–32. Available online: http://caod.oriprobe.com/articles/47615888/Preparation_of_magnetic_solid_acid_catalyst_S_sub_.htm (accessed on 16 November 2021).
  18. Prudius, S.V.; Hes, N.L.; Trachevskiy, V.V.; Khyzhun, O.Y.; Brei, V.V. Superacid ZrO2–SiO2–SnO2 Mixed Oxide: Synthesis and Study. Chem. Chem. Technol. 2021, 15, 336–342. [Google Scholar] [CrossRef]
  19. Tanabe, K. Solid Acids and Bases: Their Catalytic Properties; Academic Press: New York, NY, USA; London, UK, 1970; pp. 5–35. ISBN 0-12-683250-1. [Google Scholar]
  20. Abramoff, M.D.; Magalhaes, P.J.; Ram, S.J. Image Processing with ImageJ. Biophotonics Int. 2004, 11, 36–42. Available online: https://imagej.nih.gov/ij/docs/pdfs/Image_Processing_with_ImageJ.pdf (accessed on 16 November 2021).
  21. Antal, M.J.; Mok, W.S.L.; Richards, G.N. Mechanism of formation of 5-(hydroxymethyl)-2-furaldehyde from d-fructose and sucrose. Carbohydr. Res. 1990, 199, 91–109. [Google Scholar] [CrossRef]
  22. Amarasekara, A.S.; Williams, L.T.D.; Ebede, C.C. Mechanism of the dehydration of d-fructose to 5-hydroxymethylfurfural in dimethyl sulfoxide at 150 °C: An NMR study. Carbohydr. Res. 2008, 343, 3021–3024. [Google Scholar] [CrossRef] [Green Version]
  23. Fusaro, M.B.; Chagnault, V.; Postel, D. Reactivity of d-fructose and d-xylose in acidic media in homogeneous phases. Carbohydr. Res. 2015, 409, 9–19. [Google Scholar] [CrossRef]
  24. Jiang, Z.; Hu, D.; Zhao, Z.; Yi, Z.; Chen, Z.; Yan, K. Mini-Review on the Synthesis of Furfural and Levulinic Acid from Lignocellulosic Biomass. Processes 2021, 9, 1234. [Google Scholar] [CrossRef]
  25. van Putten, R.-J. Experimental and Modelling Studies on the Synthesis of 5-hydroxymethylfurfural from Sugar. Doctor’s Thesis, University of Groningen, Groningen, The Netherlands, 2015; p. 374. Available online: https://research.rug.nl/en/publications/experimental-and-modelling-studies-on-the-synthesis-of-5-hydroxym (accessed on 16 November 2021).
  26. Horvat, J.; Klaić, B.; Metelko, B.; Šunjić, V. Mechanism of levulinic acid formation. Tetrahedron Lett. 1985, 26, 2111–2114. [Google Scholar] [CrossRef]
  27. Tsilomelekis, G.; Orella, M.J.; Lin, Z.; Cheng, Z.; Zheng, W.; Nikolakis, V.; Vlachos, D.G. Molecular structure, morphology and growth mechanisms and rates of 5-hydroxymethylfurfural (HMF) derived humins. Green Chem. 2016, 18, 1983–1993. [Google Scholar] [CrossRef] [Green Version]
  28. Son, P.A.; Nishimura, S.; Ebitani, K. Synthesis of levulinic acid from fructose using Amberlyst-15 as a solid acid catalyst. React. Kinet. Mech. Catal. 2012, 106, 185–192. [Google Scholar] [CrossRef]
  29. Lai, D.-M.; Deng, L.; Guo, Q.-X.; Fu, Y. Hydrolysis of biomass by magnetic solid acid. Energy Environ. Sci. 2011, 4, 3552–3557. [Google Scholar] [CrossRef]
  30. Zeng, W.; Cheng, D.-G.; Chen, F.; Zhan, X. Catalytic Conversion of Glucose on Al–Zr Mixed Oxides in Hot Compressed Water. Catal. Lett. 2009, 133, 221–226. [Google Scholar] [CrossRef]
  31. Moreau, C.; Durand, R.; Razigade, S.; Duhamet, J.; Faugeras, P.; Rivalier, P.; Ros, P.; Avignon, G. Dehydration of fructose to 5-hydroxymethylfurfural over H-mordenites. Appl. Catal. A Gen. 1996, 145, 211–224. [Google Scholar] [CrossRef]
  32. Flannelly, T.; Lopes, M.; Kupiainen, L.; Dooley, S.; Leahy, J.J. Non-stoichiometric formation of formic and levulinic acids from the hydrolysis of biomass derived hexose carbohydrates. RSC Adv. 2016, 6, 5797–5804. [Google Scholar] [CrossRef] [Green Version]
  33. Tarabanko, V.E.; Smirnova, M.A.; Chernyak, M.Y.; Kondrasenko, A.A.; Tarabanko, N.V. The Nature and Mechanism of Selectivity Decrease of the Acid-catalyzed Fructose Conversion with Increasing the Carbohydrate Concentration. J. Sib. Fed. Univ. Chem. 2015, 8, 6–18. [Google Scholar] [CrossRef]
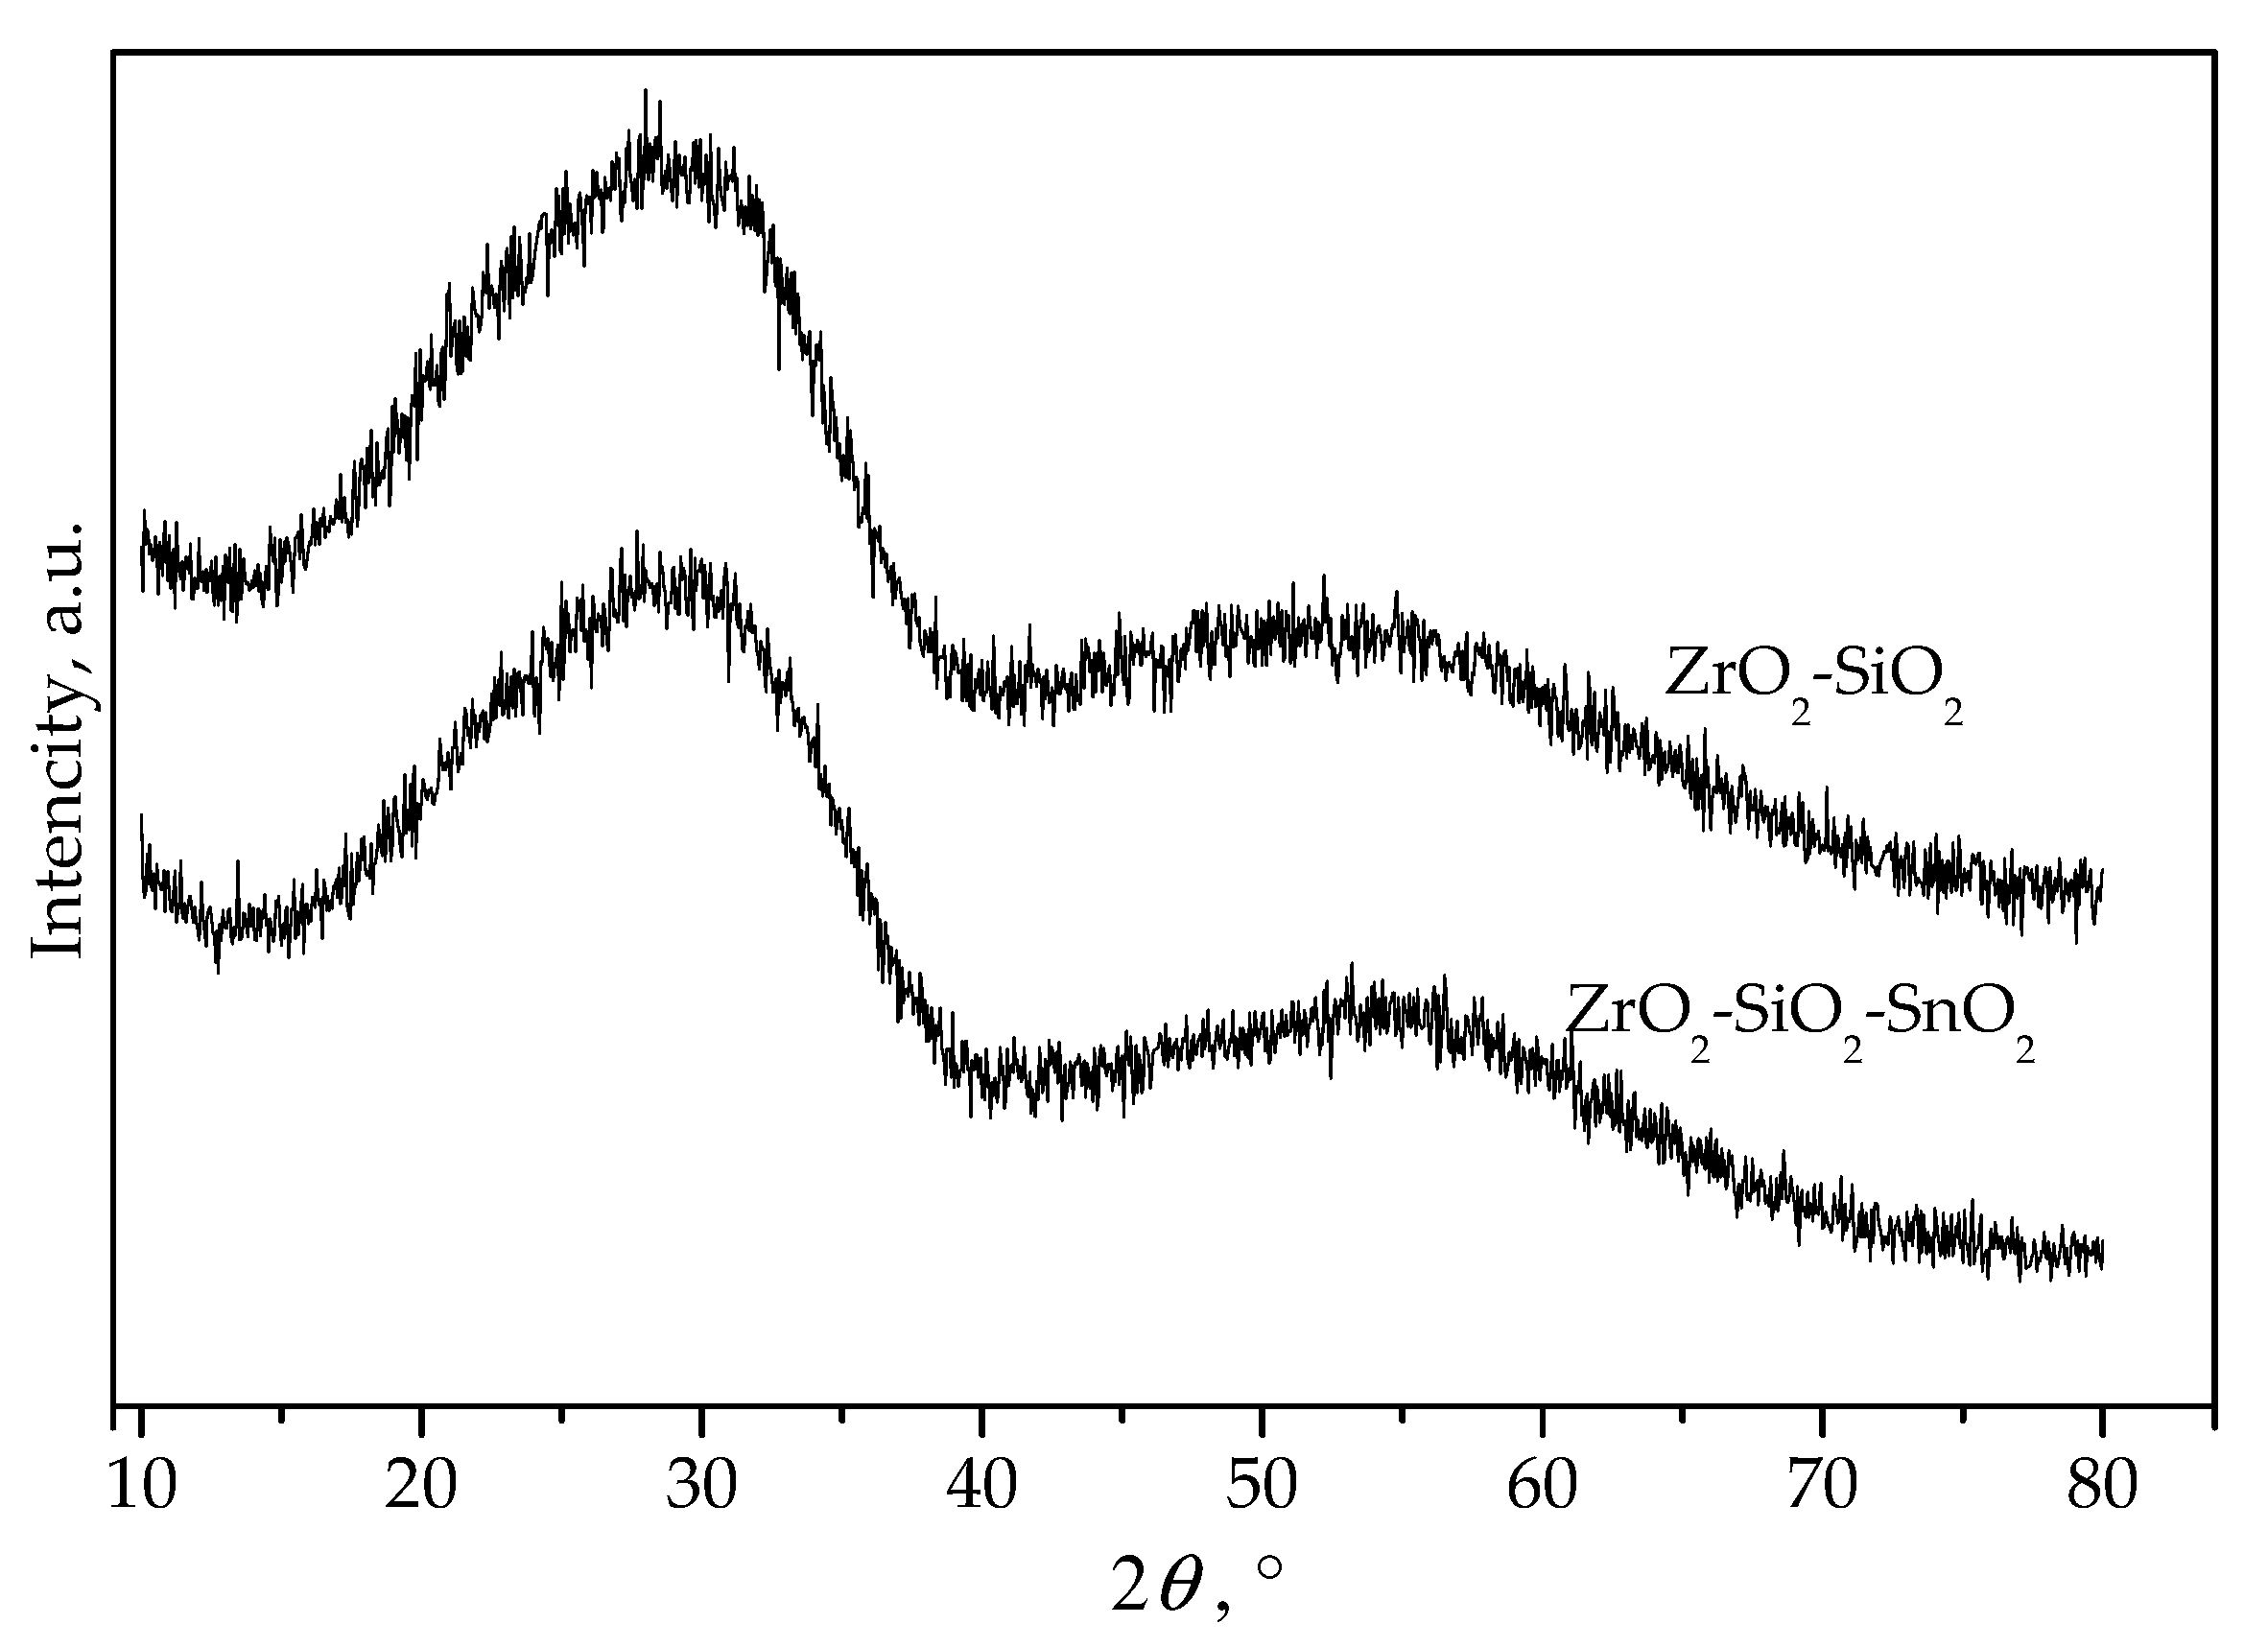
Figure 1. X-ray diffraction patterns of the ZrO2–SiO2 and ZrO2–SiO2–SnO2 samples after calcination at 750 C for 2 h.
Colloids 06 00004 g001
Figure 2. TEM images of ZrO2–SiO2 (a) and ZrO2–SiO2–SnO2 (b).
Colloids 06 00004 g002
Figure 3. Concentration–strength acid site distribution for ZrO2–SiO2 and ZrO2–SiO2–SnO2 samples.
Colloids 06 00004 g003
Scheme 1. Levulinic and formic acid formation from fructose.
Colloids 06 00004 sch001
Figure 4. Yield of reaction products versus temperature. Reaction conditions: fructose (2 g, 11.1 mmol, 20 wt.%), H2O (10 mL), ZrO2–SiO2–SnO2 catalyst (0.1 g) for 5 h.
Colloids 06 00004 g004
Figure 5. Fructose conversion and yield of products versus reaction time. Reaction conditions: fructose (2 g, 11.1 mmol, 20 wt.%), H2O (10 mL), ZrO2–SiO2–SnO2 catalyst (0.1 g) at 180 °C.
Colloids 06 00004 g005
Figure 6. Effect of catalyst concentration on the yield of the reaction products. Reaction conditions: fructose (2 g, 11.1 mmol, 20 wt.%), H2O (10 mL), ZrO2–SiO2–SnO2 catalyst at 180 °C for 5 h.
Colloids 06 00004 g006
Figure 7. Recycling study of the ZrO2–SiO2–SnO2 catalyst in the conversion of fructose to LA and FA. Reaction conditions: fructose (2 g, 11.1 mmol, 20 wt.%), H2O (10 mL), ZrO2–SiO2–SnO2 catalyst (0.1 g) at 180 °C for 3.5 h.
Colloids 06 00004 g007
Table 1. Texture and acid parameters of the synthesized catalyst.
CatalystSpecific Surface Area, m2/gPore Volume, cm3/gAverage Pore Radius, nmTotal Acidity [HB], mmol/gAcid Strength, H0
ZrO2–SiO2–SnO23400.201.21.5−14.52
ZrO2–SiO23600.271.51.7−11.35
Publisher’s Note: MDPI stays neutral with regard to jurisdictional claims in published maps and institutional affiliations.