4.1. Dating AM66 and AM65
Four sediment samples within 25 cm of AM66 and AM65 were analyzed by NAA. From above, to below, the shell layer, the U concentrations rose from 2.68 ± 0.02 to 4.44 ± 0.02 ppm, while Th rose from 4.63 ± 0.11 to 5.91 ± 14 ppm, and K from 0.46 ± 0.01 to 1.02 ± 0.03 wt.% (
Table 3). This variation required that time- and volumetrically averaged sedimentary dose rates,
be calculated. The sedimentary dose rates arising from the shells themselves, however, were almost nihil, averaging <0.001 mGy/y for its
β contribution, and <0.003 mGy/y for its γ contribution, assuming 40 vol% sedimentary water concentration. In Layer UA2, detailed sedimentological analyses showed that the shells constituted 18.5 wt.% of the bulk sediment, which had 60–65% porosity. When converted into vol%, these data became 6–8 vol% shells, in 33 vol% clastic sediment with 37–42 vol% porosity.
To calculate
, the shells were assumed to have been deposited in water 0–10 m deep, initially at the edge of a marsh or lake, with another 100 m of fluvial and alluvial sediment accumulated continuously above the shells during the Middle Pleistocene, followed by erosion until the overburden reached the current 30 m. When time- and volumetrically averaged, the shells’
equalled 32 ± 6 μGy/y, and their
444 ± 45 μGy/y (
Table 3). In the time- and volumetrically averaged calculations for Layer UA2/UB2, the boundaries in each time slice can vary up to 20 ka without significantly altering the shells’ calculated
and
.
Both AM66 and AM65 had U concentrations, [
Umol], measuring 0.01 ± 0.01 ppm (
Table 2c). Under 10–50 power, the shells had no significant porosity. While not all leached shells show porosity, its presence would increase the likelihood that the shells had been leached. Only highly weathered molluscan shells usually contain [
Umol] > 2–3 ppm, which can usually be attributed to secondary U uptake or leaching [
19,
26,
32]. Additionally, one would not expect nacreous shell, like AM66, to have high U concentrations [
50,
51,
52]. In molluscs, signal lifetimes vary significantly depending on the peak and species (e.g., see references in Blackwell,
Table 2 [
30]). Thus, given the lack of similarity in their response to diagenesis and ESR analyses among various mollusc species generally, the fact that the palustrine bivalves, AM66 and AM65, did not respond in the same manner in diagenesis as
Tridacna, the giant bivalve from coral reefs [
51], should not be surprising.
Encased in palustrine sediment that acted as an aquitard, the likelihood for U leaching from the shells is low. Because the whole Marathousa Member, and hence, the aquitard, stayed unbreached by erosion until mining began, little, if any, of its interstitial water was likely lost after its deposition. Thus, this drastically lowers the possibility for U leaching. The shells’ low U concentrations made an insignificant difference of <1% among the calculated EU, LU, and RU model ages (
Table 4c), especially compared to the uncertainties for their ages.
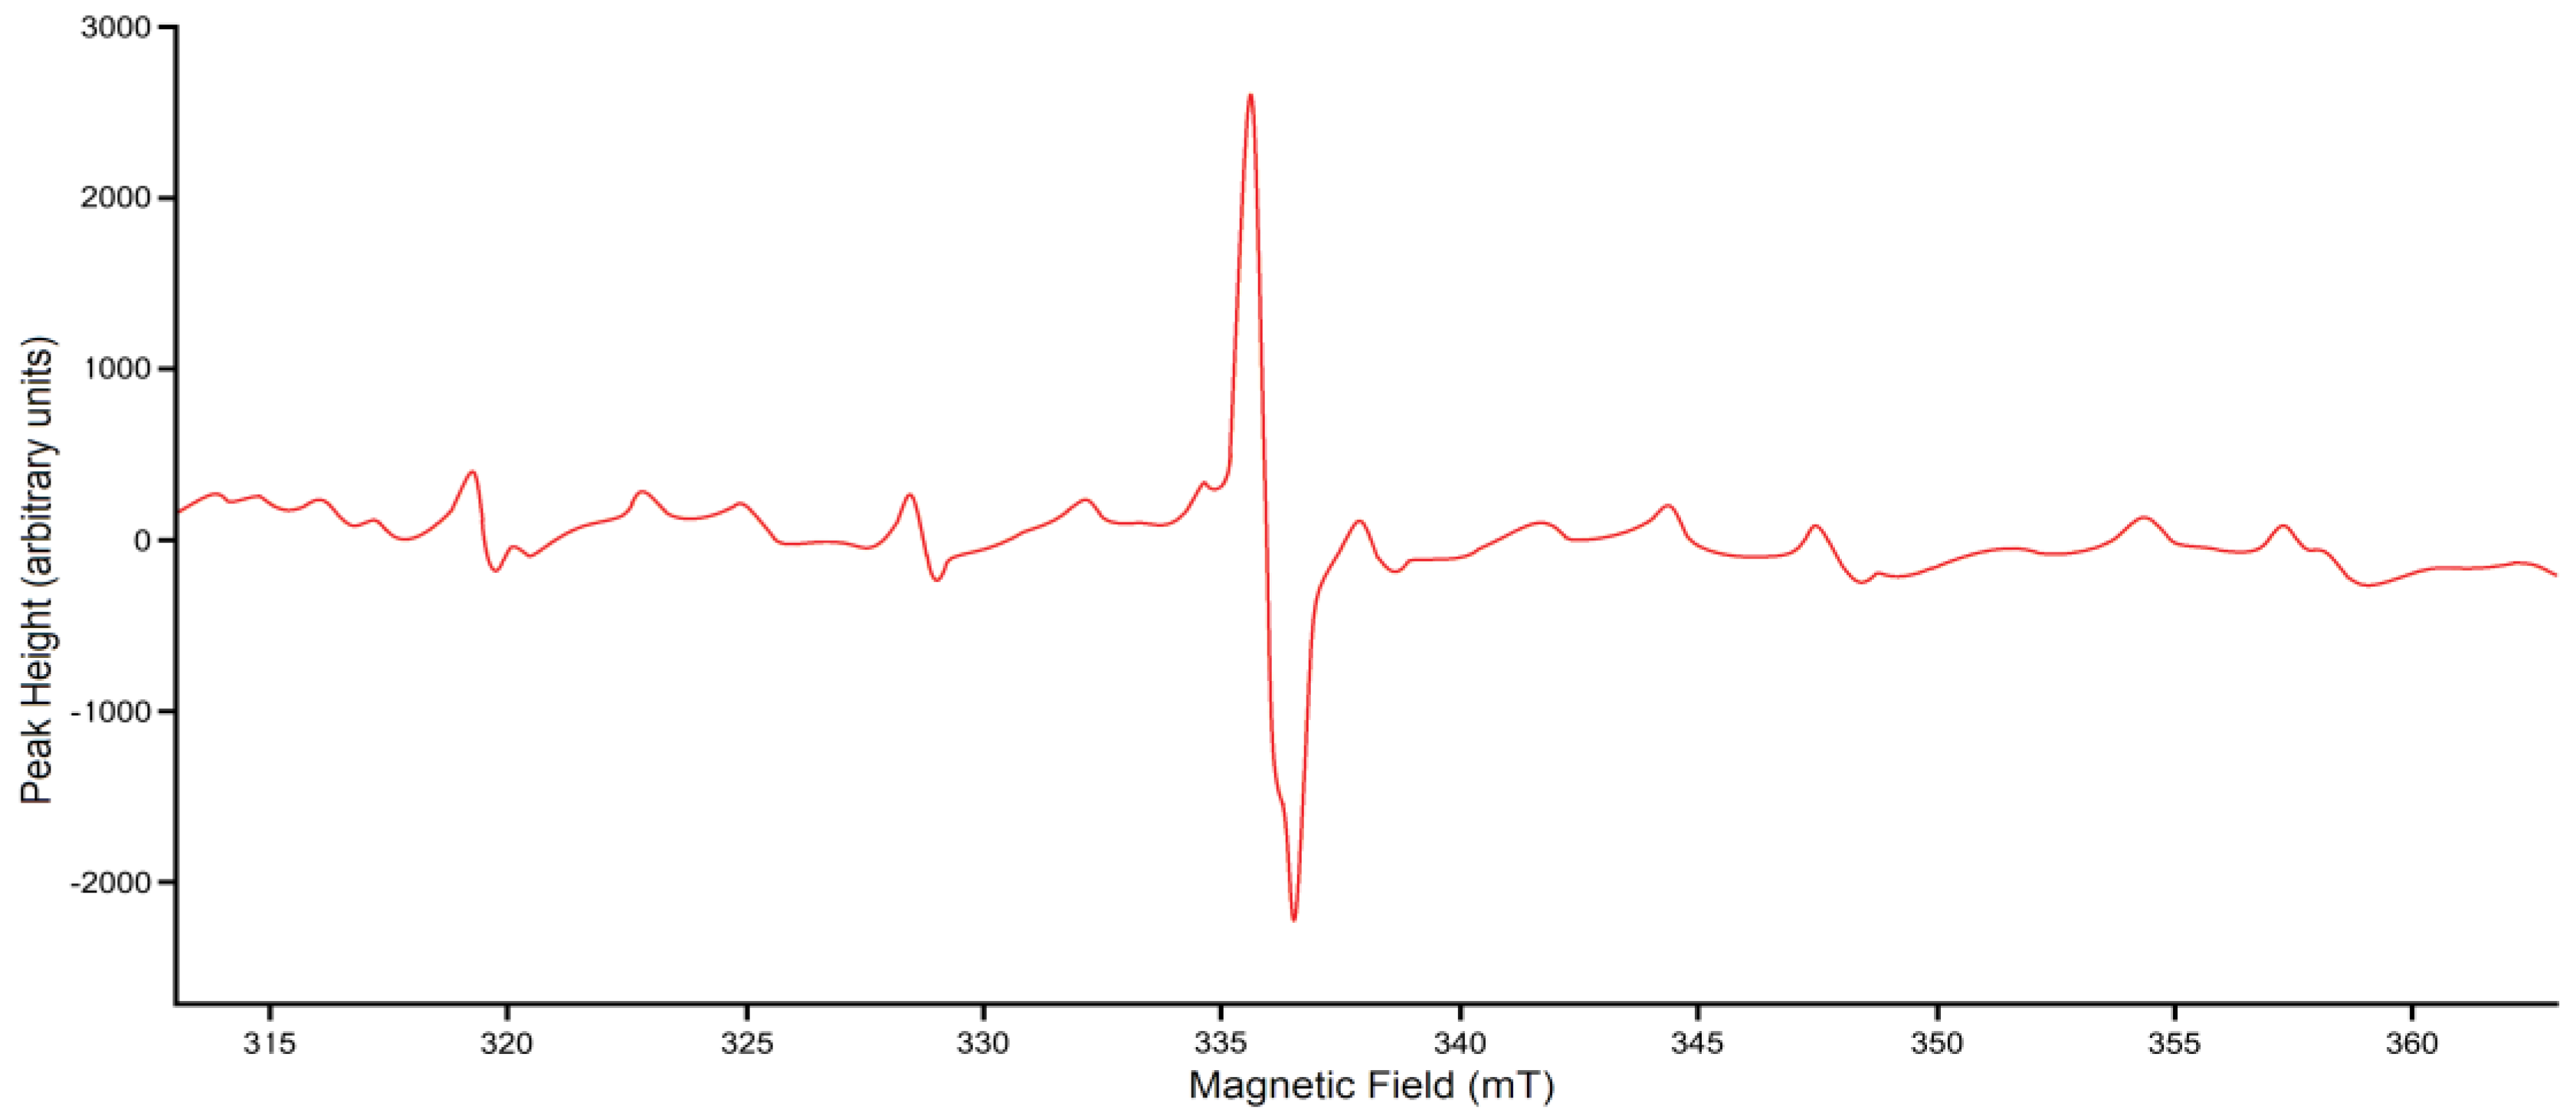
No ESR spectra for AM66 or AM65 showed any evidence of Mn hyperfine splitting (
Figure 4). Although some minor organic peaks did occur, they did not interfere with the dating peak. The ESR spectra showed no calcitic peaks. No significant inflexion points occurred in the growth curve (
Figure 3), suggesting that the very tiny minor so-called inflexions likely derived from trap competition or lattice defects (cf. [
21]). Ages for the two bivalve samples differed by <2 ka, and averaged 487 ± 37 ka (EU) to 490 ± 38 ka (RU2, RU8), and the LU age provides a median age for AM66 at 488 ± 37 ka (
Table 4c). This age’s central value correlates with MIS 13b/13a, only a few thousand ages before MIS 12 began. Moreover, these ages do constrain the youngest possible age for the teeth that both underlie the shell horizon. Thus, using the youngest age for the shells, the teeth must predate MIS 11 at the latest, but more likely must predate late MIS 13. Considering their associated uncertainties, this ESR age agreed with the IRSL ages for the sediment package between Lignite Seams II and III [
53].
The dates for AM66 and AM65 reported here that correlate with MIS 13, suggest that Lignite Seam III, which sits just above Layer UA2/UB/2, is younger. Thus, Lignite Seam III may correlate with MIS 11, which is younger than the MIS 15/16 boundary age reported by van Vugt et al. [
7,
8] for the base of Lignite Seam III. The shell dates reported here, however, suggest that Lignite Seam III correlates better with MIS 11 than MIS 13 (
contra Okuda et al. [
9]) and Lignite II with MIS 15 or earlier. With this correlation, their pollen zone MP3c with low
Quercus would correlate with MIS 12, and their thin lignite Layer F, with MIS 13. This correlation also agrees better with the changes in arboreal pollen, especially
Quercus, and other changes in MIS 12–16 in Tenaghi Philippon [
54].
4.2. Dating the Teeth
In most archaeological sites, dental cementum is lost from the teeth before found or becomes unidentifiable visually. Cementum tends to average <100 µm in thickness [
23,
24]. In ungulate teeth, depending on the species, enamel plates may have dentine on both sides, cement on one side and dentine on the other, cement covering dentine on one side and dentine on the other, or have dentine on one side only [
55,
56]. Within a single tooth, enamel plates often have different tissue orientations. More than half of the plates within most cervid or bovid teeth, however, have dentine on both sides. In life, mastication (i.e., wear) can thin or remove the cementum from tooth surfaces. After deposition in sediment, cementum is usually removed, except for sites with the most pristine preservation. In Marathousa 1, simply extracting the teeth from the sediment could have removed any preserved cementum. Whatever the cause, no cementum was recognized in either tooth dated here (
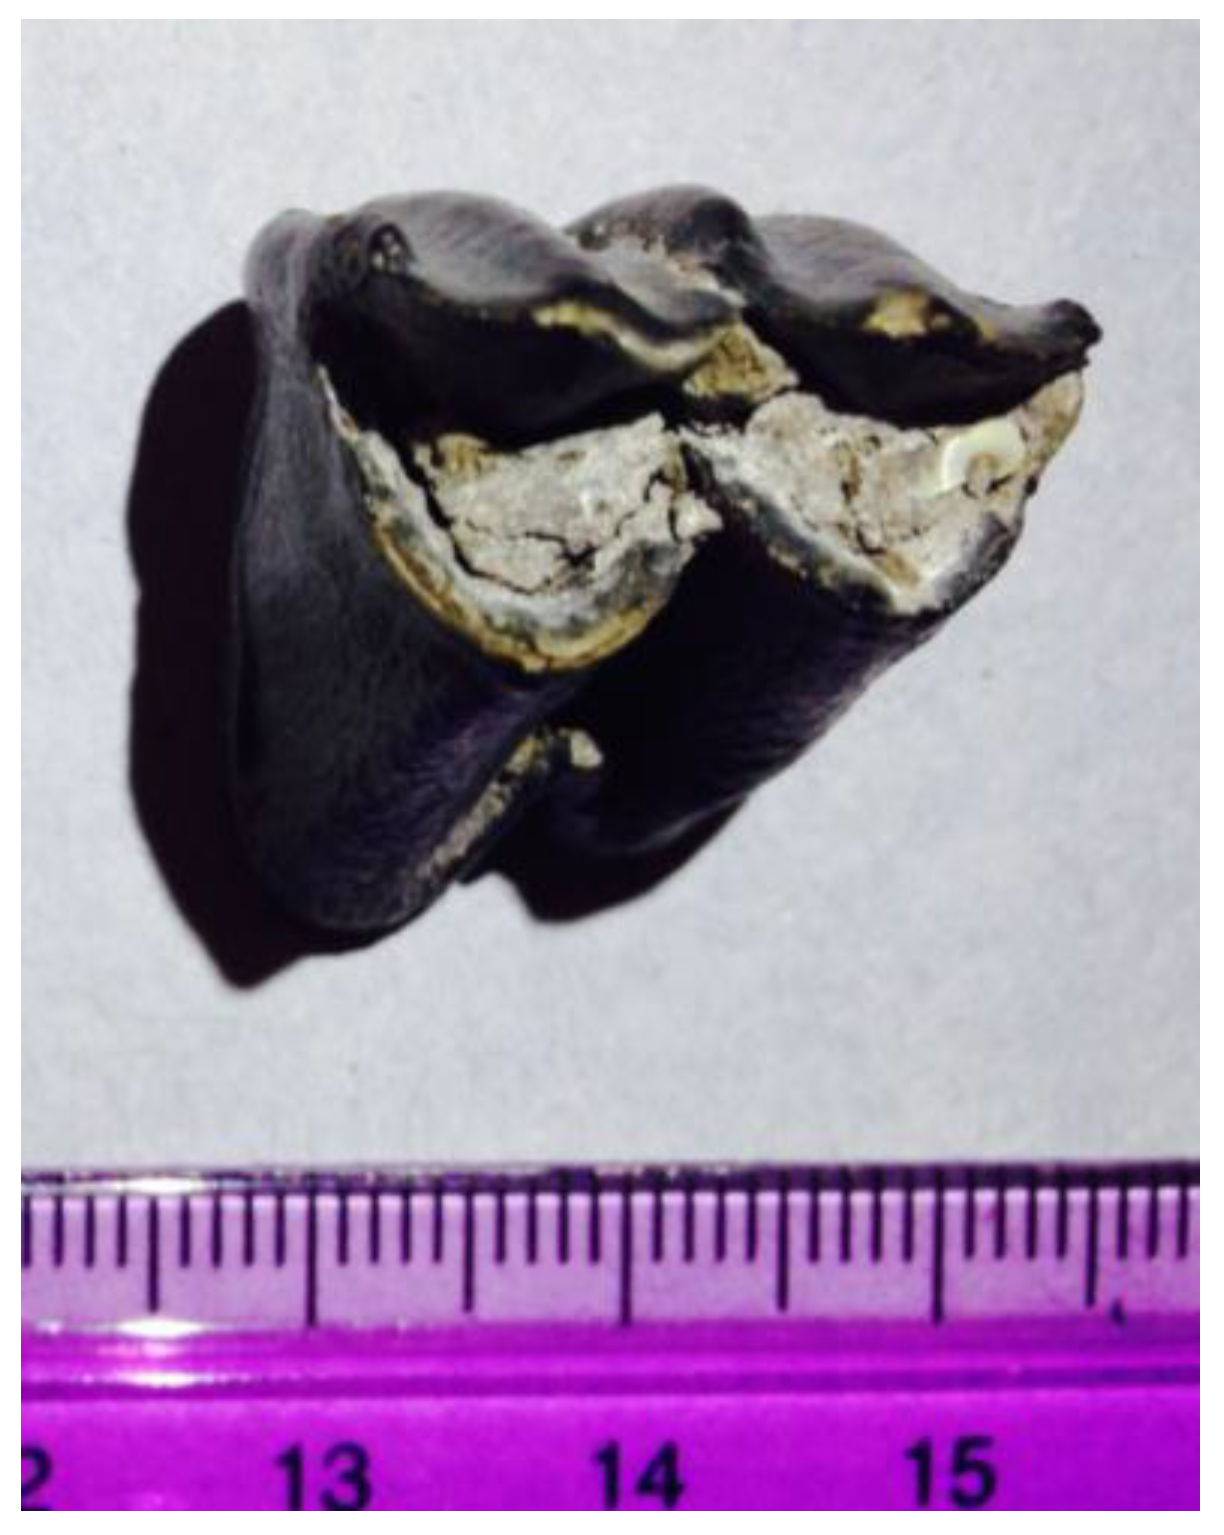
Figure 5).
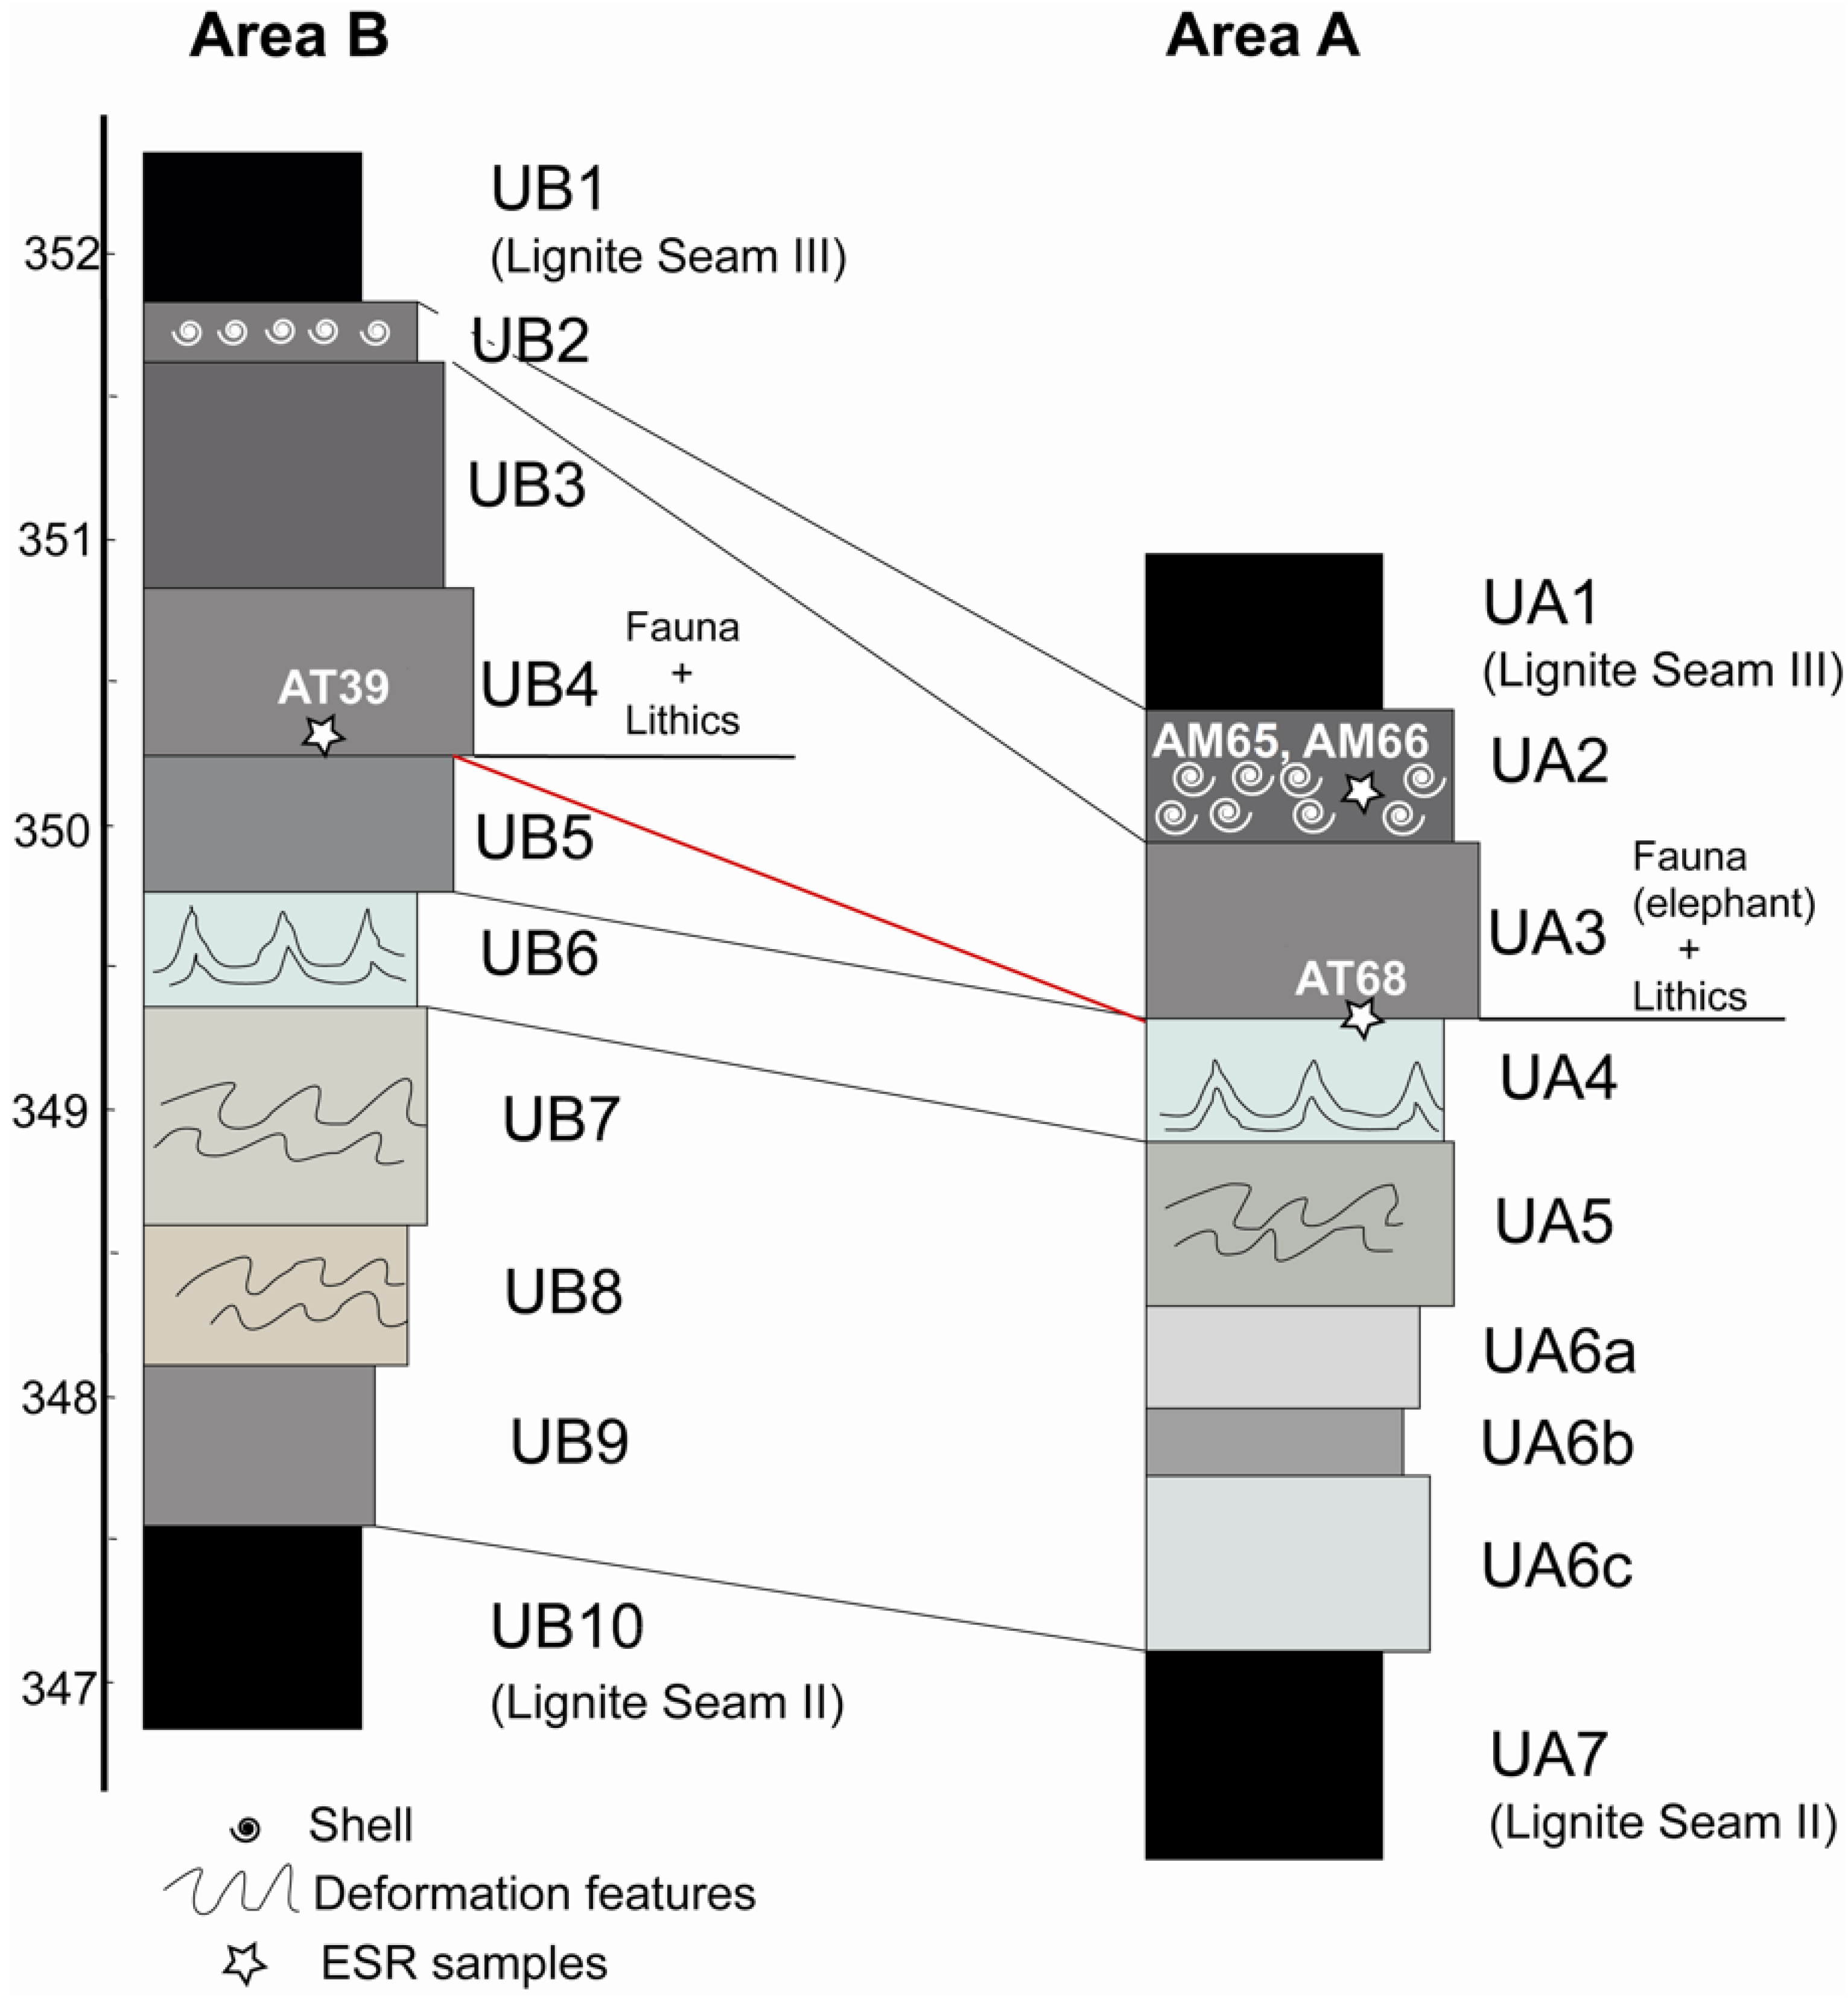
Around the cervid tooth AT39, three sediment samples were analyzed to measure
Dsed(
t) (
Table 3). Given the textural homogeneity of the sediment in the layers, analyzing more than three sediment samples would not have improved the precision of the time-averaged sedimentary dose rate,
Since AT39sed2 was scraped off the tooth, dentine, bone, and/or cementum contaminated its sediment, as is evident from its very elevated U and very low K concentrations compared to all the other sediment samples from Marathousa 1. Therefore, AT39sed2 was not used to assess
Dsed(
t). Given that aquitards bounded the sedimentary package containing the unit with AT39 and AT68, interstitial water surrounding the teeth likely remained intact around the sedimentary grains for most of their depositional history at near or full saturation. Assuming 35 wt.% sedimentary water,
Dsed,β(
t) for the clastic components averaged 229 ± 47 μGy/y, and
Dsed,γ(
t), 744 ± 93 μGy/y (
Table 3). When volumetrically averaged assuming that AT39’s horizon in UB4, Area B, contained 5 vol% bone,
equalled 676 ± 19 μGy/y, while its
equalled 81 ± 4 μGy/y (
Table 4a).
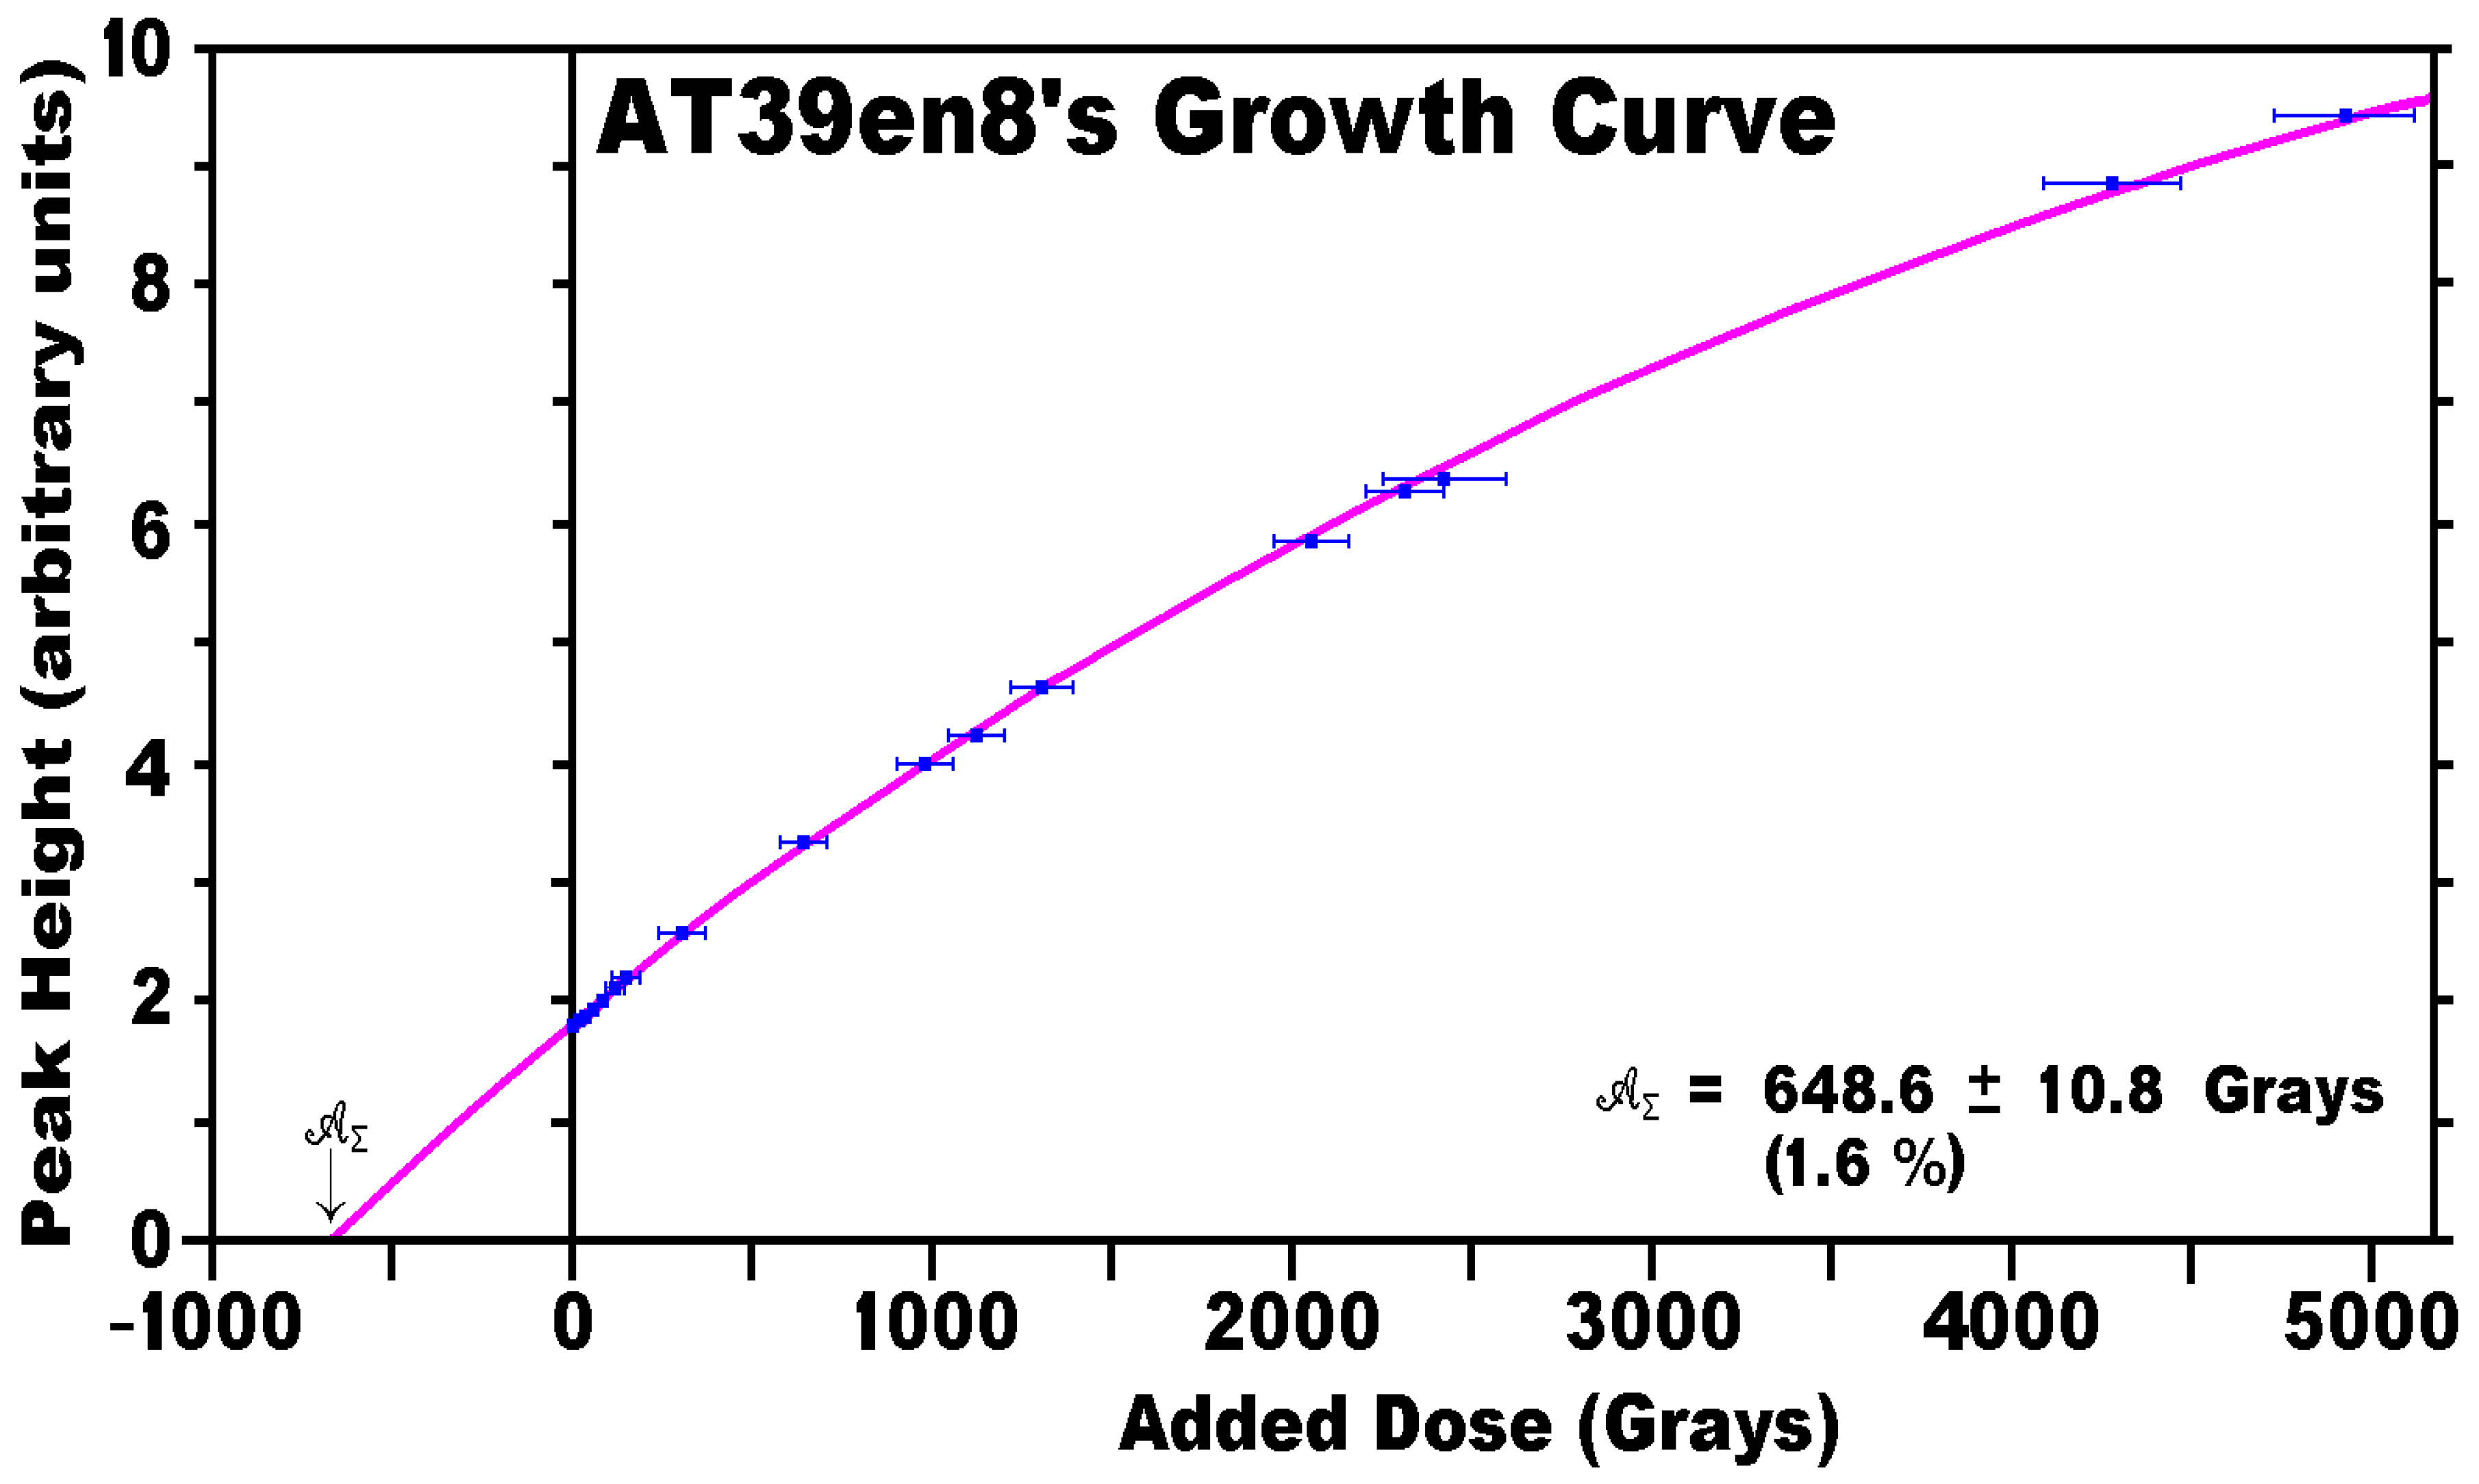
Initially, AT39 (
Figure 5) yielded eight subsamples, but subsamples AT39en1-3 and AT39en6+7 had to be recombined to obtain enough aliquots for the ESR analyses. Even then, AT39en1-3 still did not have enough aliquots to allow it to be dosed highly enough, which led to it being ramped twice (i.e., the subsample’s aliquots were reirradiated, reannealed, and re-ESR analyzed two times; [
19]).
AT39’s [
Uen] averaged 1.56 ± 0.50 ppm (
Table 2a), and its [
Uden], 19.23 ± 7.08 ppm U. After AT39en1-3y’s reirradiation, all five AT39’s 𝖠
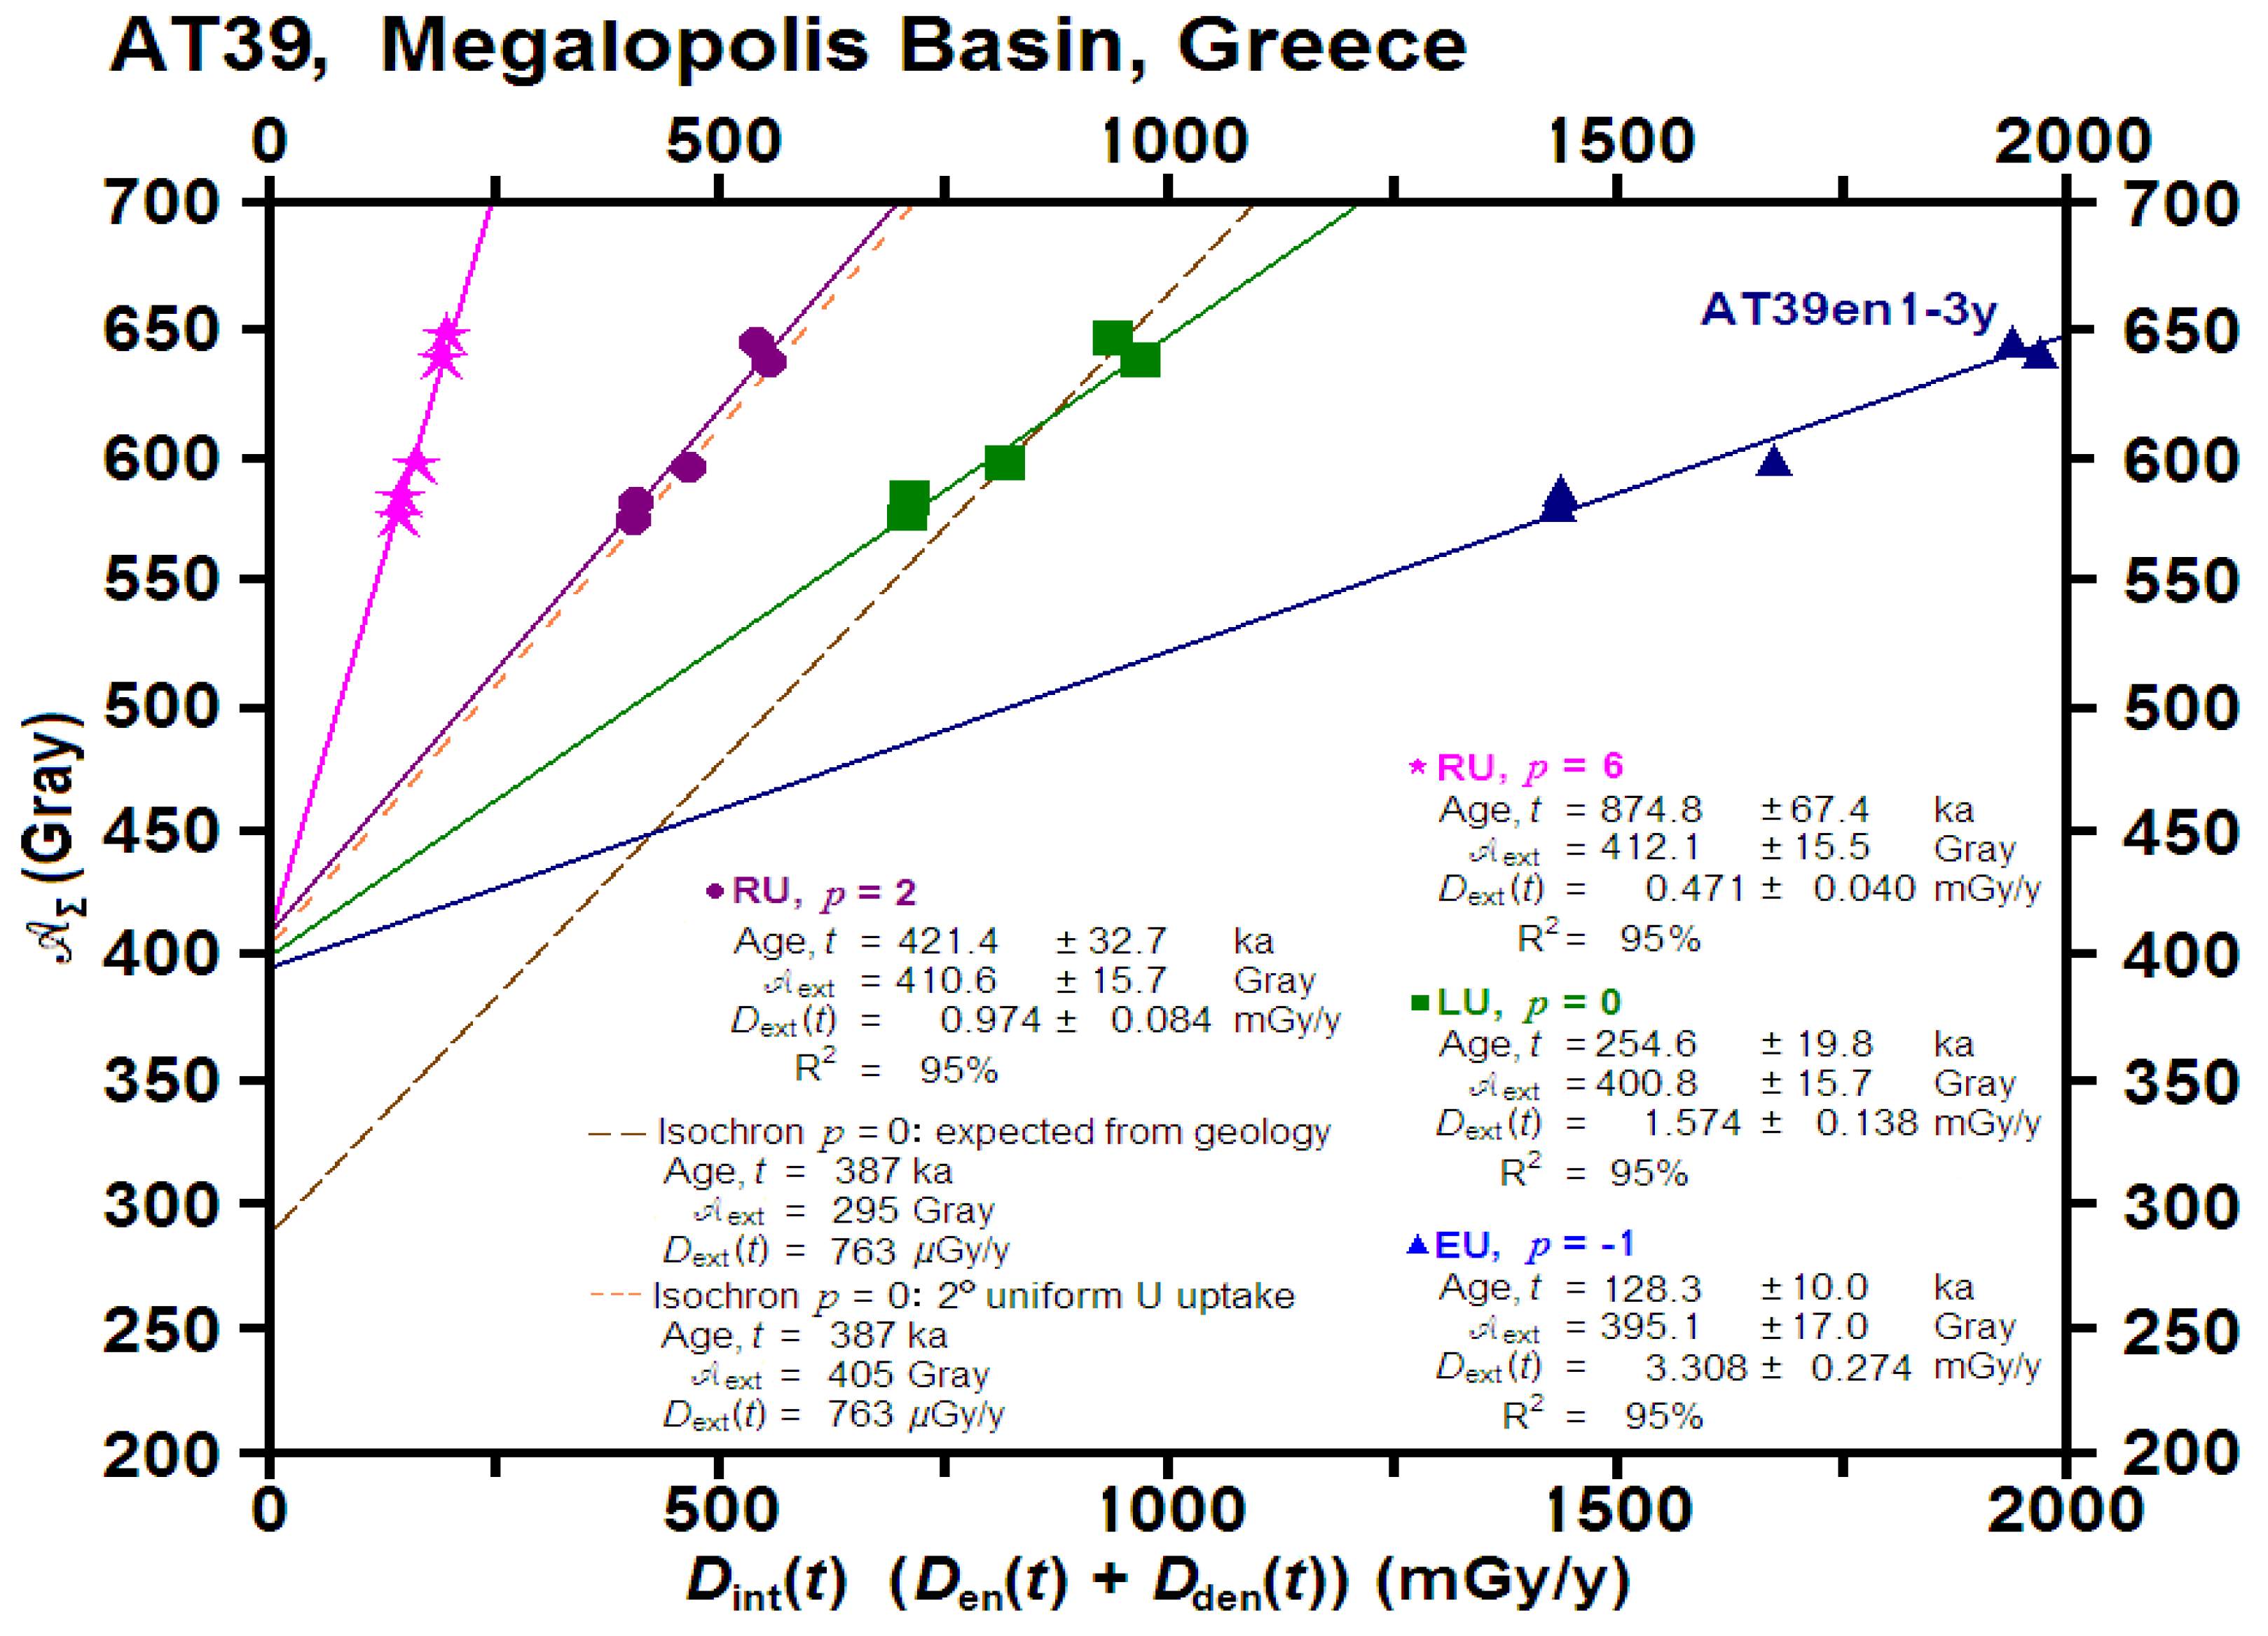
Σ’s averaged 621.7 ± 7.1 Grays (
Table 4a), but the individual values showed considerable variation across the tooth, hinting that an isochron analysis would possibly yield
p, the U uptake rate. Given their 2 σ errors, AT39en1-3y at 649.0 ± 22.5 Grays did not differ significantly from the mean. AT39’s LU ages averaged 387.0 ± 9.3 ka, varying from 374.3 ± 18.2 ka to 404.1 ± 22.7 ka (
Table 4a). If accurate, these would have correlated with MIS 11.
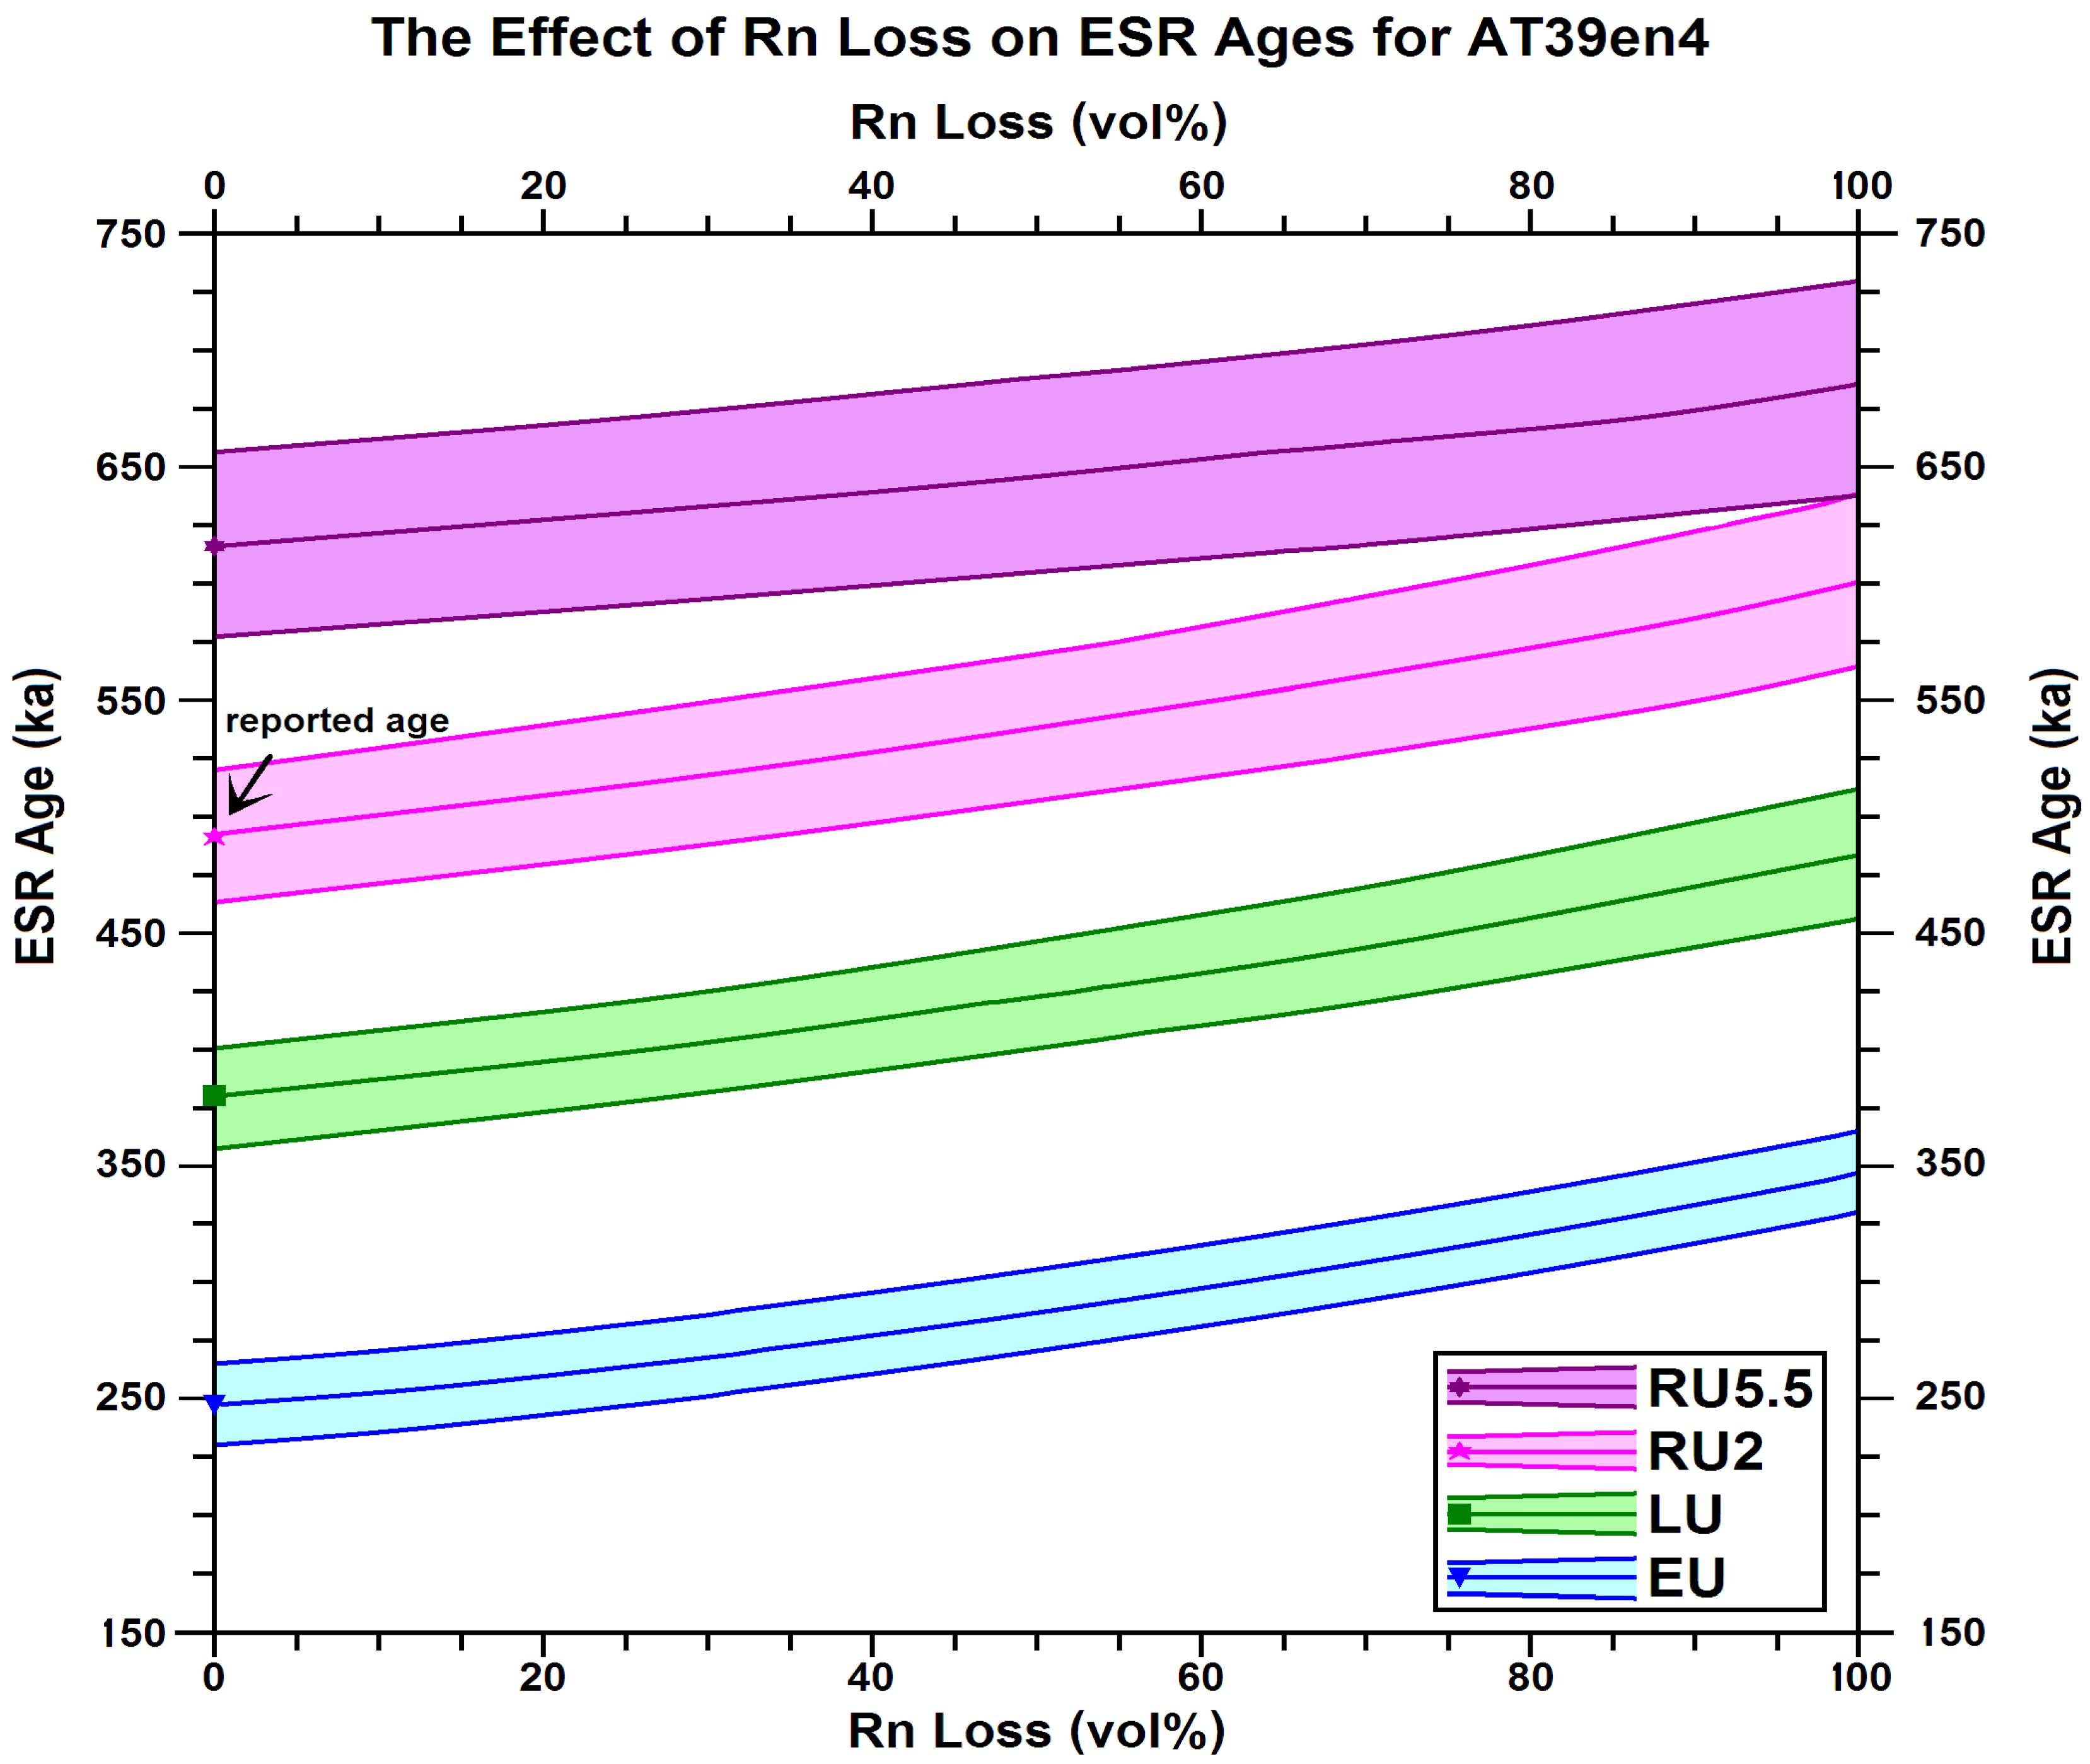
In AT39, the effect of Rn loss on the ages for AT39en4 was modelled by recalculating the various model ages and their uncertainties with Rn loss from 0–100 vol% (
Figure 6). Significance was determined by using a
T-test. Had the tooth experienced Rn loss, changing the Rn loss from 0 to 54 vol% would not have produced any significant change in the LU ages, but at 100% Rn loss, the calculated age would have risen to 482 ± 28 ka. In calculating the ages with
p = 2 (see below), Rn loss at 0–80 vol% yielded no significant age changes, but 100 vol% Rn loss would have given an age of 602 ± 38 ka. Thus, in all cases, regardless of the model assumed for the age calculation, Rn loss produced older ages. With the aquitards above and below Layer UB4 to limit groundwater movement, however, the likelihood for any substantial Rn loss remained low until mining had breached the aquitards.
Assuming either EU or LU (i.e., −1 ≤
p ≤ 0) for AT39, however, yielded mean ages that were too young compared to the constraint imposed by the bivalve’s ages. This hints that the tooth likely absorbed U with a recent U uptake model, i.e., with a U uptake rate,
p > 0. Fortunately, the variability in AT39’s U concentrations and 𝖠
Σ’s suggested that AT39 might yield an isochron (
Figure 7). After several iterations through the process, all lines for AT39’s EU, LU, and RU at
p = 2, and RU at
p = 10, age data sets all converged at 𝖠
ext in the range 395–412 Grays, as did the lines calculated with RU at
p = 1, 4, 8, 10, 12, 16, and 20 (not shown on
Figure 7 for clarity).
For each uptake model, all the calculated ages fell very close to the isochron lines. Thus, all the lines had significant correlation coefficients at
R2 = 95%. Assuming LU (i.e.,
p = 0; the green data on
Figure 7), the isochron gave an age of 255 ± 20 ka, while with RU using
p = 6 (the pink data,
Figure 7) yielded 875 ± 67 ka. Plotting the LU age data (the dotted brown line,
Figure 7), as measured from the standard ESR analyses, gives a line with an age of 387 ka and an intercept at 𝖠
ext = 292 Grays. This line fails to converge with any of the model isochron lines. This suggests that the subsamples within the tooth have experienced some secondary U uptake.
By setting the isochron-generated and geochemically-analyzed external dose rates as equal, i.e.,
=
then, one can find
p for AT39. Setting
=
then, gives a line with an intercept of 𝖠
ext = 421 Grays and an age of 387 ka (the dotted orange line,
Figure 7). Thus, the isochron analysis shows that a model with
p ≅ 2 best approximates AT39’s actual U uptake (the purple line,
Figure 7).
Recalculating the standard ESR data for AT39 using an RU model with
p = 2 gives an age averaging 503.2 ± 12.7 ka (
Table 4b). The Isoplot analyses gave an identical weighted age with 95% (2 σ) confidence. Using Tukey’s biweight calculation gave a weighted average age of 503 ± 15 ka at 95% confidence for AT39, whereas using the robust median method gave a weighted age of
ka with 93.8% confidence. All these calculated mean ages correlate well with MIS 13, a warmer period in the Middle Pleistocene (
Figure 8). Nonetheless, a coupled ESR-
230Th/
234U analysis (e.g., McDermott et al. [
57]; Grün & McDermott [
58]; Jones et al. [
59]; Duval et al. [
60]) should be run for both AT39’s enamel and dentine to confirm the value for
p. Unfortunately, coupled ESR-
230Th/
234U analyses do not always yield reliable results: Successful coupled tooth dates still occur less than half the time on average. Given that teeth act as open systems under every uptake model, except EU, the
230Th/
234U dating limit does significantly exceed that for
230Th/
234U closed system dates. Under
230Th/
234U open systems protocols, the age calculations become more complex. As teeth become older, ages also become less precise, especially when they approach the
230Th/
234U dating limit [
61,
62]. Nonetheless, Duval et al. [
60] reported coupled ESR-
230Th/
234U ages as old as 1 Ma. With low [
Uen] for AT39, ranging from 0.79 to 2.08 ppm (
Table 2), getting reliable
230Th/
234U became more difficult and less precise. Coupled ESR-
230Th/
234U analyses using both enamel and dentine for several subsamples from AT39 failed to give
p values. With a very small sample, and [
Uen] = 0.07 ppm, ESR-
230Th/
234U analyses for AT68’s enamel will not work. Although coupled ESR-
230Th/
234U analyses could be attempted again, the chance for success remains low with the technology currently available. In sites where both coupled ESR-
230Th/
234U and isochron analyses have been completed, isochron analyses have generated
p values that agree well within errors for those found from coupled ESR-
230Th/
234U analyses (e.g., Blackwell et al. [
26]).
Since AM66 and AM65 stratigraphically overly AT39, their mean age at 488 ± 37 ka (
Figure 8) must set the youngest possible age limit for AT39. Their mean age also does differs significantly from AT39’s EU model age (i.e.,
p = −1) at the 95% confidence limit (i.e., considering the 2 σ uncertainties;
Table 4a). Therefore, AT39 could not possibly have experienced early U uptake, because using an EU model gives AT39’s mean age (at 253 ± 6 ka) that is much too young by > 100 ky! Nor do teeth from other sites with 𝖠
Σ values similar to these usually show U uptake that follows LU models (
p = 0), let alone EU models [
16,
19,
23,
24,
34,
63]. At the 95% confidence limit (i.e., considering the 2 σ uncertainties;
Table 4), the bivalves’ mean age also significantly exceeds AT39’s LU model mean age (i.e., with
p = 0). At the 95% confidence limit, however, the bivalves’ mean age does not differ significantly from AT39’s mean age assuming an RU model with
p = 2 at 503 ± 13 ka. This demonstrates that the dated sequence has not been overturned, as do all the other geological, biological, and taphonomic data.
Although the bivalves’ mean age cannot constrain AT39’s potentially oldest mean age, AT39’s standard ESR mean age does converge at an mean age of 654 ± 19 ka with an RU model at
p = 8, which is a high
p value given the tooth’s 𝖠
Σ values and its U concentrations. The maximum possible age for AT39 ranges from 705 ± 20 ka with
p = 10 to 800 ± 25 ka at
p = 20, both of which also seem unlikely given the associated fauna found at the site [
7,
18]. Moreover, finding teeth with
p ≥ 10 at other sites is rare [
19]. Given the isochron analyses, however, the ages calculated with
p = 2 appear more likely to be the more accurate ages. With
p = 2, AT39’s mean age correlates well with MIS 13c (
Figure 8).
Although AT68 yielded nine subsamples, the tiny pieces had to be recombined into one subsample, AT68en1-9, to get enough aliquots for irradiation and ESR analysis. Its enamel U concentration averaged 0.07 ± 0.02 ppm (
Table 2b), and its dentine, 12.97–15.19 ± 0.02 ppm U. Thus, AT68’s enamel U concentrations were considerably smaller than those seen in AT39’s enamel, while AT68’s dentine samples had moderately less U than in some of AT39’s dentine. AT68, however, showed no features to indicate that it had suffered from any U leaching. Unfortunately, its small sample size, low [
Uen] and [
Uden] precluded it being analyzed by coupled ESR-
230Th/
234U analyses. AT68’s [
Uen] and [
Uden] also hint that the groundwater salinity at AT68’s deposition site was lower than that seen near AT39. Alternatively, the spot where AT68 sat may have had somewhat lower salinity surface water than where AT39 lay (
cf. Blackwell et al. [
34]).
With 𝖠
Σ = 567.5 ± 27.2 Grays (
Table 4b), AT68en1-9’s LU age at 424.4 ± 26.2 ka does also not differ significantly from some AT39 subsamples. At
p = 2, however, AT68en1-9’s age at 512.1 ± 34.2 ka agrees very well with the mean age for AT39 at
p = 2. Without an isochron for AT68, however, estimating
p for AT68 is an educated guess. Although both teeth sat on the same unconformity and were covered by the same homogeneous sedimentary layer with similar geochemical and sedimentary features [
14], the two teeth may not have experienced the same
p, especially given their respective U concentrations. Nonetheless, the assumption that both follow roughly the same
p does provide a first age approximation for AT68. If AT68 is plotted on the AT39 isochron plot, AT68 does not lie on the same isochron lines for AT39, suggesting that they did experience somewhat different U uptake histories. Given its low U concentration, AT68’s enamel may even have recently lost U. Without coupled ESR-
230Th/
234U ages, which would not have yielded data for the enamel due to its low U concentration, AT68’s
p remain uncertain. The constraint imposed by the bivalves’ stratigraphy and ages, however, suggests that AT68 must also be equal or exceed the bivalves’ ages. Assuming
p = 2, AT68 dates to 512.1 ± 34.2 ka, which also correlates with MIS 13.
Given that AT68 and AT39 both lay on the same unconformity, albeit separated by ~60 m, the two teeth can be used to calculate a mean average for the whole horizon. Using Isoplot, a weighted average gives an age of 503.0 ± 11.8 ka. Using Tukey’s biweight calculation, the ages average at 505 ± 12 ka, at the 95% (2 σ) confidence limit, whereas using the robust median method gives an age of
ka, with 96.9% confidence. Using feldspar grains, however, Jacobs et al. [
52] found IRSL ages correlative with MIS 11–12 for the lacustrine sediment from the package between Lignite Seams II and III. Considering their associated uncertainties, the ESR enamel ages reported here are somewhat older, but agree better with the pollen data.
4.3. Correlations
In Area A, Panagopoulou et al. [
3,
13] found a partial
Palaeoloxodon antiquus skeleton, likely from one individual. About 60 m from the elephant skeleton, more elephantid bones occurred in Area B, including a second left tibia from a different individual. If some bones in Area B should prove to derive from the elephant in Area A, then natural processes or hominids likely caused some minor reworking. Thus far, however, the amount of bone and lithic movement appears to have been minimal. Nonetheless, to test if AT39 and AT68 were reworked, another two to three teeth should be dated for this layer, if suitable teeth can be recovered. The stratigraphy and the anatomical association of the main elephant skeleton, however, indicate that any reworking must have been very limited [
15,
41]. Finding more teeth that can be sacrificed for ESR dating, given the significance of the faunal and the archaeological finds, will be difficult.
From the stratigraphy, the ages for the cervid teeth AT39 and AT68 must equal or exceed those for AM65 and AM66. That the shell ages do not depend on an U uptake model immediately rules out both EU and LU ages. Sitting on the unconformity at UB4c/UB5, the cervid tooth, AT39, most likely dates to about 503 ± 13 ka and correlates best with MIS 13b (
Figure 8). Found on the base of UA3c, which correlates stratigraphically to the base of UB4c, AT68 likely dates to 512 ± 34 ka, and also correlates with early MIS 13 (
Figure 8). Since the unconformity at the base of UA3c is the same unconformity at the base of UB4c [
14], it dates to 503.0 ± 11.8 ka at the 95% (2 σ) confidence limit, and again correlates with mid MIS 13. Meanwhile, bivalve shells sampled from Layer UA2, AM66 dated to 488 ± 37 ka, also correlating best with MIS 13a. With ~0.8–1.3 m between the base of Layer UA2/UB2 and the unconformity between Layer UB4c/UB5 and UA3c/UA4, the sedimentation rate averages ~4.8 ± 1.8 to 7.8 ± 2.9 cm/ka.
Although MIS 13 (
Figure 8) was an interglacial period, it was one of the weakest during the last 800 ka, and similarly, MIS 14 was one of the weakest glacial periods [
54,
64]. Unlike later Pleistocene interglacials, all the proxy records indicate that mean global temperatures and sea surface temperatures in MIS 13 were not nearly as hot as those in MIS 11c or MIS 5e, or even as warm as those in MIS 1 or 7e. Moreover, in the terrestrial records, the character of the pollen and other climatic proxies are almost indistinguishable within MIS 13–14. For example, at Treugol’naya in the Caucasus Mt., MIS 13 was cooler than during MIS 11 [
16], producing mild, relatively dry conditions. At Tenaghi Philippon, MIS 13–14 shows less
Quercus overall, coupled with many short-term cyclic expansions and reductions, especially in the latter 20 ka, suggesting greater short-term climatic instability [
54], which would correlate with the deposition of AM66 in the shell horizon. At the site southwest of Megalopolis [
9], assuming that their Layer F does correlate with MIS 14, the lignite layer is thin with little
Quercus,
Olea, and
Ulmus, hinting at cooler temperatures than during MIS 15 or 11 in the Megalopolis Basin. Except for the warmest times in MIS 13 from ~483–496 ka, the relative temperatures averaged from 3–5 °C cooler than today. Such temperatures are more comparable to those seen in the cooler later parts of MIS 5, 9, or 11 [
64]. The ages for AT39 and AT68 suggest that this archaeological site formed just as the temperatures were rising globally from a short-term minimum in MIS 13d. These warm temperatures would have allowed elephants to exploit this environment, where the marsh or lake would have supplied a year-round or almost year-round water supply for the elephants and the other mammalian fauna.


 ,
, 


