Article

Varve Distribution Reveals Spatiotemporal Hypolimnetic Hypoxia Oscillations During the Past 200 Years in Lake Lehmilampi, Eastern Finland

1
Department of Geography and Geology, University of Turku, FIN-20014 Turku, Finland
2
Research center for Pan-Pacific civilizations, Ritsumeikan University, Kyoto 603–8577, Japan
*
Author to whom correspondence should be addressed.
Quaternary 2019, 2(2), 20; https://doi.org/10.3390/quat2020020
Submission received: 15 January 2019 / Revised: 21 May 2019 / Accepted: 22 May 2019 / Published: 26 May 2019
(This article belongs to the Special Issue Annually Laminated Lake Sediments)

Abstract

:
We investigated 34 sediment cores to reconstruct spatiotemporal variations in hypolimnetic hypoxia for the past 200 years in Lehmilampi, a small lake in Eastern Finland. As hypoxia is essential for varve preservation, spatiotemporal changes in varve distribution were used as an indicator for hypolimnetic hypoxia oscillations. The hypoxic water volume was used as a variable reflecting hypolimnetic hypoxia and determined for each year by estimating the water volume beneath the water depth where shallowest varves were preserved. As a result, seven hypoxia periods, highlighting the variations in hypolimnetic hypoxia, are established. These periods may be influenced by bioturbation, lake infill, and lake level changes. Furthermore, we evaluated the relationship between hypolimnetic hypoxia oscillations and climatic factors. Diatom assemblage changes were also analyzed to estimate whether the hypoxia periods could be related to anthropogenic eutrophication. The diatom analyses suggest relatively stable nutrient conditions for the past 200 years in Lake Lehmilampi. Climate, on the other hand, seems to be an important driver of hypoxia oscillations based on correlation analysis. The role of individual forcing factors and their interaction with hypolimnetic hypoxia would benefit from further investigations. Understanding climatic and anthropogenic forcing behind hypolimnetic hypoxia oscillations is essential when assessing the fate of boreal lakes in a multi-stressor world.

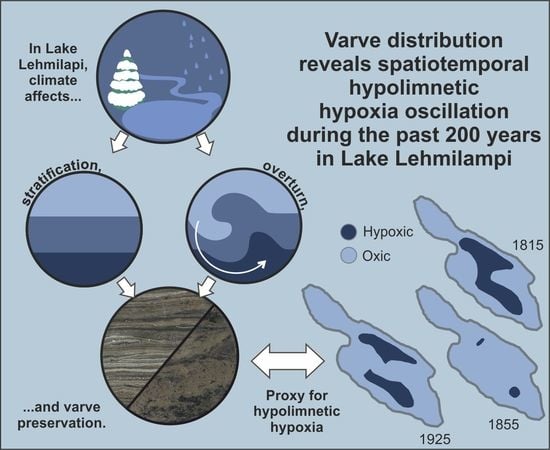
Graphical Abstract

1. Introduction

Eutrophication and hypoxia have become environmental challenges worldwide, causing loss of biodiversity, fish kills, and algal blooms [1,2,3]. Therefore, they are also an economic problem [4]. Eutrophication in lakes is triggered by excess nutrients [5] leading to hypolimnetic hypoxia through enhanced autochthonous production and increased oxygen consumption caused by the degradation of biogenic material [6,7]. The nutrient overload is generally a result of anthropogenic influence, such as sewage and runoff from agricultural fields, construction areas, and industry [8]. In addition to anthropogenic factors, changes in climate affect hypolimnetic oxygen concentrations. For instance, the solubility of oxygen in water corresponds negatively to increasing water temperatures [9]. Increasing water temperature may also reduce the mixing of oxygen-rich surface waters with deeper waters [9] and thus extend the stratification period [10]. Hence, variations in climate trigger variations in hypolimnetic hypoxia, i.e., their depth, area, and volume. These variations in hypoxia are hereinafter called hypolimnetic hypoxia oscillations.
Lake sediments are natural archives suitable for investigating past climatic and anthropogenic changes in the environment [11,12,13]. Their formation is mainly controlled by climate, catchment conditions (e.g., weathering, surface run-off, groundwater flow), and anthropogenic factors [14,15]. Varves are annual laminations that represent seasonal sedimentation cycles in a lake [12,16] and can be considered as indicators of hypolimnetic hypoxia [17,18]. High lacustrine productivity and seasonal variability in runoff transporting eroded clastic material into a lake are essential for varve formation [12,19]. Varve preservation, however, requires certain features [20,21] that support the absence of sediment mixing, erosion, and re-suspension. Hypoxia (≤ 2 mg L−1) [22], the oxygen level under which freshwater organisms cannot survive [1], is the key to further the preservation of varves [21,23] because it results in the absence of bioturbation. It more likely occurs in stratified and eutrophic lakes with oxygen consumption due to organic matter decay (mineralization) [7]. In contrast to longer-term hypoxia, seasonal hypoxia might not result in varve formation, for instance, because of uniform seasonal sedimentation or wind-induced resuspension [24].
Although the approach of using the presence of varves to study hypolimnetic hypoxia has shown to be suitable, the number of studies using varves to establish the onset of hypoxia oscillations is limited [17,18,25]. The present study details spatiotemporal changes in varve preservation from the deepest point towards the shore of Lake Lehmilampi in Eastern Finland during the past 200 years. As varve preservation is highly dependent on hypoxia, the study also relates to hypolimnetic hypoxia oscillations. In addition, we evaluated possible forcing factors (climate variations and eutrophication) influencing hypolimnetic hypoxia oscillations in Lake Lehmilampi.

2. Study Site

Lake Lehmilampi (Figure 1a,b) is a small headwater lake in Eastern Finland (63°37’42 N, 29°06´09 E, surface area 0.17 km2) with a northern (maximum water depth: 10.8 m) and a southern basin (maximum water depth: 11.6 m). Both basins are elongated in the northwest-southeast direction. The northern shoreline of the northern basin and the southern shoreline of the southern basin are rather steep. Lake Lehmilampi has two inflows, one from the southeast and another from the southwest and one outflow to the northwest. Lake water monitoring data is available only for three dates since the 1970s showing seasonal and annual variations in water quality (Figure 1c).
Hydrological monitoring data are unavailable for this small lake but exist for the larger and deeper (maximum water depth: 61 m) neighboring Lake Pielinen, located ca. 9 km to the south from Lake Lehmilampi. The freezing date varies from October 23rd to January 29th (average November 25th) in Lake Pielinen, melting date from April 29th to June 3rd (average May 18th), and ice cover duration from 105–212 days (average 175 days) [26,27]. Spring and autumn overturns typically take place in May and September–October, respectively [28]. The water level in Lake Pielinen (Figure 1d) decreases to its minimum in April, after which it increases to its maximum in June–July [29]. The average annual difference between the minimum and maximum water levels is 118 cm [29].
Lake Lehmilampi is located in the boreal climate zone. Mean annual temperature is 3.2 °C, mean spring (March, April, May) temperature 2.2 °C, mean summer (June, July, August) temperature 15.2 °C, mean autumn (September, October, November) temperature 3.7 °C, and mean winter (December, January, February) temperature −8.5 °C at the weather station Kuopio Maaninka [30]. This station is located approximately 100 km southwest from Lake Lehmilampi. Mean annual precipitation is 612 mm, with approximately half as rainfall and the rest as snowfall [28]. Mean spring precipitation is 112 mm, mean summer precipitation 218 mm, mean autumn precipitation 158 mm, and mean winter precipitation 124 mm. In Eastern Finland, wind velocities are rather low, and mean annual wind speed varies between 2.5–3.4 m/s at Lake Lehmilampi [31]. Wind velocities are highest during autumn and lowest during winter. Generally, the wind direction is southeast during autumn and southwest during the rest of the year.
Land use in Eastern Finland changed into a more permanent slash-and-burn cultivation in the 16th century [32,33], although paleolimnological analyses suggest sporadic, small-scale land use already during prehistoric times, i.e., prior to the 14th century [34,35]. Cultivation intensified in the 18th century in the vicinity of Lake Lehmilampi, as evidenced by increasing cereal pollen in the lake sediments [35]. Traditional slash-and-burn agriculture continued in Eastern Finland until the late 19th century [36]. After the Second World War, agriculture, forestry, and urbanization intensified in Finland [37]. Draining peatlands for forestry was most extensive in Eastern Finland during the 1960s–1980s [38], and a small drained peatland also exists in the Lake Lehmilampi catchment. Currently, the catchment is mainly forested (Figure 1e). The bedrock in the catchment area (1 km2) is composed of Archean tonalite (a plutonic rock compositionally between granite and diorite), whereas the surface geology (Figure 1f) is dominated by Quaternary till and silty loams [39].
The sediments at the two deepest basins of Lake Lehmilampi are varved, representing seasonal changes in sediment accumulation [40]. The basic varve structure is composed of clastic and biogenic laminae (Figure 2). The clasts are eroded from the catchment and transported into the lake by spring floods following snowmelts. As a consequence, a sharp contact is typical between the dark-colored organic lamina and the following light-colored clastic lamina, whereas the contact is gradual between the clastic lamina and the following biogenic lamina [40]. The biogenic lamina is composed of autochthonous and allochthonous organic matter deposited during the growing season from summer to autumn [40,41]. The thickness of biogenic lamina depends on the primary production rate, transport of autochthonous biogenic material, preservation, and degradation [42]. Preservation and degradation are closely linked to hypolimnetic oxygen concentrations [43,44]. According to an earlier study [45], varve preservation in the northern basin of Lake Lehmilampi started approximately 5100 BP when the lake became isolated from Lake Pielinen.

3. Materials and Methods

3.1. Coring and Sample Preparation

A comprehensive sediment sampling of Lake Lehmilampi was performed in March 2014 when the lake was frozen. Altogether, 14 long piston cores (diameter 5 cm, length 140–167 cm) and 20 short freeze cores were recovered along two transects (Figure 1a,b, Table 1) at water depths between 6.5–10.8 m, to obtain a detailed perception of sediment characteristics throughout the lake. Piston cores were recovered with a lightweight Livingstone piston corer and stored in a cold room at 5 °C. They were spliced into two halves along their long axis with a circular saw and a wire. Sediment surfaces were cleaned with a glass slip and covered with a thin plastic film for magnetic susceptibility measurements. The freeze cores were recovered with an HTH sediment corer [46] applying the ice-finger technique [47,48] with dry ice to obtain a frozen surface sample. The freeze cores were approximately 30 cm long and represent ca. 200 years at the most. These cores were stored in a freezer at −18 °C. To preserve varve structures, the freeze cores were impregnated with epoxy resin using the water-acetone-epoxy exchange method [49,50]. The cured samples were sawn using a rock saw and polished into 1.8 mm thin slabs for incident light microscopy analysis and X-ray radiography. To perceive the basic Lake Lehmilampi varve structure in detail, a 30 µm thin section was prepared using an ASTERA CUT8 diamond saw (Astera Solutions, Zürich, Switzerland, manufactured in Vaasa, Finland) and an ASTERA GRN16 grinder (Astera Solutions, Zürich, Switzerland, manufactured in Vaasa, Finland).

3.2. Varve Analysis

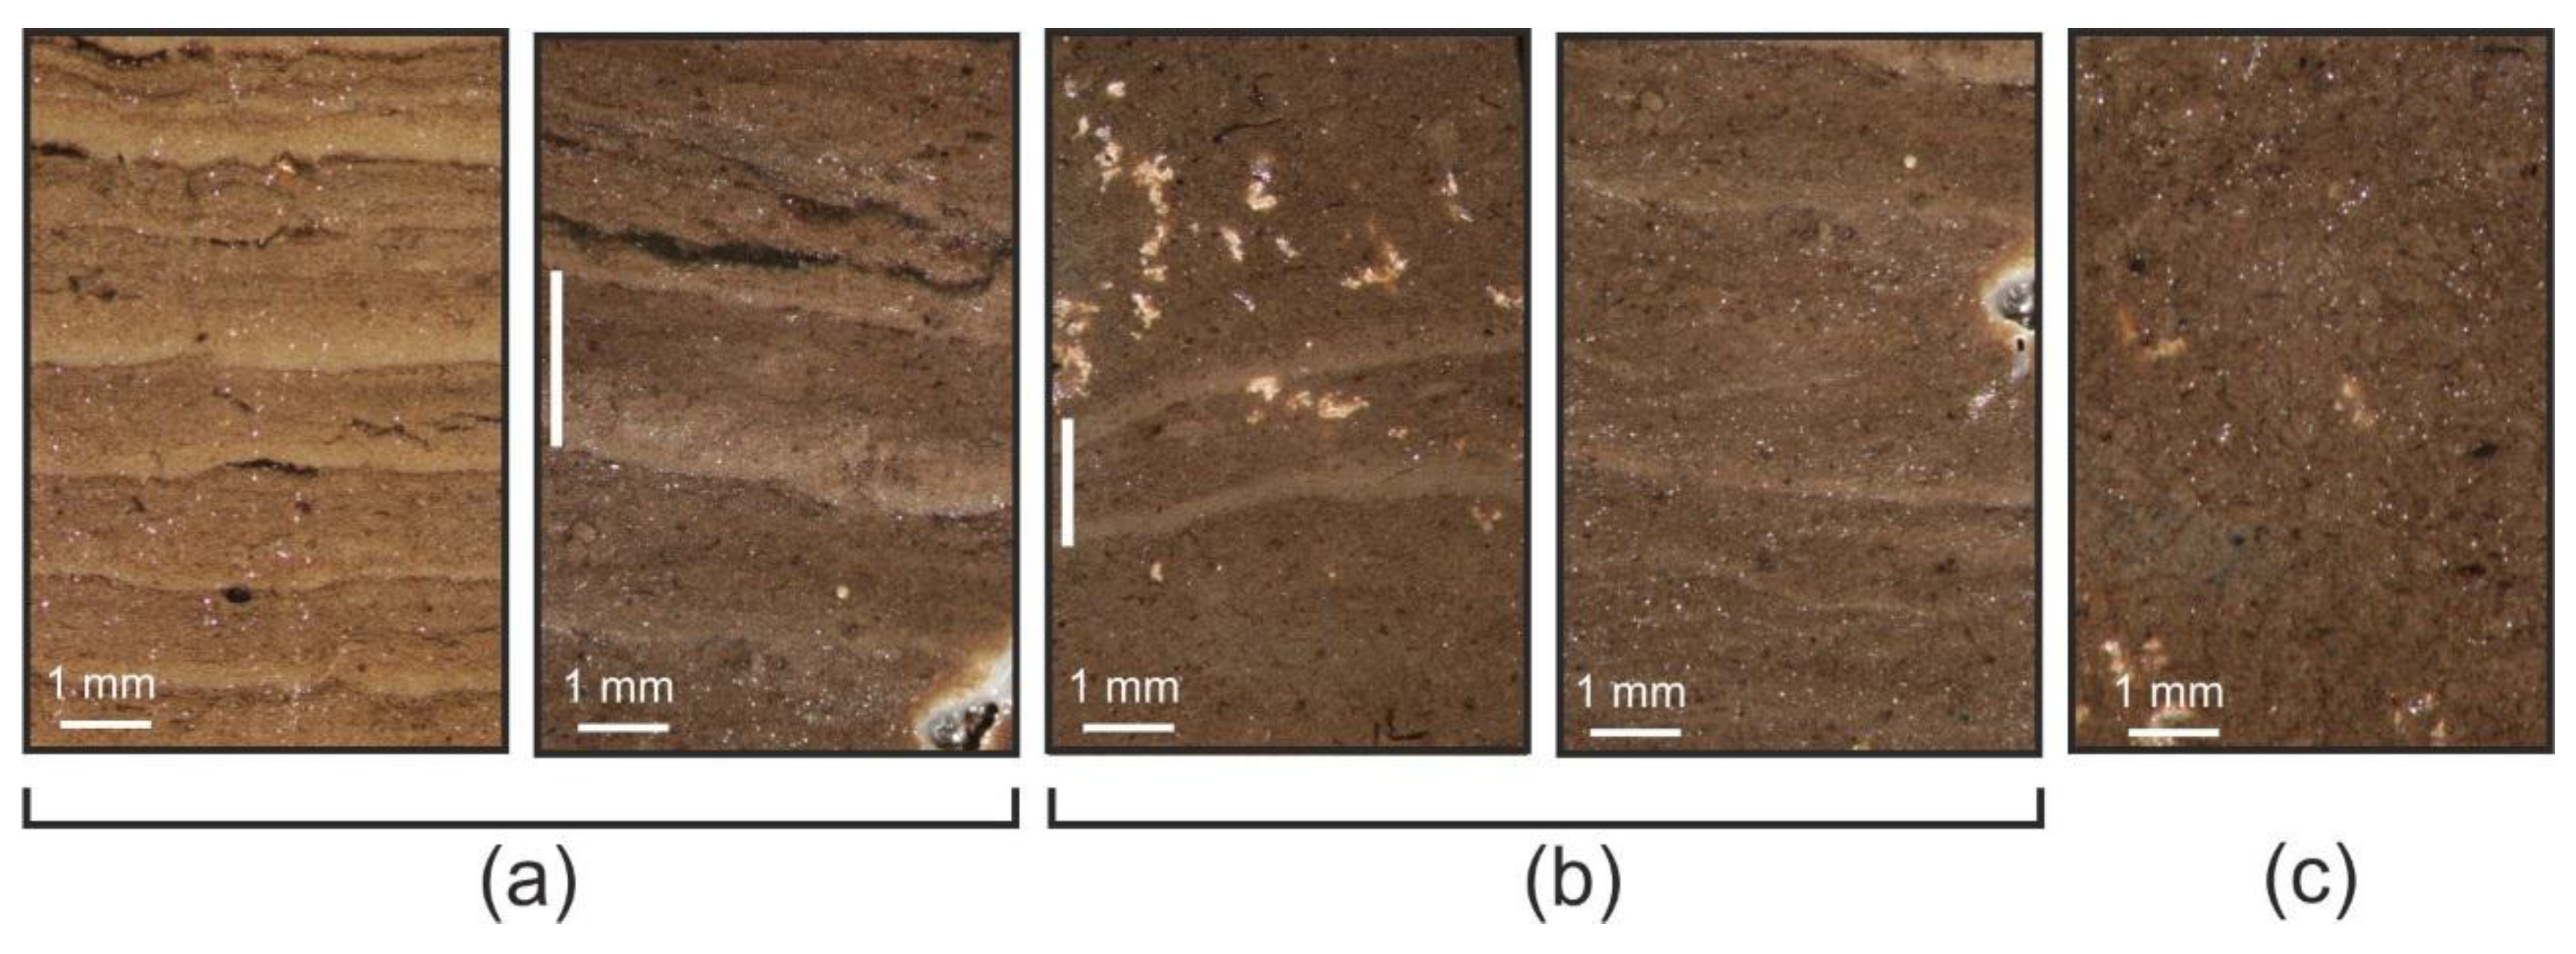
Varves were counted from each epoxy-impregnated and polished freeze core sub-sample with the help of incident light microscopy and X-ray images. Incident light microscopy images were taken with a Canon EOS 600D and Canon EOS Utility software coupled with a Nikon SMZ800 stereomicroscope. X-ray radiography was performed at the University of Helsinki using the µCT scanner Nanotom 180 NF. To establish spatiotemporal changes in varve distribution, the sediment was divided into different sections by varve analysis. For each freeze core, varved (a), partially varved (b), and non-varved sections (c) were identified (Figure 3, Table 1). Varve, clastic lamina and biogenic lamina thicknesses were measured from the epoxy-impregnated sub-samples using a microscope to study variations in sediment composition. For each freeze core, the percentage of varved sediments between the years 1815 and 2014 was calculated by measuring the thickness of varved sections and comparing it to the entire core length. For each non-varved section, sediment accumulation rates were calculated as an average of the section in question.
Sections are considered as varved (Figure 3a) if:
  • Varves are present in incident light microscopy images or X-ray images.
  • Varves exhibit both a clastic spring lamina and a biogenic growing season lamina with clear differences in color or brightness.
  • Varves have a sharp contact between preceding organic and subsequent clastic lamina.
Sections are considered as partially varved (Figure 3b) if:
  • Varve structure without a sharp contact between preceding organic and subsequent clastic lamina is identified.
  • Laminae are disturbed or laterally discontinuous. Such sections sometimes consist of several subsequent varves.
Sections are considered as non-varved (Figure 3c) if:
  • Sediment is massive
  • No laminated structure is identified.

3.3. Dating and Core Correlation

Core LL1 from the deepest point of the northern basin was dated using varve counting and considered as the master core, because of its undisturbed and continuous varve record. A similar record has also been observed in earlier studies of the northern basin [40,45]. Radiometric dating was performed for core LL1 to verify the accuracy of varve counting. 137Cs activities were measured with a BrightSpec gamma spectrometer on wet sediment samples of 11–30 g with 3600 s counting time at the Geological Survey of Finland. Each wet sediment sample integrated two varve years.
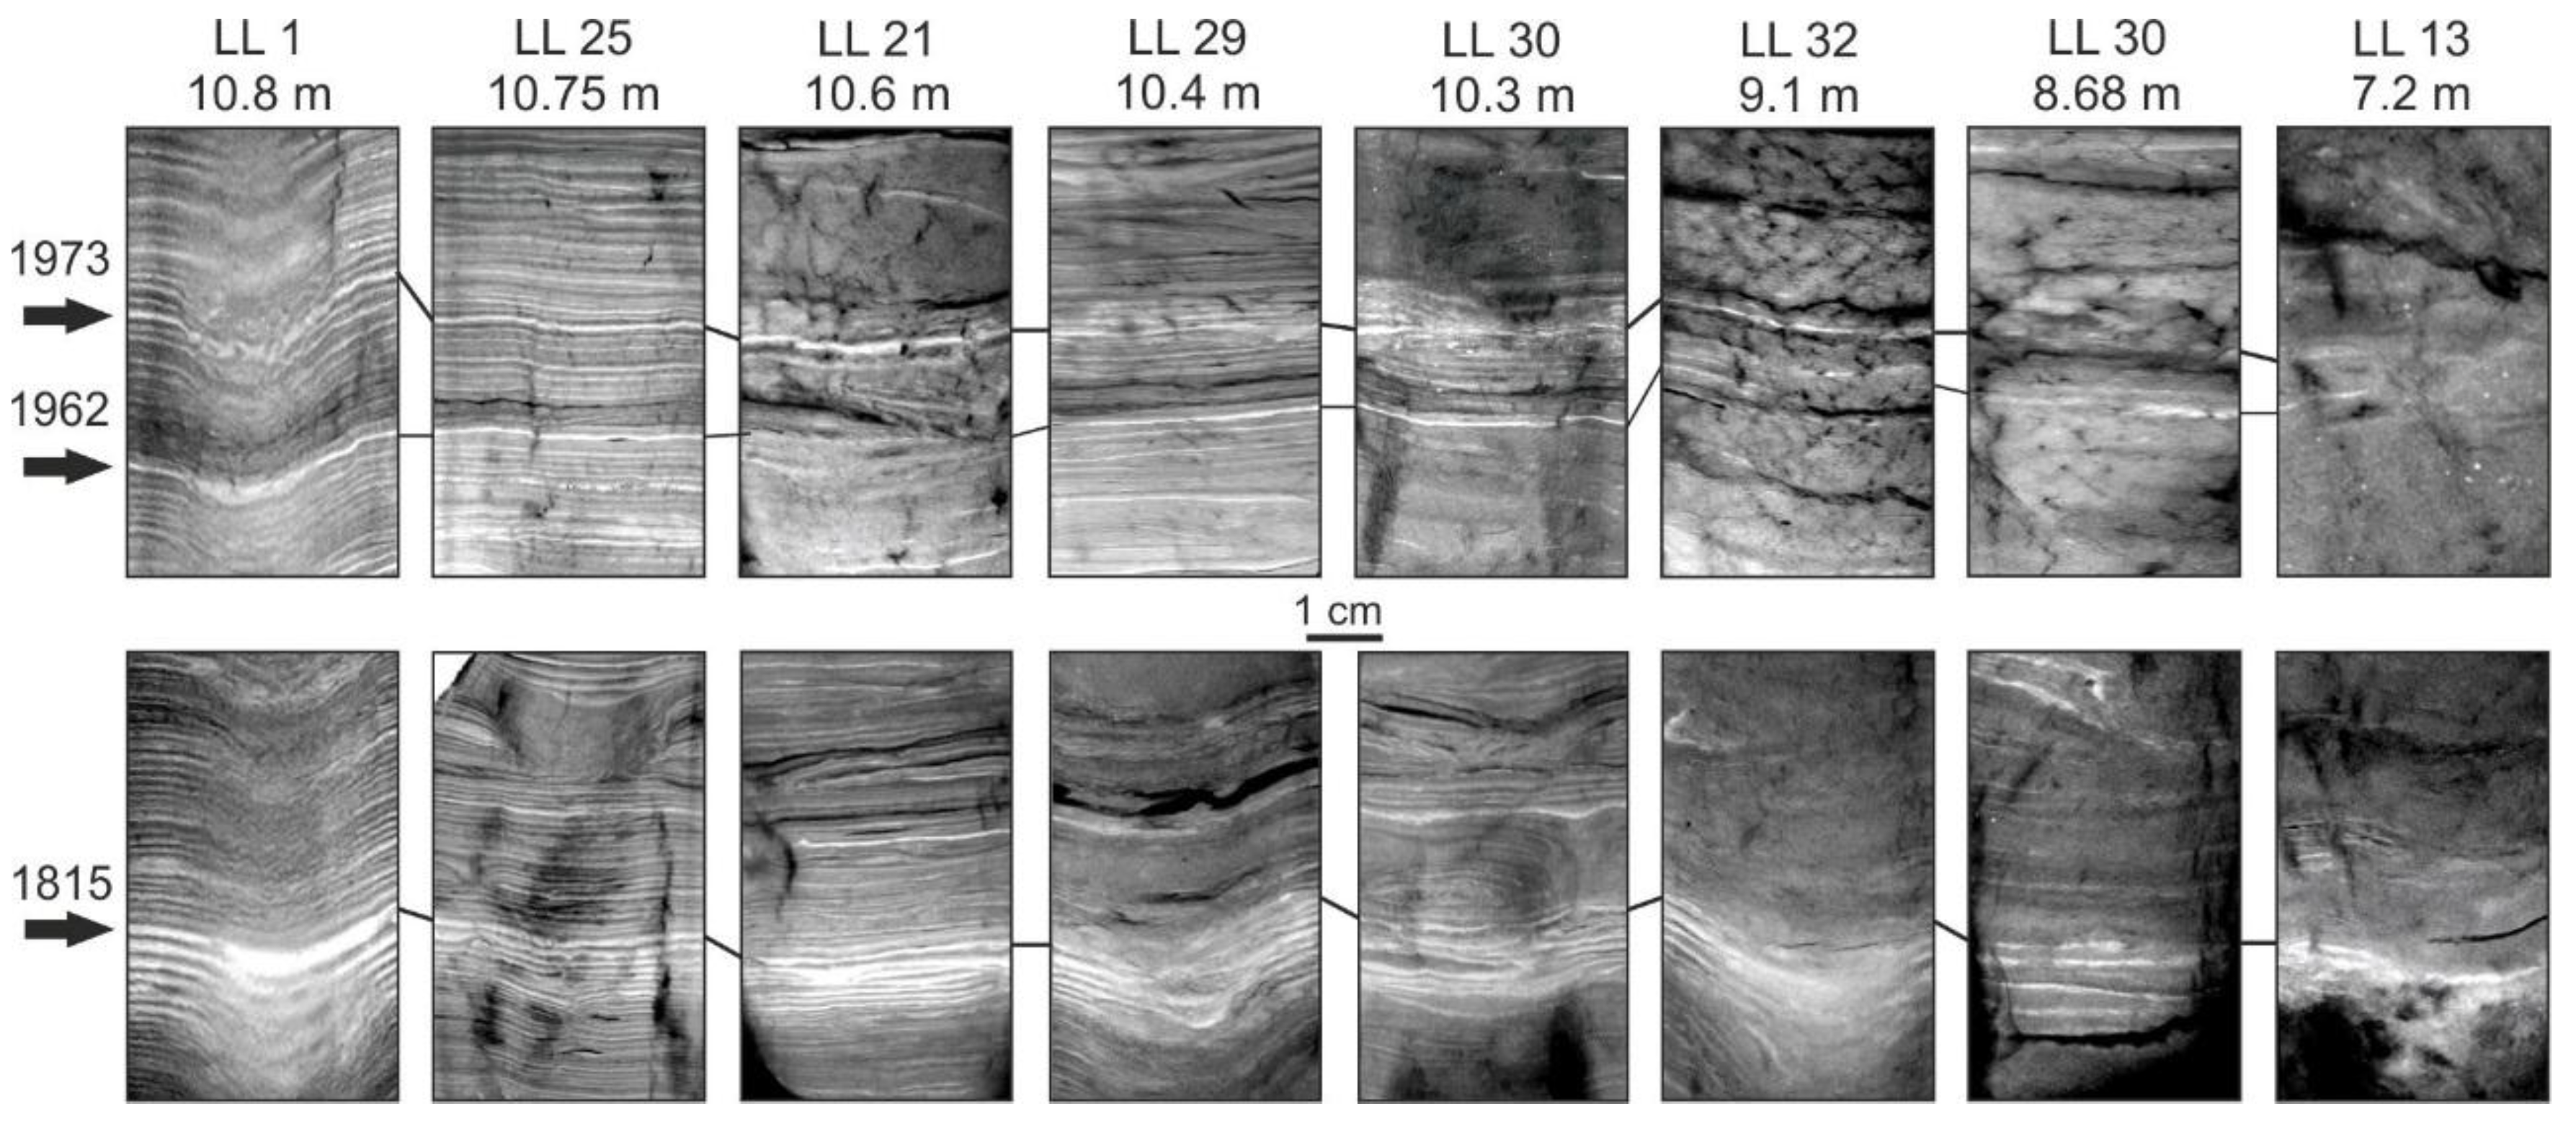
All cores, particularly the varved sections, were correlated with core LL1 using seasonal changes in varve succession, lithological marker horizons (e.g., particularly thick clastic laminae) that represent major changes in sediment composition, as well as magnetic susceptibility. Varve succession and lithological markers were identified from incident light microscopy and X-ray images, the latter showing density variations of the sediment (Figure 4). The beginning and the end of the non-varved and partially varved sections were correlated with the master core based on the varves below and above the non-varved and partially varved sections. Magnetic susceptibility measurements were carried out for each piston core using the Bartington MS2 susceptibility meter connected to a Bartington MS2E core logging sensor at 2 mm intervals on an automatic measuring track.

3.4. Modeling the Hypoxic Water Volume

Hypoxia throughout the lake was modeled using the distribution of varves during the past 200 years (1815–2014). The annual spatial distribution of varves in the lake was determined based on the water depth of the varve preserving sediments. The determined water depth represents the boundary below which varves have been preserved. For each year, the spatial distribution of the varved area and the water volume below the critical water depth corresponding to this area were determined with the ArcGIS ArcMap 10.1 software. Modeling of the hypoxic water volume was based on the assumption that the volume of Lake Lehmilampi has remained relatively constant during the study period. Possible effects of lake level changes and lake infill are discussed in Section 5. The bathymetric curves of Lake Lehmilampi were interpolated with the nearest neighbor interpolation method using measurement data from the National Land Survey of Finland (NLS) data service [55] together with water depth measurements taken during sampling.
We refer to the percentage of hypoxic water volume of the whole lake water volume as the hypoxia volume. The water volume data were divided into two groups, hypoxia and baseline periods, based on the median hypoxia volume, which was defined as the cutoff value for baseline conditions of hypoxia in Lake Lehmilampi. Annual hypoxia volumes below this cutoff value were considered as baseline periods, whereas hypoxia volumes at or exceeding the cutoff value were classified as hypoxia periods.

3.5. Meteorological and Diatom Data

To identify possible environmental factors triggering spatiotemporal changes in hypoxia in Lake Lehmilampi, we acquired meteorological data from NORDKLIM (Dataset for Climate Analysis with Data from the Nordic Region) [56] and analyzed the diatom assemblages of each hypoxia and baseline period from core LL1. The long meterorological data of Kuopio Maaninka weather monitoring station covers monthly data for 1890–1998. We calculated annual temperature and precipitation, seasonal temperature and precipitation, and the number of days with snow cover (>50% covered by snow). Moreover, monthly spring (March, April, May) temperature and precipitation as well as monthly autumn (September, October, November) temperature and precipitation were calculated to investigate possible effects of spring and autumn overturns.
Diatoms were analyzed because they are sensitive indicators of environmental change and widely used for reconstructing past nutrient concentrations of lakes [57]. Each diatom sample represents one hypoxia or baseline period, apart from the longest hypoxia periods 1 (3 samples) and 7 (2 samples), and the shortest hypoxia period 5 (no samples). The diatom samples integrate 3–12 years, depending on the duration of the period in question. One varve at the start and one at the end of each period were excluded to avoid contamination between subsequent periods. Diatom slides were prepared using standard procedures [57]. At least 300 diatom valves were identified to species level under an optical microscope at x1000 magnification using the taxonomical references of Krammer and Lange-Bertalot [58,59,60,61] and updated nomenclature of Porter [62], Spaulding et al. [63], and Guiry and Guiry [64]. Higher taxonomic level summaries were made by calculating relative abundances of planktic large-celled Aulacoseira taxa, small-celled cyclotelloid taxa, and elongate pennate taxa, as well as small, benthic fragilarioid taxa. The diatom stratigraphy was plotted using TILIA and TILIAGRAPH software [65].

3.6. Statistical Analyses

Correlations of hypoxia volumes with varve parameters and meteorological data were calculated using the software R3.4.3 [66] to identify the most significant covariates. As the volume of hypoxic water was not normally distributed, Spearman’s correlation analysis [67] was applied. In order to take decadal trends into account, 10-year moving averages were calculated from annual, seasonal, and monthly meteorological data. The diatom assemblage changes were investigated with principal component analysis (PCA) [68] using Canoco 4.5 for Windows [69]. Spearman’s correlations were calculated between the sample scores of the first (PC1) and second (PC2) principal components, the summarized diatom groups, and diatom-inferred total phosphorus (DI-TP). DI-TP was reconstructed for each diatom sample using the diatom-TP transfer function of Tammelin et al. [70] and C2 software version 1.6.8 [71] to estimate possible changes in the nutrient status of Lake Lehmilampi. The transfer function is based on central-eastern Finnish lakes and weighted averaging partial least squares regression (WA-PLS) [72]. Its jack-knifed coefficient of determination (r2jack) is 0.72, and its root mean squared error of prediction (RMSEPjack) is 0.191 log µg L−1 [70].

4. Results

4.1. Varve Characteristics

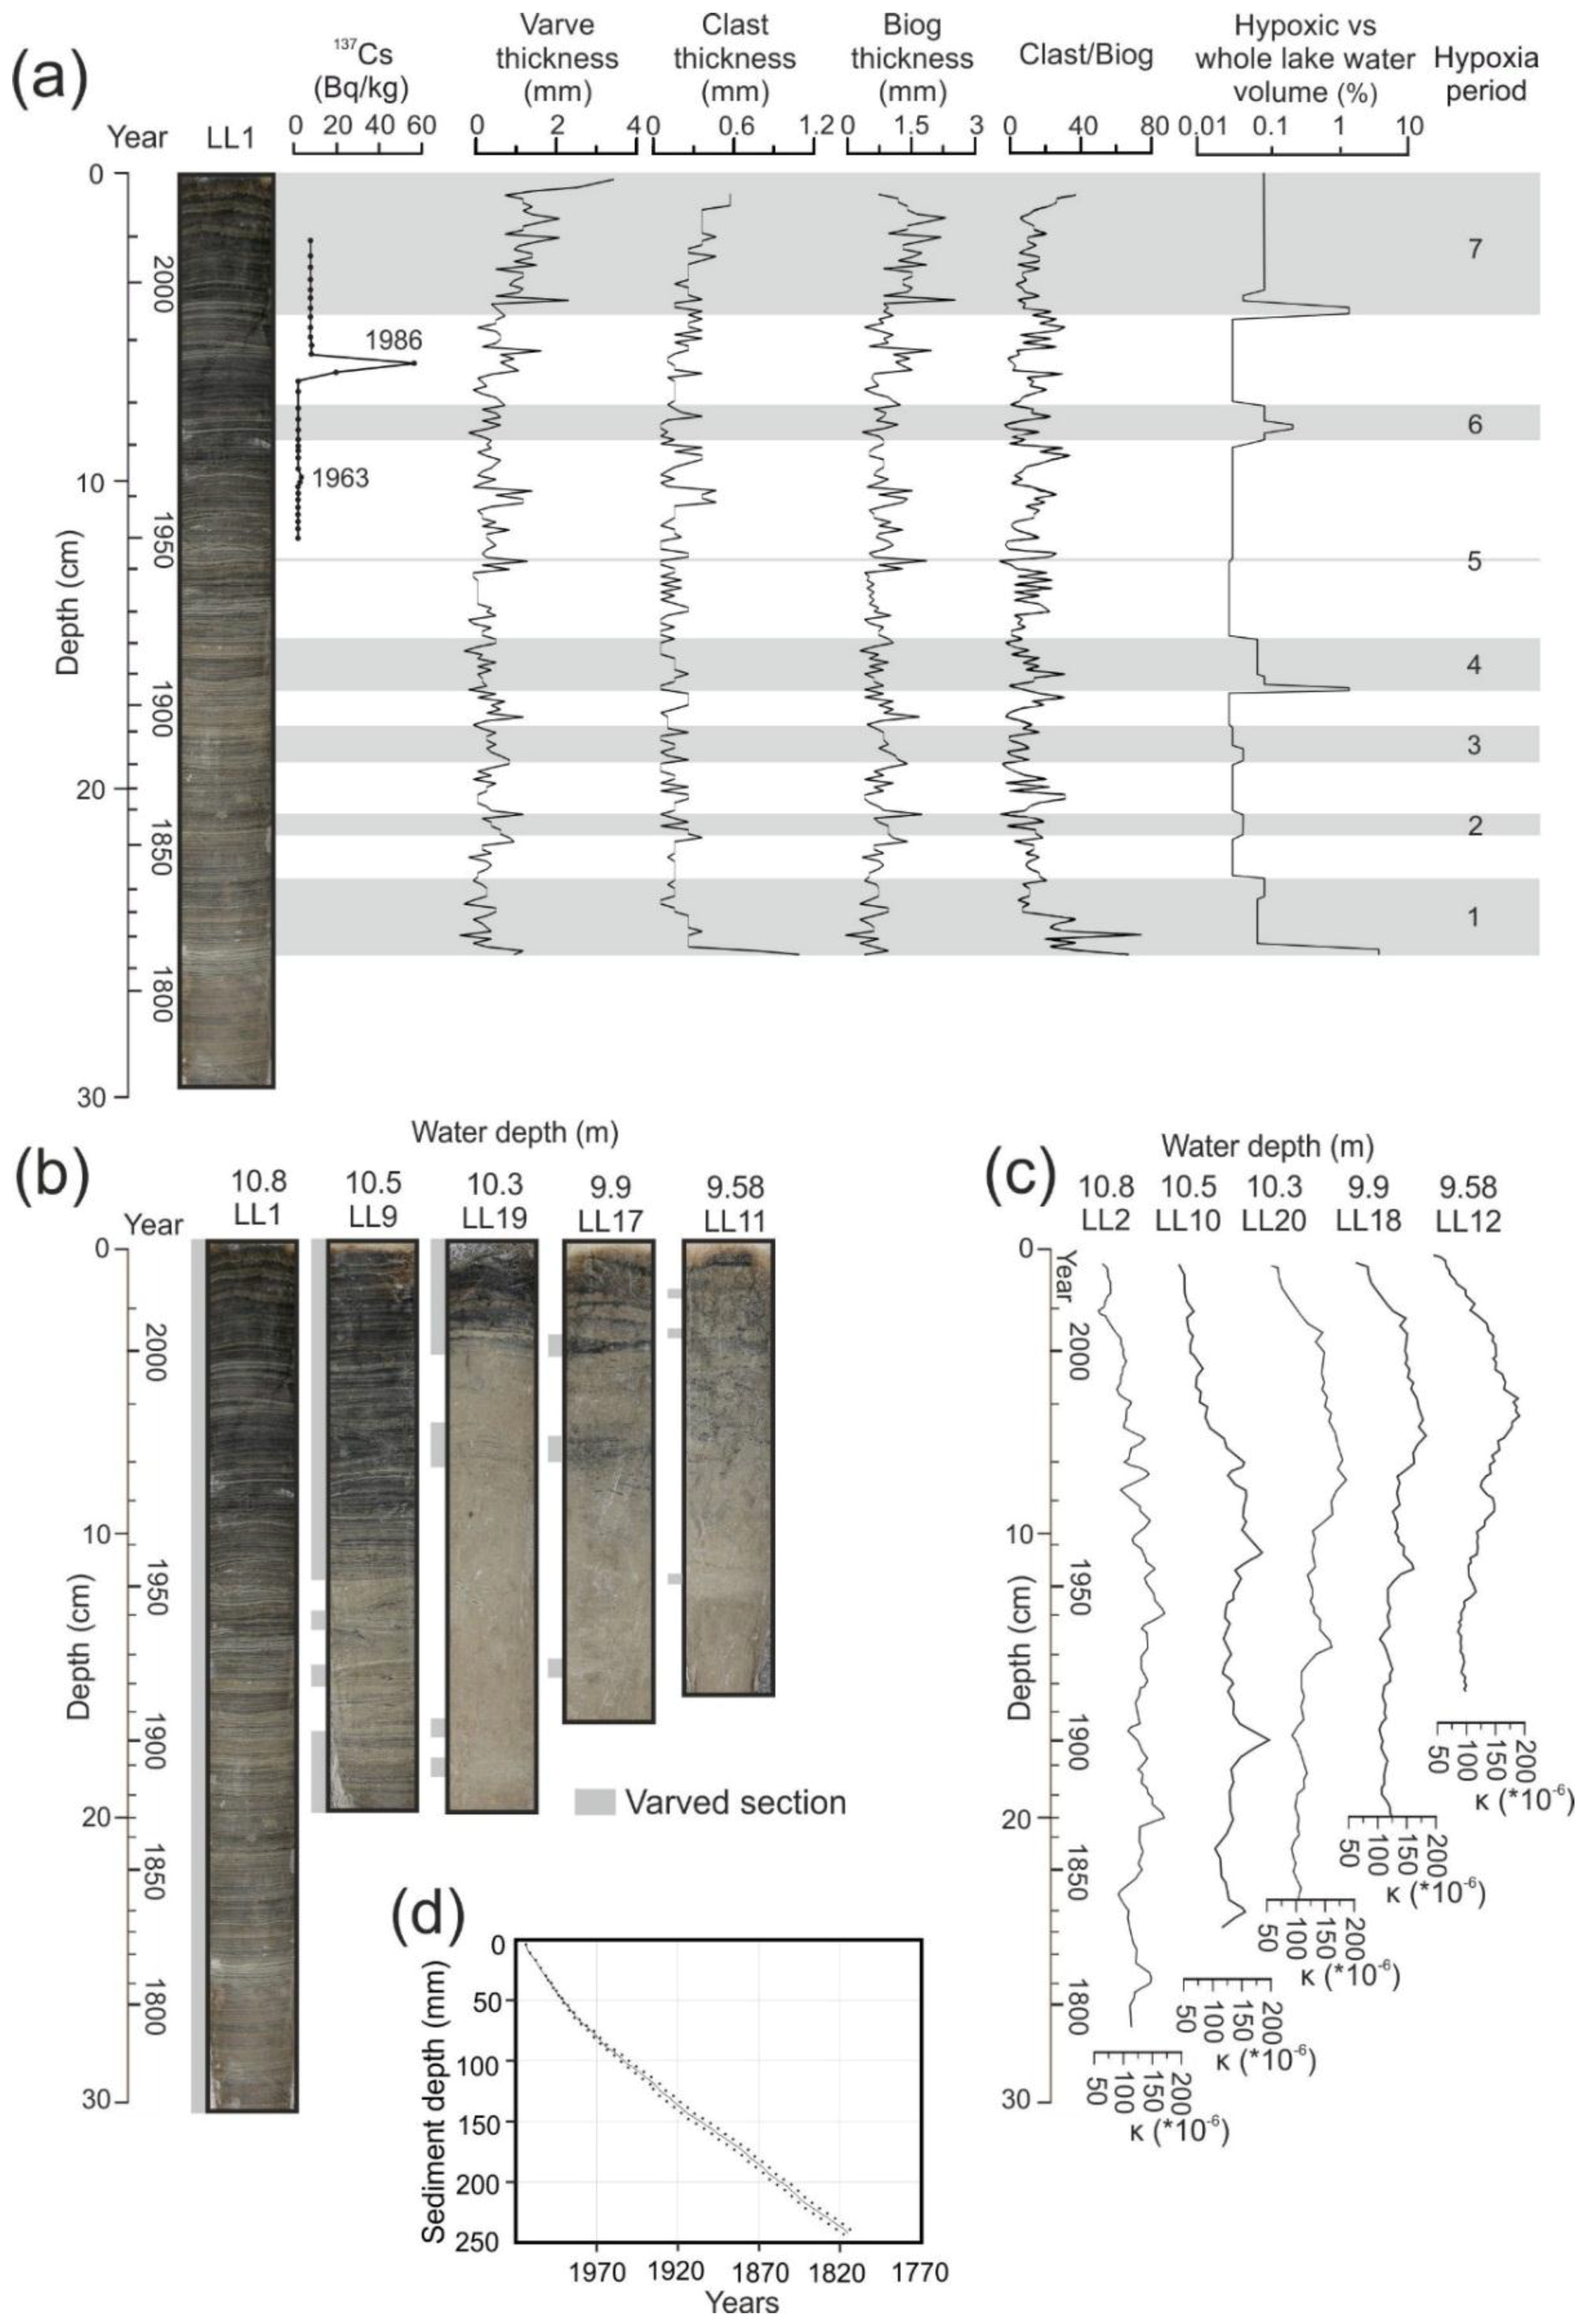
The topmost 3.2 cm sediment of core LL1, representing 15 years (1999–2014), is rather unconsolidated compared to the sediment below. Varve, biogenic lamina and clastic lamina thicknesses decreased correspondingly downcore, except for the high clastic lamina thickness at the beginning of the studied time period (Figure 5a). Clastic/biogenic lamina thickness ratio does not show a clear trend, but instead, its highest values occurred at both ends of the observed time period. The average sedimentation rate is 1.21 mm/year (range 0.4–4.8 mm/year) at the deepest point of the northern basin and decreases along the transects towards shallower depths. At a water depth of 9.6 m, it is 0.65 mm/year in the BC transect and 0.8 mm/year in the AB transect. The varve percentages decrease in relation to water depth from 100% at the deepest point of the basin to 0% at depths shallower than 7.2 m (Table 2, Figure 5b). Furthermore, magnetic susceptibility shows comparable variations at different water depths (Figure 5c).

4.2. Dating and Core Correlation

According to the varve chronology, core LL1 from the deepest point of the northern basin represents approximately 200 years of sedimentation (Figure 5a,d). Cumulative varve counting error is ±0.5% (199 ± 1 years) (Figure 5d). Two 137Cs peaks were present in core LL1. The major Cs activity peak in Figure 5a represents the Chernobyl accident in 1986. The second, minor peak is rather weak, but possibly represents atmospheric nuclear tests in 1963. The peaks are in agreement with the varve counts of continuously varved core LL1. Therefore, we assume that its varve chronology is reliable and hypoxic conditions and varve preservation have been continuous at the deepest point of the basin during the observed period. Varve preservation in relation to water depth appeared similar in both transects, and the succession of varves and lithological marker horizons are traceable between cores allowing their correlation (Figure 4). Similarities in the magnetic susceptibility profiles of the piston cores further support our core correlation (Figure 5c).

4.3. Changes in Varve Distribution and Hypoxic Water Volume

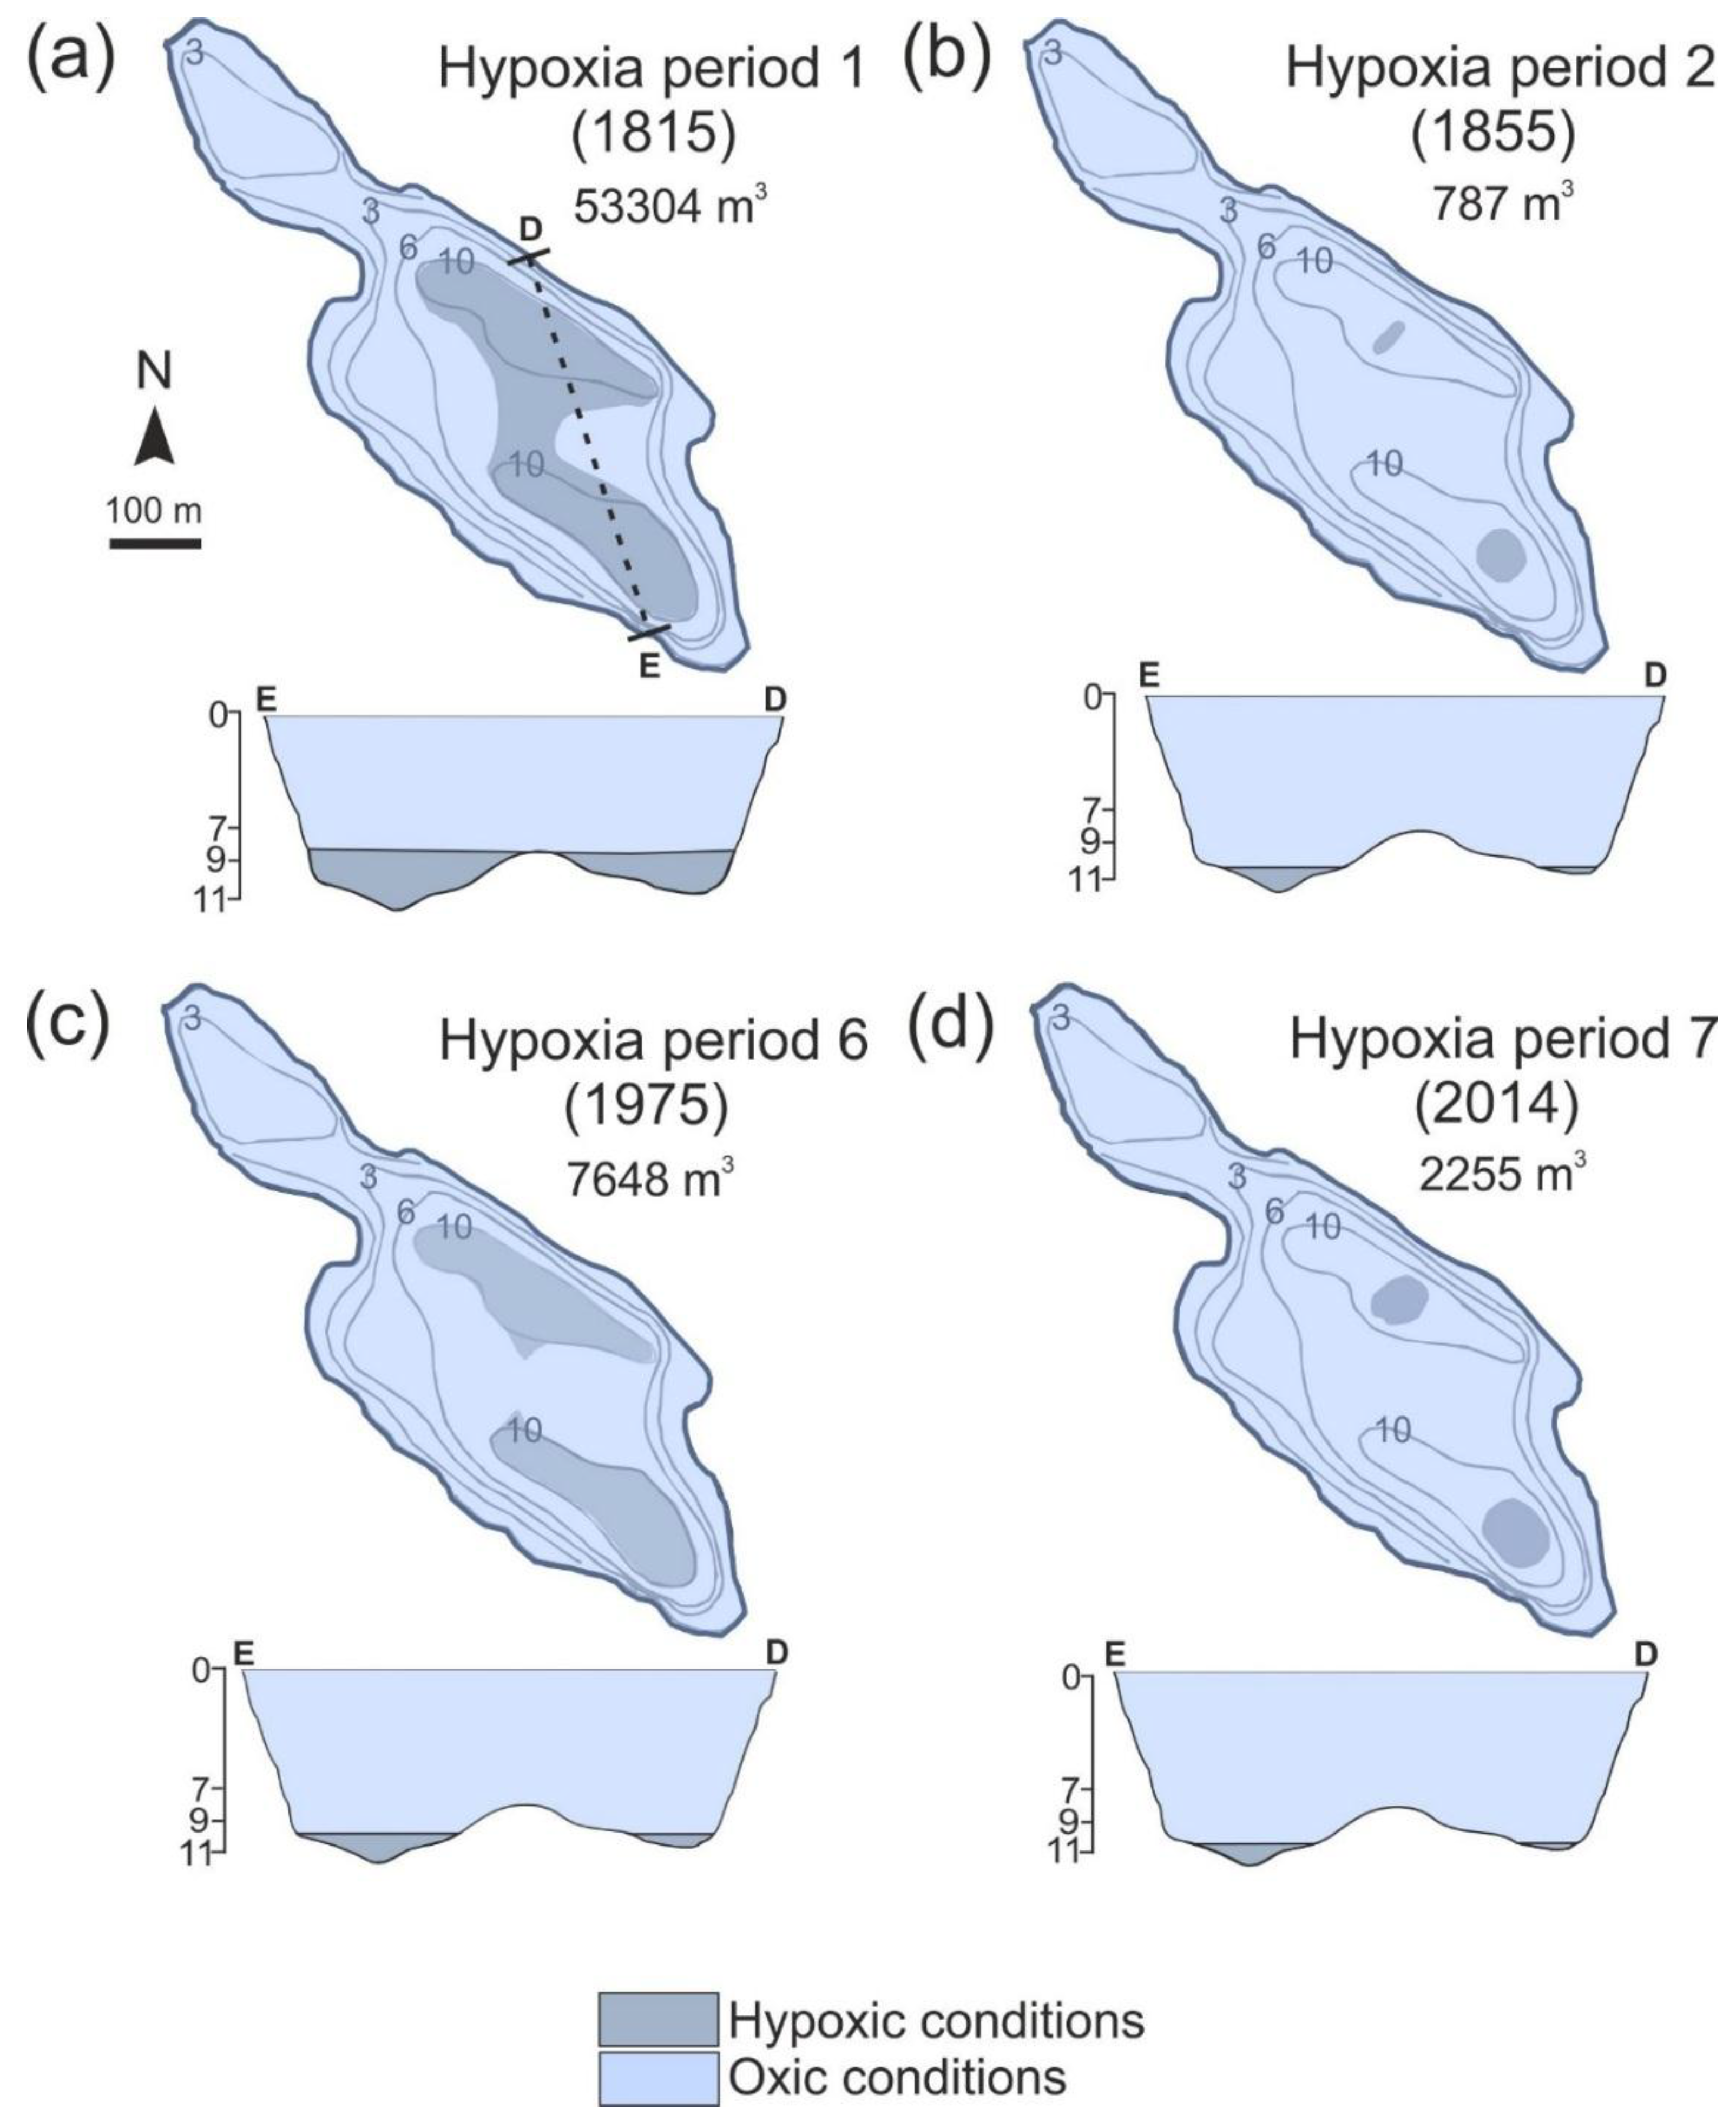
The area and volume of hypoxic waters fluctuated in Lake Lehmilampi during the past 200 years according to varve-based modeling. Years 1815, 1855, 1975, and 2014 are portrayed in Figure 6 because they represent the most and least extensive hypoxia periods displaying the variations in hypoxia. The magnitude of hypoxia volume ranged between 0.03–5.7%. The median hypoxia volume of the whole data, i.e., the cutoff value for the baseline conditions of hypoxia, was 0.046%. Consequently, seven hypoxia periods were identified from 1815–2014 (Table 3, Figure 5a, and Figure 7). These periods were rather short-lived compared to the time between them, apart from the longer hypoxia periods 1, 4, and 7 (Figure 5a). Although short-lived, the small increase in hypoxia volume during the 1940s was considered as hypoxia period 5.

4.4. Climate and Varve Thickness Correlations with Hypoxia Volume

Hypoxia volumes have statistically significant (p-value < 0.05) correlation coefficients (ρ) higher than 0.3 with six climate variables (Table 4, Figure 7). Of these six variables, winter and March temperatures correlate positively with hypoxia, whereas the correlation is negative between hypoxia and the number of days with snow cover, November temperature, as well as autumn and October precipitation. Winter temperature (ρ = 0.56, p-value < 0.01) and October precipitation (ρ = −0.56, p-value < 0.01) have highest correlation coefficients. Clastic lamina thickness and hypoxic water volume showed a weak positive correlation (ρ = 0.23, p-value < 0.01), whereas total varve thickness and biogenic lamina thickness have no statistically significant correlations with hypoxia (p-value > 0.05).

4.5. Diatom Analysis

The diatom assemblages of core LL1 changed during the past 200 years, while DI-TP remained relatively stable (Figure 8). The diatom assemblage change is characterized by an increase in the relative abundance of small cyclotelloid taxa and elongate pennate taxa and a decrease in large Aulacoseira taxa and small fragilarioid taxa towards the present day. PC1, i.e., largest variation in the diatom data, correlates negatively with large Aulacoseira taxa (ρ = −0.93, p-value < 0.01) and benthic fragilarioid taxa (ρ = −0.55, p-value = 0.04). Small cyclotelloid taxa have a positive correlation with PC1 (ρ = 0.80, p-value < 0.01). PC2, i.e., second largest variation in diatom data, correlates positively with elongate pennates (ρ = 0.66, p-value = 0.01). DI-TP does not correlate (p-value > 0.05) with PC1 or PC2.

5. Discussion

5.1. Spatiotemporal Changes in Varves and Hypolimnetic Hypoxia

The global spread of hypoxia in lakes started in the latter half of the 19th century and accelerated after the Second World War, particularly in densely populated regions [73]. Our results from the remote boreal Lake Lehmilampi, however, suggest spatiotemporal fluctuations in varve preservation and hypoxia instead of an increasing trend towards the present day (Figure 5a, Table 3). Oxygen-depleted conditions have prevailed for thousands of years in the northern basin of Lake Lehmilampi based on its continuous varve preservation [45]. The boundary between continuous and discontinuous varve preservation (and hypoxia) is located relatively close to the maximum depths of the basins at water depths of 10.60–10.75 m, whereas the boundary between discontinuous and no varve preservation lies at 6.53–7.20 m. The limited water quality data from Lake Lehmilampi (Figure 1c) suggests that hypoxia may temporarily reach even slightly shallower depths. Certain characteristics of Lake Lehmilampi, such as the strong seasonal contrasts in boreal climate, elongated and small but relatively deep basins, and higher-relief bedrock outcrops sheltering the lake from winds, are favorable for the formation and preservation of varves [19].
We identified seven hypoxia periods for Lake Lehmilampi, from which the first (1815–1842) was the longest and most intensive (Figure 6, Figure 7, Table 3). It presumably started earlier than 1815 and existed for more than 27 years. Longer sediment cores would be needed to confirm these assumptions. The onset of a hypoxia period appears to be rapid and intensive (average duration: 1.5 years), whereas the return back to baseline conditions seems less pronounced (average duration: 8.1 years). These observations are in accordance with the previously reported slow responses in hypolimnetic hypoxia to reduced external forcing [73]. Apart from highest peak values during the onset of the three longest hypoxia periods (periods 1, 4, and 7), the overall hypoxic water volume has remained relatively low and hypoxic bottom water conditions have been restricted to a small area compared to the lake surface area (Figure 5a and Figure 6, Table 3). The three most extensive peaks in hypoxic volume (3.7–5.7% of the whole lake water volume), however, are comparable to the 8% increase in hypoxic volume of Lake Bourget in the French Alps (CE 1930–1960) resulting from a complex interaction of anthropogenic and natural forcing factors [24].
Bioturbation and lake infill may have led to an underestimation of some of the hypoxia periods. The effect of lake infill increases downcore because hypoxia volume and lake volume were slightly higher when less sediment had been accumulated to the deep basins. Bioturbation, on the other hand, could disturb previously preserved varve structures [1,74]. Moreover, the prolonged return from hypoxia to baseline conditions could be a result of the gradual return of bioturbation. Abundance and distribution of lacustrine bioturbation are not yet well known and vary within as well as between lakes [75]. The penetration depth of benthic fauna depends on oxygenation, sedimentation rate, and grain size [76,77]. Shallow-burrowing animals are often the most abundant and have patchy distributions [75]. Better knowledge of lacustrine bioturbation would be beneficial for reconstructing lake histories [75], including past changes in hypolimnetic hypoxia.

5.2. Potential Forcing Factors behind Hypolimnetic Hypoxia Oscillations

Despite anthropogenic eutrophication often being the main driver of hypoxia in European lakes [24,70], it does not seem to be a major forcing factor in Lake Lehmilampi during the past 200 years, although humans were present in the vicinity of the lake already prior to our study interval [35]. Disentangling the effects of eutrophication and climate change can be difficult [78], but diatom assemblages suggest relatively stable nutrient conditions in Lake Lehmilampi and are more likely responding to climate-induced changes in the water column (Figure 8). The main variation in the diatom data of Lake Lehmilampi (PC1), characterized by a recent increase in small cyclotelloid taxa relative to large Aulacoseira taxa and small fragilarioids, is typical to lakes experiencing increased thermal stability and longer periods of thermal stratification due to anthropogenic climate warming [79]. This main variation seems unrelated to hypoxia events. Nevertheless, the relative abundance of elongate pennates increases particularly during hypoxia events 1, 6, and 7, which could be a response to multiple stressors, such as climate warming, eutrophication, or increasing dissolved organic matter [79,80]. Aulacoseira subarctica (Müller) Haworth, a taxon favoring moderately nutrient-enriched and sufficiently turbulent lakes [81], also appears to be more abundant during hypoxia periods 1, 2, and 3. Aulacoseira islandica (Müller) Simonsen, on the contrary, does not show a similar resemblance with the hypoxia periods, although its autecological preferences are similar to A. subarctica [82].
Strong and unambiguous relationships between hypoxia volume and varve, clastic lamina, or biogenic lamina thicknesses were not found in Lake Lehmilampi. For instance, hypoxia period 1 coincided with increased clastic lamina thickness, and hypoxia period 7 had a simultaneous increase in biogenic lamina thickness, whereas hypoxia period 4 did not seem to be clearly related to increases in varve or lamina thicknesses at all. The positive correlation between clastic lamina thickness and hypoxia volume implies that hypoxia could be associated with catchment erosion, as erosion typically influences clastic lamina accumulation via spring floods [83,84,85]. Nevertheless, the correlation is weak, suggesting partially different or more complex interactions between the forcing factors behind hypoxia and varve/lamina thicknesses. Augustsson et al. [35] linked the highest erosion intensities of Lake Lehmilampi to periods of local fire and human impact. Haltia-Hovi et al. [37] found cyclic variation in varve thickness and composition of Lake Lehmilampi during the last 2000 years and interpreted it as reflecting changes in climate, likely driven by solar forcing.
The climate seems to be an important driver of changes in Lake Lehmilampi during the last 200 years despite human influence, because the recent diatom assemblage change is likely related to a warming climate, and several statistically significant correlations were found between climate variables and hypoxia volume (Table 4). These correlations reflect relationships between yearly, seasonal, and monthly variations and do not take into account single extreme events or possible time lags between climate forcing and responses in hypolimnetic hypoxia. Nevertheless, increased hypoxia volumes seem to coincide at least with milder winters and drier Octobers (Table 4). Climate controls the alternating stratification and overturn periods in boreal lakes [86], which also affect oxygen availability. Therefore, it is not unexpected to find correlations between climate variables and hypoxia volumes. Dry Octobers could reduce the intensity of autumn overturn via diminished runoff of oxygen-rich water into the lake. However, the positive correlation between hypoxia volume and winter temperature is interesting and unexpected, because cold winters typically extend ice cover, which weakens circulation in the lake through thermal stratification and reduces oxygen availability in bottom waters [16]. The mechanisms beyond these correlations cannot be explained using our data and remain as topics for further investigations.
Water level monitoring data is not available for the small and remote Lake Lehmilampi. Thus, its effect on hypolimnetic hypoxia oscillations could not be estimated and leaves the following discussion on a speculative level. Over a century-long water level monitoring data of the notably larger Lake Pielinen (into which Lake Lehmilampi flows through Lake Roukkajanjärvi and the River Ylikylänjoki) shows seasonal changes in water level but not a long-term trend (Figure 1d). The water level of Lake Lehmilampi could be sensitive to changes in precipitation because the lake is large in relation to its catchment area [87]. In humid climates, a decrease in precipitation is more likely to influence lake levels than an increase in precipitation because the latter leads to increased outflow compensating increased runoff [88]. Lake Lehmilampi is a headwater lake, so it is not influenced by upstream lakes or rivers. Groundwater flow is probably negligible because aquifers in Finland are commonly located in areas of coarse-grained sandy and gravelly deposits [86], which do not occur in the catchment of Lake Lehmilampi [41,54].
Understanding fully the variations in varve distribution and hypolimnetic hypoxia oscillations requires evaluation of several natural and anthropogenic factors for pre-anthropogenic and anthropogenic time periods. Lake Lehmilampi provides an excellent varve record spanning thousands of years, but monitoring data is unfortunately limited, typical for small and remote boreal lakes. Detailed future studies between relationships of lake level variations and hypoxia volumes with distribution and intensity of bioturbation in boreal lakes would greatly improve our understanding of hypolimnetic hypoxia oscillations. Also extending hypoxia volume modeling all the way back to the isolation of Lake Lehmilampi or other varved boreal lakes would give interesting information on the long-term natural and anthropogenic changes in hypolimnetic hypoxia.

6. Conclusions

Our study of 34 sediment cores along two transects in varved, boreal Lake Lehmilampi shows spatiotemporal variations in varve preservation during the past 200 years. As varve preservation is closely linked with oxygen-depleted conditions in the bottom waters, we use spatiotemporal variations in varve preservation as a proxy for hypolimnetic hypoxia oscillations. Seven hypoxia periods, exceeding the low baseline value for hypoxic water volume in Lake Lehmilampi, were established based on changes in varve distribution. This hypoxia modeling was based on the assumption of relatively constant lake water volume during the past 200 years, and the influence of potential lake level changes, bioturbation, and lake infill are discussed on a speculative level. Examination of possible environmental drivers behind these hypoxia periods suggested that hypolimnetic hypoxia oscillations in Lake Lehmilampi are more likely related to climatic than anthropogenic forcing. Diatom assemblage changes indicate relatively stable nutrient conditions and several climate variables correlate with hypolimnetic hypoxia during the past 200 years. These climate variables could have influenced hypolimnetic hypoxia, for instance, through changes in the intensity of catchment erosion and water mixing during overturns. Understanding the role of individual forcing factors and their complex interaction with varve preservation and long-term hypolimnetic hypoxia oscillations would benefit from further investigations.

Author Contributions

Conceptualization, S.S. (Sarianna Salminen) and S.S. (Saija Saarni); Methodology, S.S. (Sarianna Salminen) and M.T.; Software, S.S. (Sarianna Salminen), M.T.; Validation, S.S. (Sarianna Salminen); Formal Analysis, S.S. (Sarianna Salminen), M.T. and Y.F.; Investigation, S.S. (Sarianna Salminen); Resources, T.S.; Data Curation, S.S. (Sarianna Salminen); Writing—Original Draft Preparation, S.S. (Sarianna Salminen); Writing—Review & Editing, S.S. (Saija Saarni), M.T., T.S., and Y.F.; Visualization, S.S. (Sarianna Salminen); Supervision, T.S.; Project Administration, S.S. (Sarianna Salminen); Funding Acquisition, S.S. (Sarianna Salminen), T.S.

Funding

This study was funded by Maa- ja vesitekniikan tuki ry. and The Academy of Finland (269834).

Acknowledgments

We thank H. Wenho, A. Peltola, and K. Kashima for technical support in the field, M. Kalliokoski for the assistance in GIS analyses, and J. Manninen for thin section preparation. We thank E. Haltia, anonymous reviewers, and the Guest Editor for valuable comments on the manuscript.

Conflicts of Interest

The authors declare no conflict of interest. The sponsors had no role in the design, execution, interpretation, or writing of the study.

References

  1. Diaz, R.J. Overview of hypoxia around the world. J. Environ. Qual. 2001, 30, 275–281. [Google Scholar] [CrossRef]
  2. Baulch, H.M.; Schindler, D.W.; Turner, M.A.; Findlay, D.L.; Paterson, M.J.; Vinebrook, R.D. Effects of warming on benthic communities in a boreal lake: Implications of climate change. Limnol. Oceanogr. 2005, 50, 1377–1392. [Google Scholar] [CrossRef]
  3. Koutsodendris, A.; Brauer, A.; Zacharias, I.; Putyrskaya, V.; Klemt, E.; Sangiorgi, F.; Pross, J. Ecosystem response to human-and climate-induced environmental stress on an anoxic coastal lagoon (Etoliko, Greece) since 1930 AD. J. Paleolimnol. 2015, 53, 255–270. [Google Scholar] [CrossRef]
  4. Wilson, M.A.; Carpenter, R. Economic valuation of freshwater ecosystem services in The United States: 1971–1997. Ecol. Appl. 1999, 9, 772–783. [Google Scholar]
  5. Schindler, D.W. Evolution in Phosphorus Limitation in Lakes. Science 1977, 195, 260–262. [Google Scholar] [CrossRef]
  6. Müller, B.; Bryant, L.D.; Matzinger, A.; Wüest, A. Hypolimnetic oxygen depletion in eutrophic lakes. Environ. Sci. Technol. 2012, 46, 9964–9971. [Google Scholar] [CrossRef] [PubMed]
  7. Friedrich, J.; Janssen, F.; Aleynik, D.; Bange, H.W.; Boltacheva, N.; Çagatay, M.N.; Dale, A.W.; Etiope, G.; Erdem, Z.; Geraga, M.; et al. Investigating hypoxia in aquatic environments: Diverse approaches to addressing a complex phenomenon. Biogeosciences 2014, 11, 1215–1259. [Google Scholar] [CrossRef]
  8. Carpenter, S.R. Eutrophication of aquatic ecosystems: Bistability and soil phosphorus. Proc. Natl. Acad. Sci. USA 2005, 102, 10002–10005. [Google Scholar] [CrossRef] [PubMed] [Green Version]
  9. Deutsch, C.; Brix, H.; Ito, T.; Frenzel, H.; Thompson, L. Climate-Forced Variability of Ocean Hypoxia. Science 2011, 333, 336. [Google Scholar] [CrossRef]
  10. Livingstone, D.M. Impact of secular climate change on the thermal structure of a large temperate central European lake. Clim. Chang. 2003, 57, 205–225. [Google Scholar] [CrossRef]
  11. Last, W.M.; Smol, J.P. An introduction to physical and geochemical methods used in paleolimnology. In Tracking Environmental Change Using Lake Sediments. Vol. 1, Basin Analysis, Coring, and Chronological Techniques; Last, W.M., Smol, J.P., Eds.; Kluwer Academic Publishers: Dordrecht, The Netherlands, 2001; pp. 1–5. [Google Scholar]
  12. Zolitschka, B.; Francus, P.; Ojala, A.E.; Schimmelmann, A. Varves in lake sediments—A review. Quat. Sci. Rev. 2015, 117, 1–41. [Google Scholar] [CrossRef]
  13. Zolitschka, B.; Enters, D. Lacustrine sediments. In Encyclopedia of Paleoclimatology and Ancient Environments; Gornitz, V., Ed.; Springer: Dordrecht, The Netherlands, 2009; pp. 485–488. [Google Scholar]
  14. Ohlendorf, C.; Sturm, M.; Hausmann, S. Natural environmental changes and human impact reflected in sediments of a high alpine lake in Switzerland. J. Paleolimnol. 2003, 30, 297–306. [Google Scholar] [CrossRef]
  15. Tyllmann, W. Lithological and geochemical record of anthropogenic changes in recent sediments of a small and shallow lake (Lake Pusty Staw, northern Poland). J. Paleolimnol. 2005, 33, 313–325. [Google Scholar] [CrossRef]
  16. O’sullivan, P.E. Annually-laminated lake sediments and the study of Quaternary environmental changes—A review. Quat. Sci. Rev. 1983, 1, 245–313. [Google Scholar] [CrossRef]
  17. Giguet-Covex, C.; Arnaud, F.; Poulenard, J.; Enters, D.; Reyss, J.L.; Millet, L.; Lazzaroto, J.; Vidal, O. Sedimentological and geochemical records of past trophic state and hypolimnetic anoxia in large, hard-water Lake Bourget, French Alps. J. Paleolimnol. 2010, 43, 171–190. [Google Scholar] [CrossRef]
  18. Jenny, J.P.; Arnaud, F.; Dorioz, J.M.; Giguet Covex, C.; Frossard, V.; Sabatier, P.; Millet, L.; Reyss, J.L.; Tachikawa, K.; Bard, E.; et al. A spatiotemporal investigation of varved sediments highlights the dynamics of hypolimnetic hypoxia in a large hard-water lake over the last 150 years. Limnol. Oceanogr. 2013, 58, 1395–1408. [Google Scholar] [CrossRef]
  19. Ojala, A.E.K.; Francus, P.; Zolitschka, B.; Besonen, M.; Lamoureux, S.F. Characteristics of sedimentary varve chronologies—A review. Quat. Sci. Rev. 2012, 43, 45–60. [Google Scholar] [CrossRef]
  20. Tylmann, W.; Zolitschka, B.; Enters, D.; Ohlendorf, C. Laminated lake sediments in northeast Poland: Distribution, preconditions for formation and potential for paleoenvironmental investigation. J. Paleolimnol. 2013, 50, 487–503. [Google Scholar] [CrossRef]
  21. Ojala, A.E.; Saarinen, T.; Salonen, V.P. Preconditions for the formation of annually laminated lake sediments in southern and central Finland. Boreal Environ. Res. 2000, 5, 243–255. [Google Scholar]
  22. Roberts, J.J.; Höök, T.O.; Ludsin, S.A.; Pothoven, S.A.; Vanderploeg, H.A.; Brandt, S.B. Effects of hypolimnetic hypoxia on foraging and distributions of Lake Erie yellow perch. J. Exp. Mar. Biol. Ecol. 2009, 381, 132–142. [Google Scholar] [CrossRef]
  23. Saarnisto, M. Annually laminated lake sediments. In Handbook of Holocene Palaeoecology and Palaeohydrology; Berglund, B.E., Ed.; John Wiley & Sons Ltd.: New Jersey, USA, 1986; pp. 343–370. [Google Scholar]
  24. Jenny, J.P.; Normandeau, A.; Francus, P.; Taranu, Z.E.; Gregory-Eaves, I.; Lapointe, F.; Jautzy, J.; Ojala, A.E.K.; Dorioz, J.M.; Schimmelmann, A.; et al. Urban point sources of nutrients were the leading cause for the historical spread of hypoxia across European lakes. Proc. Natl. Acad. Sci. USA 2016, 113, 12655–12660. [Google Scholar] [CrossRef] [Green Version]
  25. Kienel, U.; Dulski, P.; Ott, F.; Lorenz, S.; Brauer, A. Recently induced anoxia leading to the preservation of seasonal laminae in two NE-German lakes. J. Paleolimnol. 2013, 50, 535–544. [Google Scholar] [CrossRef]
  26. Korhonen, J. Suomen Vesistöjen Jääolot. Finnish Environment, 751; Finnish Environment Institute Reports; Finnish Environment Institute: Helsinki, Finland, 2005; (In Finnish, Summary “Ice Conditions in Lakes and Rivers in Finland” in English); Available online: https://helda.helsinki.fi/handle/10138/40687 (accessed on 3 March 2019).
  27. Korhonen, J. Long-term changes in lake ice cover in Finland. Nord. Hydrol. 2006, 37, 347–363. [Google Scholar] [CrossRef]
  28. Hertta Database. Available online: https://www.syke.fi/en-US/Open_information (accessed on 15 March 2016).
  29. Korhonen, J. Suomen Vesistöjen Virtaaman ja Vedenkorkeuden Vaihtelut. Finnish Environment 45; Finnish Environment Institute Reports; Finnish Environment Institute: Helsinki, Finland, 2007; Finnish Environment Institute Reports; (In Finnish, Summary “Discharge and water level variations in lakes and rivers in Finland” in English); Available online: https://helda.helsinki.fi/handle/10138/38428 (accessed on 3 March 2019).
  30. Pirinen, P.; Simola, H.; Aalto, J.; Kaukoranta, J.P.; Karlsson, P.; Ruuhela, R. Tilastoja Suomen Ilmastosta 1981–2010; Finnish Environment Institute Reports; Finnish Environment Institute: Helsinki, Finland, 2012; Available online: https://helda.helsinki.fi/handle/10138/35880 (accessed on 7 March 2019).
  31. Finnish Meteorological Institute. Weather Data Download Service. Available online: https://en.ilmatieteenlaitos.fi/download-observations#!/ (accessed on 1 April 2019).
  32. Soininen, A. The Colonization of Northern Savo in the 15th and 16th Centuries. In Historiallisia Tutkimuksia LVIII. Suomen Historiallinen Seura; Finnish Environment Institute: Helsinki, Finland, 1961; (In Finnish, summary in English); Available online: https://www.sgr.fi/sust/sust265/sust265_korpela.pdf (accessed on 12 August 2018).
  33. Korpela, J. Migratory Lapps and the population explosion of Eastern Finns: The early colonization of Eastern Finland reconsidered. In Proceedings of the Networks, Interaction and Emerging Identities in Fennoscandia and Beyond, Finno-Ugrian Society Conference, Tromsø, Norway, 13–16 October 2009. [Google Scholar]
  34. Taavitsainen, J.P.; Simola, H.; Grönlund, E. Cultivation history beyond the periphery: Early agriculture in the North European boreal forest. J. World Prehist. 1998, 12, 199–253. [Google Scholar] [CrossRef]
  35. Augustsson, A.; Gaillard, M.J.; Peltola, P.; Mazier, F.; Bergbäck, B.; Saarinen, T. Effects of land use and climate change on erosion intensity and sediment geochemistry at Lake Lehmilampi, Finland. Holocene 2013, 23, 1247–1259. [Google Scholar] [CrossRef] [Green Version]
  36. Soininen, A. Old Traditional Agriculture in Finland in the 18th and 19th Centuries. In Historiallisia Tutkimuksia 96. Suomen Historiallinen Seura; Finnish Environment Institute: Helsinki, Finland, 1974; (In Finnish, summary in English); Available online: http://www.doria.fi/handle/10024/167610 (accessed on 24 May 2019).
  37. Simola, H.; Arvola, L. Lakes of Northern Europe. In The Lakes Handbook Volume 2: Lake Restoration and Rehabilitation; O’Sullivan, P.E., Reynolds, C.S., Eds.; Blackwell Publishing Ltd.: Oxford, UK, 2005; pp. 117–158. [Google Scholar]
  38. Turunen, J. Development of Finnish peatland area and carbon storage 1950–2000. Boreal Environ. Res. 2008, 13, 319–334. [Google Scholar]
  39. Maankamara e DigiKP. Digital Map Database. Available online: http://gtkdata.gtk.fi/maankamara/ (accessed on 16 April 2017).
  40. Haltia-Hovi, E.; Saarinen, T.; Kukkonen, M. A 2000-year record of solar forcing on varved lake sediment in eastern Finland. Quat. Sci. Rev. 2007, 26, 678–689. [Google Scholar] [CrossRef]
  41. Meyers, P.A.; Lallier-Vergès, E. Lacustrine sedimentary organic matter records of Late Quaternary paleoclimates. J. Paleolimnol. 1999, 21, 345–372. [Google Scholar] [CrossRef]
  42. den Heyer, C.; Kalff, J. Organic matter mineralization rates in sediments: A within—And among-lake study. Limnol. Oceanogr. 1998, 43, 695–705. [Google Scholar] [CrossRef]
  43. Hedges, J.I.; Hu, F.S.; Devol, A.H.; Hartnett, H.E.; Tsamakis, E.; Keil, R.G. Sedimentary organic matter preservation; a test for selective degradation under oxic conditions. Am. J. Sci. 1999, 299, 529–555. [Google Scholar] [CrossRef]
  44. Sobek, S.; Durisch-Kaiser, E.; Zurbrügg, R.; Wongfun, N.; Wessels, M.; Pasche, N.; Wehrli, B. Organic carbon burial efficiency in lake sediments controlled by oxygen exposure time and sediment source. Limnol. Oceanogr. 2009, 54, 2243–2254. [Google Scholar] [CrossRef] [Green Version]
  45. Haltia-Hovi, E.; Nowaczyk, N.; Saarinen, T.; Plessen, B. Magnetic properties and environmental changes recorded in Lake Lehmilampi (Finland) during the Holocene. J. Paleolimnol. 2010, 43, 1–13. [Google Scholar] [CrossRef]
  46. Renberg, I.; Hansson, H. The HTH sediment corer. J. Paleolimnol. 2008, 40, 655–659. [Google Scholar] [CrossRef]
  47. Renberg, I. Improved methods for sampling, photographing and varve-counting of varved lake sediments. Boreas 1981, 10, 255–258. [Google Scholar] [CrossRef]
  48. Saarinen, T.; Wenho, H. Minijääsormi sekä muita uusia ja vanhoja ideoita järvisedimentin talvikairaukseen. In Proceedings of the Congress Abstract Book, Geologian Tutkijapäivät, Turku, Finland, 14–15 March 2005; pp. 72–73. [Google Scholar]
  49. Lamoureux, S.F. Embedding unfrozen lake sediments for thin section preparation. J. Paleolimnol. 1994, 10, 141–146. [Google Scholar] [CrossRef]
  50. Tiljander, M.; Ojala, A.; Saarinen, T.; Snowball, I. Documentation of the physical properties of annually laminated (varved) sediments at a sub-annual to decadal resolution for environmental interpretation. Quat. Int. 2002, 88, 5–12. [Google Scholar] [CrossRef]
  51. Finnish Environment Institute 2014. Downloadable Spatial Datasets. Catchment Areas. Available online: https://www.syke.fi/en-US/Open_information/Spatial_datasets (accessed on 21 March 2019).
  52. National Land Survey of Finland 2017. Topographic Database. Available online: https://tiedostopalvelu.maanmittauslaitos.fi/tp/kartta?lang=en. (accessed on 21 March 2019).
  53. Finnish Environment Institute 2018. Corine Land Cover. Available online: https://www.syke.fi/en-US/Open_information/Spatial_datasets. (accessed on 21 March 2019).
  54. Geological Survey of Finland 2015. Superficial Deposits. Available online: https: //hakku.gtk.fi/en/locations/search. (accessed on 4 December 2018).
  55. National Land Survey of Finland. Paituli Spatial Data Download Service. Available online: www.csc.fi/paituli (accessed on 14 March 2016).
  56. NORDKLIM Dataset (NKDS) v2 2015. Available online: http://blog.fmi.fi/nordmet/node/214 (accessed on 15 January 2017).
  57. Battarbee, R.W.; Jones, V.J.; Flower, R.J.; Cameron, N.G.; Bennion, H.; Carvalho, L.; Juggins, S. Diatoms. In Tracking Environmental Change Using Lake Sediments; Smol, J.P., Birks, H.J.B., Last, W.M., Eds.; Kluwer Academic Publishers: Dordrecht, The Netherlands, 2001; Volume 3, pp. 155–202. [Google Scholar]
  58. Krammer, K.; Lange-Bertalot, H. Bacillariophyceae, Teil: Naviculaceae. In Süsswasserflora von Mitteleuropa; Ettle, H., Gerloff, J., Heynig, H., Mollenhauer, D., Eds.; Fischer: New York, NY, USA, 1986; Band 2/1. [Google Scholar]
  59. Krammer, K.; Lange-Bertalot, H. Bacillariophyceae, Teil: Bacillariaceae, Epithemiaceae, Surirellaceae. In Süsswasserflora von Mitteleuropa; Ettle, H., Gerloff, J., Heynig, H., Mollenhauer, D., Eds.; Fischer: Stuttgart, Germany; New York, NY, USA, 1988; Band 2/2. [Google Scholar]
  60. Krammer, K.; Lange-Bertalot, H. Bacillariophyceae, Teil: Centrales, Fragilariaceae, Eunotiaceae. In Süsswasserflora von Mitteleuropa; Ettle, H., Gerloff, J., Heynig, H., Mollenhauer, D., Eds.; Fisher: Stuttgart, Germany; Jena, Germany, 1991; Band 2/3. [Google Scholar]
  61. Krammer, K.; Lange-Bertalot, H. Bacillariophyceae, Teil: Achnanthaceae. In Süsswasserflora von Mitteleuropa; Ettle, H., Gartner, G., Gerloff, J., Heynig, H., Mollenhauer, D., Eds.; Fisher: Stuttgart, Germany; Jena, Germany, 1991; Band 2/4. [Google Scholar]
  62. Porter, S.P. Algal Attributes: An Autecological Classification of Algal Taxa Collected by the National Water-Quality Assessment Program. In US Geological Survey Data Series 329; U.S. Geological Survey: Reston, VA, USA, 2008. [Google Scholar]
  63. Spaulding, S.A.; Lubinski, D.J.; Potapova, M. Diatoms of the United States. 2008. Available online: http://westerndiatoms.colorado.edu. (accessed on 16 October 2018).
  64. Guiry, M.D.; Guiry, G.M.; AlgaeBase. World-Wide Electronic Publication, National University of Ireland, Galway. 2018. Available online: http://www.algaebase.org (accessed on 24 October 2018).
  65. Grimm, E. TILIA and TILIAGRAPH Pollen Diagramming Program; Illinois State Museum: Springfield, IL, USA, 1991. [Google Scholar]
  66. R Development Core Team. R: A Language and Environment for Statistical Computing; R Foundation for Statistical Computing: Vienna, Austria, 2016. [Google Scholar]
  67. Spearman, C. The proof and measurement of association between two things. Am. J. Psychol. 1904, 15, 72–101. [Google Scholar] [CrossRef]
  68. Pearson, K. On lines and planes of closest fit to systems of points in space. Philos. Mag. 1901, 2, 559–572. [Google Scholar] [CrossRef]
  69. Ter Braak, C.J.F.; Šmilauer, P. CANOCO Reference Manual and Cano Draw for Windows User’s Guide: Software for Canonical Community Ordination; Version 4.5; Microcomputer Power: Ithaca, NY, USA, 2002. [Google Scholar]
  70. Tammelin, M.; Kauppila, T.; Viitasalo, M. Factors controlling recent diatom assemblages across a steep local nutrient gradient in central-eastern Finland. Hydrobiologia 2017, 799, 309–325. [Google Scholar] [CrossRef]
  71. Juggins, S. C2 Version 1.5 User Guide, Software for Ecological and Palaeoecological Data Analysis and Visualization; University of Newcastle: Newcastle Upon Tyne, UK, 2007. [Google Scholar]
  72. Ter Braak, C.J.F.; Juggins, S. Weighted averaging partial least squares regression (WA-PLS): An improved method for reconstructing environmental variables from species assemblages. Hydrobiologia 1993, 269, 485–502. [Google Scholar] [CrossRef]
  73. Jenny, J.P.; Francus, P.; Normandeau, A.; Lapointe, F.; Perga, M.E.; Ojala, A.; Schimmelmann, A.; Zolitschka, B. Global spread of hypoxia in freshwater ecosystems during the last three centuries is caused by rising local human pressure. Glob. Chan. Biol. 2016, 22, 1481–1489. [Google Scholar] [CrossRef]
  74. Xie, M.; Wang, N.; Gaillard, J.F.; Packman, A.I. Interplay between flow and bioturbation enhances metal efflux from low-permeability sediments. J. Hazard. Mater. 2018, 341, 304–312. [Google Scholar] [CrossRef] [PubMed]
  75. White, D.S.; Miller, M.F. Benthic invertebrate activity in lakes: Linking present and historical bioturbation patterns. Aquat. Biol. 2008, 2, 269–277. [Google Scholar] [CrossRef]
  76. Savrda, C.E. Taphonomy of trace fossils. In Trace Fossils: Concepts, Problems, Prospects; Miller, W., III, Ed.; Elsevier: Oxford, UK, 2007; pp. 92–109. [Google Scholar]
  77. Wetzel, A. Ecologic interpretation of deep-sea trace fossil communities. Palaeogeogr. Palaeoclimatol. Palaeoecol. 1991, 85, 47–69. [Google Scholar] [CrossRef]
  78. Davidson, T.A.; Jeppesen, E. The role of palaeolimnology in assessing eutrophication and its impact on lakes. J. Paleolimnol. 2013, 49, 391–410. [Google Scholar] [CrossRef]
  79. Rühland, K.M.; Paterson, A.M.; Smol, J.P. Lake diatom responses to warming: Reviewing the evidence. J. Paleolimnol. 2015, 54, 1–35. [Google Scholar] [CrossRef]
  80. Kissman, C.E.H.; Williamson, C.E.; Rose, K.C.; Saros, J.E. Response of phytoplankton in an alpine lake to inputs of dissolved organic matter through nutrient enrichment and trophic forcing. Limnol. Oceanogr. 2013, 58, 867–880. [Google Scholar] [CrossRef] [Green Version]
  81. Gibson, C.E.; Anderson, N.J.; Haworth, E. Aulacoseira subarctica: Taxonomy, physiology, ecology and palaeoecology. Eur. J. Phycol. 2003, 38, 83–101. [Google Scholar] [CrossRef]
  82. Stoermer, E.F.; Kreis, R.G., Jr.; Sicko-Goad, L. A Systematic, Quantitative, and Ecological Comparison of Melosira Islandica, O. Müll. with M. Granulata (EHR.) Ralfs from the Laurentian Great Lakes. J. Great Lakes Res. 1981, 7, 345–356. [Google Scholar] [CrossRef]
  83. Ojala, A.E.; Alenius, T. 10 000 years of interannual sedimentation recorded in the Lake Nautajärvi (Finland) clastic–organic varves. Palaeogeogr. Palaeoclimatol. Palaeoecol. 2005, 219, 285–302. [Google Scholar] [CrossRef]
  84. Ojala, A.E.K.; Kosonen, E.; Weckström, J.; Korkonen, S.; Korhola, A. Seasonal formation of clastic-biogenic varves: The potential for palaeoenvironmental interpretations. GFF 2013, 135, 237–247. [Google Scholar] [CrossRef]
  85. Saarni, S.; Lensu, A.; Tammelin, M.; Haltia, E.; Saarinen, T. Winter climate signal in boreal clastic-biogenic varves: A comprehensive analysis of three varved records from 1890 to 1990 AD with meteorological and hydrological data from Eastern Finland. GFF 2017, 139, 314–326. [Google Scholar] [CrossRef]
  86. Boehrer, B.; Schultze, M. Stratification of lakes. Rev. Geophys. 2008, 46. [Google Scholar] [CrossRef] [Green Version]
  87. Vassiljev, J. The simulated response of lakes to changes in annual and seasonal precipitation: Implication for Holocene lake-level changes in northern Europe. Clim. Dyn. 1998, 14, 791–801. [Google Scholar] [CrossRef]
  88. Lavapuro, M.; Lipponen, A.; Artimo, A.; Katko, T.S. Groundwater sustainability indicators: Testing with Finnish data. Boreal Environ. Res. 2008, 13, 381–402. [Google Scholar]
Figure 1. Lake location, sampling transects, water quality and water level data, and drainage basin: (a) Location of and sampling transects through Lake Lehmilampi. Dashed lines show the northwest (AB) and the southwest transects (BC). The star denotes the sampling point in the southern basin. (b) Coring sites and core codes along both transects are shown as a function of bathymetry. (c) Water quality monitoring data of Lake Lehmilampi (Cond.: electrical conductivity). The lake has been frozen in April 3rd, 1975 and in February 24th, 1992. The lake has been free of ice in August 26th, 1998. (d) Water level data of neighboring Lake Pielinen. Lake levels are expressed as height (cm) above an arbitrary zero level at the monitoring location. (e) Land use types of the Lake Lehmilampi drainage basin [51,52,53]. Isobaths are expressed in meter below lake surface, and elevation contour values are expressed as meters above sea level. (f) Superficial geology of the Lake Lehmilampi drainage basin [51,52,54].
Quaternary 02 00020 g001
Figure 2. Photography of polished freeze core surface (left) and enlarged thin section microscopy image of the varve structure (right) from Lake Lehmilampi representing the seasonal sedimentation cycle. Light-colored clastic laminae are composed of clastic material transported into the lake during spring snowmelt flooding. Darker-colored biogenic laminae are composed of organic matter produced during the growing season.
Quaternary 02 00020 g002
Figure 3. Examples of different sediment types in incident light microscopy images. (a) Varved sediment: continuous varved section (left) and one clastic-organic couplet (right; marked with a white bar). (b) Partially varved sediment with unclear contacts and disturbed or discontinuous lamina. White bar (left) represents partially varved sediment comprising two clastic laminae and one biogenic lamina. (c) Non-varved massive section.
Quaternary 02 00020 g003
Figure 4. X-ray images representing core correlation based on variations in lithological marker horizons and the succession of varves. The arrows point at clastic laminae that were formed in 1815, 1962, and 1973 as easily discernible components of marker horizons.
Quaternary 02 00020 g004
Figure 5. Sediment characteristics and dating: (a) Photography of core LL1 (water depth: 10.8 m), 137Cs activity measured from LL1 and variations in varve thickness, clastic (Clast) and biogenic (Biog) lamina thicknesses, as well as clastic/biogenic lamina thickness (Clast/Biog) ratio. Hypoxia volume from 1815–2014 and hypoxia periods (gray bars) are also provided. Hypoxia volume is displayed on a logarithmic scale. (b) Example of sediment appearance in freeze cores along the AB transect of Lake Lehmilampi and (c) example of variations in magnetic susceptibility (κ). Core codes and water depths are provided. Varved sections are marked with gray bars to the left of the photographs. Note that the depth scale is valid for all cores, while the time scale represents only the master core LL1. (d) Age versus sediment depth curve with estimated varve counting error (dashed lines) for core LL1.
Quaternary 02 00020 g005
Figure 6. First year of occurrence and volume of hypoxic waters (in m3) for (a) hypoxia period 1 in 1815, (b) hypoxia period 2 in 1855, (c) hypoxia period 6 in 1975, and (d) hypoxia period 7 in 2014. Bathymetric cross-sections along the dashed line DE show hypoxic (darker color) and oxic conditions (lighter color). Water depths 7–11 m in the transects are exaggerated by a factor of 25 to better visualize the variations in hypolimnetic hypoxia.
Quaternary 02 00020 g006
Figure 7. Hypoxic water volume from 1815–2014 compared to variations in climate variables. Hypoxia volume is displayed on a logarithmic scale. Climate variables with correlation coefficients > 0.3 and p-values < 0.05 are shown. Hypoxia periods 1–7 are marked with grey bars.
Quaternary 02 00020 g007
Figure 8. Relative abundances of most abundant diatom species and four higher-level taxonomic groups of core LL1. The sample scores of the first two principal components (PC1 and PC2) of diatom data and diatom-inferred total phosphorus (DI-TP), and temporal coverage of diatom samples are also shown. Hypoxia periods 1–7 are marked with grey bars. Years shown along the age/depth scale mark the onset of hypoxia periods.
Quaternary 02 00020 g008
Table 1. Piston cores (PC) and freeze cores (FC) recovered from Lake Lehmilampi (AB: northwest transect, BC: southwest transect, NB: northern basin, SB: southern basin). Sediment types are characterized as varved (a), partially varved (b), and non-varved (c).
CoreCore TypeSampling Point/TransectWater Depth (m)Sediment TypesCore Length (cm)CoreCore TypeSampling Point/TransectWater Depth (m)Sediment TypesCore Length (cm)
LL1FCNB10.80a32LL18PCAB transect9.90a,b,c140
LL2PCNB10.80a142LL19FCAB transect10.30a,b,c29
LL3FCAB transect10.80a26LL20PCAB transect10.30a,b,c152
LL4PCAB transect10.80a147LL21FCAB transect10.60a,b,c32
LL5FCAB transect10.80a30LL22PCAB transect10.60a,b,c140
LL6PCAB transect10.80a152LL23FCAB transect10.75a27
LL7FCAB transect10.80a33LL24PCAB transect10.75a142
LL8PCAB transect10.80a162LL25FCAB transect10.75a37
LL9FCAB transect10.50a,b21LL26PCAB transect10.75a166
LL10PCAB transect10.50a,b167LL27FCAB transect10.75a32
LL11FCAB transect9.58a,b,c17LL28PCAB transect10.75a146
LL12PCAB transect9.58a,b,c149LL29FCBC transect10.40a,b27
LL13FCAB transect7.20a,b,c24LL30FCBC transect10.30a,b,c33
LL14PCAB transect7.20a,b,c158LL31FCBC transect9.90a,b,c24
LL15FCAB transect6.53c25LL32FCBC transect9.10a,b,c30
LL16PCAB transect6.53c162LL33FCBC transect8.68a,b,c28
LL17FCAB transect9.90a,b,c27LLS2FCSB11.60a32
Table 2. Percentages of varved sediments for freeze cores from different water depths.
CoreWater Depth (m)Varve Percentage (%)
LL1-LL710.80100
LL23-LL2710.75100
LL2110.6069
LL910.5068
LL2910.4035
LL1910.3027
LL3010.3022
LL179.9012
LL319.9011
LL119.588
LL329.106
LL338.685
LL137.201
LL156.530
Table 3. Hypoxia periods, their durations, median hypoxia volume (m3), range of variation of hypoxia volume (m3), and median and maximum hypoxia volume per lake volume (%).
Hypoxia PeriodDuration (Years)Duration (from-to)Median Hypoxia Volume (m3)Range of Variation of Hypoxia Volume (m3)Median Hypoxia Volume per Lake Volume (%)Maximum Hypoxia Volume per Lake Volume (%)
7201994–20142255787–345990.2403.727
691971–198016381638–76480.1800.823
511943428428–4280.0460.046
4161905–192116381638–345990.1803.727
3111881–1892428428–7870.0460.085
251852–1857787787–7870.0840.085
1271815–184216381638–533040.1805.740
Table 4. Correlation between hypoxia volume and studied climate variables. From the monthly spring and autumn temperature and precipitation variables, only those with statistically significant correlations (p-value < 0.05) are shown. Time periods of available monitoring data, number of data points (n), correlation coefficients (ρ), and p-values are provided. * Variables with correlation coefficients > 0.3 and p-values < 0.05.
VariablePeriodnρp-Value
Annual temperature1890–19971070.360.06
Annual precipitation1890–1997107−0.050.63
Winter temperature *1890–19971070.56<0.01
Winter precipitation1890–1997107−0.060.22
Days of snow cover *1957–199740−0.380.03
Spring temperature1890–19971070.27<0.01
March temperature *1890–19971070.39<0.01
Spring precipitation1890–1997107−0.110.27
Summer temperature1890–1997107−0.260.01
Summer precipitation1890–19971070.26<0.01
Autumn temperature1890–1997107−0.230.02
November temperature *1890–1997107−0.47<0.01
Autumn precipitation *1890–1997107−0.36<0.01
October precipitation *1890–1997107−0.56<0.01