Abstract
This research focuses on the recent pollen image of several vegetation types in NW Italy. In 201 arboreal, shrubby, and herbaceous plant populations, pollen samples were taken from moss polsters, and the corresponding vegetation was recorded using the phytosociological method. Since studies on recent pollen rain in the Mediterranean mountains and coast are rare, this research aims to provide new data and tools to better interpret fossil pollen spectra. Pollen analysis provided data for the comparison between surface spectra and vegetation. Davis indices, fidelity, dispersion, and the relation with vegetation data were calculated for each taxon, and PCA was carried out. Most vegetation types are identifiable through the taxa dominating the pollen spectra, as frequently happens in woodlands (e.g., beech woods, chestnut woods, etc.). Characterizing shrubland and certain tree-dominated vegetation types (e.g., Larix forests) through pollen data is more complex. In this regard, Davis indices are particularly useful for identifying pollen/plant association, over- and underrepresentation of pollen, and taxa indicating vegetation types. Pollen threshold values were calculated which allow the assessment of the local presence of a plant. Overall, the achieved results partially confirm those of previous research carried out in the region, greatly expanding the comparisons between several different plant communities and the database in view of future sharing through the EMPD.
1. Introduction
Since the dawn of palynology, the interpretation of fossil pollen diagrams has always been one the main challenges faced by palynologists, starting with Von Post [1], who suggested the analysis of modern pollen representation and applied the results to the interpretation of fossil pollen diagrams.
Recent pollen rain data generally come from moss polsters, which can be used as natural pollen traps that accumulate pollen for approximately 5–10 years [2,3,4,5,6,7,8,9,10,11,12,13,14,15,16,17]. Vegetation cover data have often been estimated with the phytosociological method proposed by Braun-Blanquet [18,19] for other purposes (e.g., [3,4,20,21]). Several other criteria have been proposed over time, such as the measurement of the base area of trees or the analysis of vegetation using transects. In the eighties, different statistical approaches were applied to these topics (e.g., [22,23,24,25]. In the last three decades, more complex and sophisticated methods have been developed, starting from the research carried out by Sugita et al. [26]. These methods involved simulations and statistical analysis to create reliable models that can be used to produce “quantitative reconstructions of past regional land cover important for palaeoclimatology and nature conservation, and local-scale reconstruction of vegetation” [23,24,27,28]. While the reliability of these methods is widely proven, their core assumptions cannot always be met; this often happens, for example, in the Mediterranean mountains, mainly due to the extremely patchy landscape, varied morphology, and lack of water bodies.
In the second part of the 20th century, many authors used the R/P ratio (or its reciprocal) to compare the percentage presence of a taxon in the vegetation (R) to that of the same taxon in the corresponding pollen spectrum (P) (e.g., [3,4,29,30,31,32,33]. Davis O.K. [34] later proposed five indices to clarify different aspects of pollen representation. Together with statistical analysis, for example, this basic ratio was recently used to increase our understanding of pollen–vegetation dynamics in the Balearic Islands [21]. Moreover, the interest in data on recent pollen deposition is testified by the publication and frequent quotation of databases such as the Eurasian Modern Pollen Database (EMPD) [35,36].
The study of modern analogues is an essential tool for the reconstruction of the historical use of environmental resources: on the basis of modern analogues, many indicators have been proposed, including anthropogenic pollen indicators, local pastoral pollen indicators, and regional human activity pollen indicators [37,38,39,40].
While our previous studies have addressed the palynological characterization of specific types of vegetation (e.g., beech woods, alder woods, chestnut groves, hay meadows, etc.) or geographical areas (e.g., Val di Vara, urban centers), in this study we examined the relationship between pollen deposition and vegetation in the widest possible way, despite problems related to the great environmental lack of homogeneity.
From the late 1970s, a number of studies have been undertaken in in Liguria (NW Italy), both in rural and urban areas, in an attempt to clarify the relationship between recent pollen deposition and vegetation (e.g., [8,41,42,43,44,45,46]. The method used was a comparison of local pollen spectra, which were obtained through the analysis of natural traps (moss polsters) and quantification of the local vegetation cover obtained from phytosociological relevés [3,4]. Since more modern and sophisticated methods are difficult to apply in the Ligurian mountains, the main goal of this study was to test whether the large amount of both vegetation and pollen data available, coupled with statistical analysis, can prove to be a reliable tool in the environmental conditions of the particular Mediterranean environment. In particular, in the upper valley of the Vara River (La Spezia, Eastern Liguria), only partially published research had been carried out in which the recent pollen rain was also compared with the cartography of the vegetation [12,14].
1.1. The Selected Study Areas: Liguria and NW Piedmont
Liguria is a crescent-shaped region in northwest Italy (Figure 1) characterized by close proximity to the mountains and to the coast. Most of Liguria is dominated by mountains, often with very steep slopes. The mountain sides are home to mainly heterogenous and patchy vegetation, which has been shaped by human activities for millennia. As a result, different types of vegetation management practices and widespread types of vegetation of anthropogenic origin can be observed, such as olive groves, chestnut groves, and pastures. In the Ligurian steep slopes, the method suggested by Bromstrom [47]—analyzing large areas (radius > 1000 m)—would prove to be difficult and rarely feasible. Given the large altitudinal variations over short distances and the high fragmentation of the vegetation cover in several plant communities of different structure and composition, the mentioned method would consider these areas with different vegetation characteristics as a single unit. Moreover, water basins are not frequent in Liguria. Thus, large and small water bodies, which are required to obtain pollen data, are quite scarce and often missing from the study area, making it difficult to apply the most recent and sophisticated models such as REVEALS and LOVE.
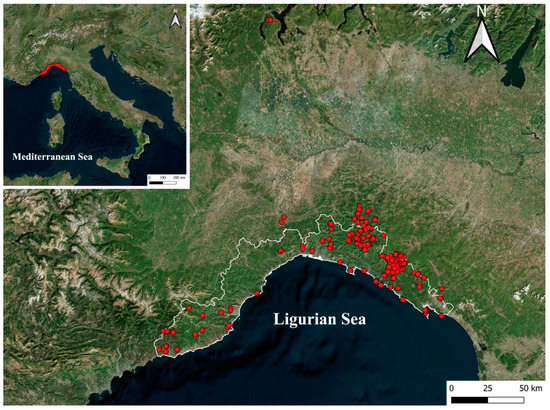
Figure 1.
Map showing the position of the study area and the sampling sites, shown as red dots.
1.2. Notes on the Vegetation of the Study Area
The combination of the geographical, geological, geomorphological, and historical characteristics of Liguria have given rise to a particularly varied and complex floristic and vegetation structure. There are more than 3000 species of vascular plants and numerous plant communities linked to both the mid-European and Mediterranean bioclimates. The former characterizes the Ligurian Maritime Alps, which exceed 2000 m in altitude, and the Apennine ridge with slightly lower elevations, while the latter outlines the shores of the Ligurian Sea. In order to provide a useful frame of reference for the topics under discussion, we provide a quick description of the vegetation structure of Liguria; for a more in-depth description and phytosociological references, please refer to the picture drawn by Gentile [48] and, more recently, by Vagge and Mariotti [49]. On the basis of the altitudinal and geomorphological variety, the bioclimatic belts are not horizontal but subjected to even accentuated descents and ascents, with nuances at the points of contact. Broadly speaking, five main belts can be identified. The thermo-Mediterranean belt extends from sea level to approximately 300 m asl, with completely fragmentary aspects of beach and coastal cliffs vegetation, garrigue, Mediterranean macchia, holm oak of mostly coppiced forest, and Pinus halepensis thickets. To a large extent, spontaneous vegetation has been replaced by planted olive groves widespread mostly on terraces, and pine woods, especially with Pinus pinaster, the latter receding due to phytosanitary issues and spontaneous dynamics. Many areas have been occupied by urban and productive settlements, road, and railway infrastructures. This is followed by a hilly belt that rises to approximately 700 m asl, characterized by thermophilous broadleaf woods with a prevalence of Quercus pubescens, Ostrya carpinifolia, and Fraxinus ornus in the arboreal layer, chestnut groves (now only partly productive), bushes with Crataegus monogyna, Rubus ulmifolius, Prunus spinosa, Pteridium aquilinum, etc., and secondary herbaceous formations, in the past used mainly for fodder and arable production. Between 700–800 m and 1300 m in the Ligurian Alps- and up to 1800 m in the Apennines, mesophilous mountain forests develop with a predominance of broad-leaved trees such as Fagus sylvatica, Acer pseudoplatanus, Sorbus aucuparia, S. aria, and Abies alba. In this belt up to about 1000 m asl, chestnut groves are found, once intensively cultivated for chestnuts, timber, forage leaves, and litter but now largely abandoned. Secondary grasslands can also be found, used in the past for hay and pasture. Acidophilous secondary shrubland is especially rich in Cytisus scoparius, Pteridium aquilinum, and Calluna vulgaris. This mesophilous woodland belt can reach the Apennines ridges no higher than 1800 m asl and hosts shreds of subalpine formations (with Pinus mugo, Vaccinium spp., Erica herbacea, Calluna vulgaris, etc.) and high-mountain pastures, mostly secondary. In the Ligurian Alps, up to 2000 m asl there is a subalpine belt with coniferous forests (Pinus sylvestris, Abies alba, Picea abies, Larix decidua) and a few broad-leaved trees (Alnus viridis, Betula pendula, Sorbus aucuparia). Climatic grassland is also found here, although it has been modified by grazing for centuries. Everywhere, conifers (Pinus pinaster, P. nigra, P. sylvestris, Picea abies etc.) have been introduced for reforestation. Few sample sites come from Piedmont, in the area of Mount Mottarone (Novara); they were studied as part of research aiming to assess the health of conifer woods suspected to have been subjected to acid rains. In addition to pollen production, on that occasion the germinability of pollen in different woods was also studied. The same study concerned coniferous forests in the Monte Gouta area (1309 m, Ligurian Alps, Imperia). The woods of Mottarone (10 stands) are both mesophilous hardwoods and planted conifers, while those of Gouta (7 stands) are dominated by silver fir. In the Gouta area, some decayed fir trees showed a clear decrease in pollen dispersion, while at Mottarone no decayed woods were found and pollen dispersion was in line with that recorded elsewhere in NW Europe [46].
2. Materials and Methods
Pollen Analysis and Vegetation Surveys
The study was carried out at 201 sites, mainly consisting of woodlands, plantations, shrubland, and meadows. In each site, at least 10 horizontal moss polsters were taken and mixed into a single sample to analyze recent pollen rain. After sampling and when possible, the most recent parts of moss samples—which normally include the pollen deposition of the preceding years—were selected. The moss samples were then chemically processed using the standard procedure in palynology: they were treated with a NAOH 10% hot bath, sieved, and then acetolyzed [50,51,52]. The samples were stored in a 50% water–glycerol solution vol/vol. Pollen analysis was carried out at 400–1000× using temporary slides.
Pollen identification was carried out using atlases [53,54] and the pollen reference collection of the Laboratory of Palinology and Archaeobotany of the University of Genova.
At least 300 pollen grains were counted for each moss sample (mean = 1967). Pollen concentration (Absolute Pollen Frequency, FPA) was calculated according to Accorsi and Rodolfi [55] with the following formula:
where:
- np = number of pollen grains in the subsample s.
- vS = total volume in the sample S.
- dw = dry weight of the sample S.
- vs = analyzed volume of the subsample s.
Pollen percentage was then calculated for each taxon. Vegetation was recorded by means of phytosociological relevés [18,19] adopting the average for each covering value range, which is shown in Table 1. Plant taxonomy follows Pignatti [56,57]. Since different layers of vegetation can overlap, vegetation cover data often exceed 100%: to make it possible to compare pollen and vegetation cover percentages, the latter were converted so that their total would be 100%.

Table 1.
Mean cover values calculated for Braun-Blanquet abundance classes [18,19]. The + symbol indicates a very low plant cover value.
Following Broström et al. [47], the taxonomy of plant and pollen was harmonized so each pollen taxon correlated to all plant taxa that produce pollen with that particular morphology. Regarding extra-local pollen, we refer to Janssen [31], who considers the pollen rain from a distance of approximately a few hundred meters from the sampling area as extra local.
Additional information regarding each sampling site can be found in Table S1. For calculations and graphs, taxa were mainly selected on the basis of the most frequent and significant species found in both the pollen spectra and the phytosociological surveys.
Additional categories of frequent taxa, which include undiff. pollen grains, were also used to avoid an excessive number of taxa (e.g., Alnus including A. viridis, A. glutinosa/incana and Alnus undiff and Fraxinus including F. ornus, F. excelsior, and F. undiff).
Davis indices [34] were calculated for each taxon and type of vegetation. They consisted of: an association index (A), underrepresentation (U), overrepresentation (O), and vegetation type indicator (I). In a previous study [12], the O and U indices were referred to as hyper- and hypo-representation to avoid confusion with the R/P index, where these terms have a different meaning. It might be useful for this criterion to be commonly adopted. Below is a brief description of these indices, directly quoting from Davis [34]:
- Association index A
- Underrepresentation index U
- Overrepresentation index O
- Type indicator index I
where:
- B0 = number of stands in which the pollen type is present in the surface sample, and the associated plant taxon is present in the vegetation sample of the stand.
- P0 = number of stands in which the pollen type is present in the surface sample, but the associated plant taxon is absent in the local vegetation.
- P1 = number of stands in which the plant taxon is present in the vegetation, but the pollen type is absent in the surface sample.
- Be = number of vegetation types in which both pollen and plant are abundant.
- Pe = number of vegetation types in which the pollen is abundant, but the plant is not abundant.
- Ve = the number of vegetation types in which the plant is abundant, but the pollen is not.
For both pollen and vegetation, “abundant” means the average value is one standard deviation above the average for all samples.
Fidelity and dispersibility indices [58] were also calculated and represented for each taxon and type of vegetation. Quoting directly from [58]:
- for the fidelity index, the number of sites where a given plant taxon was both recorded in the vegetation and in the pollen surface samples was expressed as a percentage of the total number of sites where the plant was present.
- for the dispersibility index, sites where the plant taxon is absent when its pollen is recorded in the surface sample are expressed as a percentage of all sites where the plant was absent.
After carrying out preliminary analyses, statistical analysis was performed only on taxa that occurred in at least 5 different sites and at least once in both the vegetation and pollen spectra: taxa that were only found in vegetation or in pollen spectra were excluded. We tested the relationship between pollen percentages (P) and covering values (R) of each taxon. Scatter plot diagrams were drawn in order to graphically represent the relationship between the groups of plant communities and the main pollen taxa recorded. In addition, a principal component analysis (PCA) was carried out between Davis’ indices and pollen percentages to find the taxa that mostly contribute to indices variation. All pollen data were square root transformed to conform data to normality: to test this assumption, the Shapiro−Wilk test was applied. All analyses were performed using vegan and ggplot2 packages [59,60] (with R Studio software (version 4.2.2) [61].
3. Results
Through pollen analysis of 201 moss samples, 133 pollen types were identified. Different pollen types belonging to the same genus or family, especially the most critical ones regarding pollen identification, were also summed and grouped. Arboreal pollen refers to all plants with a woody stem and includes both trees and shrubs. To avoid an excessive number of vegetation types, these were grouped into 13 groups of plant communities, mainly with similar structures and ecological features. The main characteristics of these groups, together with the main results of the pollen analysis, are reported in Figure 2 and Table 2.
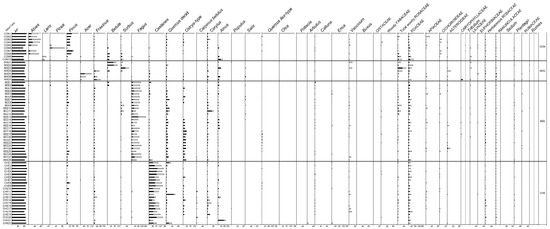
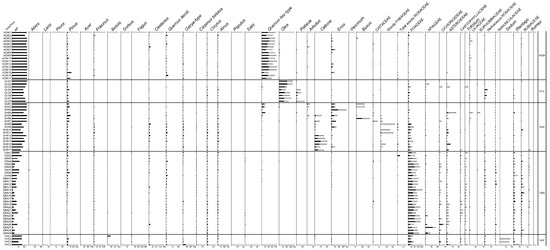
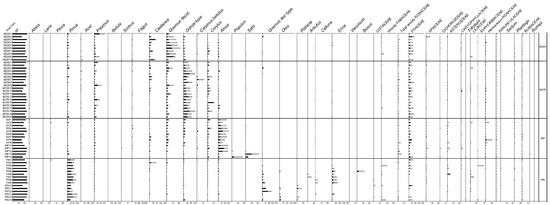
Figure 2.
Percentage pollen (black bars) and percentage plant cover (empty bars) diagram of selected taxa. Percentage values exceed 100% as pollen and plant cover percentage values were placed side by side. CON = mesophilous coniferous forest; MXD = mixed deciduous woods; BEE = beech woods; CHE = chestnut groves; MQW = mixed oak woods; MOW = mixed Ostrya woods; RIP = riparian woods; PIN = pine woods; HOW = holm oak woods; OLG = olive groves; SHR = shrublands; GRA = grasslands; VHC = various herbaceous communities.
Table 2.
Summary of the main groups of plant communities and the main results of the pollen analysis.
The values of Davis’ indices are reported in Table 3. Most taxa do not show a high value of association A: the highest association (A) values belong to Poaceae (0.9), followed by Rhinanthus (0.7), Asteroideae and Lotus-type (0.6), and Fabaceae, Ranunculaceae, Rosaceae (both woody and herbaceous) and Rubiaceae (0.5). Many taxa display high values in the overrepresentation index (O) and/or in the underrepresentation index (U). Approximately 64% of taxa reach a value equal to or above 0.5 in the overrepresentation index (O), and 60% of taxa reach the same value in the underrepresentation index (U). Approximately 55% of taxa show values greater than 0.5 in both the overrepresentation index (O) and underrepresentation index (U).
Table 3.
Table showing Davis’ indices (association (A), overrepresentation (O), underrepresentation (U), and type indicator index (I)). The hyphen - indicates that the value could not be calculated.
Given the high number of taxa and values, a more visual approach to these results is shown in the PCA (Figure 3). The graphical elaboration of the PCA shows the relationships between the pollen taxa and the Davis indices. The two principal component axes (PC1 and PC2) are responsible for 96.4% of the total variance, 58.4% and 38%, respectively (Figure 3). The PC1 axis shows that the large part of the variance is explained by the most representative pollen taxa divided between arboreal taxa (PC1 > 0) and herbaceous taxa (PC1 < 0).
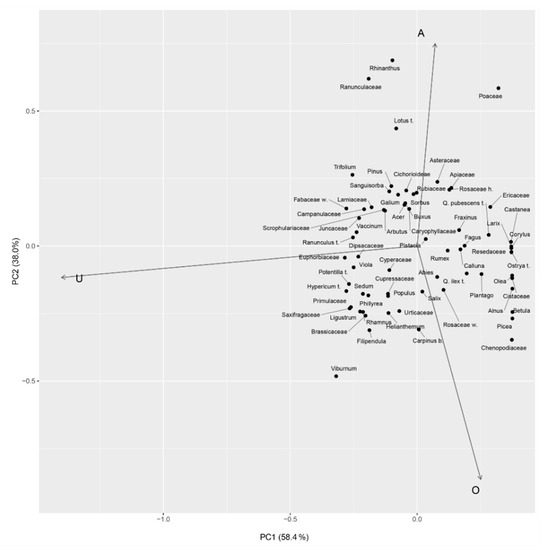
Figure 3.
Graphical representation of the principal component analysis (PCA) showing the relationships between the different Davis indices and different taxa. Letters on the three axes are abbreviations of the indices (A = association, U = underrepresentation, O = overrepresentation).
From this point of view, the PC1 explains the variance between the overrepresentation (O) and the underrepresentation (U) indices. Similarly, the PC2 axis seems to account for the most represented herbaceous pollen taxon (Poaceae) against the most represented arboreal taxa (e.g., Q. ilex-type, Ostrya-type, Betula). In this regard, the PC2 explains the variance between association (A) and overrepresentation (O) indices. Fidelity and dispersibility indices were calculated for each taxon. Figure 4 shows these values for a selection of taxa after removing rare taxa and with excessively low values. Figure 5, Figure 6, Figure 7 and Figure 8 show the scatterplot drawn for the most frequent taxa using plant cover and pollen percentage values (after bringing the vegetation cover to 100%). These scatterplots offer a graphic representation of the R/P ratio. The type indicator index (I) was calculated for each group of plant community, and taxa indicating the type of local vegetation are reported in Table 4. Type indicator taxa are taxa that are abundant in both pollen spectra and vegetation cover: results show that most of these are the dominant ones in the different groups of plant communities, e.g., Fagus in beech woods, Castanea in chestnut woods, Ostrya-type in hop-hornbeam woods, etc. Pollen of some of these taxa—e.g., Senecio/Cirsium for MXD, Sambucus nigra-type for RIP, and Oxalidaceae for OLG—was recorded in very low amounts. Fidelity and dispersibility indices are summarized in Figure 4.
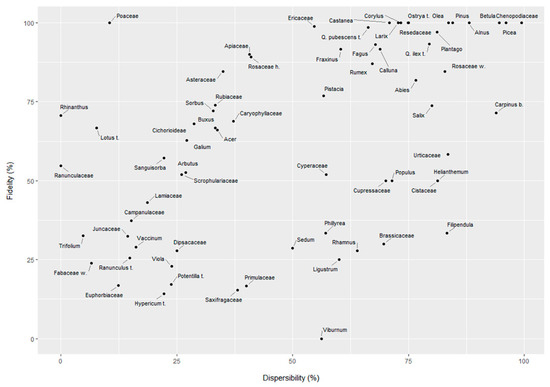
Figure 4.
Fidelity and dispersibility values plotted for each pollen taxon.
Table 4.
Type indicator taxa for each vegetation type based on index I.
4. Discussion
In most samples, pollen analysis almost agrees with relevant vegetation data from the phytosociological relevés. Most insect-pollinated taxa show a good fidelity and low dispersibility, meaning that their pollen is a good indicator of the local presence of the plant. Most tree taxa show both high fidelity and dispersibility: this is mainly due to the fact that fidelity/dispersibility are absence/presence indices and do not take into account the amount of pollen and plant cover: for example, a single Abies pollen grain found in a site where the tree is absent from the stand could increase the Abies dispersibility index. Nevertheless, these values were expected: tree species that are known to have a good pollen dispersal have high dispersibility and good fidelity.
Good examples of these tree species are Alnus, Ostrya, Pinus, Castanea, and Q. ilex. Some tree/shrubs, such as Arbutus, show lower fidelity and dispersibility values, as also observed by other authors [21], which are compatible with their type of pollination.
As mentioned above, some of the 13 plant communities examined in this work are actually macro-categories and include different types of vegetation with overlapping ecological niches: this choice was made to avoid an excessively high number of plant groups. Below, however, within the individual groups, we also analyse particular cases or minor groups of samples that differ from others of the same group, mainly due to site characteristics, phytosanitary causes, forest management, agro-forestry-pastoral practices etc.
Coniferous forest (CON)—In general, with few exceptions, pollen belonging to the dominant tree species is abundant where the plant is abundant and vice versa (Figure 5), as represented in the fidelity–dispersibility plot for Abies, Picea, and Larix (Figure 4). Nevertheless, two sites (CON7 and CON8) show lower than expected Abies pollen values (Figure 2): despite having cover values similar to other silver fir CON sites, here Abies pollen never exceeds 9%. The main reason for the lower pollen values is possibly related the poor state of health of silver fir at these sites; it appeared perished and with many yellowed leaves, which may have influenced pollen production [46].
Most Abies pollen is deposited locally, generally within 100 m off the plants [62], explaining how Abies pollen was generally low when the plant was absent from the vegetation but present in nearby sites. Pinus high pollen values (max 71%) cause an apparent decrease in pollen percentage of the other taxa. Pine reached very high pollen values despite being present in the vegetation in only two CON sites: even considering Pinus high pollen production and dispersibility [25,63], these values are mainly due to the presence of pine trees in the surroundings. Picea pollen was high only in spruce-dominated forests (CON6): in the other site where spruce was found in the vegetation (CON5) together with other trees, Picea pollen values were similar to those found by Lisitsyna et al. [64] in northernmost Europe (3–4%) in mixed spruce coniferous forests. Larix pollen was very low even when larch was found in vegetation: despite these low values, pollen data show that Larix pollen values ≥ 3% are found only where larch is found in vegetation: at all the other sites, even outside CON sites, Larix pollen was always <1%. Despite the fact that larch pollen is characterized by a high weight and a high fall speed [65]—meaning that most pollen deposition is local—it is also characterized by a relatively low pollen production [66], which explains Larix low pollen representation at these sites. While pollen data largely agree with phytosociological data, the local presence of certain taxa is not always easy to infer from pollen data. For example, excluding CON10 where green alder was found in the vegetation, alder and birch occasionally reached high pollen values (max 16% and 25%, respectively) despite being absent from the local vegetation of all the other CON sites. When such high values are recorded, most of this pollen comes from the surrounding area in close proximity of the sampling site. This seems to be the case for many of the sampled sites located in the Mottarone mountain (NW Piedmont): when alder was found in the vegetation of the site or at other close sites, then Alnus pollen values could be high even with a low plant cover in the sampling site, demonstrating an extra-local to long-distance transport [67].

Figure 5.
Scatter plot showing the relationship between absolute pollen frequency (APF, %) and vegetation cover (%) of selected taxa (Abies, Betula, Fagus, and Castanea).
Figure 5.
Scatter plot showing the relationship between absolute pollen frequency (APF, %) and vegetation cover (%) of selected taxa (Abies, Betula, Fagus, and Castanea).

Mixed oak woods (MXD)—This group includes different vegetation types that, based on the results of these analyses, can be distinguished from one the other. Except for MXD1 and MXD2, in all the other MXD sites where birch was found in the vegetation, it generally has low values and low pollen (<5%). This evidence explains the high dispersibility–fidelity ratio of this pollen type (Figure 4). Nevertheless, in some sites mainly located in the Mottarone and Gouta (W Liguria) mountains and belonging to different plant communities, it can sometimes reach high percentages (max 30%), even if absent or almost absent in the vegetation. This evidence suggests that Betula pollen possibly comes from the pollen rain of the close surrounding area, as also suggested for CON sites. This finding agrees with Ralska-Jasiewiczowa et al. [68]. Pollen data regarding Betula generally agree with existing literature, defining Betula pollen as “partially overrepresented” [69,70]. Nevertheless, while Betula pollen seemed to derive either from local or extra-local pollen rain at the analyzed sites, in southern England a long-distance transportation was described [71]. This difference is probably due to geomorphological differences, which can greatly impact wind direction and speed and thus pollen deposition. MXD3 is a mixed Sorbus/Alnus wood, where the two are the only tree species to exceed 1% in cover (respectively, 23% and 9%). Despite being an insect-pollinated plant, Sorbus was well represented at this site while it never exceeded 7% at all the other sites. Alder is known to be found in pollen spectra [69,70] and this is the case for many sites, including MXD. Here, alder pollen (Alnus cf viridis) is also high (29%) but it often reaches 20% even in sites where it is absent from the vegetation: it is thus difficult to suggest a clear threshold value that can help discern between local, extra-local, and regional pollen. In the last 20 years, different values to discern local alder presence have been proposed but often disagree as they depend on many factors—e.g., alder species, geomorphology, climate, etc. [72,73]. European blueberry, an insect-pollinated species that in two sites (MXD1 and MXD3) represents the shrub layer with cover values of ~ 20%, is not as well represented in the pollen spectra, where Vaccinium is absent or <1%. Different cover values of Acer and Fraxinus characterize the other four MXD sites (Figure 2 and Figure 7). In MXD5, a pure maple stand (plant cover 70%), Acer pollen is very high (45%), while in mixed woods, despite a good cover value (49%), its pollen only reaches 5%. Acer underrepresentation in mixed woods is mainly due to the presence of Fraxinus that, in these woods, reaches high values in both cover and pollen. Lisitsyna et al. [74], who reviewed data concerning pollen percentage threshold values as an indication of the regional presence of major European trees, proposed 0.5% as a threshold value over which maple can be considered present in the regional vegetation of an area. This was not the case in the sites analyzed in this study, where Acer pollen was often <0.5% even when maple was recorded in the local vegetation. On the other hand, the suggested threshold value for Alnus (2.5%) well agrees with what was observed in most of our sites: since alder, widespread in Liguria, is a generally overrepresented taxon often found outside but near most sampling sites, it is not surprising to find high pollen values (>15%) with very low cover values (<1%). Chestnut behaves similarly to alder since it has been cultivated in Liguria for at least 2000 years [75], and man greatly increased its distribution range. Differently from what was observed by Straka [69] and Conedera et al. [70], who described Castanea as “slightly underrepresented”, chestnut is mostly overrepresented in MXD pollen spectra. The herbaceous layer is mainly represented by Poaceae but in the MXD sites their pollen does not show a strict relationship with presence in the vegetation.
Beech forest (BEE)—Fagus pollen is present in all BEE sites but with very different values (2–80%). High beech cover values do not always correspond to high pollen values. Since most of the lower values are found in coppiced sites, this difference is probably due to the long time required by beech to flower after being cut. Despite this, by looking at the Fagus scatterplot (Figure 5), in most cases it is possible to determine a threshold value (~8%) over which Fagus is possibly present in the local vegetation. In addition, the great vegetation cover of beech trees compared to its pollen concentrations (Figure 5) shows the low pollen production of this taxon [32,33]. Most of Fagus pollen usually deposits between 300 and 1800 m from the source, meaning that its presence in the pollen spectra mainly indicates a local/extra-local deposition [62]. Alnus, Betula, Castanea, Corylus, Fraxinus, and Ostrya-type sometimes reach high pollen values (>20%) despite never reaching 1% of cover and often being absent from the vegetation. As described before for some of these taxa, vegetation nearby the sampling site greatly impacts pollen values of these taxa. For this reason, discerning between pollen coming from trees in the close proximity of the sampling site and the extra-local/regional pollen rain is not always easy. Most of these plants produce a lot of easily dispersed pollen and are common in the Ligurian mountains. For example, chestnut and hazelnut cultivation is widespread in the Ligurian Apennines up to the altitudinal limit of their distribution and in close proximity to the lower beech forests. Considering these data and the fact that in recently coppiced sites Fagus pollen is sometimes very low (2%), discerning between a mixed beech wood and a frequently coppiced beech wood on the basis of pollen alone is not always easy nor possible. Nevertheless, most of the tree pollen mentioned above belongs to plants that, if locally present, tend to reach higher pollen values (e.g., Castanea in CHE or Ostrya-type in MOW). One way to differentiate between these tree formations could be to analyze tree pollen values: low Fagus values found together with low values of other tree taxa could indicate a beech forest characterized by low pollen deposition, while low Fagus values and high values of other tree species possibly indicates a mixed beech wood or a different type of tree formation altogether. The herbaceous layer mainly consists of Poaceae; their values vary greatly, and it seems to be related to the openness of the tree layer with a few exceptions. The pollen of several herbaceous plants was recorded in more than 50% of the sites, even if they had an uneven distribution: Asteroideae, Ranunculaceae, herbaceous Rosaceae, and Rubiaceae.
Chestnut woods (CHE)—Castanea pollen is generally abundant and shows a more even distribution than Fagus, except for CHE12 and CHE21: these two sites show low pollen values (<11%) compared to other CHE sites with similar chestnut cover (Figure 2 and Figure 5). CHE12 is a mixed chestnut/oak coppiced wood where deciduous Quercus pollen is high (47%) despite a relatively low cover (10%). Similarly, CHE21 is a mixed chestnut alder wood where Alnus pollen is exceptionally high (72%) despite its cover value being lower than that of chestnut (23% vs. 30%). Alongside alder overrepresentation [25,69,75], these unexpected values may be attributable to different management practices, such as selecting only certain plants (e.g., chestnut) or cutting different species at different times, which could result in differences in pollen production. Moreover, the historical technique of planting alders in chestnut groves (complantazione) is known to improve soil thanks to the symbiotic relationship between alders and nitrogen-fixing [76]. In general, chestnut pollen reaches high values in the sites dominated by Castanea trees (Figure 2 and Figure 5). This suggests a local pollen dispersion, probably related to the geomorphological features of the study area. This differs from what has been observed by other authors [77,78]. Unlike non-CHE sites, here Castanea varies from slightly underrepresented to overrepresented. Corylus, Fraxinus, and Ostrya-type values vary greatly in CHE sites with no evident relationship between their cover values (Figure 2, Figure 6 and Figure 7).

Figure 6.
Scatter plot showing the relationship between absolute pollen frequency (APF, %) and vegetation cover (%) of selected taxa (Ostrya-type, Alnus, Salix, and Pinus).
Figure 6.
Scatter plot showing the relationship between absolute pollen frequency (APF, %) and vegetation cover (%) of selected taxa (Ostrya-type, Alnus, Salix, and Pinus).


Figure 7.
Scatter plot showing the relationship between absolute pollen frequency (APF, %) and vegetation cover (%) of selected taxa (Quercus deciduous, Q. ilex-type, Olea, and Fraxinus).
Figure 7.
Scatter plot showing the relationship between absolute pollen frequency (APF, %) and vegetation cover (%) of selected taxa (Quercus deciduous, Q. ilex-type, Olea, and Fraxinus).

Despite the fact that Fraxinus and Ostrya are often missing from the sampled vegetation, their pollen is higher than the threshold value of 0.5% suggested by Lisitsyna et al. [74] to indicate the local presence of the plant. Due to the unevenness of pollen distribution of these taxa, it is not possible to provide a clear threshold value for their presence in the Ligurian mountains. The range of threshold values suggested for Corylus (2–10%: [79,80]) agrees with the data of this study, even if with some exceptions. Pinus pollen was found at all CHE sites: the highest values were found in the two sites (CHE8, CHE10) where pine was also recorded in the vegetation, even if with low values. Similar to most of the 13 groups of plant communities, Poaceae once again dominate the herbaceous spectra with values depending on the openness of the tree layer. Other herbaceous taxa are not well represented and generally show very low values (<1%). Regarding non arboreal plants, the picture provided by pollen analysis is rather similar to what we can observe from plant cover: a poor herbaceous layer mainly consisting of Poaceae with cover values varying depending on the openness on the tree layer and with very few other herbaceous plants (e.g., Apiaceae, Cichorioideae, Juncaceae).
Mixed oak woods (MQW)—These woods are of two main types: deciduous oak-dominated woods and mixed oak/hop-hornbeam or oak/ash woods. The former, despite showing moderate cover values (>37%), show unexpectedly low percentages and uneven distribution of deciduous Quercus pollen (Figure 2 and Figure 7). While lower values could be expected in MQW7, characterized by relatively young trees and thus lower pollen production, these values were not expected at the other sites since deciduous Quercus pollen has previously been described as overrepresented [33]. Deciduous oak uneven pollen values were also observed by Roy et al. [63]. Looking at the pollen diagram (Figure 2), it is possible to note that in the sites characterized by low deciduous oak pollen values, other taxa, rare or absent from the tree cover, actually show high pollen values. These are mainly high-pollen-productive taxa—Castanea, Ostrya-type, Corylus, and Pinus—already observed in the groups above. Except for Pinus (the contribution of which possibly also comes from the regional pollen rain), the first three taxa can be easily found in mixed oak plant communities and are possibly common in the tree cover in the immediate surrounding. Indeed, for example, the two mixed oak/hop-hornbeam sites (MQW9 and MQW10) were located not far from oak woodland. Fraxinus can reach high pollen values despite having a moderate pollen production [81]. It is interesting that in MQW9 and MQW10, Ostrya-type and deciduous Quercus cover values are similar (respectively, 12 and 9%) but pollen values are quite different: in MQW9, deciduous Quercus pollen is almost 10 times that of Ostrya-type, while in MQW10 it is ~5 times lower than Ostrya-type. The ash-dominated site (MQW1) shows both high ash cover and pollen values: here, oak cover values are low, but pollen is higher than other sites with greater cover.
As shown in Figure 2 and Figure 7, mixed oak woods are not easily identifiable by oak pollen alone, even when dominated by oaks, since many of the non-MQW sites show similar deciduous Quercus pollen values despite a lower plant cover. Data show that in MQW, pollen values seem more linked to plant cover in the surrounding area and the sampling site than to the sampling area alone. Despite the medium/long-range transport of this taxon [82], deciduous oak pollen does not reach values >10% where it is absent in the area surrounding the sampling site, meaning that it contributes far more to short- to medium-range pollen rain than to regional pollen rain, possibly due to its size and specific gravity [83,84].
Mixed Ostrya woods (MOW)—Here, Ostrya-type pollen is generally abundant, especially when hop-hornbeam cover is high. As shown in Figure 2 and Figure 6, similar Ostrya-type pollen values can often be found in beech forest sites. Despite this, the two groups can easily be distinguished by looking at Fagus pollen values, which in MOW sites are never >1%. MOW7, which is dominated by Carpinus betulus, shows high Carpinus betulus-type pollen values of more than 10 times higher than those of the sites where the plant was not found. Unlike the threshold values (1–2%) suggested by Huntley and Birks [79], Carpinus betulus-type pollen in the sites of this study can reach ~ 5% even when the plant is absent from the local vegetation. Deciduous oak pollen values, similar to MQW, do not seem to be as influenced by the sampling site vegetation as they are by the vegetation in the surroundings (Figure 6). The same happens for Fraxinus, which reaches very high values (~42%) when plant cover is both very high and very low and, to a lesser extent, for chestnut. Based on the data from this study, the Fraxinus threshold should be higher than that suggested by other authors (2%; [79]), similar to the Carpinus betulus-type. Except for Poaceae, herbaceous species have low cover and even lower pollen values: this may be due to the generally high tree cover which is moderate only in two coppiced sites (MOW10 and MOW11).
Riparian woods (RIP)—RIP sites are mainly characterized by high alder cover (>30%) and Alnus pollen values >15%. Alnus cover and pollen values display a similar trend (Figure 6), but comparable pollen values can sometimes be observed even in sites with very different alder cover, meaning that pollen coming from outside the sites or other factors (e.g., competition, plant health and age, ecology, soil, geomorphology, etc.) may greatly influence pollen production/dispersion and, consequently, deposition. Two RIP sites are not dominated by alder: RIP13 and RIP14. The former is characterized by high willow cover and pollen values, while the latter is characterized by high poplar cover but lower pollen values. As opposed as what happens to Alnus pollen, which generally provides a great contribution to regional pollen rain, Salix and Populus pollen in all of the 201 sites were found with values >2% only in sites where the plant was present with a good cover (>40%) (Figure 6) or the plant was present in the nearby vegetation, in agreement with the threshold values suggested by Huntley and Birks [79]. Willow and poplar do not seem to contribute appreciably to regional pollen rain, and they are generally recognized as underrepresented taxa [70,85,86]. Thus, Salix and Populus high pollen values clearly indicate the local presence of the plants, unlike Alnus pollen values >15–20%. Lower Alnus pollen values can be attributed to regional pollen rain, even when their values are higher than the threshold value usually proposed in literature (0.5–2% in [74] and references therein). Castanea, Corylus, Fraxinus, and Ostrya-type, considering their low cover values, are mostly overrepresented here. Poaceae once again dominate the herbaceous layer, but other herbaceous species are well represented, especially those that prefer cooler and more humid conditions: Apiaceae, Cyperaceae, Plantago undiff, Rumex undiff, herbaceous Rosaceae, and Rubiaceae.
Pine woods (PIN)—Pine pollen is always high (Figure 6). There is no clear difference in pollen amount between pine woods, mixed pine/chestnut woods, clearings inside pine woods, and young pine woods. The lower pine pollen value (27%) was found in a pine/holm oak wood (PIN12). At this site, Q. ilex-type pollen—which is sometimes high when absent in the vegetation at other PIN sites—reaches a very high value (66%). Since Aleppo pine is often found in degraded holm oak woods [21], it is not surprising to find high holm oak pollen values and lower pine pollen values when the plants were found at the same site. Moreover, this could also explain the presence of certain high Q. ilex-type pollen values that were recorded even when the tree was absent from the vegetation. Castanea pollen reached values greater than 5% only when it was found in the vegetation with a good cover. Ostrya-type pollen was often overrepresented, as also stated by other authors (e.g., [70]), even if it reached values greater than 10% only when present in the vegetation. In general, similar to deciduous oak pollen, it seems Ostrya-type pollen contributes more to short- to medium-range pollen rain than to regional pollen rain. Since hop-hornbeam was present with low cover values in the surrounding area, most of this pollen derives from local pollen rain. In any case, when missing from the vegetation, Ostrya-type pollen values were approximately 10 times higher than the 0.5% threshold value suggested by Lisitsyna et al. [74]. Olea pollen values were occasionally ~10%, despite the fact that olive was never found in the vegetation. This was expected, considering that Olea pollen is often overrepresented, it can be easily dispersed for a few kilometers [20], and olive cultivation was widespread on the Ligurian coast even if it is now abandoned in large areas. Regarding the shrub layer, Buxus pollen was found in the only site where it had a good cover (PIN5). It is generally rare to find high values of Buxus pollen where it is absent from the vegetation, as also supported by data from Servera-Vives et al. [21]. Erica pollen was high only when the plant was found in the vegetation, but in two sites with a good cover (~20%) Erica pollen was less than 2%. Erica, and more in general Ericaceae, have a very high fidelity and moderate dispersibility (Figure 4), as already observed in the Balearic Islands [21], showing a good relationship between pollen and plant cover (Figure 8). Woody Fabaceae pollen was never found when the plants were absent, but they did not exceed 1% in pollen even with high cover values (>35%). Fabaceae, which are entomogamous, are known to produce low quantities of non-easily dispersed pollen and are usually underrepresented, even if they are sometimes reported to be well represented [87]. Regarding the herbaceous layer, this varies from almost non-existent to well represented. Poaceae are usually well represented but, unlike most of the other sites, the highest pollen values were not found in the most open pine woods but where the shrub layer was less developed. The only other herbaceous taxon reaching high pollen values were Asteroideae in site PIN6 despite their absence from the vegetation.

Figure 8.
Scatter plot showing the relationship between absolute pollen frequency (APF, %) and vegetation cover (%) of selected taxa (Ericaceae, Poaceae, Asteraceae Asteroideae, and Cichorioideae).
Figure 8.
Scatter plot showing the relationship between absolute pollen frequency (APF, %) and vegetation cover (%) of selected taxa (Ericaceae, Poaceae, Asteraceae Asteroideae, and Cichorioideae).

Holm oak woods (HOW)—Holm oak woods are characterized by a low biodiversity which results in a poorly developed herbaceous and shrub layer. Q. ilex-type pollen is very high and ranges from slightly overrepresented to slightly underrepresented (Figure 7): it is always greater than 50% excluding one site with very high Pinus pollen values (HOW15), which causes a percentage decrease in Q. ilex-type pollen. As discussed for PIN sites, since holm oak and pine can often be found together in the vegetation, it is not surprising to find high Pinus pollen values even when absent from the vegetation of some sites. When pine is also found in the vegetation of HOW sites, Pinus pollen tends to be higher. Q. ilex-type values in HOW are similar to those recorded by Morales-Molino et al. [88] in the central Iberian Penisula. In HOW sites, deciduous oak and Erica pollen values are greater than 1% only when found in the vegetation. Differently from PIN5, here Buxus pollen was not found at the site with a good box cover. It is possible that the box tree was not in the condition to flower, possibly due to a lack of light or attacks from the box tree caterpillar (Cydalima perspectalis) and is thus destined to gradually disappear [89]. The herbaceous layer, as expected, is very poor and almost exclusively represented by Poaceae. Liliaceae were well represented in plant cover, but their pollen was mostly absent.
Olive groves (OLG)—Olea pollen dominates the pollen spectra reaching very high values (Figure 2). Olea is known to be easily transported by wind; however, most pollen is generally deposited just under the trees or in the immediate surroundings [90]. Looking at the Olea scatterplot (Figure 7), OLG sites are clearly distinguishable from the non-OLG sites. At OLG sites, Olea pollen can sometimes be as high as 84% and is generally higher in non-abandoned olive groves. Pinus, despite being absent in the vegetation, occasionally reaches values greater than 20%. Mediterranean pines are often found in the area surrounding the mostly abandoned olive groves, hence these values, generally too high to be attributable to the regional pollen alone, are not unexpected. In the sites where it was found in the vegetation, Pistacia is generally well represented, except from one site (OLG4) where its pollen is absent despite good plant cover (26%). Since OLG4 is one of the abandoned olive groves, it is possible that the Pistacia plants are being overshadowed by other plants, thus causing lower pollen production. Nevertheless, Pistacia pollen is known to be underrepresented in pollen spectra [91] and references therein. In the same way, Rhamnus pollen was found only at one site with low cover and not in others where the cover was much higher (~20%). Regarding herbs, the highest pollen values belong to Poaceae and herbaceous Rosaceae. The latter sometimes reach high values despite their absence in the vegetation. Trifolium pollen was not found despite good cover at some of the OLG sites.
Shrublands (SHR)—This group includes different types of shrub-dominated plant communities. Sites SHR1, SHR2, and SHR6, despite very high and similar box tree cover, have very different Buxus pollen evidence: very low in the first two sites and high in the latter. Alongside a different state of health of the plants, possibly due to box tree caterpillars, this difference can be attributable to the high Erica and Q. ilex-type pollen found in the first two sites, which is very low in SHR6. Pinus pollen, with pine mostly absent from the vegetation, generally comes from extra-local and regional pollen rain. SHR8, SHR10, SHR11, and SHR15 sites, despite a moderate (~30%) to almost total cover (92%) of woody Fabaceae (mainly Cytisus and Calicotome), show very low pollen percentages; since they are a very specialized insect-pollinated species, very low pollen values are predictable, as also reported by other authors (e.g., [88]). In these shrub communities, most pollen belongs to trees that were not found in the vegetation (mostly alder, chestnut, and hop-hornbeam) and Poaceae. Taking into account Fabaceae’s extreme underrepresentation (Figure 4), a possible reconstruction of the local vegetation made through pollen data alone is still possible: while AP pollen is generally high, no other tree taxon exhibits high pollen values, suggesting an open landscape. In SHR4 (a garrigue), despite a high plant cover of Asteroideae, Euphorbiaceae, and Liliaceae, most pollen belongs to Q. ilex-type (38%) and Pinus (17%) pollen, which were almost absent in the vegetation. Even though high tree pollen values alone would suggest otherwise, the presence of Erica pollen and pollen values of Asteroideae of almost 10% clearly indicate an open herbaceous/shrub vegetation compatible with the recorded vegetation. The remaining SHR sites are characterized by different values of Erica and Calluna pollen (which are generally well represented in the pollen spectra) and moderate values of other herbaceous taxa, mainly Asteroideae and Poaceae.
Grasslands (GRA)—At most sites, NAP prevails (Figure 2). Since trees are absent in these grasslands, tree pollen found at these sites is to be considered surely part of the extra-local or regional pollen rain. Poaceae, which are found at all 201 sites, dominate the pollen spectra reaching values as high as 90% (Figure 2 and Figure 8). Not surprisingly, Poaceae pollen accounts for a large part of the variance of association (A) index (Figure 3). Entomogamous herbs, which have a very localized pollen dispersal and were often not represented in pollen spectra of the other non-GRA sites, are generally well represented and occasionally show exceptionally high pollen values. For example, when found in the vegetation Apiaceae are always represented: when cover values are high (>10%), pollen values can be exceptionally high (47%), similar to GRA27. Considering their pollination, Cichorioideae are generally well represented (Figure 2 and Figure 8). As expected, Trifolium pollen values do not reflect its presence in the vegetation: even with moderate cover, pollen was often not found or was found in very low amounts. In general, grasslands are characterized by moderately low pollen values of many herbaceous taxa. The vegetation of the single sites is not easily recognizable through pollen analysis: certain taxa may indicate a prevailing management practice, for example, Plantago and Rumex pollen for pastures, but a clearer distinction does not seem feasible. Regarding trees, Pinus attained the highest pollen values, even if other taxa (Alnus, Castanea, deciduous Quercus, Fraxinus, Ostrya-type, and woody Rosaceae) were represented, never exceeding 16%. The number of herbaceous taxa, together with their sometimes low but not negligible pollen values, seem to be a good way to discern this vegetation from the others. In recent decades, an increasing interest in reaching a more precise reconstruction of past cultural landscapes has led to an increasing number of tools and indicators to help discern between different management practices (e.g., [39,92,93]). In the future, a comparison with grazed grasslands could provide elements for a distinction from mowed ones (cf. [13,94]).
Various herbaceous communities (VHC)—This group includes three different vegetation types: VHC is a wet meadow, VHC2 and VHC3 are plant communities in areas subjected to erosion, and VHC4 is a plant community subjected to trampling. Poaceae have comparable pollen values across the four sites.
In VHC1, Betula pollen reaches 30%: since only Betula seedlings were found at the site, this pollen comes from the surrounding area or, perhaps, from local birches before they were cut down.
The presence of low pollen amounts of Cyperaceae, Galium, Urticaceae, and Viola hint at humid conditions. Herbaceous Rosaceae, which include many meso-hygrophilous species, are not well represented and pollen values are similar to the other three sites.
VHC2 and VHC3 are characterized by a high Sedum cover that poorly reflects in pollen data. Nevertheless, Sedum pollen is rarely found in high amounts and its presence generally indicates a local pollen deposition. Most other taxa with appreciable pollen values come from the extra-local/regional pollen rain since they were not found at the sampling site: this is the case for Pinus, Erica, Alnus and, to a lesser extent, the other tree taxa.
In VHC4, despite a good plant cover (38%), Plantago pollen values were unexpectedly low (<1%). Since Plantago is one of the most used trampling indicators [37,40], these abnormal values need to be further investigated. Conversely, Asteroideae are found in vegetation but, less surprisingly, their pollen percentages are much lower (Figure 2 and Figure 8). The remaining pollen, except Poaceae, mainly belongs to two taxa: Pinus and Ostrya-type. The latter present in the immediate surroundings. While these four sites could be easily distinguishable through vegetation data, their distinction is less clear through pollen data alone and relies on subtler differences that cannot be taken for certain. However, the small number of samples does not allow for reliable conclusions to be drawn. Table 5 provides a summary of suggested threshold values for a selection of taxa calculated from the data of this study showing percentage pollen values that can be used to differentiate between locally produced and long-distance transported pollen. Only part of these threshold values agrees with existing literature, highlighting the need to be cautious about generalizing findings coming from a particular region.
Table 5.
Suggested threshold values for a selection of taxa. Taxa are ordered according to family.
A better explanation for unexpected values could be possible through a detailed analysis of historical land management practices (coppicing, mowing, grazing), but they were not taken into consideration in this study.
An interesting result of this study is the fact that pollen taxa that are still considered bad descriptors of vegetation because they have large pollen production and dispersion (e.g., Pinus, Corylus, Ostrya) [20], actually show very low association values (A) (regional pollen dispersal), but if evaluated quantitatively, they also have maximum values as indicators of particular vegetation types (Table 5). In fact, when the mean of both pollen and vegetation cover of a certain vegetation type are higher than the mean value of all samples plus the standard deviation, these taxa can be considered good indicators of that vegetation type [34]. The same applies to other large pollen-producing plants (Alnus, Betula, Castanea, Quercus) and also to taxa that are not often considered, such as Calluna, Erica, and Oxalidaceae.
5. Conclusions
Previous studies on pollen dispersion and its relationship with the local vegetation have brought to light a general good capacity of pollen assemblages recorded in natural traps to provide, at least in general terms, a pollen image of the local vegetation. In Liguria, these relationships have been examined for some time in single types of vegetation and in different geographical areas, both in Mediterranean and sub-Mediterranean bioclimates. In this research, an attempt was made to put together most of the samplings carried out in Liguria and in an area of Piedmont to study the behavior of the pollen/vegetation ratio in a broad vegetational, geographical, and bioclimatic context. Both concordances and differences with what is already known in this regard have been observed, alongside variability linked to the environmental context including human activity, although the latter is difficult to quantify. The great floristic and vegetation richness, the geomorphological and climatic variety, and the fragmentation of the current vegetation cover of the region certainly accentuate the difficulties of obtaining constant and transferable data for other environmental realities. However, we are convinced that the publication of abundant data, which too often remain locked in researchers’ drawers (grey literature), can contribute to an ever better understanding of these issues. Online databases, such as the Eurasian Modern Pollen Database (EMPD), to which these data could contribute in the future, are particularly useful to share information with other researchers. Regarding the results of this investigation, data generally agree with existing literature even if differences were observed. Overall, most tree-dominated plant communities (e.g., beech woods, chestnut groves, hop-hornbeam woods) can be easily individuated through recent pollen deposition: some tree taxa, whose pollen is produced in high amounts and is easily dispersed (e.g., Pinus, Quercus, Ostrya-type, Alnus, Castanea, Corylus, Fraxinus), are often overrepresented in sites where their cover was low or they were absent, as shown by PCA analysis and scatterplots, since when this occurred they were usually observed in the vegetation close to the sampling site. This can therefore be considered an extra-local contribution. On the other hand, it is often possible to observe differences in pollen data that can be attributed to different silvicultural practices, even if further studies would be needed to provide more precise indications. The same cannot be said for herbaceous and shrubby communities, where plants with high cover—giving physiognomy to the vegetation—have very low pollen dispersal and are sometimes absent or poorly represented in pollen spectra. In this case, due to the small surface occupied, the lack of woody cover and large local producers, the influence of the surrounding and regional contribution is much more evident. Threshold values have been individuated, and they can be a useful tool for the reconstruction of the local vegetation. These data will be applied to a better interpretation of the numerous paleopalynological and archaeopalynological studies that have been carried out in the past—or are currently being carried out—in Liguria.
Supplementary Materials
The following supporting information can be downloaded at: https://www.mdpi.com/article/10.3390/quat6020036/s1, Table S1: Sites description.
Author Contributions
Conceptualization, D.A., C.M., and M.A.G.; methodology, D.A., C.M., and M.A.G.; formal analysis, D.A., F.C, C.M., and M.A.G.; investigation, C.M. and M.A.G.; data curation, D.A. and F.C.; writing—original draft preparation, D.A. and C.M.; writing—review and editing, D.A., F.C., C.M. and M.A.G.; visualization, D.A. and F.C.; supervision, C.M. and M.A.G. All authors have read and agreed to the published version of the manuscript.
Funding
This research received no external funding.
Institutional Review Board Statement
Not applicable.
Informed Consent Statement
Not applicable.
Data Availability Statement
The data that support the findings of this study are available from the corresponding author upon request.
Acknowledgments
The authors wish to thank several collaborators who contributed to the research, providing moss samples and vegetation relevés: S. Gentile, G. Poggi, R. Cevasco, P. Balest, C. Musso, G.Barberis, G. Paola, and S. Peccenini.
Conflicts of Interest
The authors declare no conflict of interest.
References
- von Post, L. Skogsträdpollen i sydsvenska torvmosselagerfoljder (Forest tree pollen in south Swedish peat bog deposits). Forh. Ved 16. Skand Nat. 1916, 16, 433–465. [Google Scholar]
- Heim, J. Recherches sur les relations rélations entre la végetation actuelle et le spectre pollinique récent dans les Ardennes Belges. Bull. Société R. Bot. Belg. 1962, 96, 5–92. [Google Scholar]
- Heim, J. Les rélations entre les spectres polliniques récents et la végétation actuelle en Europe occidentale. Mem. n. 4. Bull. La Société R. Bot. Belg. 1970, 4, 1–181. [Google Scholar]
- Heim, J. Etudes statistiques sur la validité des spectres polliniques provenant d’ehantillons de mousses. Lejeunia 1971, 58, 1–34. [Google Scholar]
- Caseldine, C.J. Surface pollen studies across Bankhead Moss, Fife, Scotland. J. Biogeogr. 1981, 8, 7–25. [Google Scholar] [CrossRef]
- Cundill, P.R. The use of mosses in modern pollen studies at Morton Lochs, Fife. Trans. Bot. Soc. Edinb. 1985, 44, 375–383. [Google Scholar] [CrossRef]
- Boyd, W.E. The role of mosses in modern pollen analysis: The influence of moss morphology on pollen entrapment. Pollen Spores 1986, 28, 243–255. [Google Scholar]
- Guido, M.A.; Montanari, C. Pollen assemblages in surface samples and vegetation relationships in the woods of Liguria (Northern-Italy) Preliminary results. Arch. Bot. Ital. 1991, 67, 54–75. [Google Scholar]
- Guido, M.A.; Montanari, C.; Poggi, G. Pollen deposition in country villages of Eastern Liguria (Northern Italy). Aerobiologia 1992, 8, 148–156. [Google Scholar] [CrossRef]
- Mercuri, A.M.; Venturi, L.; Accorsi, C.A. Aero-and bryopalynological evidence of widespread Prunoideae and Maloideae orchards in Vignola (Modena, Northern Italy). Aerobiologia 1992, 8, 109–114. [Google Scholar] [CrossRef]
- Hjelle, K.L. Herb pollen representation in surface moss samples from mown meadows and pastures in western Norway. Veg. Hist. Archaeobot. 1998, 7, 79–96. [Google Scholar] [CrossRef]
- Guido, M.A.; Montanari, C.; Menozzi, B. Deposizione Pollinica Attuale in Relazione Alla Copertura Vegetale Nell’alta Val di Vara (la Spezia). In Memorie Della Accademia Lunigianese di Scienze Giovanni Capellini. Scienze Naturali Fisiche e Matematiche, Vol LXVII–LXVIII–LXIX; Accademia Lunigianese di Scienze Giovanni Capellini: La Spezia, Italy, 1999; pp. 295–311. [Google Scholar]
- Azzolini, P.; Montanari, C. Immagine pollinica attuale di prati appenninici. Inf. Bot. Ital. 2001, 33, 458–463. [Google Scholar]
- Guido, M.A.; Montanari, C. Immagine Pollinica Attuale di Fitocenosi Forestali Nell’appennino Nord-Occidentale. In Colloques Phytosociologiques (Vegetazione Postglaciale Passata e Presente, Camerino, 1998); Pubblicazioni Scientifiche UNICAM: Camerino, Italy, 2004; pp. 147–161. [Google Scholar]
- Fang, Y.; Bunting, M.J.; Ma, C.; Yang, X. Are modern pollen assemblages from soils and mosses the same? A comparison of natural pollen traps from subtropical China. Catena 2022, 209, 105790. [Google Scholar] [CrossRef]
- Ciani, F.; Pampaloni, M.; Foggi, B.; Mariotti Lippi, M. Comparing pollen data from moss cushions and a volumetric sampler: The study in the city of Florence (Italy). Grana 2020, 59, 366–376. [Google Scholar] [CrossRef]
- Ciani, F.; Dell’Olmo, L.; Foggi, B.; Mariotti Lippi, M. The effect of urban green areas on pollen concentrations at ground level: A study in the city of Florence (Italy). Urban For. Urban Green. 2021, 60, 127045. [Google Scholar] [CrossRef]
- Braun-Blanquet, J. Plant Sociology. The Study of Plant Communities; McGraw-Hill Book Company: New York, NY, USA; London, UK, 1932. [Google Scholar]
- Braun-Blanquet, J. Fitosociologia Bases Para El Estudio de Las Comunidades Vegetales; Blume: Madrid, Spain, 1979. [Google Scholar]
- Fontana, V.; Furlanetto, G.; Bertuletti, P.; Brunetti, M.; Zerbe, S.; Pini, R. Plant distribution and modern pollen deposition across an elevation eco-gradient: The lesson learnt from a case study in the Italian Alps. Holocene 2022, 33, 09596836221138325. [Google Scholar] [CrossRef]
- Servera-Vives, G.; Mus Amezquita, M.; Snitker, G.; Florenzano, A.; Torri, P.; Estrany Bertos, J.; Mercuri, A.M. Modern analogs for understanding pollen-vegetation dynamics in a Mediterranean mosaic landscape (Balearic Islands, Western Mediterranean). Holocene 2022, 32, 09596836221088229. [Google Scholar] [CrossRef]
- Prentice, I.C. Multivariate Methods for Data Analysis. In Handbook of Holocene Palaeoecology and Palaeohydrology; Berglund, B.E., Ed.; Wiley: Chichester, UK, 1986; pp. 775–797. [Google Scholar]
- Hellman, S.; Gaillard, M.J.; Broström, A.; Sugita, S. The REVEALS model, a new tool to estimate past regional plant abundance from pollen data in large lakes: Validation in southern Sweden. J. Quat. Sci. Publ. Quat. Res. Assoc. 2008, 23, 21–42. [Google Scholar] [CrossRef]
- Hellman, S.E.; Gaillard, M.J.; Broström, A.; Sugita, S. Effects of the sampling design and selection of parameter values on pollen-based quantitative reconstructions of regional vegetation: A case study in southern Sweden using the REVEALS model. Veg. Hist. Archaeobot. 2008, 17, 445–459. [Google Scholar] [CrossRef]
- Felde, V.A.; Peglar, S.M.; Bjune, A.E.; Grytnes, J.A.; Birks, H.J.B. Modern pollen–plant richness and diversity relationships exist along a vegetational gradient in southern Norway. Holocene 2016, 26, 163–175. [Google Scholar] [CrossRef]
- Sugita, S.; Gaillard, M.J.; Broström, A. Landscape openness and pollen records: A simulation approach. Holocene 1999, 9, 409–421. [Google Scholar] [CrossRef]
- Sugita, S. Theory of quantitative reconstruction of vegetation I: Pollen from large sites REVEALS regional vegetation composition. Holocene 2007, 17, 229–241. [Google Scholar] [CrossRef]
- Sugita, S. Theory of quantitative reconstruction of vegetation II: All you need is LOVE. Holocene 2007, 17, 243–257. [Google Scholar] [CrossRef]
- Fagerlind, F. The real signification of pollen diagrams. Bot. Not. 1952, 105, 185–224. [Google Scholar]
- Davis, M.B. On the theory of pollen analysis. Am. J. Sci. 1963, 261, 897–912. [Google Scholar] [CrossRef]
- Janssen, C.R. A comparison between the recent regional pollen rain and the subrecent vegetation in four major vegetation types in Minnesota (U.S.A.). Rev. Palaeobot. Palynol. 1967, 2, 331–342. [Google Scholar] [CrossRef]
- Andersen, S.T. Tree-pollen rain in a mixed deciduous forest in South Jutland (Denmark). Rev. Palaeobot. Palynol. 1967, 3, 267–275. [Google Scholar] [CrossRef]
- Andersen, S.T. The relative pollen productivity and pollen representation of North European trees, and correction factors for tree pollen spectra. Determined by surface pollen analyses from forests. Dan. Geol. Undersøgelse II 1970, 96, 1–99. [Google Scholar] [CrossRef]
- Davis, O.K. Pollen frequencies reflect vegetation patterns in a Great Basin (USA) mountain range. Rev. Palaeobot. Palynol. 1984, 40, 295–315. [Google Scholar] [CrossRef]
- Davis, B.A.; Zanon, M.; Collins, P.; Mauri, A.; Bakker, J.; Barboni, D.; Barthelmes, A.; Beaudouin, C.; Bjune, A.E.; Bozilova, B.; et al. The European modern pollen database (EMPD) project. Veget. Hist. Archaeobot. 2013, 22, 521–530. [Google Scholar] [CrossRef]
- Davis, B.A.; Chevalier, M.; Sommer, P.; Carter, V.A.; Finsinger, W.; Mauri, A.; Phelps, L.N.; Zanon, M.; Abegglen, R.; Åkesson, C.M.; et al. The European modern pollen database (EMPD), Version 2. Earth Syst. Sci. Data 2020, 12, 2423–2445. [Google Scholar] [CrossRef]
- Behre, K.E. The interpretation of anthropogenic indicators in pollen diagrams. Pollen Spores 1981, 23, 225–245. [Google Scholar]
- Brun, C. Biodiversity changes in highly anthropogenic environments (cultivated and ruderal) since the Neolithic in eastern France. Holocene 2009, 19, 861–871. [Google Scholar] [CrossRef]
- Mazier, F.; Galop, D.; Gaillard, M.J.; Rendu, C.; Cugny, C.; Legaz, A.; Peyron, O.; Buttler, A. Multidisciplinary approach to reconstructing local pastoral activities: An example from the Pyrenean Mountains (Pays Basque). Holocene 2009, 19, 171–188. [Google Scholar] [CrossRef]
- Mercuri, A.M.; Mazzanti, M.; Florenzano, A.; Montecchi, M.C.; Rattighieri, E.; Torri, P. Anthropogenic Pollen Indicators (API) from archaeological sites as local evidence of human-induced environments in the Italian peninsula. Ann. Di Bot. 2013, 3, 143–153. [Google Scholar]
- Guido, M.A.; Montanari, C. Studi palinologici e confronto tra i faggeti attuali e del passato nell’Appennino ligure orientale. Arch. Bot. E Biogeogr. Ital. 1979, 55, 1–10. [Google Scholar]
- Montanari, C. Recent pollen spectra in two small mountain basins of the Ligurian Apennines (northern Italy). Grana 1989, 28, 305–313. [Google Scholar] [CrossRef]
- Montanari, C. Metodologie comparate per la valutazione dei rapporti tra pioggia pollinica e vegetazione. Inf. Bot. Ital. 1991, 21, 350–352. [Google Scholar]
- Montanari, C. Recent pollen deposition in alder woods and in other riverine plant communities. Allionia 1996, 34, 309–323. [Google Scholar]
- Montanari, C.; Guido, M.A. Correlazioni tra pioggia pollinica e vegetazione in alcune aree campione della città di Genova. Inf. Bot. Ital. 1991, 21, 353–358. [Google Scholar]
- Guido, M.A.; Montanari, C.; Braggio, G.; Cornara, L.; Placereani, S. Valutazione della dispersione, vitalità e germinabilità pollinica in relazione al deperimento del bosco. Atti Mem. Deput. Stor. Patria Antiche Prov. Modenesi 1998, 150, 347–358. [Google Scholar]
- Broström, A.; Sugita, S.; Gaillard, M.J. Pollen productivity estimates for the reconstruction of past vegetation cover in the cultural landscape of southern Sweden. Holocene 2004, 14, 368–381. [Google Scholar] [CrossRef]
- Gentile, S. Zonazione altitudinale della vegetazione in Liguria. Biogeogr. J. Integr. Biogeogr. 1984, 9, 155–173. [Google Scholar] [CrossRef]
- Vagge, I.; Mariotti, M.G. Le Serie di Vegetazione Della Regione Liguria. In La Vegetazione d’Italia; Blasi, C., Ed.; Palombi & Partner S.r.l.: Rome, Italy, 2010. [Google Scholar]
- Erdtman, G. The acetolysis method—A revised description. Vensk. Bot. Tidskr. 1960, 54, 561–564. [Google Scholar]
- Faegri, K.; Kaland, P.E.; Krzywinski, K. Textbook of Pollen Analysis, 4th ed.; The Blackburn Press: Caldwell, NJ, USA, 1989. [Google Scholar]
- Moore, P.D.; Webb, J.A.; Collinson, M.E. Pollen Analysis; Blackwell: London, UK, 1991. [Google Scholar]
- Beug, H.-J. Leitfaden der Pollenbestimmung für Mitteleuropa und Angrenzende Gebiete, 2nd ed.; Verlag Dr. Friedrich Pfeil: München, Germany, 2004. [Google Scholar]
- Reille, M. Pollen et Spores d’Europe et d’Afrique du Nord; Laboratoire de Botanique historique et Palynologie: Marseille, France, 1992–1998. [Google Scholar]
- Accorsi, C.A.; Rodolfi, G. Primi risultati sullo studio di un suolo calcimorfo delle Alpi Apuane in relazione ad analisi palinologiche e microbiologiche. Boll. Soc. Ital. Sci. Del Suolo 1975, 9, 35–51. [Google Scholar]
- Pignatti, S. Flora d’Italia; Edagricole: Bologna, Italy, 1982; Volumes 1–3. [Google Scholar]
- Pignatti, S.; Guarino, R.; La Rosa, M. Flora d’Italia; Edagricole: Bologna, Italy, 2017; Volumes 1–4. [Google Scholar]
- McGlone, M.S.; Meurk, C.D. Modern pollen rain, subantarctic Campbell Island, New Zealand. N. Z. J. Ecol. 2000, 24, 181–194. [Google Scholar]
- Oksanen, J.; Blanchet, F.G.; Friendly, M.; Kindt, R.; Legendre, P.; McGlinn, D.; Ouellette, M.; Cunha., E.R.; Smith., T.; Stier, A.; et al. Vegan: Community Ecology Package. R Package Version 2.5-7. Community Ecology Package 10; R Foundation for Statistical Computing: Vienna, Austria, 2020. [Google Scholar]
- Wickham, H. Ggplot2 Elegant Graphics for Data Analysis (Use R!); Springer: New York, NY, USA, 2016. [Google Scholar]
- R Core Team. R: A Language and Environment for Statistical Computing; R Foundation for Statistical Computing: Vienna, Austria, 2022; Available online: https://www.R-project.org/ (accessed on 3 January 2023).
- Poska, A.; Pidek, I.A. Pollen dispersal and deposition characteristics of Abies alba, Fagus sylvatica and Pinus sylvestris, Roztocze region (SE Poland). Veg. Hist. Archaeobot. 2010, 19, 91–101. [Google Scholar] [CrossRef]
- Roy, I.; Ranhotra, P.S.; Shekhar, M.; Bhattacharyya, A.; Pal, A.; Sharma, Y.; Singh, S.P.; Singh, U. Over-representation of some taxa in surface pollen analysis misleads the interpretation of fossil pollen spectra in terms of extant vegetation. Trop. Ecol. 2018, 59, 339–350. [Google Scholar]
- Lisitsyna, O.V.; Hicks, S.; Huusko, A. Do moss samples, pollen traps and modern lake sediments all collect pollen in the same way? A comparison from the forest limit area of northernmost Europe. Veg. Hist. Archaeobot. 2012, 21, 187–199. [Google Scholar] [CrossRef]
- Eisenhut, G. Untersuchungen über die Morphologie und Ökologie der Pollenkörner heimischer und fremdländischer Waldbäume. Forstwiss. Forsch. 1961, 15, 1–68. [Google Scholar]
- Sjögren, P.; van der Knaap, W.O.; Huusko, A.; van Leeuwen, J.F. Pollen productivity, dispersal, and correction factors for major tree taxa in the Swiss Alps based on pollen-trap results. Rev. Palaeobot. Palynol. 2008, 152, 200–210. [Google Scholar] [CrossRef]
- Picornell, A.; Recio, M.; Ruiz-Mata, R.; García-Sánchez, J.; Cabezudo, B.; Trigo, M.D.M. Medium-and long-range transport events of Alnus pollen in western Mediterranean. Int. J. Biometeorol. 2020, 64, 1637–1647. [Google Scholar] [CrossRef] [PubMed]
- Ralska-Jasiewiczowa, M.; Wacnik, A.; Mamakowa, K.; Nalepka, D. Betula L.—Birch. In Late Glacial and Holocene History of Vegetation in Poland Based on Isopollen Maps; Ralska-Jasiewiczowa, M., Latałowa, M., Wasylikowa, K., Tobolski, K., Madeyska, E., Wright, H.E., Jr., Turner, C., Eds.; W. Szafer Institute of Botany, Polish Academy of Sciences: Kraków, Poland, 2004; pp. 56–68. [Google Scholar]
- Straka, H. Pollen und Sporenkunde; Fischer: Stuttgart, Germany, 1975. [Google Scholar]
- Conedera, M.; Tinner, W.; Crameri, S.; Torriani, D.; Herold, A. Taxon-related pollen source areas for lake basins in the southern Alps: An empirical approach. Veg. Hist. Archaeobot. 2006, 15, 263–272. [Google Scholar] [CrossRef]
- Skjøth, C.A.; Smith, M.; Brandt, J.; Emberlin, J. Are the birch trees in Southern England a source of Betula pollen for North London? Int. J. Biometeorol. 2009, 53, 75–86. [Google Scholar] [CrossRef] [PubMed]
- Jensen, C.; Kunzendorf, H.; Vorren, K.-D. Pollen deposition rates in peat and lake sediments from the Pinus sylvestris L. forest-line ecotone of northern Norway. Rev. Palaeobot. Palynol. 2002, 121, 113–132. [Google Scholar] [CrossRef]
- Szczepanek, K.; Tobolski, K.; Nalepka, D. Alnus Mill.—Alder. In Late Glacial and Holocene History of Vegetation in Poland Based on Isopollen Maps; Ralska-Jasiewiczowa, M., Latałowa, M., Wasylikowa, K., Tobolski, K., Madeyska, E., Wright, H.E., Jr., Turner, C., Eds.; W. Szafer Institute of Botany, Polish Academy of Sciences: Kraków, Poland, 2004; pp. 47–55. [Google Scholar]
- Lisitsyna, O.V.; Giesecke, T.; Hicks, S. Exploring pollen percentage threshold values as an indication for the regional presence of major European trees. Rev. Palaeobot. Palynol. 2011, 166, 311–324. [Google Scholar] [CrossRef]
- Conedera, M.; Krebs, P.; Tinner, W.; Pradella, M.; Torriani, D. The cultivation of Castanea sativa (Mill.) in Europe: From its origin to its diffusion on a continental scale. Veg. Hist. Archaeobot. 2004, 13, 161–179. [Google Scholar] [CrossRef]
- Bertolotto, S.; Cevasco, R. The ‘Alnoculture’ System in the Ligurian Eastern Apennines: Archive Evidence. In Methods and Approaches in Forest History; Agnoletti, M., Anderson, S., Eds.; CABI Publishing: Wallingford, UK, 2000; pp. 189–202. [Google Scholar]
- Frei, T. Pollen distribution at high elevation in Switzerland: Evidence for medium range transport. Grana 1997, 36, 34–38. [Google Scholar] [CrossRef]
- Jato, M.V.; Aira, M.J.; Dopazo, A.; Iglesias, M.I.; Mendez, J.; Rodriguez-Rajo, F.J. Aerobiology of Castanea pollen in Galicia. Aerobiologia 2001, 17, 233–240. [Google Scholar] [CrossRef]
- Huntley, B.; Birks, H.J.B. Atlas of Past and Present Pollen Maps for Europe, 0–13,000 Years Ago; Cambridge University Press: Cambridge, UK, 1983. [Google Scholar]
- Sánchez Goñi, M.F.; Hannon, G.E. High-altitude vegetational pattern on the Iberian Mountain Chain (north-central Spain) during the Holocene. Holocene 2018, 9, 39–57. [Google Scholar] [CrossRef]
- Mazier, F.; Gaillard, M.J.; Kuneš, P.; Sugita, S.; Trondman, A.K.; Broström, A. Testing the effect of site selection and parameter setting on REVEALS-model estimates of plant abundance using the Czech Quaternary Palynological Database. Rev. Palaeobot. Palynol. 2012, 187, 38–49. [Google Scholar] [CrossRef]
- Maya-Manzano, J.M.; Fernández-Rodriguez, S.; Smith, M.; Tormo-Molina, R.; Reynolds, A.; Silva-Palacios, I.; Gonzalo-Garijo, A.; Sadys, M. Airborne Quercus pollen in SW Spain: Identifying favourable conditions for atmospheric transport and potential source areas. Sci. Total Environ. 2016, 571, 1037–1047. [Google Scholar] [CrossRef] [PubMed]
- Bryant, R.H.; Emberlin, J.C.; Norris-Hill, J. Vertical variation in pollen abundance in North-Central London. Aerobiologia 1989, 5, 123. [Google Scholar] [CrossRef]
- Pluess, A.R.; Sork, V.L.; Dolan, B.; Davis, F.W.; Grivet, D.; Merg, K.; Papp, J.; Smouse, P.E. Short distance pollen movement in a wind-pollinated tree, Quercus lobata (Fagaceae). For. Ecol. Manag. 2009, 258, 735–744. [Google Scholar] [CrossRef]
- Bradshaw, R.H.W. Modern pollen-representation factors for woods in south-east England. J. Ecol. 1981, 69, 45–70. [Google Scholar] [CrossRef]
- Jackson, S.T. Pollen and Spores in Quaternary Lake Sediments as Sensors of Vegetation Composition: Theoretical Models and Empirical Evidence. In Sedimentation of Organic Particles; Cambridge University Press: Cambridge, UK, 1994; pp. 253–286. [Google Scholar]
- Bell, B.A.; Fletcher, W.J. Modern surface pollen assemblages from the Middle and High Atlas, Morocco: Insights into pollen representation and transport. Grana 2016, 55, 286–301. [Google Scholar] [CrossRef]
- Morales-Molino, C.; Devaux, L.; Georget, M.; Hanquiez, V.; Goñi, M.F.S. Modern pollen representation of the vegetation of the Tagus Basin (central Iberian Peninsula). Rev. Palaeobot. Palynol. 2020, 276, 104193. [Google Scholar] [CrossRef]
- Badano, D.; Caracciolo, D.; Mariotti, M.; Raineri, V. Destruction of a protected habitat by an invasive alien species: The case of Cydalima perspectalis (Walker, 1859) in the box tree formations of Liguria (North-West Italy) (Lepidoptera: Crambidae). SHILAP Rev. Lepidopterol. 2019, 47, 87–95. [Google Scholar]
- Florenzano, A.; Mercuri, A.M.; Rinaldi, R.; Rattighieri, E.; Fornaciari, R.; Messora, R.; Arru, L. The representativeness of Olea pollen from olive groves and the Late Holocene landscape reconstruction in central Mediterranean. Front. Earth Sci. 2017, 5, 85. [Google Scholar] [CrossRef]
- Stevenson, A.C. Studies in the vegetational history of SW Spain. I. Modern pollen rain in the Doñana National Park, Huelva. J. Biogeogr. 1985, 12, 243–268. [Google Scholar] [CrossRef]
- Gaillard, M.J.; Birks, H.J.B.; Emanuelsson, U.; Berglund, B.E. Modern pollen/land-use relationships as an aid in the reconstruction of past land-uses and cultural landscapes: An example from south Sweden. Veg. Hist. Archaeobot. 1992, 1, 3–17. [Google Scholar] [CrossRef]
- Mazier, F.; Galop, D.; Brun, C.; Buttler, A. Modern pollen assemblages from grazedvegetation in the western Pyrenees, France: A numerical tool for more precise reconstruction of past cultural landscapes. Holocene 2006, 16, 91–103. [Google Scholar] [CrossRef]
- Hjelle, K.L. Modern pollen assemblages from mown and grazed vegetation types in western Norway. Rev. Palaeobot. Palynol. 1999, 107, 55–81. [Google Scholar] [CrossRef]


Disclaimer/Publisher’s Note: The statements, opinions and data contained in all publications are solely those of the individual author(s) and contributor(s) and not of MDPI and/or the editor(s). MDPI and/or the editor(s) disclaim responsibility for any injury to people or property resulting from any ideas, methods, instructions or products referred to in the content. |
© 2023 by the authors. Licensee MDPI, Basel, Switzerland. This article is an open access article distributed under the terms and conditions of the Creative Commons Attribution (CC BY) license (https://creativecommons.org/licenses/by/4.0/).