
Complex Microlandscape as a Structural Unit of the Study of Spatiotemporal Development of an Ombrotrophic Suboceanic Bog


Abstract
1. Introduction
- (1)
- Establish the specificity of the characteristics and parameters of the components of complex microlandscapes;
- (2)
- Establish specific internal relationships for complex microlandscapes;
- (3)
- Establish specific relationships between complex microlandscapes and environmental factors.
2. Materials and Methods
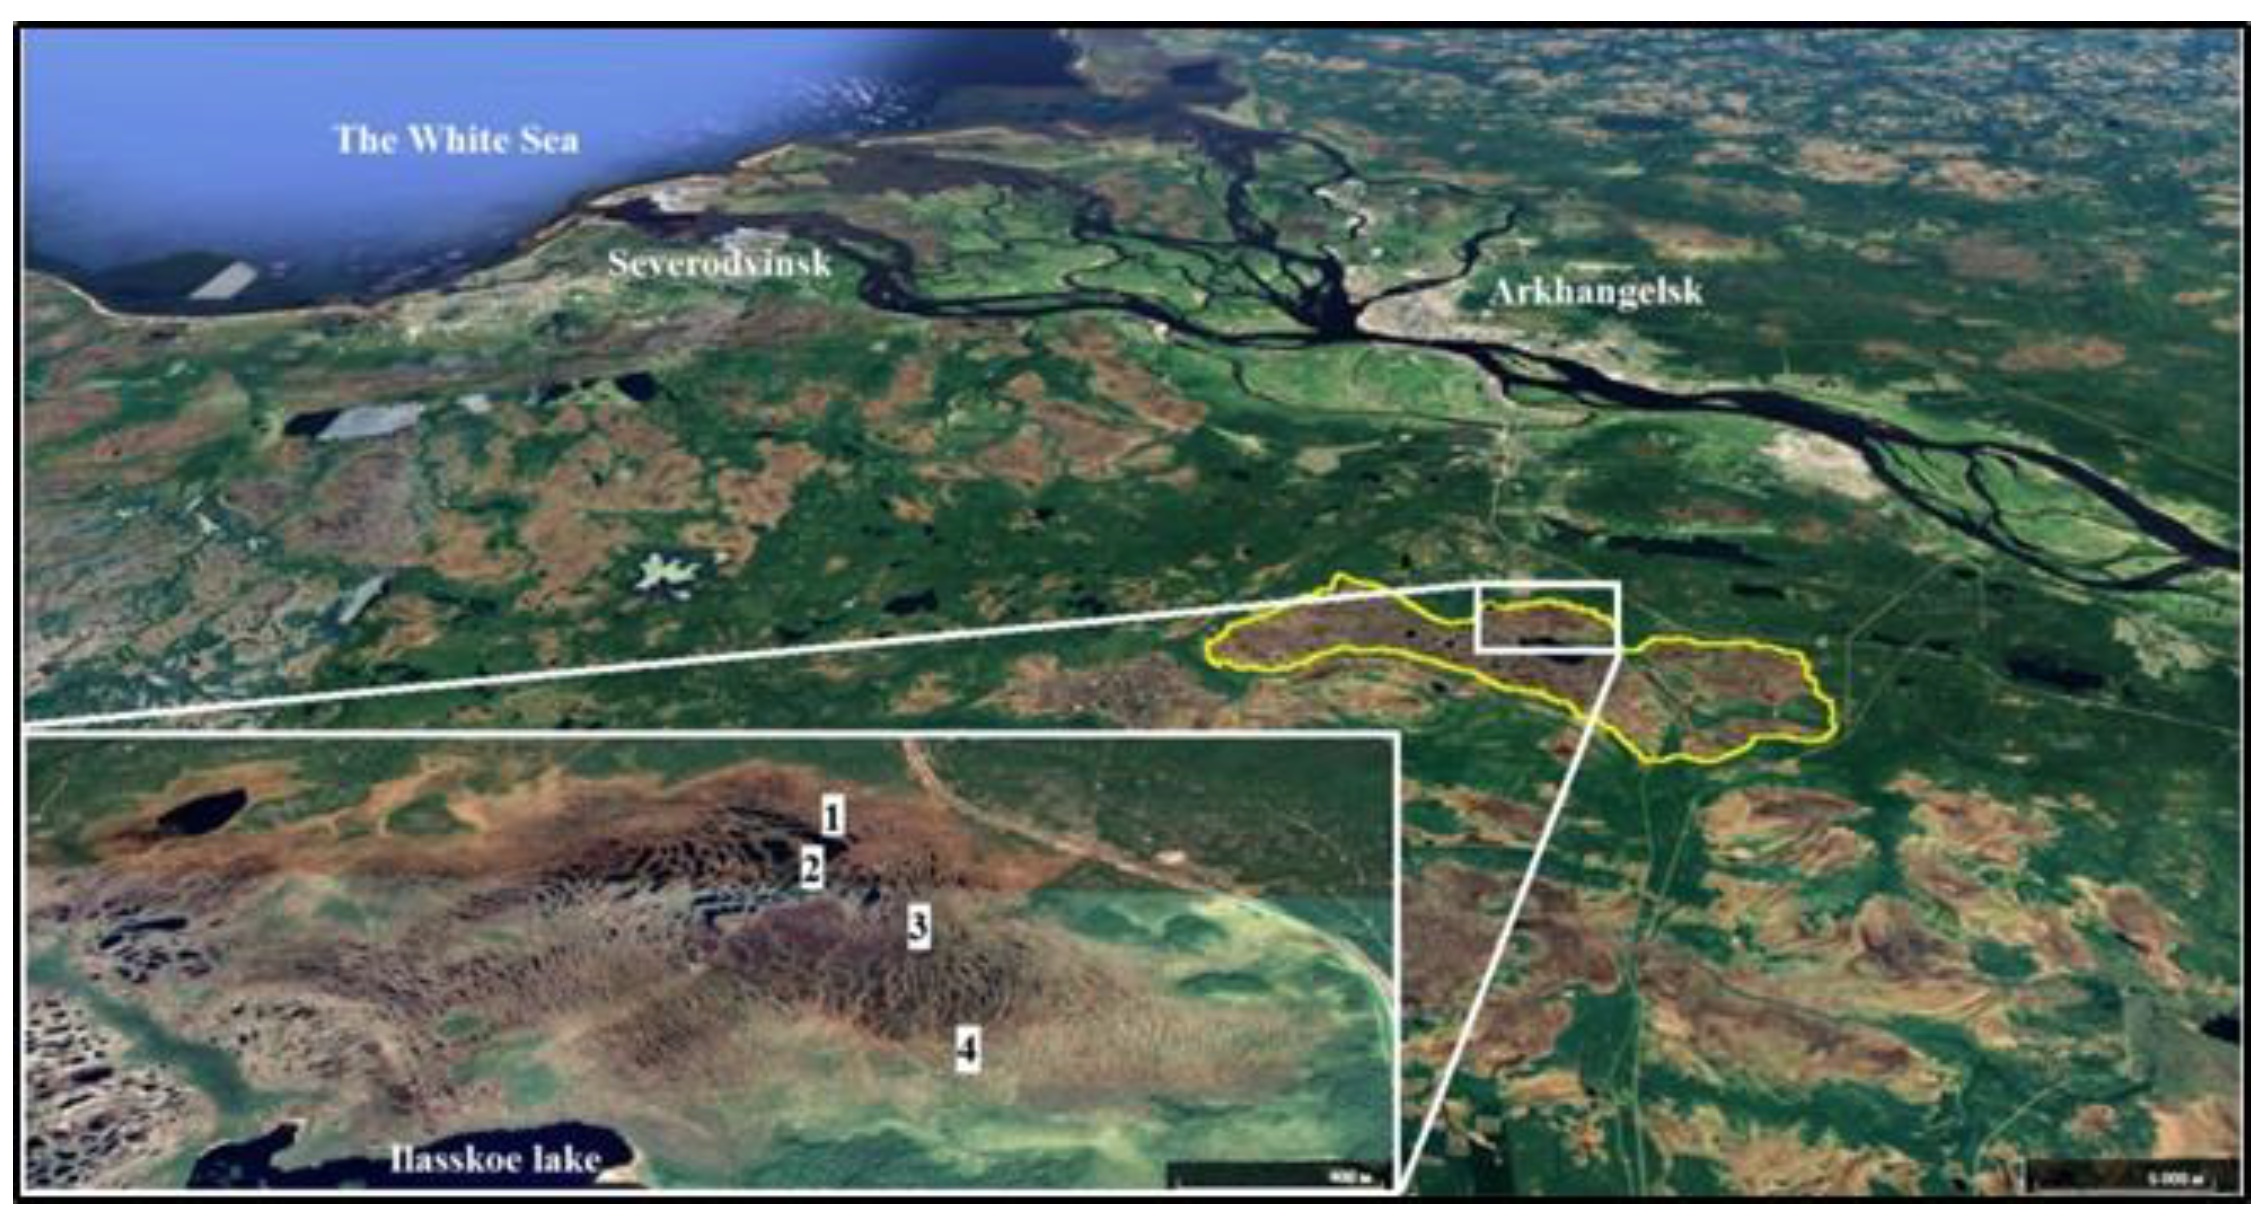
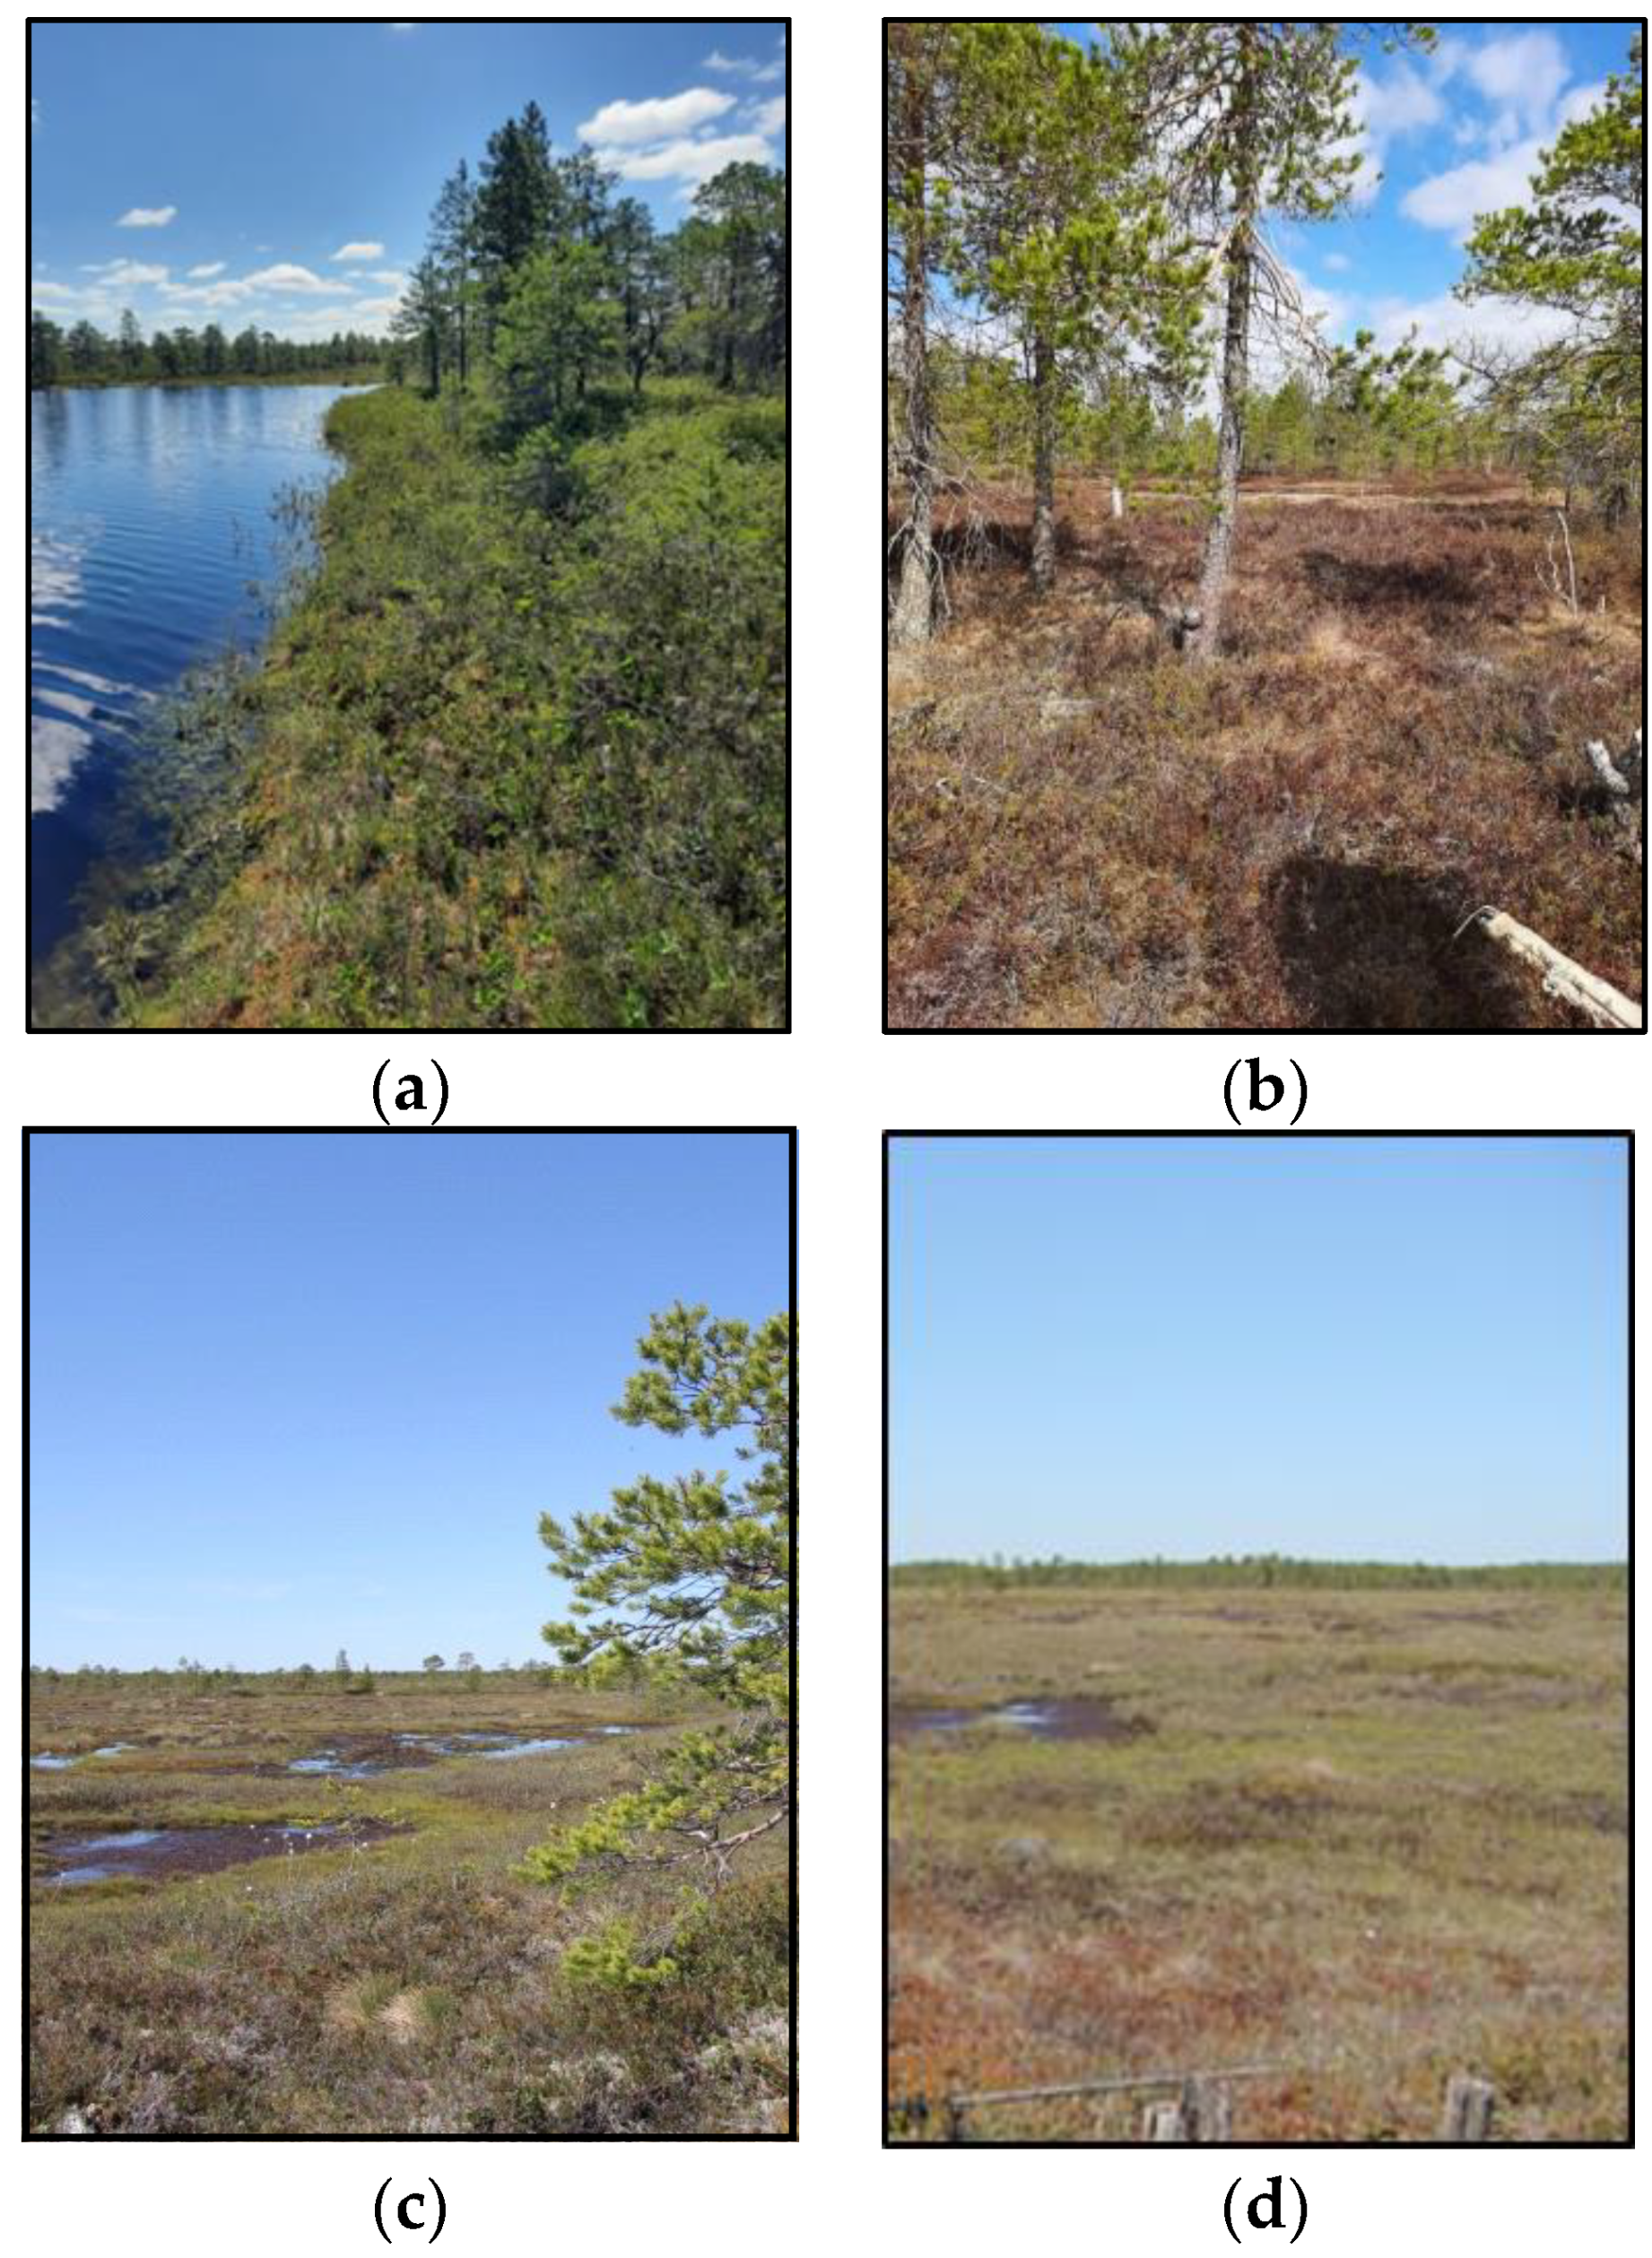
2.1. Study Area
2.2. Materials and Methods
3. Results
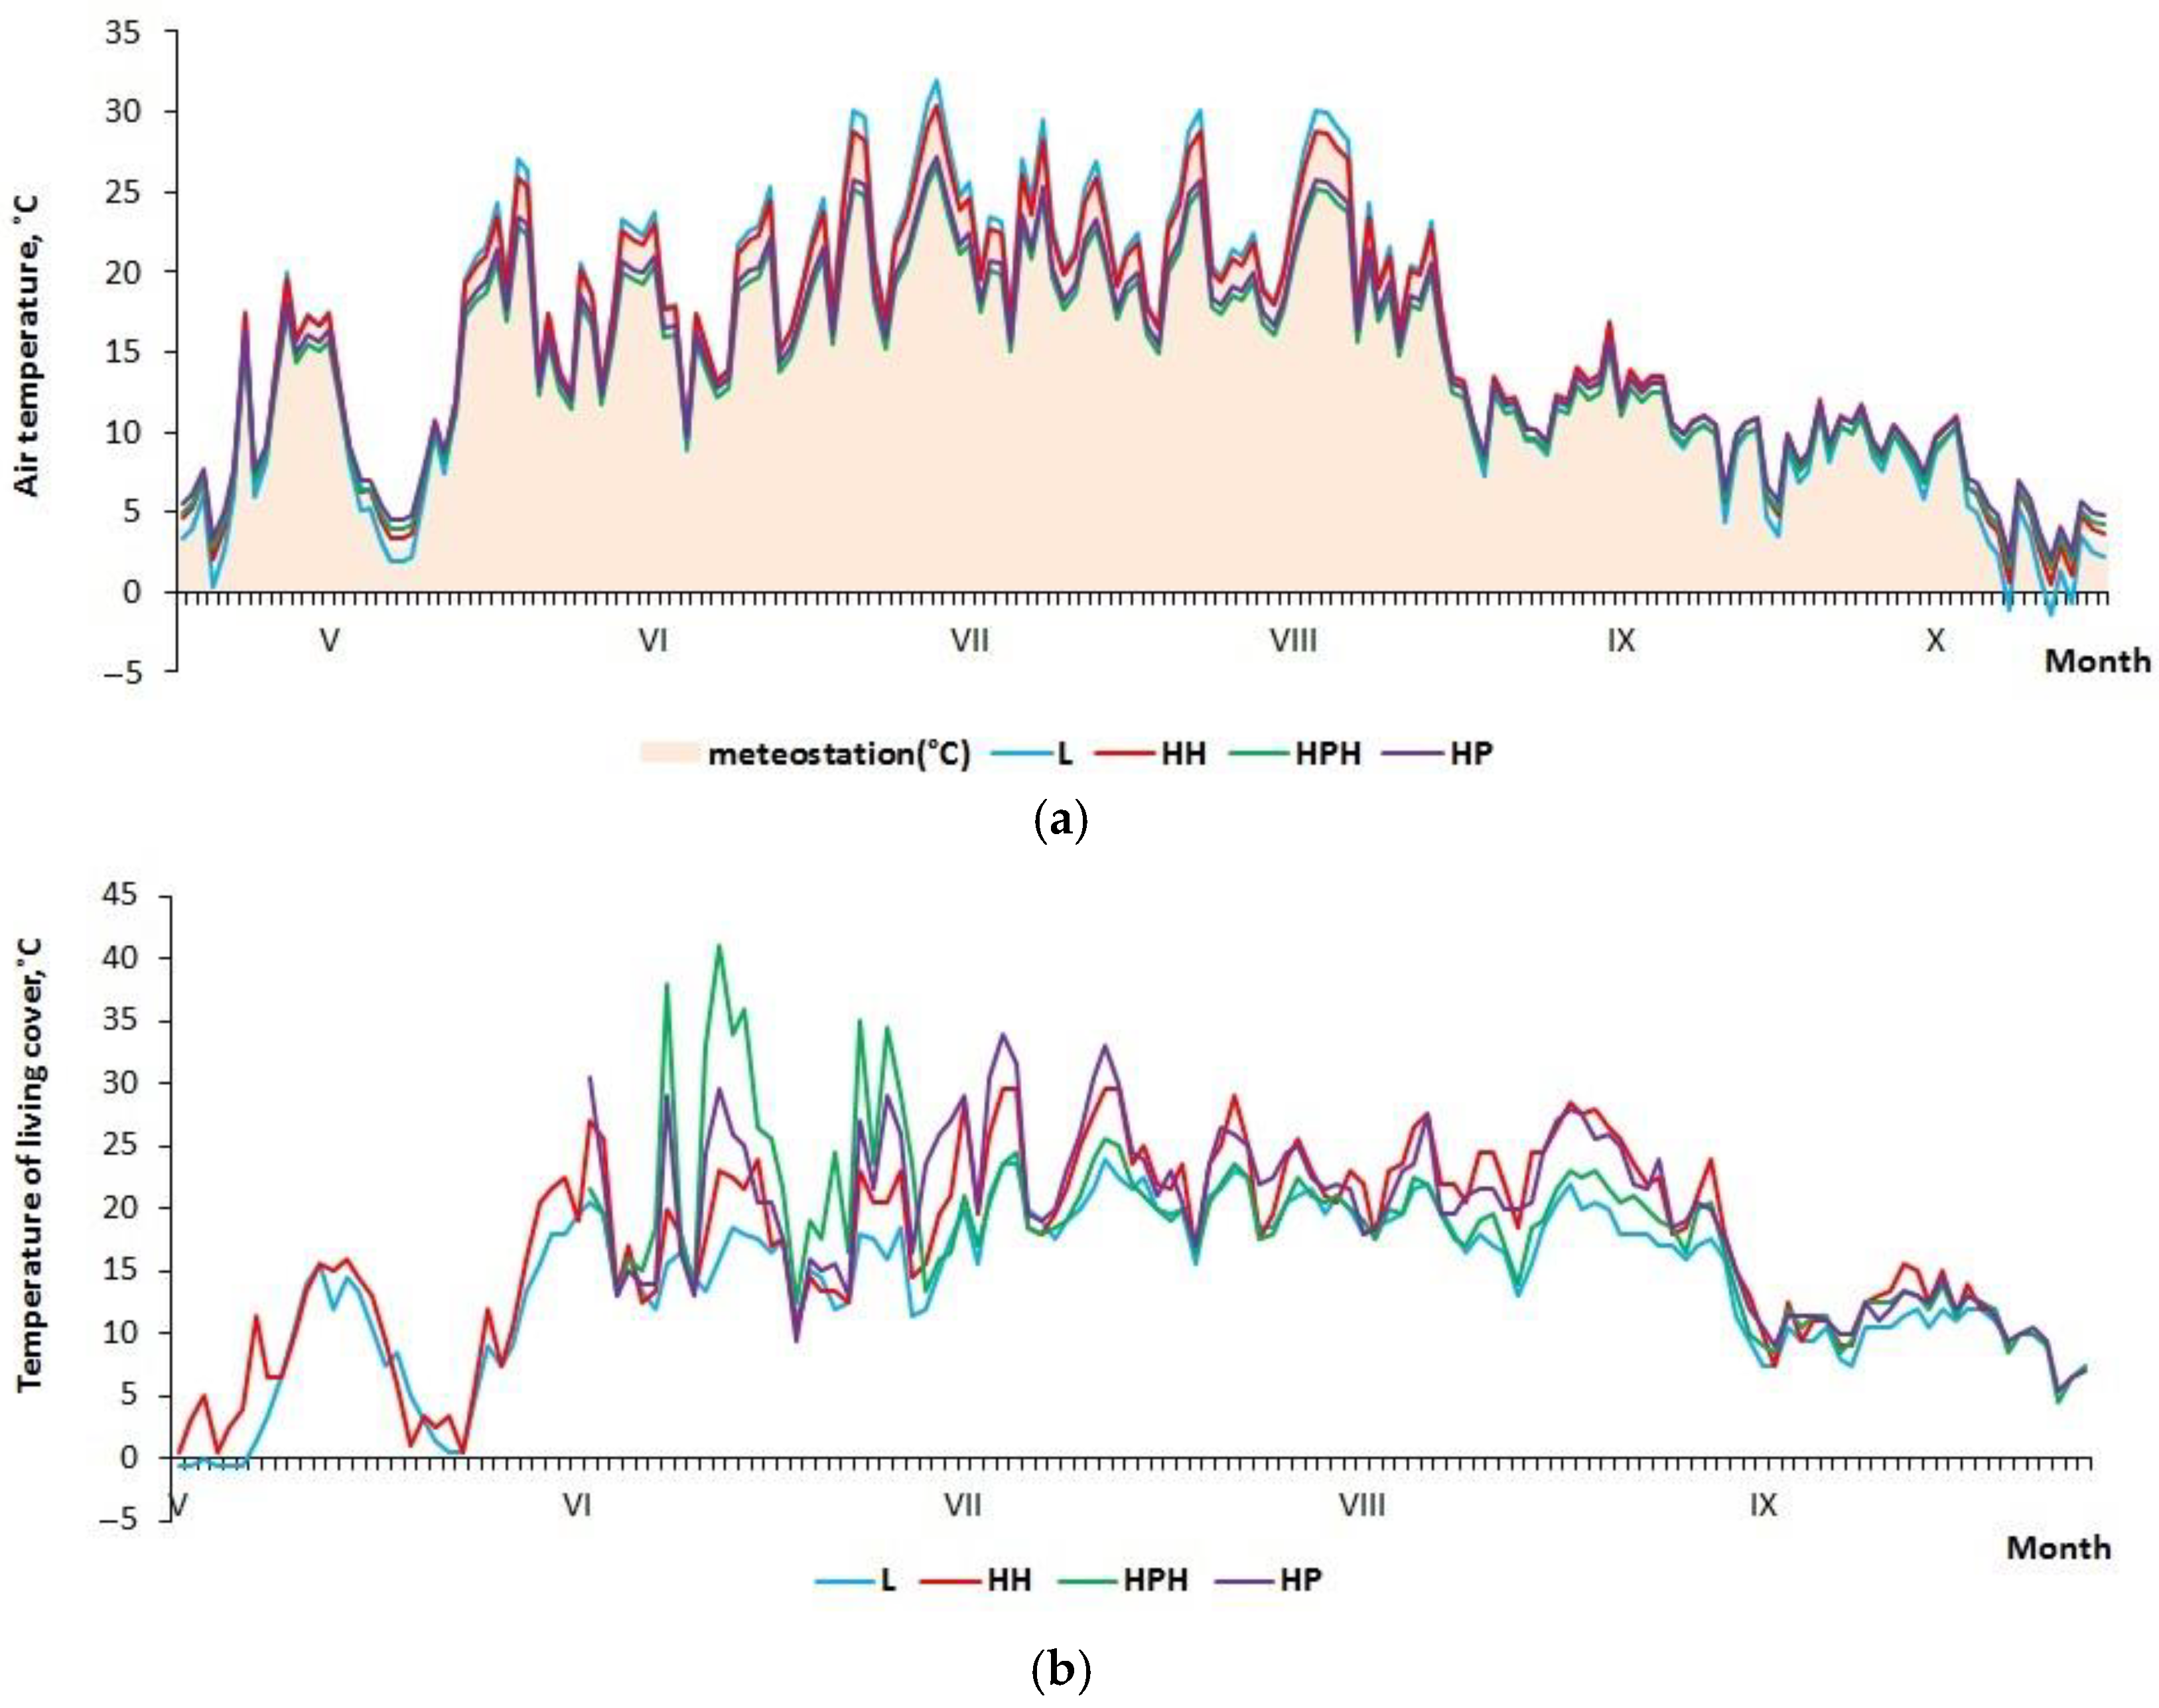
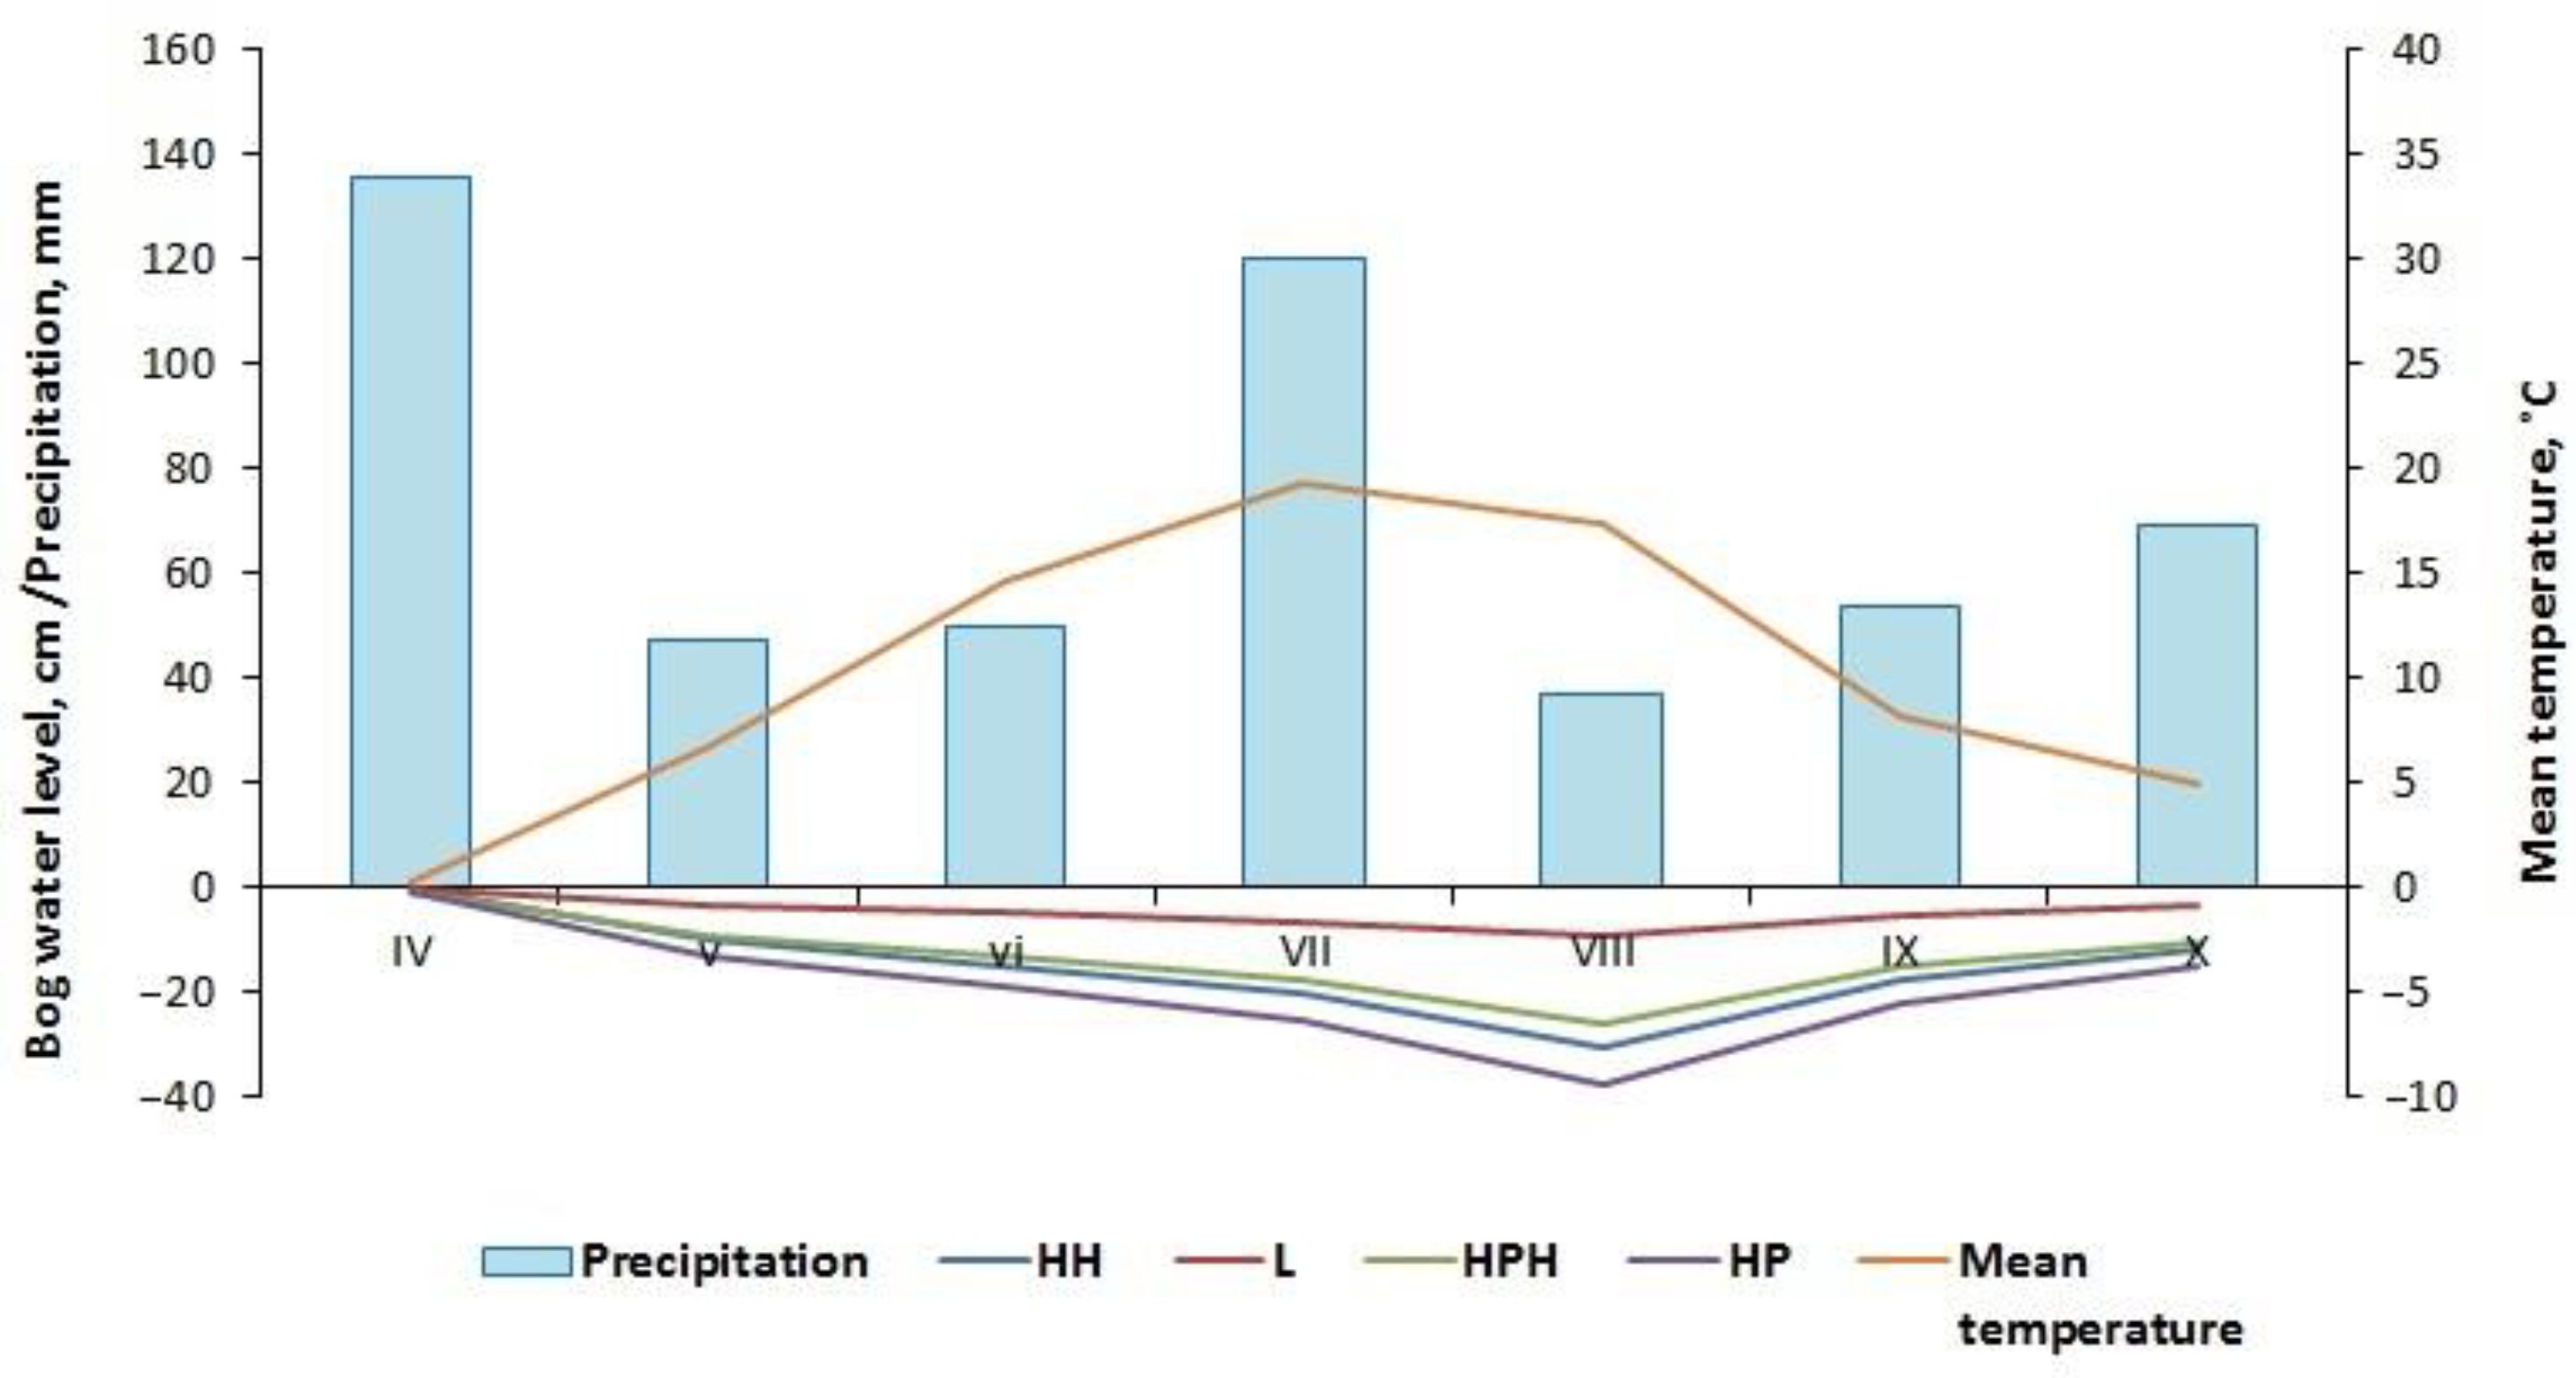
3.1. Microclimate Characteristics
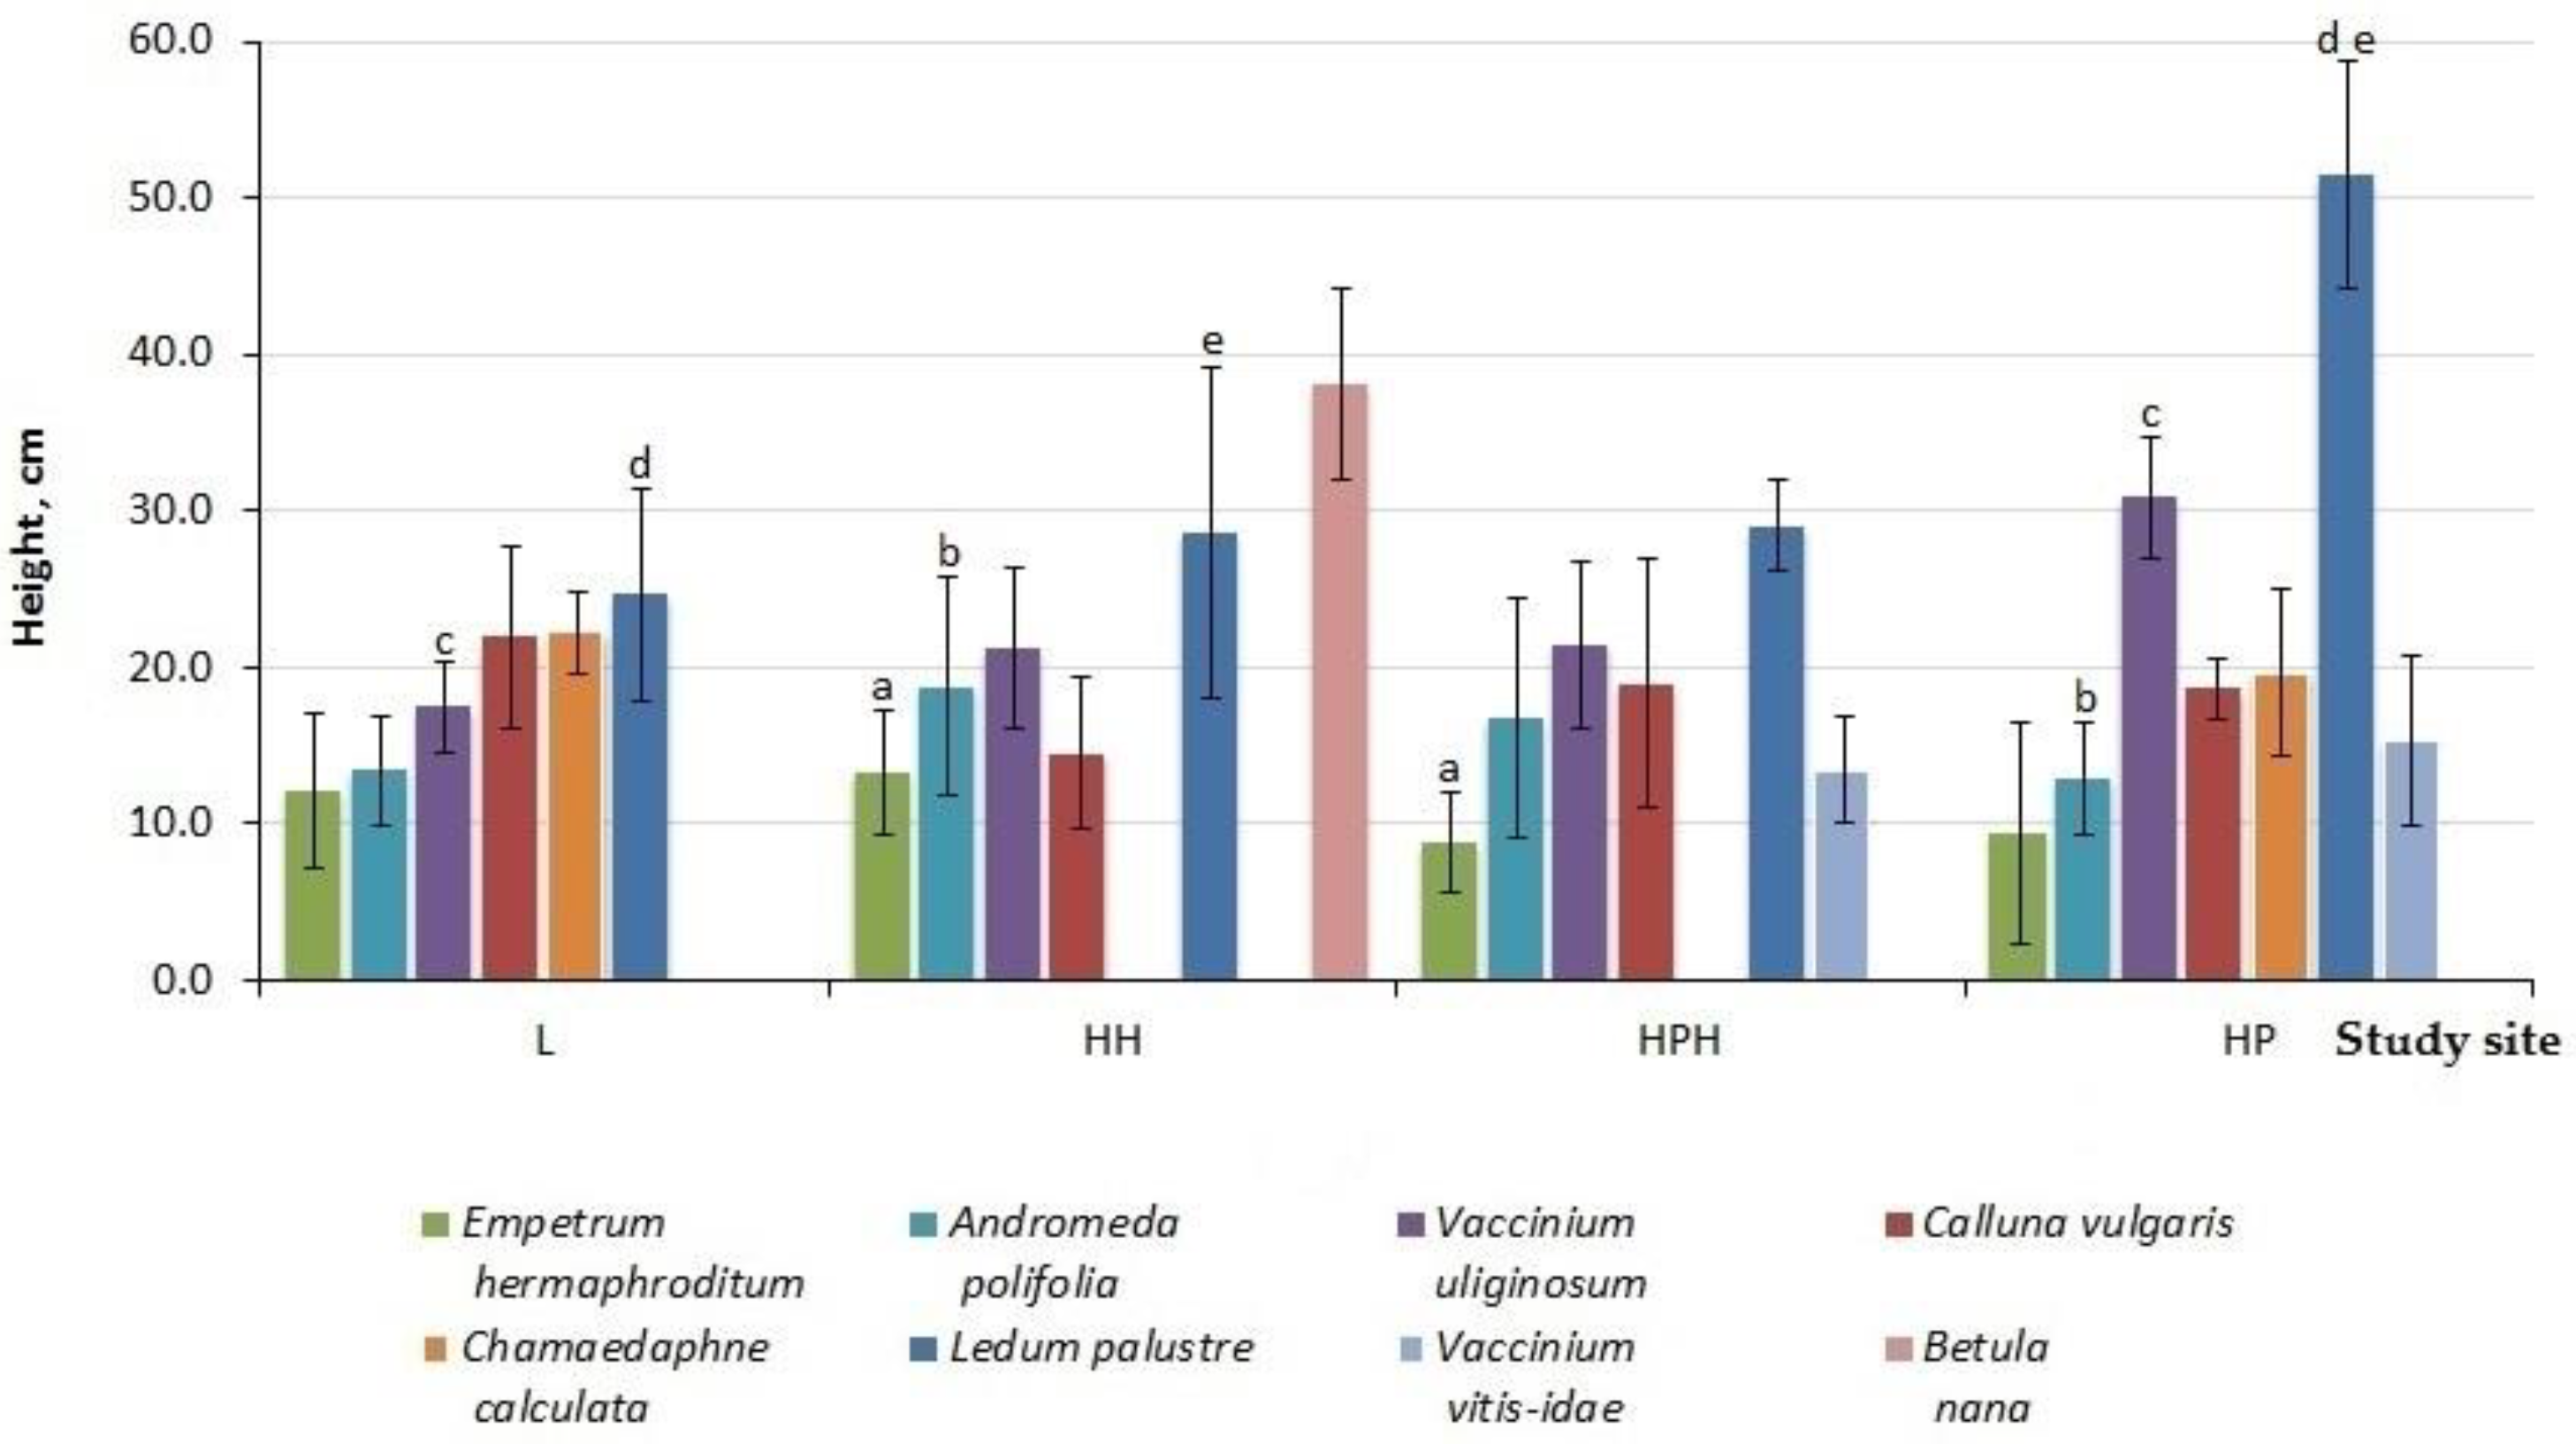
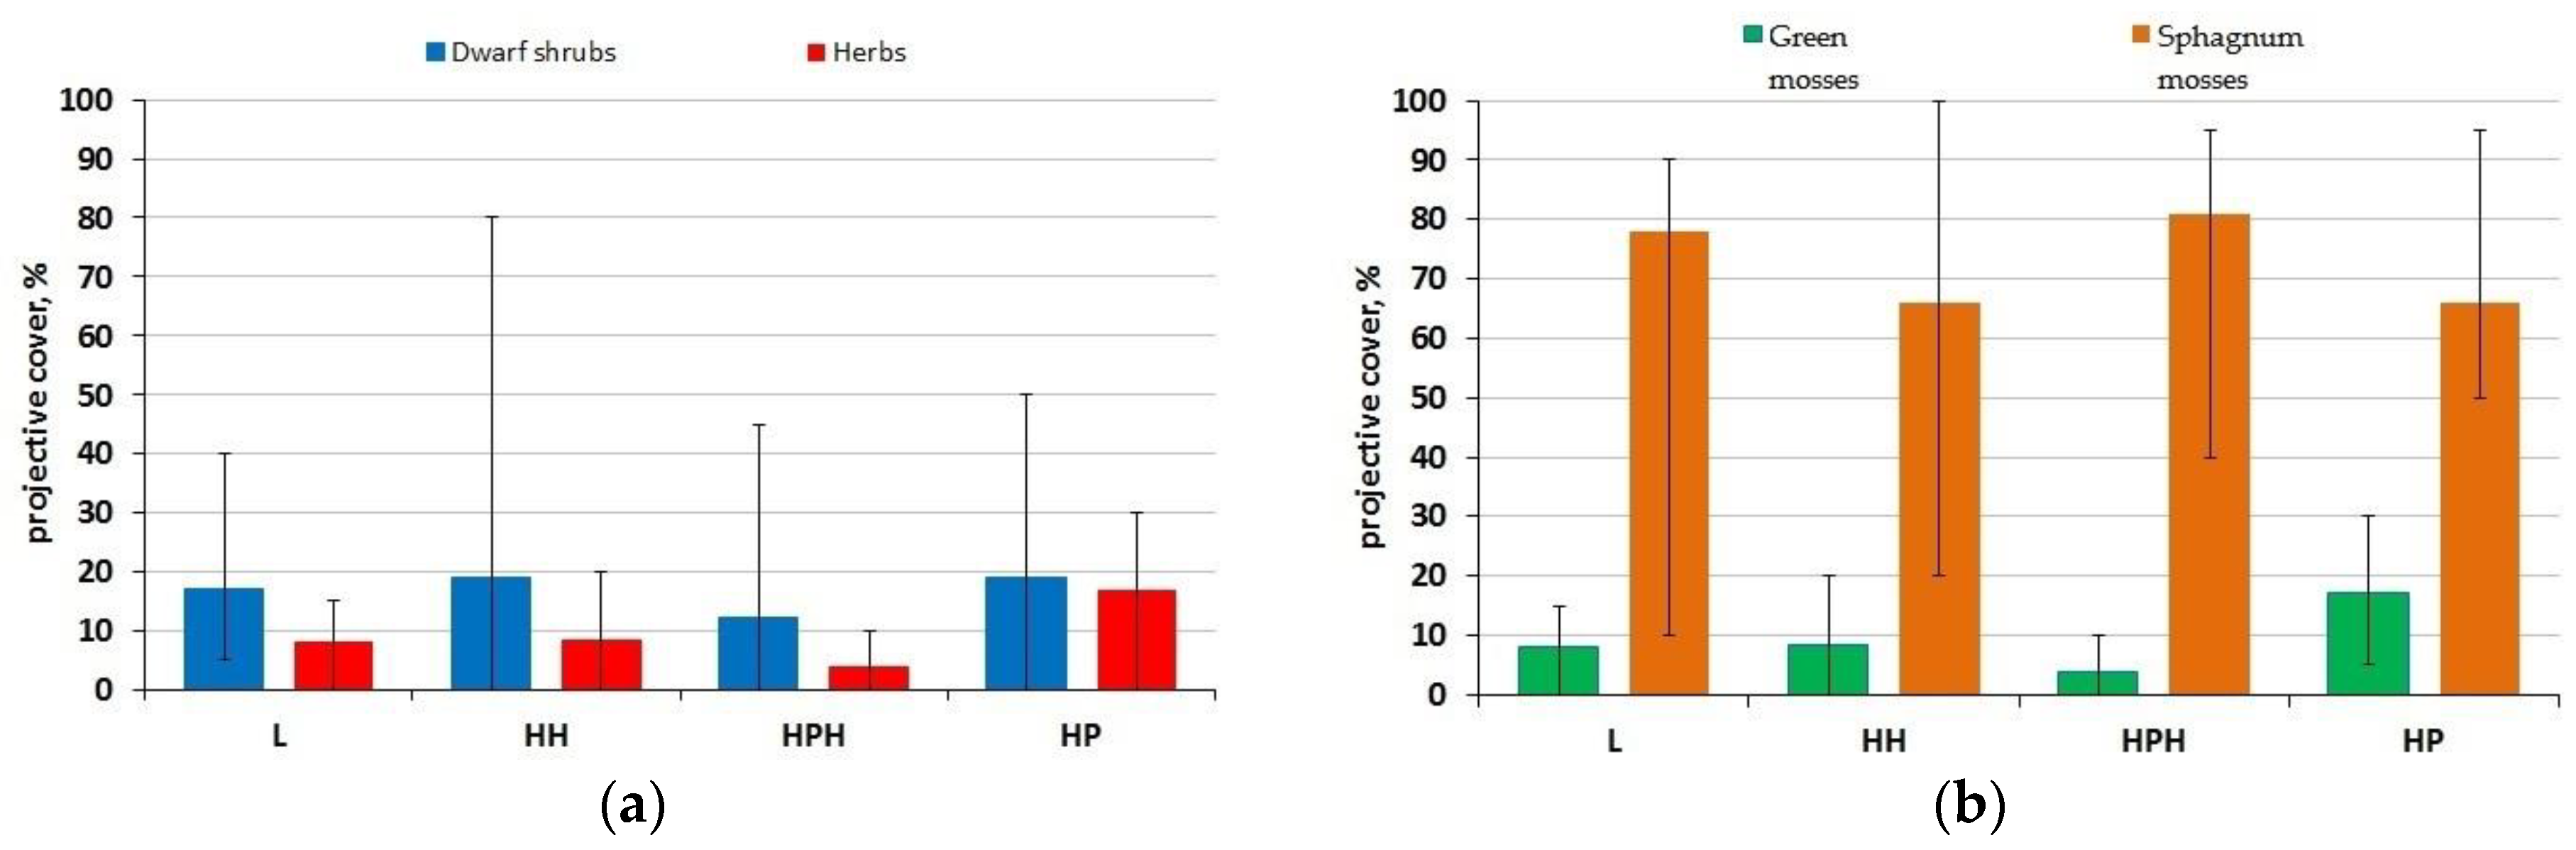
3.2. Vegetation
3.3. Peat Deposit Characteristics
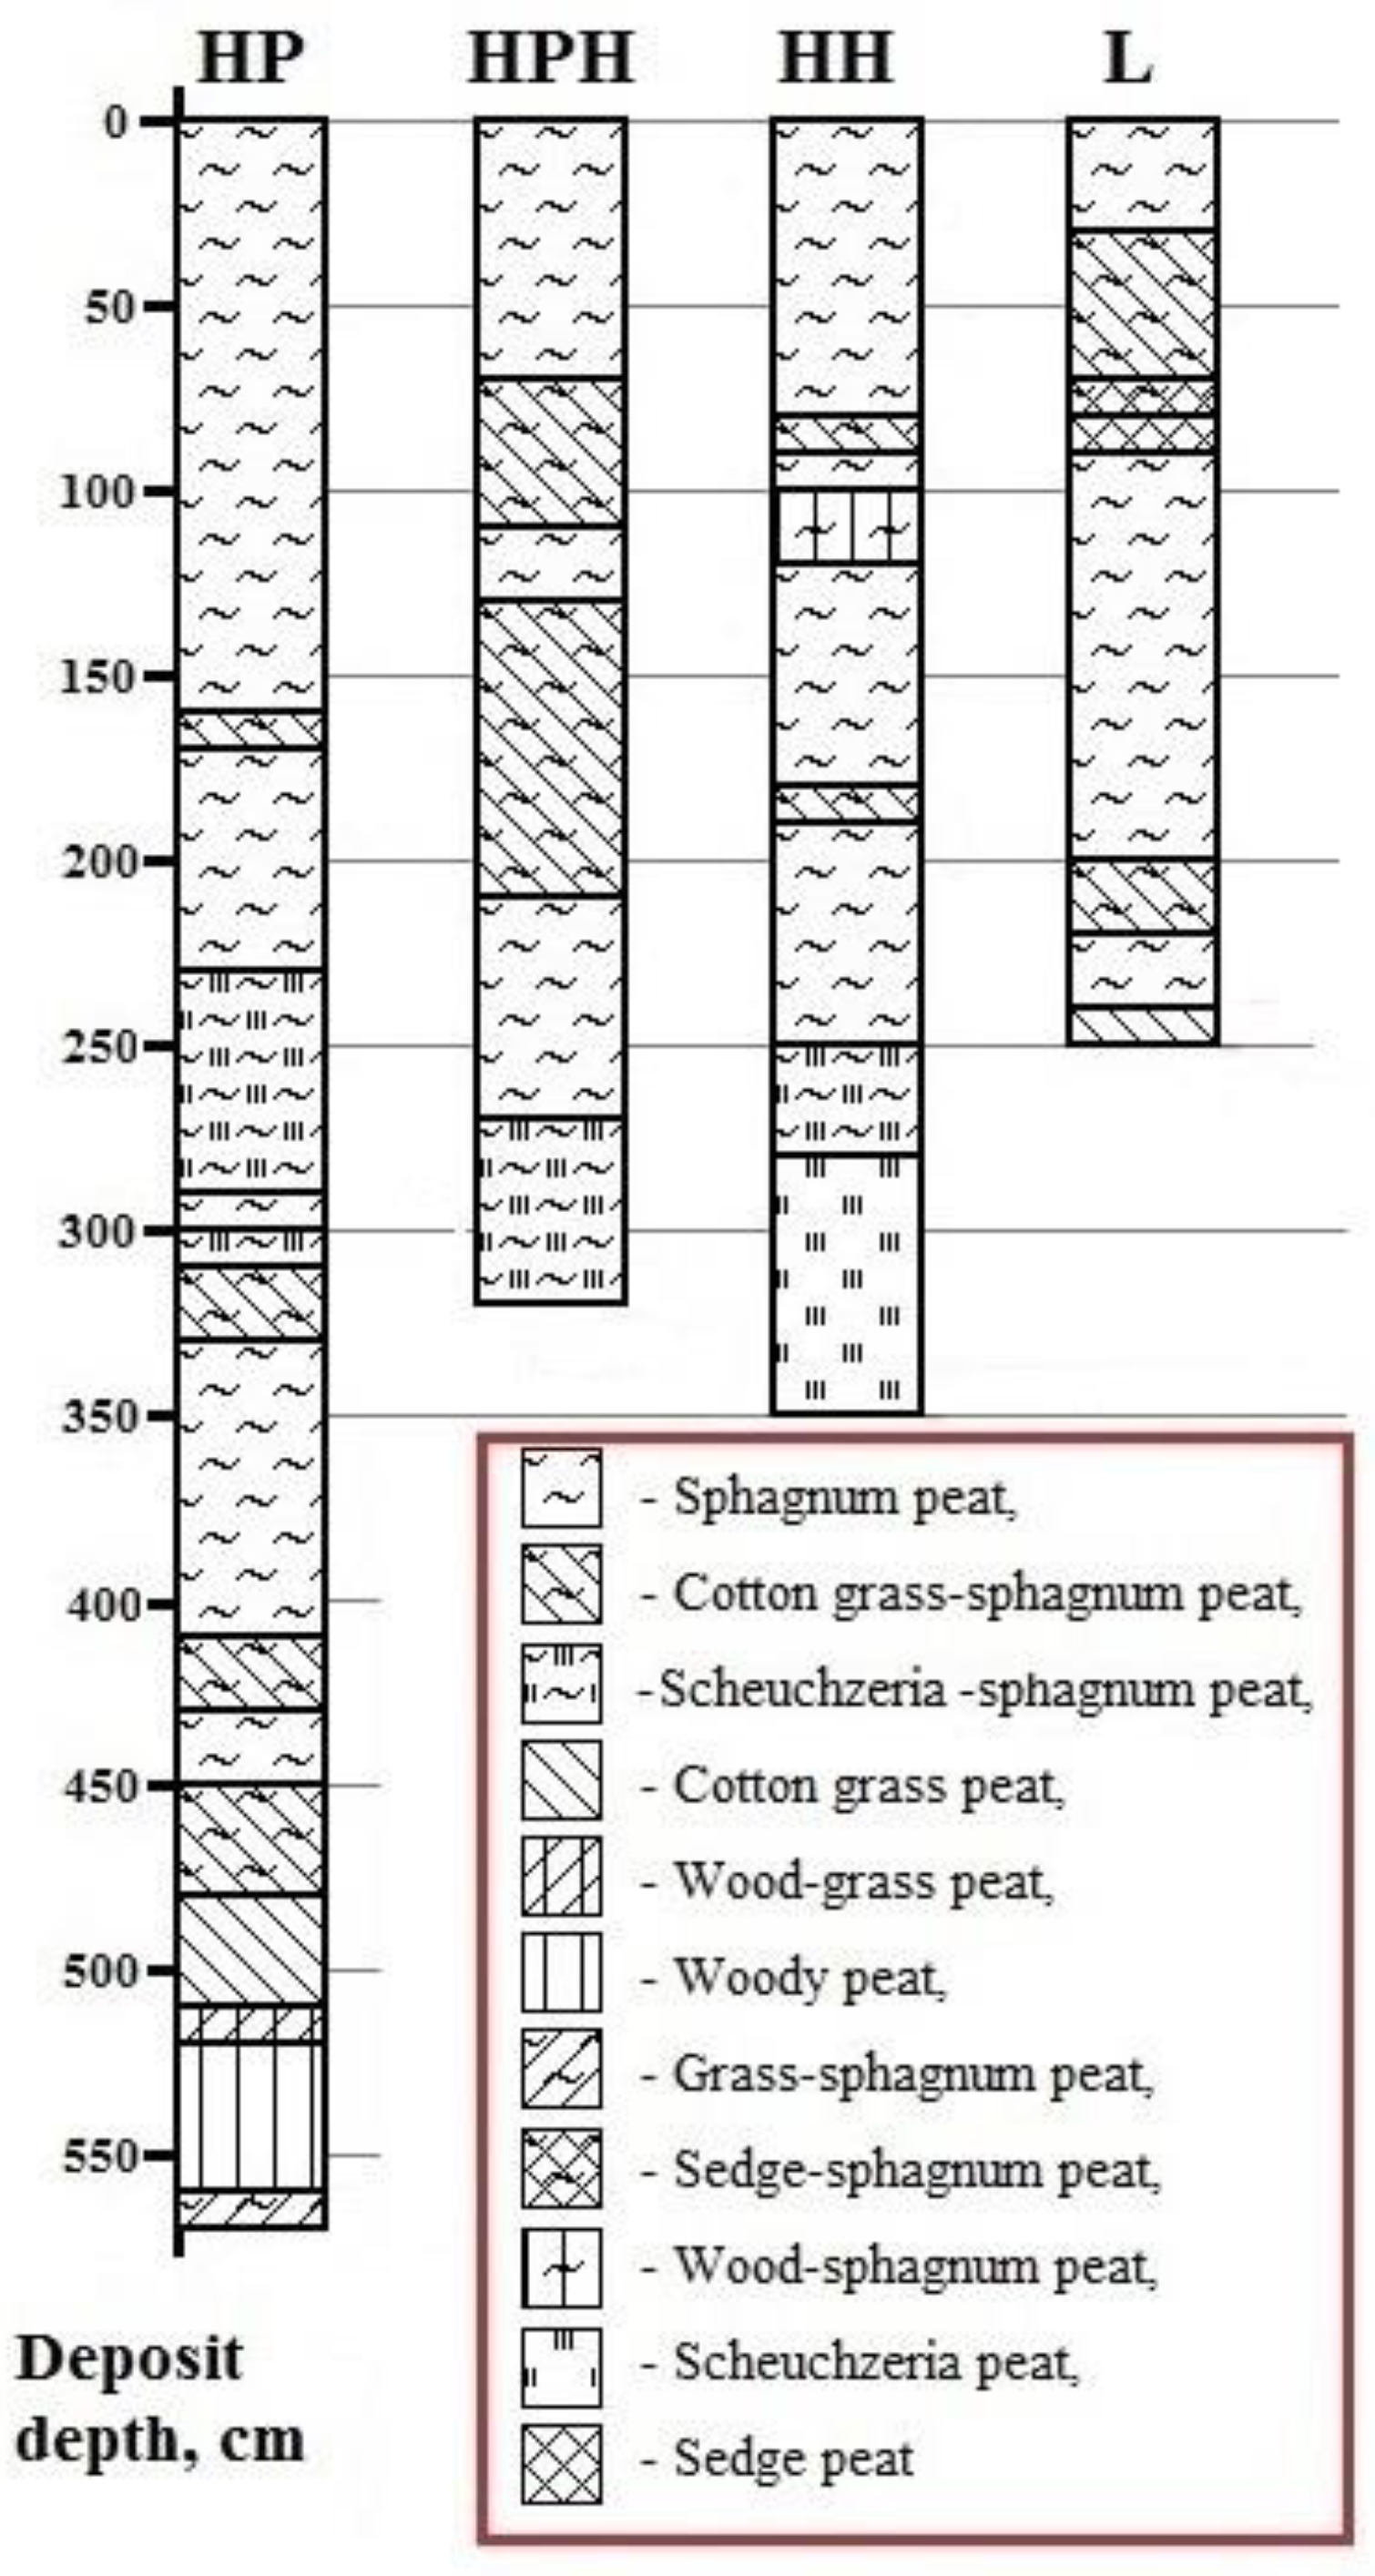
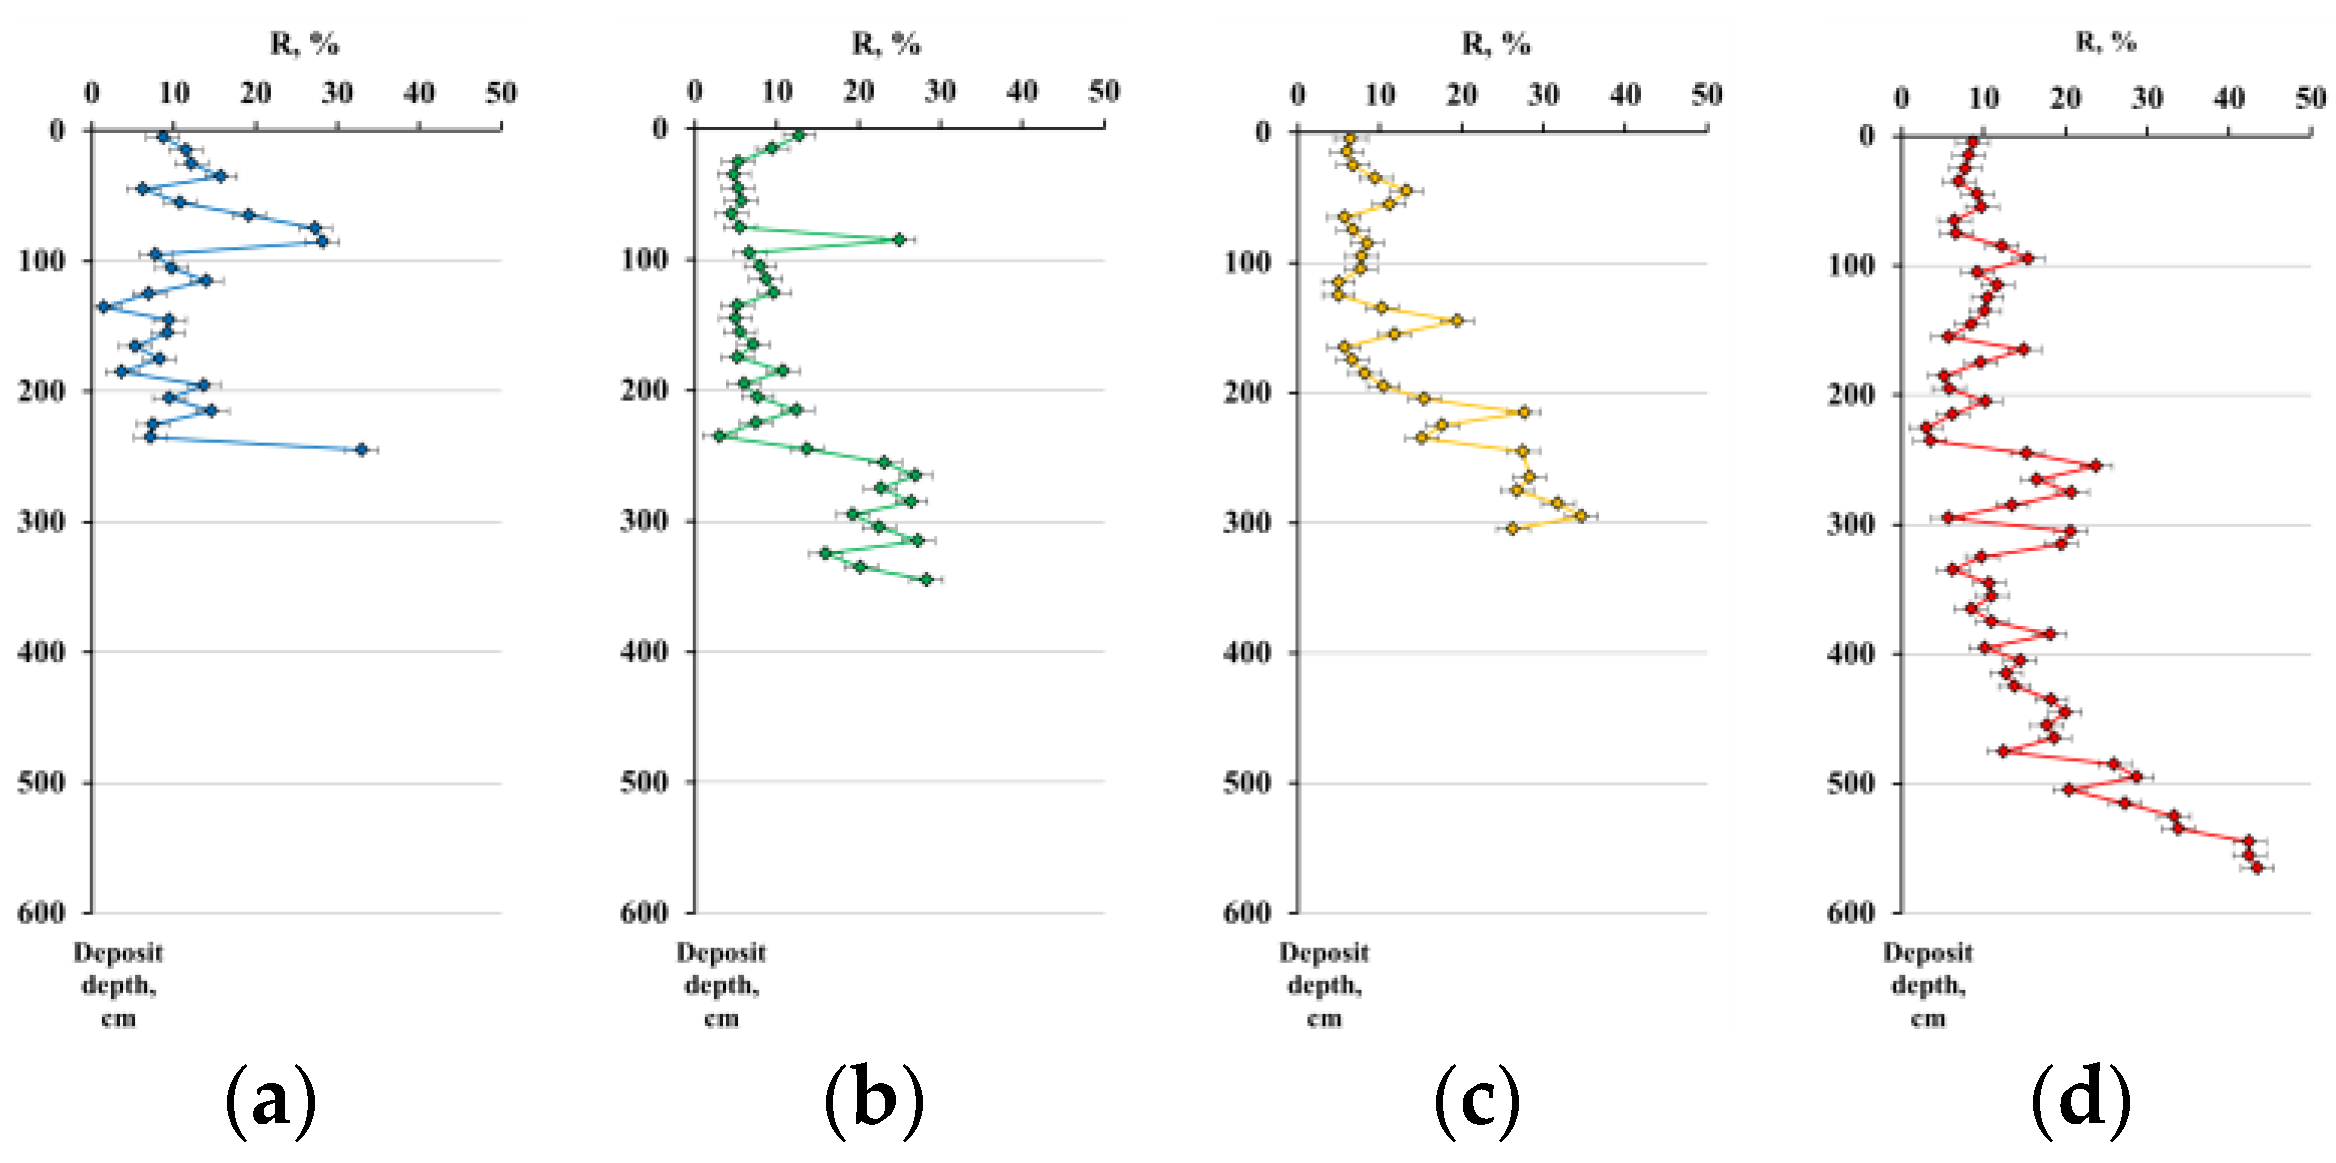
3.3.1. Age, Botanical Composition, and Degree of Decomposition of Peat
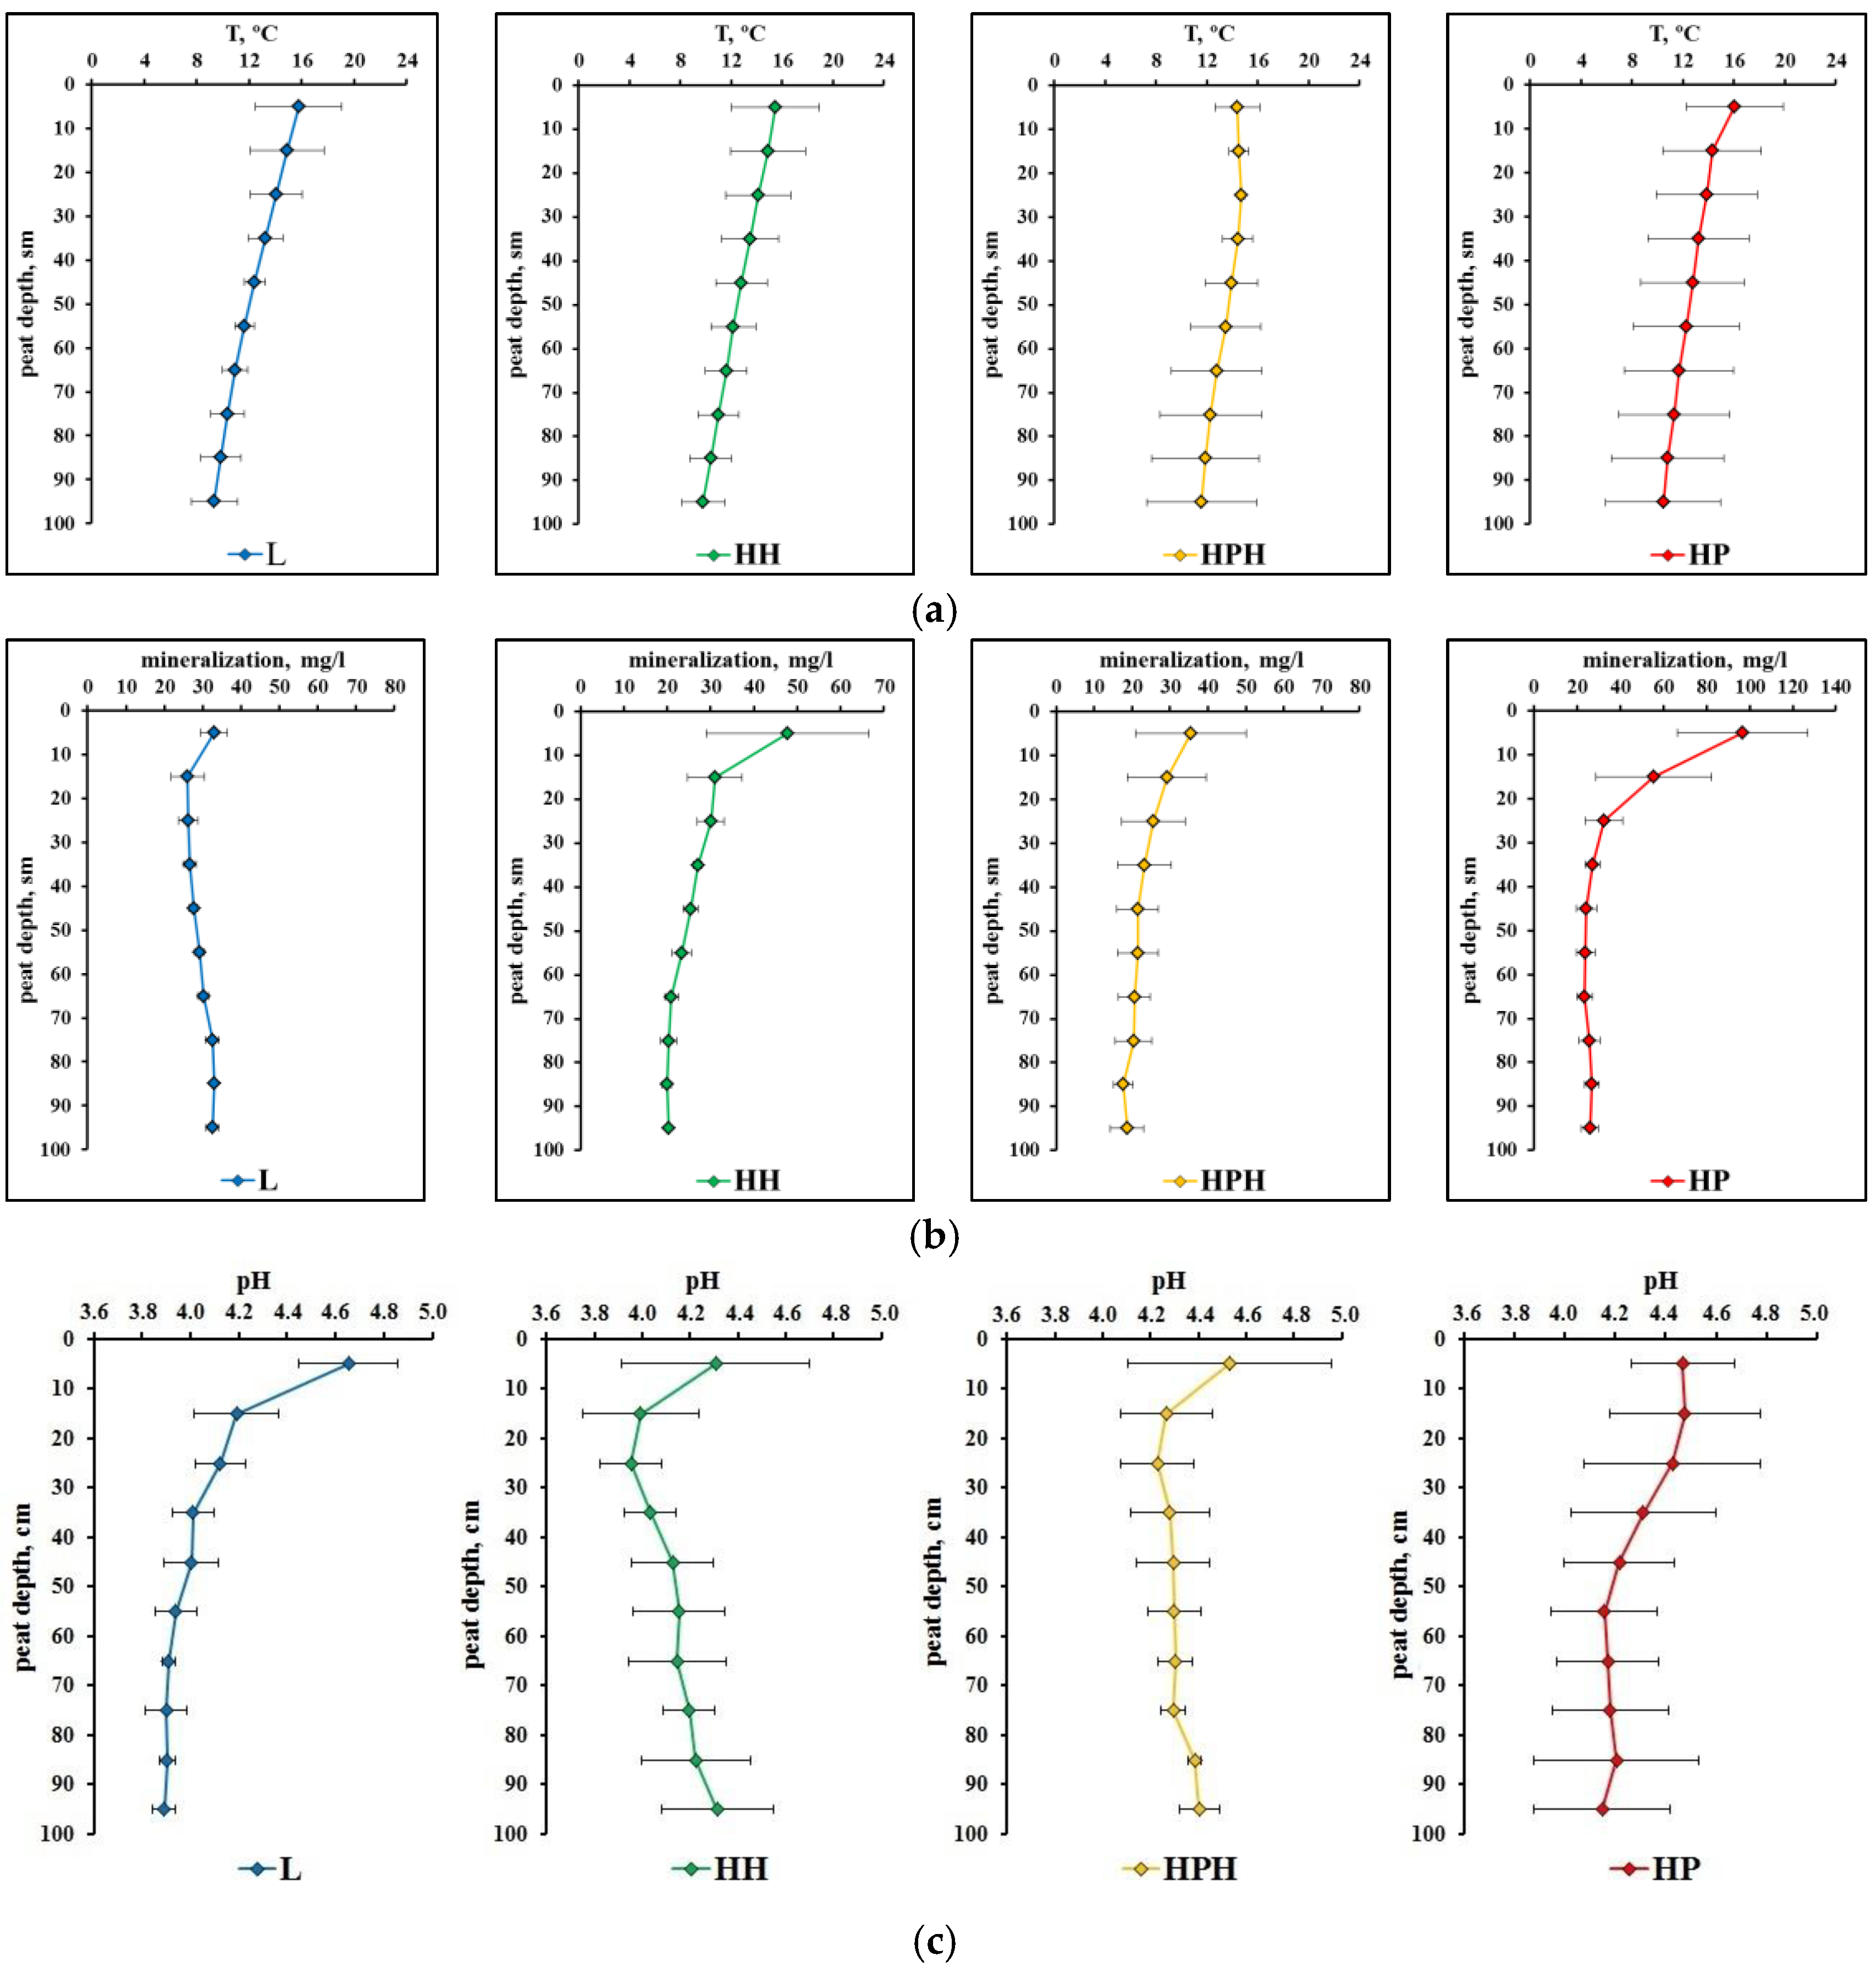
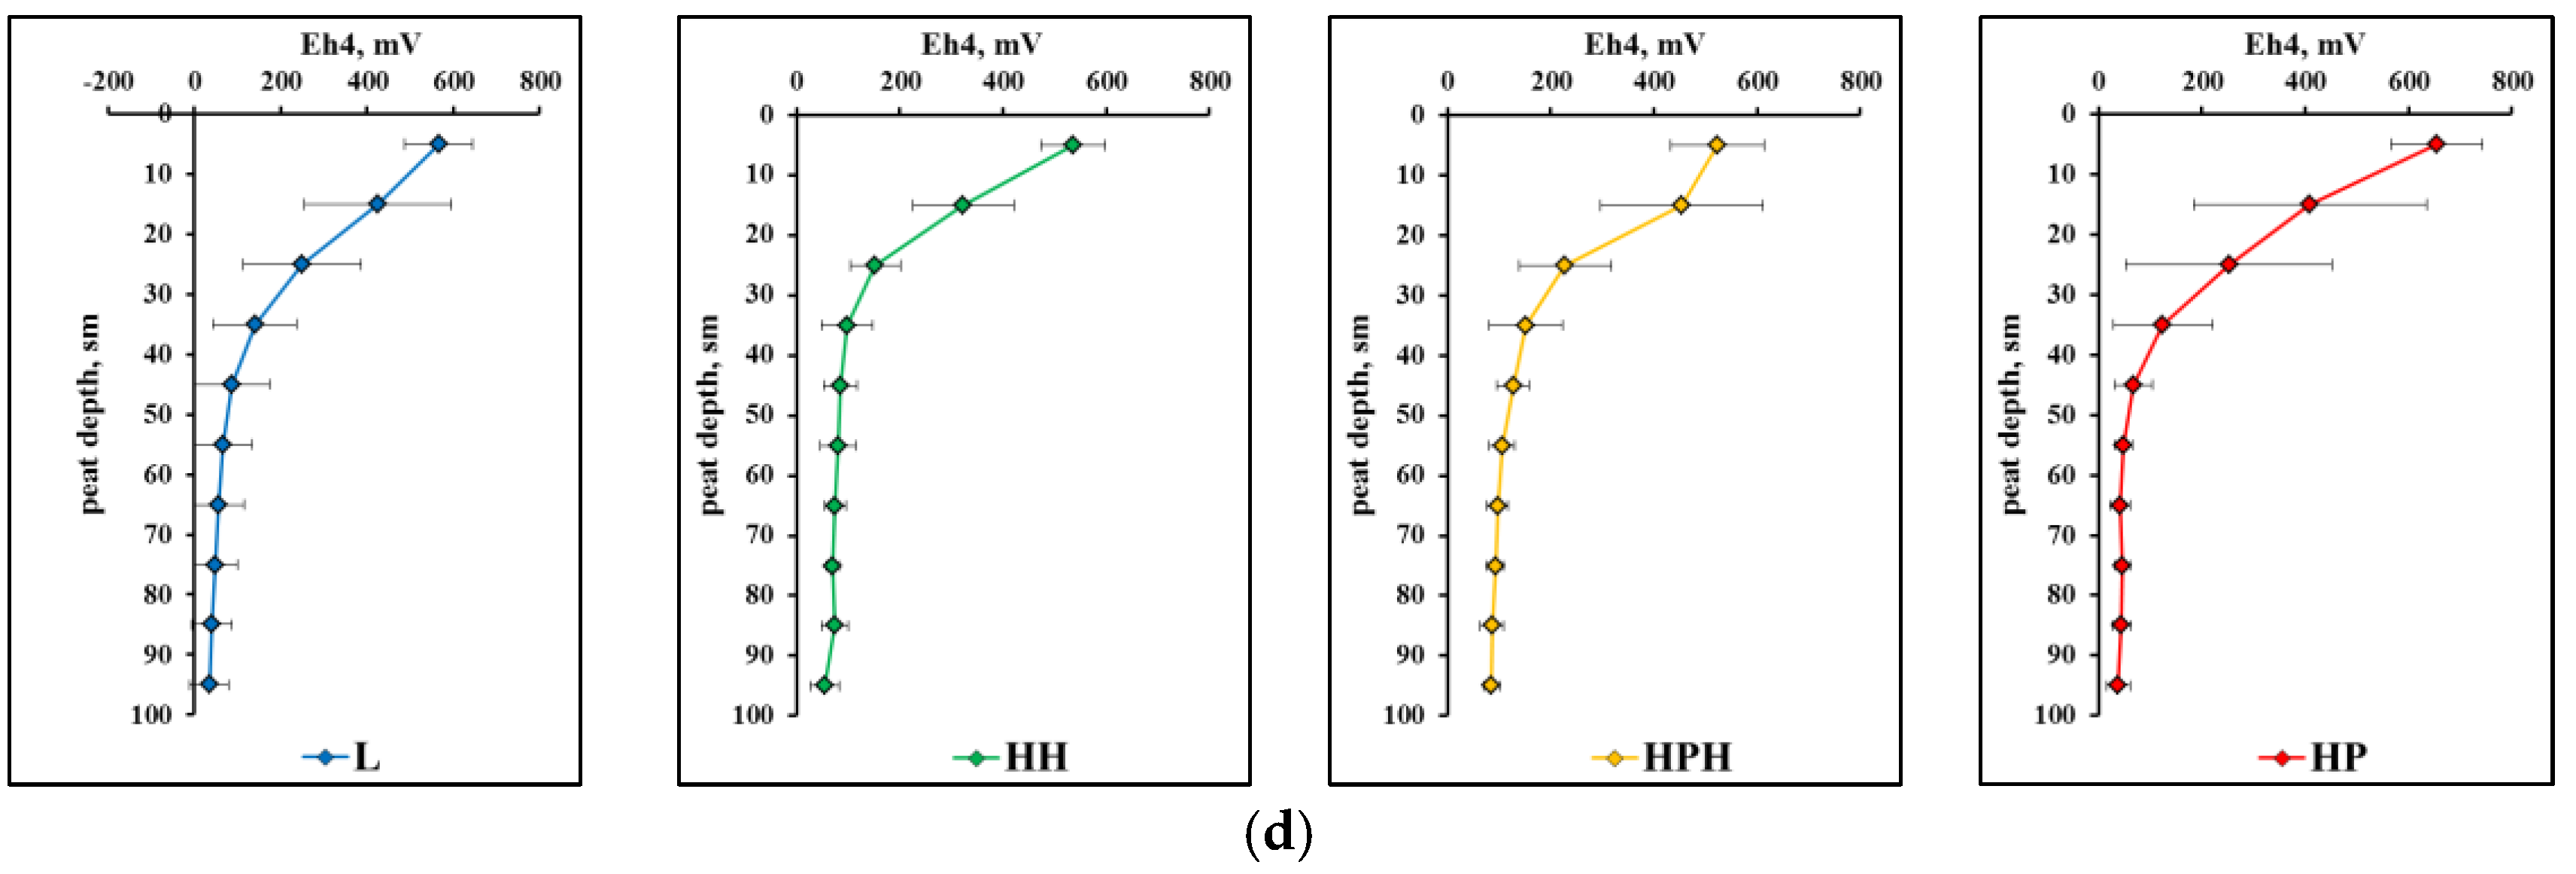
3.3.2. Physico-Chemical Characteristics of Peat Deposits
4. Discussion
4.1. Characteristics of the Components of Complex Microlandscapes
4.1.1. Similarity and Difference in the Origin, Structure, and Properties of Peat Deposits
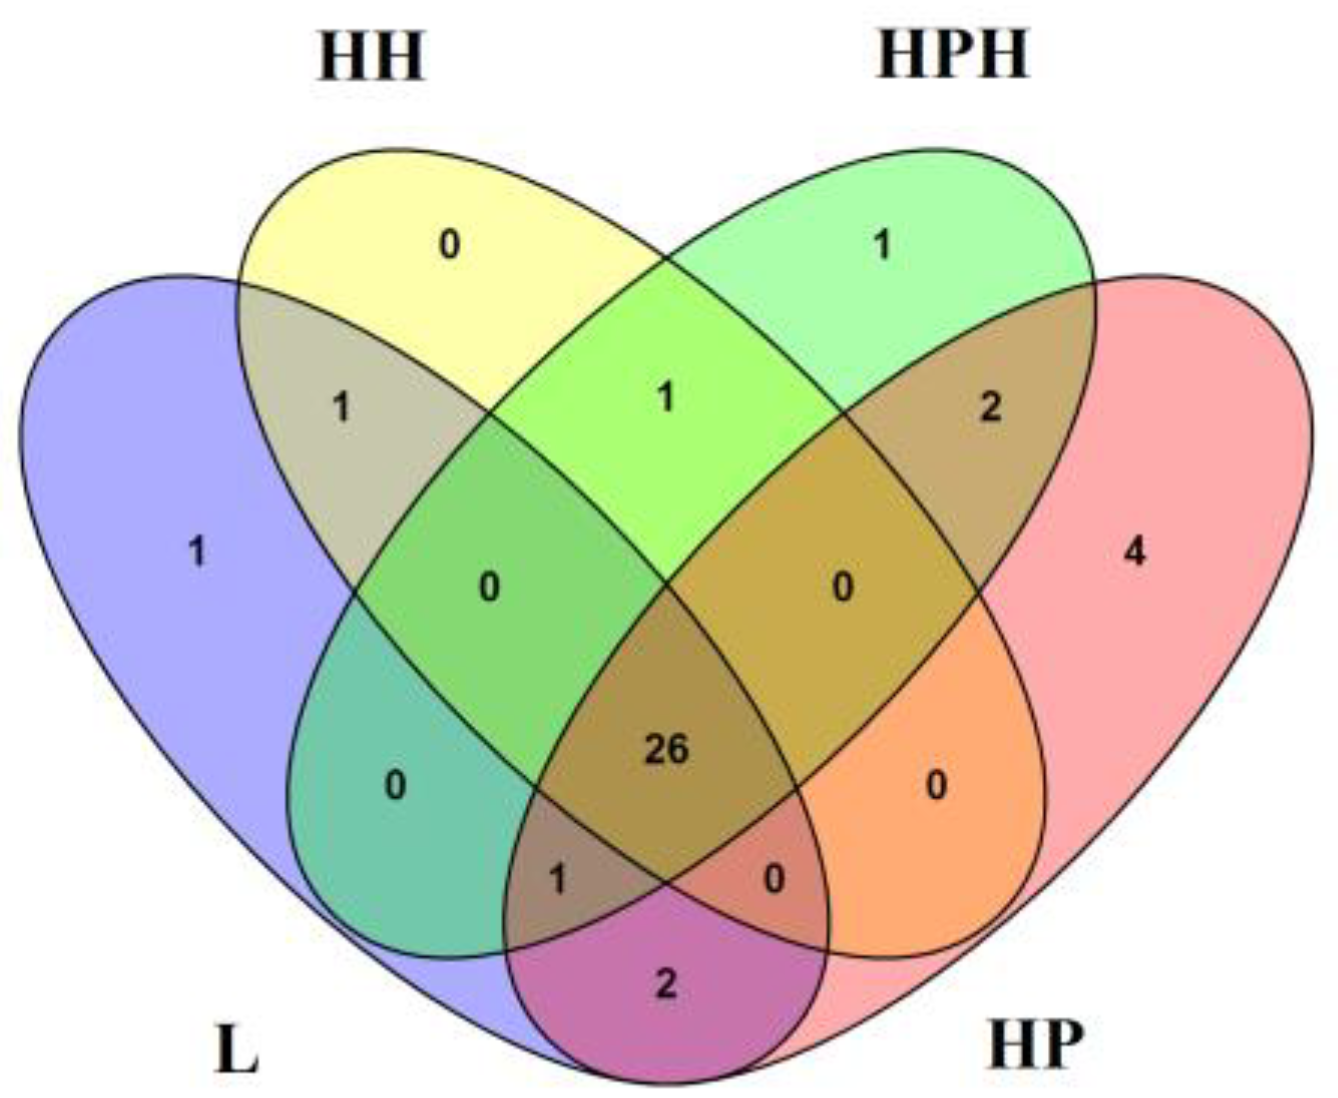
4.1.2. Similarity and Difference between Vegetation and Flora
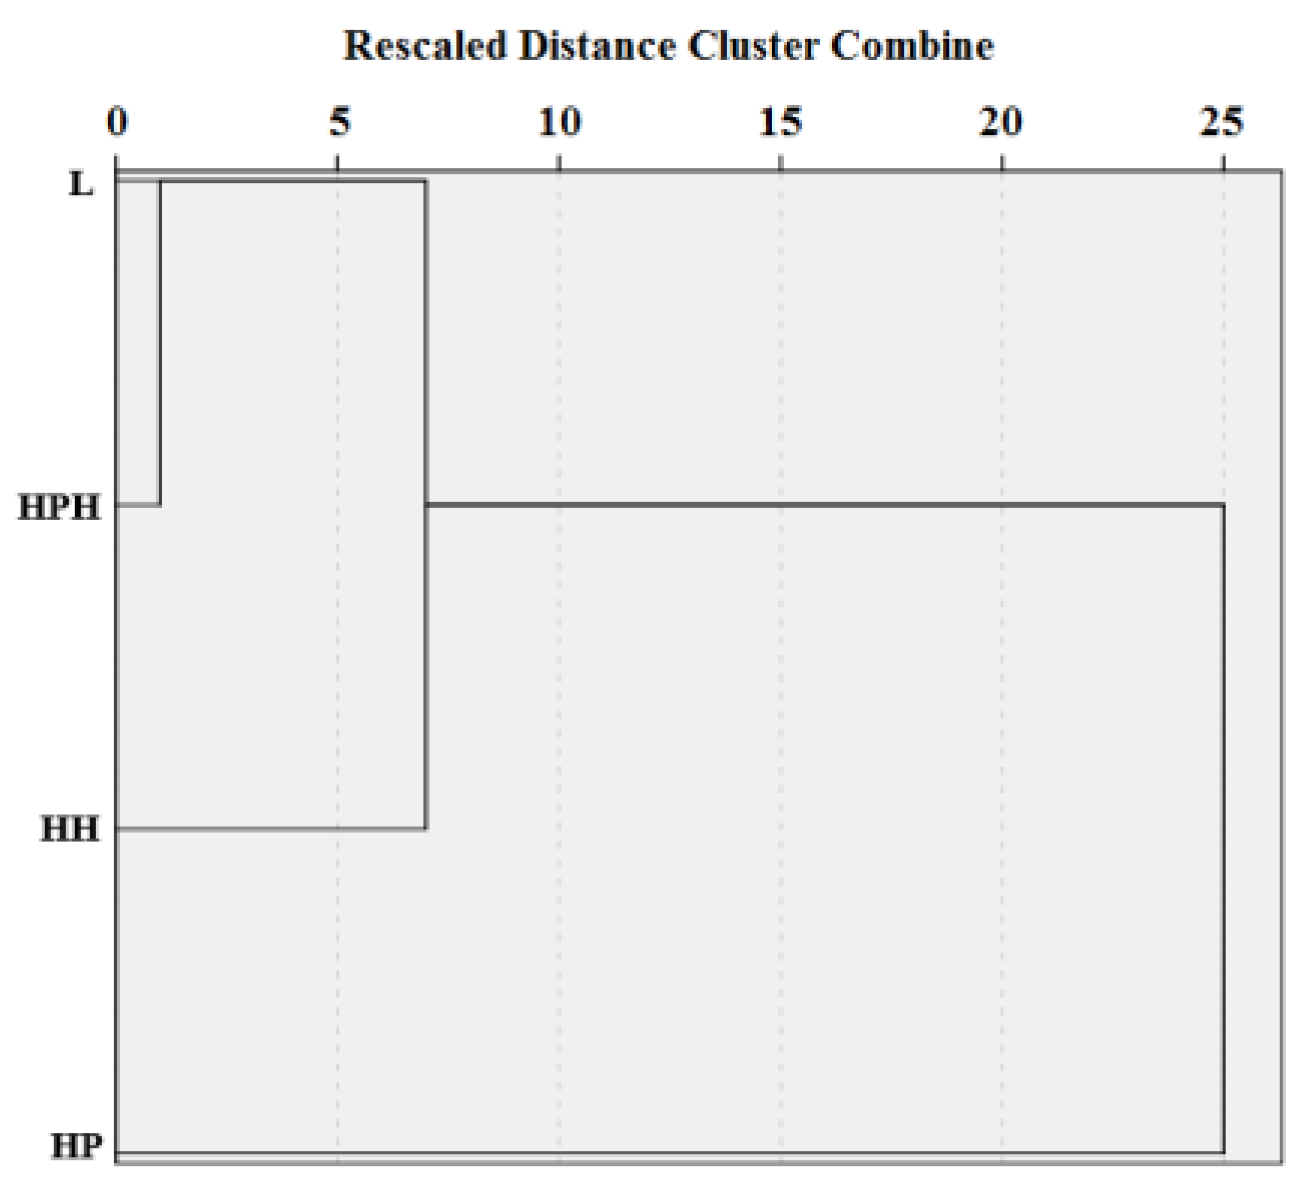
4.2. Specificity of Relationships within Complex Microlandscapes
4.3. Specificity of Interactions of Complex Microlandscapes with External Factors
5. Conclusions
Supplementary Materials
Author Contributions
Funding
Data Availability Statement
Conflicts of Interest
References
- Montoro Girona, M.; Gauthier, S.; Morin, H.; Bergeron, Y. Boreal Forests in the Face of Climate Change-Sustainable Management; Springer Nature: Cham, Switzerland, 2023; 837p. [Google Scholar] [CrossRef]
- Helbig, M.; Waddington, J.M.; Alekseychik, P.; Amiro, B.; Aurela, M.; Barr, A.G.; Black, T.A.; Carey, S.K.; Chen, J.; Chi, J.; et al. The biophysical climate mitigation potential of boreal peatlands during the growing season. Environ. Res. Lett. 2020, 15, 104004. [Google Scholar] [CrossRef]
- Glebov, F.Z. Relationship between Forest and Swamp in the Taiga Zone; Science, Siberian Branch: Novosibirsk, Russia, 1988; 184p. (In Russian) [Google Scholar]
- Yurkovskaya, T.K. The relationship of taiga forests and swamps in space and time. Proc. Samara Sci. Cent. Russ. Acad. Sci. 2012, 14, 1416–1419. (In Russian) [Google Scholar]
- Sjöberg, K.; Lars, E. Mosaic Boreal Landscapes with Open and Forested Wetlands. Ecol. Bull. 1997, 46, 48–60. [Google Scholar]
- Kuuluvainen, T.; Aapala, K.; Ahlroth, P.; Kuusinen, M.; Lindholm, T.; Sallantaus, T.; Siitonen, J.; Tukia, H. Principles of Ecological Restoration of Boreal Forested Ecosystems: Finland as an Example. Silva Fenn. 2002, 36, 409–422. [Google Scholar] [CrossRef][Green Version]
- Heiskanen, L.; Tuovinen, J.-P.; Vekuri, H.; Räsänen, A.; Virtanen, T.; Juutinen, S.; Lohila, A.; Mikola, J.; Aurela, M. Meteorological responses of carbon dioxide and methane fluxes in the terrestrial and aquatic ecosystems of a subarctic landscape. Biogeosciences 2023, 20, 545–572. [Google Scholar] [CrossRef]
- Bhatti, J.S.; Tarnocai, C. Influence of Climate and Land Use Change on Carbon in Agriculture, Forest, and Peatland. In Ecosystems across Canada in Soil Carbon Sequestration and the Greenhouse Effect, 2nd ed.; Lal, R., Follett, F.R., Eds.; Soil Science Society of America: Madison, WI, USA, 2009; Volume 57. [Google Scholar] [CrossRef]
- Bhatti, J.; Jassal, R.; Black, T.A. Decarbonization of the Atmosphere: Role of the Boreal Forest Under Changing Climate. In Recarbonization of the Biosphere; Lal, R., Lorenz, K., Hüttl, R., Schneider, B., von Braun, J., Eds.; Springer: Dordrecht, The Netherlands, 2012; pp. 203–228. [Google Scholar] [CrossRef]
- Nikiforova, L.D. Some issues of environmental change and peat formation in the north of the Russian Plain. Swamps Eur. North USSR Struct. Genes. Dyn. 1980, 66, 155–177. (In Russian) [Google Scholar]
- Lepin, L.Y. Peat fund of the Karelian ASSR. In Peat Cadastre of the RSFSR: Karelian ASSR; The Institute of Biology of the Karelian Branch of the Academy of Sciences of the USSR: Nedra, Moscow, 1957; pp. 5–25. (In Russian) [Google Scholar]
- Yurkovskaya, T.K. Geography and Cartography of Mire Vegetation of the European Russia and Neighbouring Territories; Publishing House of the Komarov Botanical Institute: Saint Petersburg, Russia, 1992; 256p. (In Russian) [Google Scholar]
- Yurkovskaya, T.K. Types of bog massifs on an overview map of the vegetation cover of the forest zone of the European part of the USSR. In Types of Swamps of the USSR and Principles of Their Classification; Nauka, Leningrad Branch: Leningrad, Russia, 1974; pp. 57–62. (In Russian) [Google Scholar]
- Kuhry, P.; Turunen, J. The Postglacial Development of Boreal and Subarctic Peatlands. In Boreal Peatland Ecosystems; Wieder, R.K., Vitt, D.H., Eds.; Springer: Berlin, Germany, 2006; 436p. [Google Scholar]
- Smagin, V.A.; Noskova, M.G.; Antipin, V.K.; Boychuk, M.A. Diversity and phytosociological role of mosses in mires of southwestern Arkhangelsk region and adjacent territories. Trans. Karelian Res. Cent. Russ. Acad. Sci. 2017, 1, 75–96. (In Russian) [Google Scholar] [CrossRef]
- Yu, Z.; Beilman, D.W.; Frolking, S.; MacDonald, G.M.; Roulet, N.T.; Camill, P.; Charman, D.J. Peatlands and Their Role in the Global Carbon Cycle. EOS Trans. 2011, 92, 97–98. [Google Scholar] [CrossRef]
- Yu, Z. Northern peatland carbon stocks and dynamics: A review. Biogeosciences 2012, 9, 4071–4085. [Google Scholar] [CrossRef]
- Jensen, M.; Demidov, I.N.; Larsen, E.; Lyså, A. Weichselian glaciers, lakes and sea level in the Arkhangelsk region: Correlation potential and challenges. Correl. Pleistocene Events Russ. North 2006, 44–45. [Google Scholar]
- Panova, N.; Antipina, T.; Jankovska, V.; Panova, N.; Yankovska, V. Holocene history of the environment and development of bogs on the eastern slope of the Polar and Pre-Polar Urals. Environ. Dyn. Glob. Clim. Chang. 2010, 1, 8. [Google Scholar] [CrossRef][Green Version]
- Katz, N.Y. Types of Bogs of the USSR and Western Europe and Its Geographical Distribution; State Publishing House of Geographical Literature: Moscow, Russia, 1948; 318p. (In Russian) [Google Scholar]
- Halsey, L.A.; Vitt, D.H.; Gignac, L.D. Sphagnum-dominated peatlands in North America since the Last Glacial Maximum: Their occurrence and extent. Bryologist 2000, 103, 334–352. [Google Scholar] [CrossRef]
- Almquist-Jacobson, H.; Foster, D. Towards an integrated model for raised-bog development: Theory and field evidence. Ecology 1995, 76, 161–174. [Google Scholar] [CrossRef]
- Couwenberg, J.; Joosten, H. Self-Organization in Raised Bog Patterning: The Origin of Microtope Zonation and Mesotope Diversity. J. Ecol. 2005, 93, 1238–1248. [Google Scholar] [CrossRef]
- Runkle, B.; Wille, C.; Gazovic, M.; Wilmking, M.; Kutzbach, L. The surface energy balance and its drivers in a boreal peatland fen of northwestern Russia. J. Hydrol. 2014, 511, 359–373. [Google Scholar] [CrossRef]
- Wu, J.; Roulet, N.; Moore, T.; Lafleur, P.; Humphreys, E. Dealing with microtopography of an ombrotrophic bog for simulating ecosystem-level CO2 exchanges. Ecol. Model. 2011, 222, 1038–1047. [Google Scholar] [CrossRef]
- Gorham, E. Northern peatlands: Role in the carbon cycle and probable responses to climatic warming. Ecol. Appl. 1991, 1, 182–195. [Google Scholar] [CrossRef]
- Foster, D.R.; Wright, H.E., Jr. Role of Ecosystem Development and Climate Change in Bog Formation in Central Sweden. Ecology 1990, 71, 450–463. [Google Scholar] [CrossRef]
- Gorham, E. The Development of Peat Lands. Q. Rev. Biol. 1957, 32, 145–166. [Google Scholar] [CrossRef]
- Mäkilä, M.; Säävuori, H.; Grundström, A.; Suomi, T. Sphagnum decay patterns and bog microtopography in south-eastern Finland. Mires Peat 2018, 21, 13. [Google Scholar] [CrossRef]
- Shi, X.; Thornton, P.; Ricciuto, D.; Hanson, P.; Mao, J.; Sebestyen, S.; Griffiths, N.; Bisht, G. Representing northern peatland microtopography and hydrology within the Community Land Model. Biogeosciences 2015, 12, 6463–6477. [Google Scholar] [CrossRef]
- Kokkonen, N.; Laine, A.M.; Männistö, E.; Mehtätalo, L.; Korrensalo, A.; Tuittila, E.-S. Two Mechanisms Drive Changes in Boreal Peatland Photosynthesis Following Long-Term Water Level Drawdown: Species Turnover and Altered Photosynthetic Capacity. Ecosystems 2022, 25, 1601–1618. [Google Scholar] [CrossRef]
- Dendievel, A.-M.; Argant, J.; Dietre, B.; Delrieu, F.; Jouannic, G.; Lemdahl, G.; Mennessier-Jouannet, C.; Mille, P.; Haas, J.N.; Cubizolle, H. Multi-proxy study of the Pialeloup Bog (SE Massif Central, France) reveals long-term human environmental changes affecting peat ecosystems during the Holocene. Quat. Int. 2022, 636, 118–133. [Google Scholar] [CrossRef]
- The Weather and Climate. Available online: http://www.pogodaiklimat.ru (accessed on 15 April 2023).
- Markov, M.L. Long-Term Changes in the Elements of the Water Balance at Water Balance and Bog Stations: Scientific and Applied Reference Book; OOO “RIAL”: St. Petersburg, Russia, 2021; 202p. (In Russian) [Google Scholar]
- Kuznetsov, O.L. Diversity of mire massif types in the boreal zone of European Russia. IOP Conf. Ser. Earth Environ. Sci. 2018, 138, 012011. [Google Scholar] [CrossRef]
- Google Maps. Available online: https://www.google.com/maps/@64.5340228,40.5630513,13z (accessed on 15 April 2023).
- Stankov, S.S. Identification Guide of Higher Plants of the European Part of the USSR, 2nd ed.; Soviet Science: Moscow, Russia, 1957; 741p. (In Russian) [Google Scholar]
- Borisova, M.A.; Bogachev, V.V. Geobotanics; Yaroslavl State University Publishing House: Yaroslavl, Russia, 2009; 160p. (In Russian) [Google Scholar]
- Noskova, M.G. Field Identification Guide of Sphagnum Mosses; Akvarius: Tula, Russia, 2016; p. 112. (In Russian) [Google Scholar]
- Ignatov, M.S.; Ignatova, E.A. Moss Flora of the Middle European Russia. Volume 2: Fontinalaceae-Amblystegiaceae; KMK Scientific Press Ltd.: Moscow, Russia, 2003; pp. 609–944. (In Russian) [Google Scholar]
- Ushakov, A.I. Forest Inventory and Forest Management: Training Manual; MGTU named after N.E. Bauman: Moscow, Russia, 1997; 176p. (In Russian) [Google Scholar]
- Zubov, I.N.; Orlov, A.S.; Selyanina, S.B.; Zabelina, S.A.; Ponomareva, T.I. Redox potential and acidity of peat are key diagnostic physicochemical properties for the stratigraphic zones of a boreal raised bog. Mires Peat 2022, 28, 5. [Google Scholar] [CrossRef]
- Urquhart, C.; Gore, A.J.P. The redox characteristics of four peat profiles. Soil Biol. Biochem. 1973, 5, 659–672. [Google Scholar] [CrossRef]
- Kats, N.Y.; Kats, S.V.; Skobeeva, E.I. Atlas of Plant Residues in Peat; Nedra: Moscow, Russia, 1977; p. 371. (In Russian) [Google Scholar]
- Zaretskaya, N.E.; Shevchenko, N.V.; Simakova, A.N.; Sulerzhitsky, L.D. Chronology of the North Dvina River delta development over the Holocene. Geochronometria 2011, 38, 116–127. (In Russian) [Google Scholar] [CrossRef]
- Reimer, P.; Austin, W.; Bard, E.; Bayliss, A.; Blackwell, P.; Bronk Ramsey, C.; Butzin, M.; Butzin, M.; Cheng, H.; Edwards, R.L.; et al. The IntCal20 Northern Hemisphere Radiocarbon Age Calibration Curve (0–55 cal kBP). Radiocarbon 2020, 62, 725–757. [Google Scholar] [CrossRef]
- Landau, S.; Everitt, B.S. A Handbook of Statistical Analyses Using SPSS; Chapman & Hall/CRC Press LLC: Boca Raton, FL, USA, 2004; 337p. [Google Scholar]
- Tikhonravova, Y.V.; Slagoda, E.A.; Rogov, V.V.; Butakov, V.I.; Lupachev, A.V.; Kuznetsova, A.O.; Simonova, G.V. Heterogeneous ices in ice wedges structure on the Pur-Taz interfluve peatlands of the North of West Siberia. Ice Snow 2020, 60, 225–238. [Google Scholar] [CrossRef]
- Ashkepkova, A.; Semikolennyh, A. Sediments of swamps and caves of the Pinezh karst massif (Arkhangelsk region) as an indicator of changes of the natural environment in the Pleistocene-Holocene. In Proceedings of the Speleology and Spelestology, V International Correspondence Conference, Naberezhnye Chelny, Russia, 29 November 2014; pp. 92–98. (In Russian). [Google Scholar]
- Yurkovskaya, T. Main latitudinal and longitudinal characters of Russian mire vegetation. Proc. IAVS Symp. 2000, 130–132. [Google Scholar]
- Yurkovskaya, T.K. Peatlands of the taiga North-East of European Russia. Bot. Zhurnal 2021, 106, 211–228. [Google Scholar] [CrossRef]
- Kiselev, M.V.; Dyukarev, E.A.; Voropay, N.N. The temperature characteristics of biological active period of the peat soils of Bakchar swamp. IOP Conf. Ser. Earth Environ. Sci. 2018, 107, 012032. [Google Scholar] [CrossRef]
- Tokarz, E.; Urban, D. Soil Redox Potential and Its Impact on Microorganisms and Plants of Wetlands. J. Ecol. Eng. 2015, 16, 20–30. [Google Scholar] [CrossRef]
- Abolin, R.I. Swamp forms of pine Pinus sylvestris L. Ann. Bot. Mus. Acad. Sci. 1915, 15, 62–84. (In Russian) [Google Scholar]
- Kiseleva, K.V.; Novikov, V.S.; Mayorov, S.R. Flora of Central Russia. Field Guide; Phyton XXI: Moscow, Russia, 2019; 544p. (In Russian) [Google Scholar]
- Słowińska, S.; Słowiński, M.; Marcisz, K.; Lamentowicz, M. Long-term microclimate study of a peatland in Central Europe to understand microrefugia. Int. J. Biometeorol. 2022, 66, 817–832. [Google Scholar] [CrossRef] [PubMed]
- Davis, K.T.; Dobrowski, S.Z.; Holden, Z.A.; Higuera, P.E.; Abatzoglou, J.T. Microclimatic buffering in forests of the future: The role of local water balance. Ecography 2019, 42, 1–11. [Google Scholar] [CrossRef]
- Bridgham, S.; Pastor, J.; Updegraff, K.; Malterer, T.J.; Johnson, K.; Harth, C.; Chen, J. Ecosystem control over temperature and energy flux in northern peatlands. Ecol. Appl. 1999, 9, 1345–1358. [Google Scholar] [CrossRef]
- Chen, J.; Bridgham, S.; Keller, J.; Pastor, J.; Noormets, A.; Weltzin, J.F. Temperature responses to infrared-loading and water table manipulations in peatland mesocosms. J. Integr. Plant Biol. 2008, 50, 1484–1496. [Google Scholar] [CrossRef] [PubMed]
- Zarzycki, J.; Skowera, B.; Zając, E. Microclimate and Water Conditions of an Extracted and Natural Raised Bog. J. Ecol. Eng. 2020, 21, 115–123. [Google Scholar] [CrossRef]
- Rietkerk, M.; Dekker, S.C.; Wassen, M.J.; Verkroost, A.W.; Bierkens, M.F. A putative mechanism for bog patterning. Am. Nat. 2004, 163, 699–708. [Google Scholar] [CrossRef]
- Linkevičienė, R.; Šimanauskienė, R.; Kibirkštis, G.; Grigaitė, O.; Taminskas, J. Hydrological and botanical techniques of raised bog and its methods in situ and remote sensing. J. Hydrogaitė 2023, 617, 129119. [Google Scholar] [CrossRef]


| Study Site | Tree Layer Composition | Age of the Trees, Years | Mean | Relative Crown Density | Dominant Ecological Form of Pine | |
|---|---|---|---|---|---|---|
| Height, m | Diameter, cm | |||||
| Lawn (L) | - | - | - | - | - | - |
| Hummock–hollow complex (HH) | Pinus sylvestris L. | 51.08 ± 19.53 *ab | 2.44 ± 1.38 cd | 4.34 ± 3.50 ef | 0.30 ± 0.28 | f. willkommii |
| Hummock–pool–hollow complex (HPH) | Pinus sylvestris L. | 211.5 ± 71.02 a | 3.26 ± 1.36 c | 8.45 ± 6.41 e | 0.50 ± 0.40 | f. litwinowii |
| Hummock–pool complex (HP) | Pinus sylvestris L. | 145.30 ± 33.30 b | 3.07 ± 1.45 d | 7.29 ± 6.86 f | 0.54 ± 0.43 | f. litwinowii |
| Study Site | Sample Name | Peat Depth, m | Radiocarbon Age, yr | Calibrated Age, cal.yr BP |
|---|---|---|---|---|
| L | LU-10913 * | 2.40–2.60 | 4990 ± 80 | 5740 ± 90 |
| HH | LU-10912 * | 3.30–3.50 | 5780 ± 90 | 6580 ± 110 |
| HPH | LU-10911 * | 3.20–3.40 | 5940 ± 80 | 6780 ± 100 |
| HP | LU-10910 * | 5.80–6.00 | 9280 ± 90 | 10,460 ± 130 |
| Air Temperature Near the Plant Cover | Water Table Level | Shade Density | |
|---|---|---|---|
| Height of Scots pine | 0.864 * | −0.703 * | - |
| Diameter of Scots pine | 0.912 * | −0.664 * | - |
| Height of Bog Rosemary | 0.605 * | −0.702 * | 0.352 |
| Height of Blueberry | 0.642 * | −0.604 * | 0.422 * |
| Projective cover of dwarf shrub layer | −0.142 | 0.198 | −0.103 |
Disclaimer/Publisher’s Note: The statements, opinions and data contained in all publications are solely those of the individual author(s) and contributor(s) and not of MDPI and/or the editor(s). MDPI and/or the editor(s) disclaim responsibility for any injury to people or property resulting from any ideas, methods, instructions or products referred to in the content. |
© 2024 by the authors. Licensee MDPI, Basel, Switzerland. This article is an open access article distributed under the terms and conditions of the Creative Commons Attribution (CC BY) license (https://creativecommons.org/licenses/by/4.0/).
Share and Cite
Ponomareva, T.; Zubov, I.; Shtang, A.; Orlov, A.; Selyanina, S. Complex Microlandscape as a Structural Unit of the Study of Spatiotemporal Development of an Ombrotrophic Suboceanic Bog. Quaternary 2024, 7, 19. https://doi.org/10.3390/quat7020019
Ponomareva T, Zubov I, Shtang A, Orlov A, Selyanina S. Complex Microlandscape as a Structural Unit of the Study of Spatiotemporal Development of an Ombrotrophic Suboceanic Bog. Quaternary. 2024; 7(2):19. https://doi.org/10.3390/quat7020019
Chicago/Turabian StylePonomareva, Tamara, Ivan Zubov, Anastasiya Shtang, Alexander Orlov, and Svetlana Selyanina. 2024. "Complex Microlandscape as a Structural Unit of the Study of Spatiotemporal Development of an Ombrotrophic Suboceanic Bog" Quaternary 7, no. 2: 19. https://doi.org/10.3390/quat7020019
APA StylePonomareva, T., Zubov, I., Shtang, A., Orlov, A., & Selyanina, S. (2024). Complex Microlandscape as a Structural Unit of the Study of Spatiotemporal Development of an Ombrotrophic Suboceanic Bog. Quaternary, 7(2), 19. https://doi.org/10.3390/quat7020019