Next Article in Journal
Birds from Chalcolithic Settlements in the Plains of Bulgaria
Previous Article in Journal
On the Inconsistency of the “Suid Gap” Hypothesis and Its Inappropriate Biochronological Use in Dating the Localities of Orce (Venta Micena, Barranco León D, and Fuente Nueva 3). Reply to Martínez-Navarro et al. Comment on “Iannucci, A. The Occurrence of Suids in the Post-Olduvai to Pre-Jaramillo Pleistocene of Europe and Implications for Late Villafranchian Biochronology and Faunal Dynamics. Quaternary 2024, 7, 11”
 
 
Article

Streamflow Reconstruction Using Multi-Taxa Tree-Ring Records from Kullu Valley, Himachal Pradesh, Western Himalaya

1
Tropical Forestry, Faculty of Environmental Science, TU Dresden, Helmholtzstr. 10, 01062 Dresden, Germany
2
Forests and Livelihoods, Faculty of Science, University of Copenhagen, Nørregade 10, P.O. Box 2177, 1017 Copenhagen, Denmark
3
Birbal Sahni Institute of Palaeosciences, 53-University Road, Lucknow 226 007, India
4
Academy of Scientific and Innovative Research (AcSIR), Ghaziabad 201 002, India
5
Department of Forestry, Mizoram University, Tanhril, Aizawl 796 004, India
6
Department of Geology, University of Lucknow, Lucknow 226 007, India
7
Department of Geography, Gauhati University, Guwahati 781 014, India
8
Indian Institute of Tropical Meteorology, Dr. Homi Bhabha Road, Pashan, Pune 411 008, India
9
Institute of Earth Surface Dynamics (IDYST), University of Lausanne, CH-1015 Lausanne, Switzerland
10
School of Geography, Earth and Environmental Sciences, University of Birmingham, Birmingham B15 2TT, UK
11
Department of Environmental Science, Patan Multiple Campus, Tribhuvan University, Patan Dhoka, Lalitpur 44600, Nepal
12
Symbiosis Institute of Geo-Informatics, Symbiosis International (Deemed University), Pune 411 016, India
*
Author to whom correspondence should be addressed.
Quaternary 2025, 8(1), 9; https://doi.org/10.3390/quat8010009
Submission received: 4 December 2024 / Revised: 22 January 2025 / Accepted: 29 January 2025 / Published: 8 February 2025

Abstract

:
To study the long-term hydroclimate variability in the Satluj Basin, streamflow data was reconstructed using tree-ring width datasets from multiple taxa available from the Kullu Valley, western (Indian) Himalaya. Five ring-width tree-ring chronologies of three conifer tree taxa (Abies pindrow, Cedrus deodara, and Pinus roxburghii) significantly correlate with the streamflow during the southwest monsoon season. Based on this correlation, a 228-year (1787–2014 CE) June–August streamflow was reconstructed using average tree-ring chronology. The reconstruction accounts for 34.5% of the total variance of the gauge records from 1964 to 2011 CE. The annual reconstruction showed above-average high-flow periods during the periods 1808–1811, 1823–1827, 1833–1837, 1860–1863, 1876–1881, and 1986–1992 CE and below-average low-flow periods during the periods 1792–1798, 1817–1820, 1828–1832, 1853–1856, 1867–1870, 1944–1947, and 1959–1962 CE. Furthermore, a period of prominent prolonged below-average discharge in the low-frequency streamflow record is indicated during the periods 1788–1807, 1999–2011, 1966–1977, 1939–1949, and 1854–1864. The low-flow (dry periods) observed in the present streamflow reconstruction are coherent with other hydroclimatic reconstructions carried out from the local (Himachal Pradesh and Kashmir Himalaya) to the regional (Hindukush mountain range in Pakistan) level. The reconstruction shows occurrences of short (2.0–2.8 and 4.8–8.3 years) to medium (12.5 years) periodicities, which signify their teleconnections with large-scale climate variations such as the El Niño–Southern Oscillation and the Pacific Decadal Oscillation.

1. Introduction

The Himalayan Mountain range, known as the world’s third-largest ice and snow deposit, is one of the most important sources of freshwater for 1.3 billion people living in the lowlands of the Indus, Ganga, and Brahmaputra River basins, spread over eight countries (Afghanistan, Bangladesh, Bhutan, China, India, Myanmar, Nepal, and Pakistan) [1]. Climate change is a long-lasting alteration of the weather arrays that affects the environment in numerous ways, including changes in river flow conditions and increasing hydro-climatic extremes such as floods and droughts [2,3,4,5]. Like other mountain ranges, the Himalayas have also experienced rapid warming during the last few decades, unprecedentedly related to the past-century records [6,7], causing floods and droughts [8,9,10,11,12,13]. In spite of significantly increasing threats, there remains a lack of understanding of the impact of climate change on water resources and hydroclimate variability due to the lack of long-term records [14]. The impacts of climate change are not uniform across the Himalayas due to the differences in topography and climatic regimes. For instance, the western Himalaya is placed in the transition region of the two circulation systems—the Indian Summer Monsoon (ISM) and the Western Disturbance (WD) [15]. In contrast, the central and eastern Himalayas are mostly dominated by the ISM, which controls the streamflow in the Himalayan rivers [16]. Studies have reported that climate fluctuations not only affect streamflow but also other hydrological processes such as evapotranspiration, surface runoff, percolation, soil erosion and river temperature, precipitation, snowmelt, and glacial runoff [17]. Such hydrological changes have negative consequences on lives, livelihoods, and infrastructures downstream [17]. However, understanding the water availability dynamics and scenario in this region may not be rigid under ongoing climatic variations. This is because instrumental hydrological records are unavailable for a longer period that began only in the 20th century [18,19]. Studies have shown that this data gap can be bridged by using environmental proxies such as tree rings. Forest and soil water flow is regulated primarily by precipitation and evapotranspiration in a watershed. Trees absorb atmospheric moisture through leaves, surface, and soil water through the root system, which affects both tree growth and streamflow [20]. The variations in ring widths depend on the availability of nutrients and the surrounding hydroclimatic conditions in which trees grow [21]. Thus, trees record climatic signals at annual to intra-annual resolutions during their growing period [21]. Based on tree growth–climate response functions, tree rings are used for hydroclimatic reconstructions with highly precise dating accuracy. These reconstructions can be extended for centuries, before the existence of the instrumental period, and find application across various river basins globally [12,20,22,23,24,25,26,27]. These studies highlight the well-established potential of tree-ring-based streamflow reconstructions across the globe and having spatio-temporal teleconnections with various climatic and environmental variations.
The streamflow reconstruction records known for robust estimates in North America are from regions such as the Truckee River Basin, California–Nevada [28], the Potomac River [29], the Colorado River Basin [30,31,32], the Sacramento River Basin [33], and many other streamflow records, making it one of the most frequently reconstructed parameters based on tree-ring records [34]. Other river basins, such as the Red River Basin [35], Winnipeg River Basin [36], and Athabasca River Basin [37] in Canada; the Pilcher River, Great Britain [38]; the Upper Adige River Basin, Italy [39]; the Sava River Basin, Slovenia [40]; the lower Danube River Basin, Romania [41]; and the Ob River in Russia [42], have streamflow reconstruction records determining the long-term variations in the runoff strengths, impacting the watershed in many ways. The southern hemisphere river basins of Argentina [43,44], Chile [45,46,47,48], western Tasmania [49], High Northern Australia [50], and the Murray River, Australia [51], have streamflow reconstruction records, indicating the potential of the use of tree rings from these regions to understand the dendrohydrological variabilities in the inter-linked watersheds.
The streamflow records from China include river basins such as the Yellow River Basin [52,53], the Manasi River in the northern Tien Shan Mountains, NW China [54], the Heihe River Basin [55], the Lancang River Basin [56] streamflow on the northern slopes of the Tianshan Mountains in northern Xinjiang [57], the Salween River Basin [58], the Lhasa River Basin Tibetan Plateau [23], the Yongding River, Beijing [59], and the Mekong, Salween and Yarlung Tsangpo basins [60], elaborating the various environmental phenomena linked to variations in streamflow dynamics in these large river basins. There is streamflow reconstruction from river basins such as the Brahmaputra River, Bangladesh [24], the Karnali River Basin, Nepal [12,61], and the Upper Indus Basin, Pakistan [62,63], which are the rivers originating from or flowing in the Himalayan region.
The potential of tree rings for environmental reconstruction has also been reported in several studies across the Indian Himalayan region. However, the majority of them are focused on understanding tree growth–climate relationships and palaeoclimate reconstruction [64]. Additionally, the Monsoon Asia Drought Atlas, MADA [26], also used tree-ring records across the Asian monsoon region, including the Himalayan tree-ring records, which have contributed immensely to identifying patterns of summer drought, which further provides a wide spectrum of hydroclimate of the region. Still, only a few Himalayan tree-ring-based studies have focused on hydrological reconstructions, in particular, streamflow reconstructions for the past centuries. For instance, in the eastern Himalayan region, multiple ring width parameters (total ring width, earlywood width, and latewood width) of Larix griffithiana were explored, and based on the hydrological response to the earlywood growth variations, two-century-long (1790–2014 CE) streamflow records of the Lachen River in the Sikkim region were reconstructed [65]. Another streamflow reconstruction from the eastern Himalaya was carried out for the Lohit River Basin, Arunachal Pradesh, using ring-width chronologies of Pinus merkusii [66]. In the western Himalayan region, streamflow reconstruction of the Satluj River was developed based on tree-ring chronologies of Pinus gerardiana and Cedrus deodara [67] and using tree-ring chronologies of only C. deodara [68]. The streamflow of the Beas River was also reconstructed using C. deodara tree-ring chronology [69]. Such century-long reconstructions provide a deeper understanding of water resource fluctuations under a changing climate and their long-term trends, if any [21,70,71,72,73].
The Kullu Valley, in the Kullu district of Himachal Pradesh, western Himalaya, comprises natural resources, such as flora, fauna, and perennial sources of water. The tree taxa growing in this region are a plausible source of higher resolution tree-ring proxy that would provide useful information on river flow conditions in the past. In the Kullu Valley, earlier studies focused on reconstructing flood events based on the scars on the trees, known as paleo-stage indicators or PSIs [74]. Moreover, several studies have also reconstructed streamflow for several centuries in the Satluj River [67,68,75]. These reconstructed streamflow records were analyzed almost two decades ago and climate change has significantly altered the hydrological conditions of this river in recent decades. Consequently, in the present study, we analyzed and updated the reconstruction of the streamflow variability of the Satluj River based on tree-ring width data of multi-conifer taxa growing in the Kullu Valley. Our century-long streamflow reconstruction provides more recent hydrological information for a better understanding of streamflow variabilities in the recent decades in the Satluj River in the Kullu Valley.

2. Materials and Methods
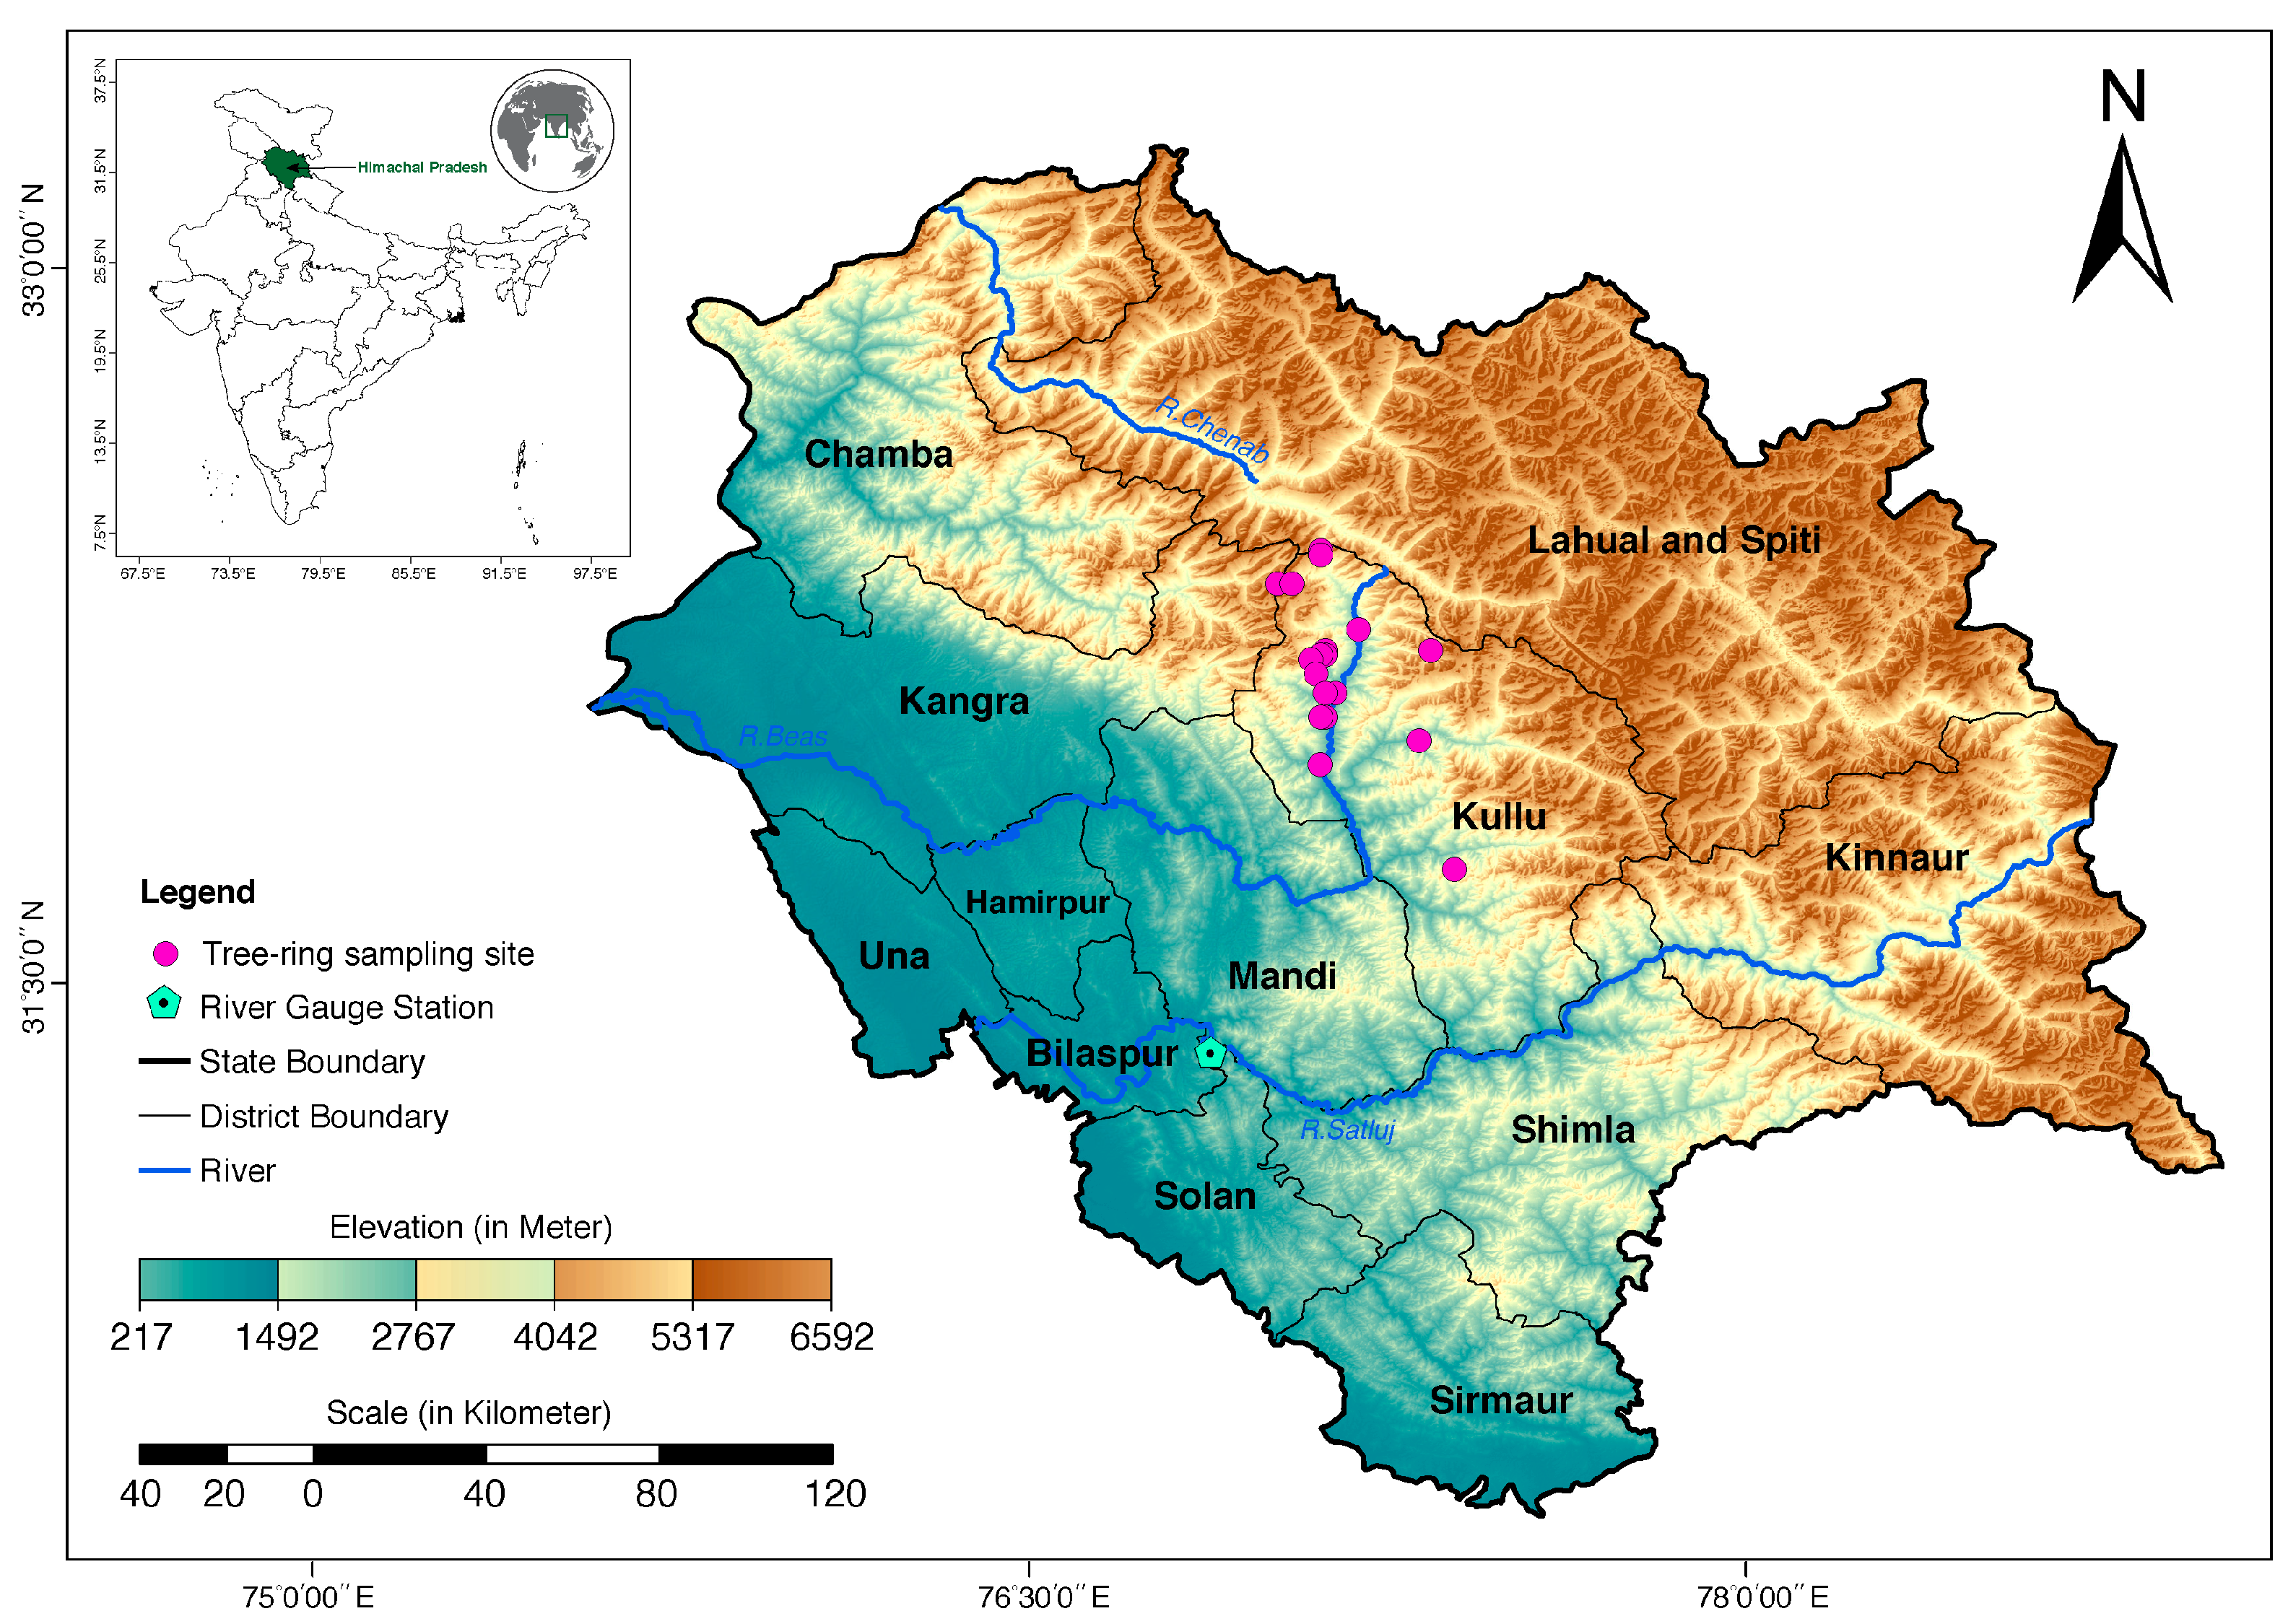
2.1. Study Area

For the present study, we selected the Kullu Valley (Figure 1), which is situated at ~3600 m above mean sea level (m.s.l.) in Himachal Pradesh, western Himalaya. It covers an area of 1766 km2 (latitude 31°20′25″ N to 32°25′00″ N and longitude 76°56′30″ E to 77°52′20″ E). The valley has a distinctive climate due to its unique topography and glaciated terrain. The Satluj River, a tributary of the Indus River, is one of the major rivers in the western Himalaya, flowing through Kullu Valley in the Indian State of Himachal Pradesh. The Satluj River catchment occupies around 10.21% of the total Indian Himalayan region [76]. The Indus River has five major tributaries, which are the Satluj, Beas, Jhelum, Chenab, and Ravi. Amongst these major tributaries, the Satluj River is the longest and flows across northern India and Pakistan [77].
The climate of this valley is classified into three broad seasons: the winter season occurs from October to February, the summer season takes place from March to June, and the Monsoon or the rainy season lasts from July to September. The annual mean maximum and minimum temperatures show a fluctuation from 13.3 °C to −1.4 °C in winter and 22.2 °C to 9.7 °C in summer. The average annual rainfall is around 1405.7 mm, where 57% is recorded in the months of June to September as a southwest monsoon season. Most of the precipitation is in the form of snowfall; however, during the monsoon period, the rainfall averages almost 230 mm, reaching around 320 mm, and the bulk of it is generally received from June to September due to the Indian summer monsoon system [78].

2.2. Tree-Ring Records

Based on the previously conducted tree-ring studies and records in the forest of the Kullu Valley on conifer taxa, four taxa viz., West Himalayan Fir (Abies pindrow), West Himalayan Spruce (Picea smithiana), Himalayan Cedar (Cedrus deodara), and Himalayan Chir Pine (Pinus roxburghii), were selected for the present study. The tree-ring data used for the present analysis are based on published records [69,74,79,80,81]. The ring-width data were procured in the form of raw ring-width data and digitized from the published research papers. The raw tree-ring width data of P. roxburghii and C. deodara from Kasol, Parvati Valley, were obtained from the previously published tree-ring data sets [69,80] collected and sourced at the Birbal Sahni Institute of Palaeosciences (BSIP), Lucknow, India. Additionally, the raw tree-ring dataset of C. deodara of Manali [79] was accessed from the public repository of the International Tree-Ring Data Bank (ITRDB), which is maintained by the National Oceanic and Atmospheric Administration (NOAA) Paleoclimatology Program. Additionally, previously published tree-ring chronologies of A. pindrow, P. smithiana, and C. deodara [81] and tree-ring chronologies of A. pindrow and C. deodara [74] were digitized by using the ring-width curve converter program in a software tool called CDendro version 9.6 (http://www.cybis.se/forfun/dendro/, accessed on 21 October 2022). The details of the tree-ring datasets used for the present study are given in Table 1 and also presented in Figure 1.
Table 1. Sampling site details of four tree taxa (ABPI: Abies pindrow, CEDE: Cedrus deodara, PCSM: Picea smithina, and PIRO: Pinus roxburghii) from the Kullu Valley of Himachal Pradesh, western Himalaya.
TTCCTRSNT/NCLATLONELEVReferences
Pinus roxburghiiPIRO-SSKasol22/4332°01′77°31′1548[69,80]
Cedrus deodara Kasol16/3132°01′77°31′1548[69,80]
Cedrus deodara Manali21/4232°27′77°17′2000[79]
Cedrus deodaraCEDE-BSSComposite
Cedrus deodaraCEDE-CSangrah, Kullu, and Dundi area, Solang valley32/5532°74′–32°20′77°39′–77°34′2055–2748[74]
Cedrus deodara Site 113/2632°15′77°10′2200[74]
Cedrus deodara Site 26/732°11′77°14′2290[74]
Cedrus deodaraCEDE-SComposite
Picea smithiana Site 117/2332°18′77°09′2420[81]
Picea smithiana Site 28/1132°11′77°14′2290[81]
Picea smithiana Site 314/1932°11′77°12′1960[81]
Picea smithiana Site 421/2532°06′77°12′2370[81]
Picea smithiana Site 59/1432°06′77°11′2210[81]
Picea smithianaPCSM-SComposite
Abies pindrow Site 115/2432°20′77°12′3080[81]
Abies pindrow Site 225/2832°19′77°12′2840[81]
Abies pindrow Site 319/2632°19′77°11′2660[81]
Abies pindrow Site 46/732°11′77°14′2290[81]
Abies pindrowABPI-SComposite
Abies pindrowABPI-CSangrah, Kullu, and Dundi area, Solang Valley28/3532°74′–32°20′77°39′–77°34′2055–2748[74]
TT = tree taxa; CC = chronology code; TRS = tree-ring sampling site; NT/NC = number of trees/number of cores; LAT = latitude in degrees north; LON = longitude in degrees east; ELEV = elevation in meters at sea level.
For the datasets that were collected as raw ring width data, the average ring width of individual trees was calculated using the package ‘dplR’ [82] available in the R programming environment [83]. Even though the tree-ring series of P. roxburghii and C. deodara from Kasol were collected by the BSIP, India, and the tree-ring dataset of C. deodara of Manali archived at the ITRDB was further cross-dated for the present study, the cross-dating quality was rechecked using the software tool CDendro 9.6 (http://www.cybis.se/forfun/dendro/, accessed on 21 October 2022), and the series showing a lower inter-series correlation coefficient (≤0.2) was removed for further analysis. Furthermore, these tree-ring series were standardized using the “two-third spline” detrending method in package ‘dplR’ to maximize inherent climatic signals while removing biological growth trends, and the bi-weight robust mean was calculated to obtain the final tree-ring chronologies [84]. The quality of the tree-ring chronologies was checked by calculating standard tree-ring chronology statistics such as mean sensitivity, standard deviation mean inter-series correlation (Rbar), and expressed population signal (EPS) [21]. The EPS values of more than 0.85 are used to assess the reliable time period of the chronology [85].

2.3. Gauge Record

The main outlet gauge station, Kasol (Figure 1), was selected as the source of the streamflow data in this study. The monthly streamflow data of the Kasol gauge station were procured from the Bhakra Beas Management Board (BMMB). These monthly streamflow discharge data of the Satluj River are available from 1964 to 2011 CE. Flowing from high-altitude regions, the Indus River feeds its longest tributary, the Satluj River, primarily through snowmelt during the spring season. Consequently, the higher contribution of melting will result in an increase in runoff downstream before the monsoon season [76]. As recorded globally, the change in runoff regimes enhances flood risk, impacting food, energy, and urban security downstream of the catchment areas [86].

2.4. Streamflow Reconstruction

We established the correlation between the streamflow record of the Kasol gauge station and tree-ring chronologies from the Kullu Valley. Both individual and average tree-ring chronologies were used to calculate a simple Pearson correlation with the instrumental streamflow records from 1964 to 2011 CE. The 14-month window from the previous year’s September through the current year’s October was considered using the ‘treeclim’ package [87]. After establishing a significant seasonal correlation, a simple linear regression analysis was carried out to reconstruct the streamflow for the Kasol gauge station at the Satluj River. For this, an average chronology (selected on the basis of significant correlation observed with gauge data) and significant seasonal streamflow were used as a predictor and predictand, respectively. Since the streamflow record used in this study covers a shorter period i.e., only 48 years (1964–2011 CE), the robustness of the calibration was verified using the “leave-one-out” cross-validation method, which is comparable to “cross-validation” [88]. In this method, cross-validation is repeatedly conducted and, in every iteration, a single observation from the calibration data is excluded, and it predicts that omitted observation. In this process, several statistical tests such as Pearson’s correlation coefficient (R), explained variance (R2), adjusted explained variance (R2adj), F-test, standard error (SE), and root mean square error of validation (RMSEv) are calculated. The lower RMSE value is considered the reliability of the model [21,84]. The Durbin–Watson statistic (DW) was calculated to detect autocorrelation levels in the residuals of regression [84]. Furthermore, reduction of error (RE) statistics [21] were also calculated, and a positive value of RE was considered to assess the reliability of the reconstruction model.
The reconstructed streamflow time series were analyzed for variability, such as dry (low-flow) and wet (high-flow) episodes, on the basis of the long-term average value of the reconstruction for both annual and low-frequency time series. The extreme high- and low-flow events in the reconstruction were considered based on the 90th and 10th percentile. In addition, power spectral analysis using the Multi-Taper Method (MTM) [89] was used to identify significant cycles of variability in the reconstruction. The significance of the periodicity was identified based on confidence limits of 90%, 95%, and 99%. This method provides a distinct differentiation between the harmonic (periodic) signal and the broader band signal (quasi-periodic). Furthermore, wavelet analysis [90] was performed using the package ‘dplR’ [82] in the R programming environment [83] to identify dominant modes of variability and to determine how the frequencies vary over the period of records. The spatial correlation between the reconstructed streamflow data and global sea surface temperature (SST) of Hadley Centre Sea Ice and Sea Surface Temperature (HadISST) [91] was calculated to establish a teleconnection pattern. The spatial correlation was carried out in KNMI Climate Explorer (http://climexp.knmi.nl, accessed on 20 January 2024) [92].

3. Results

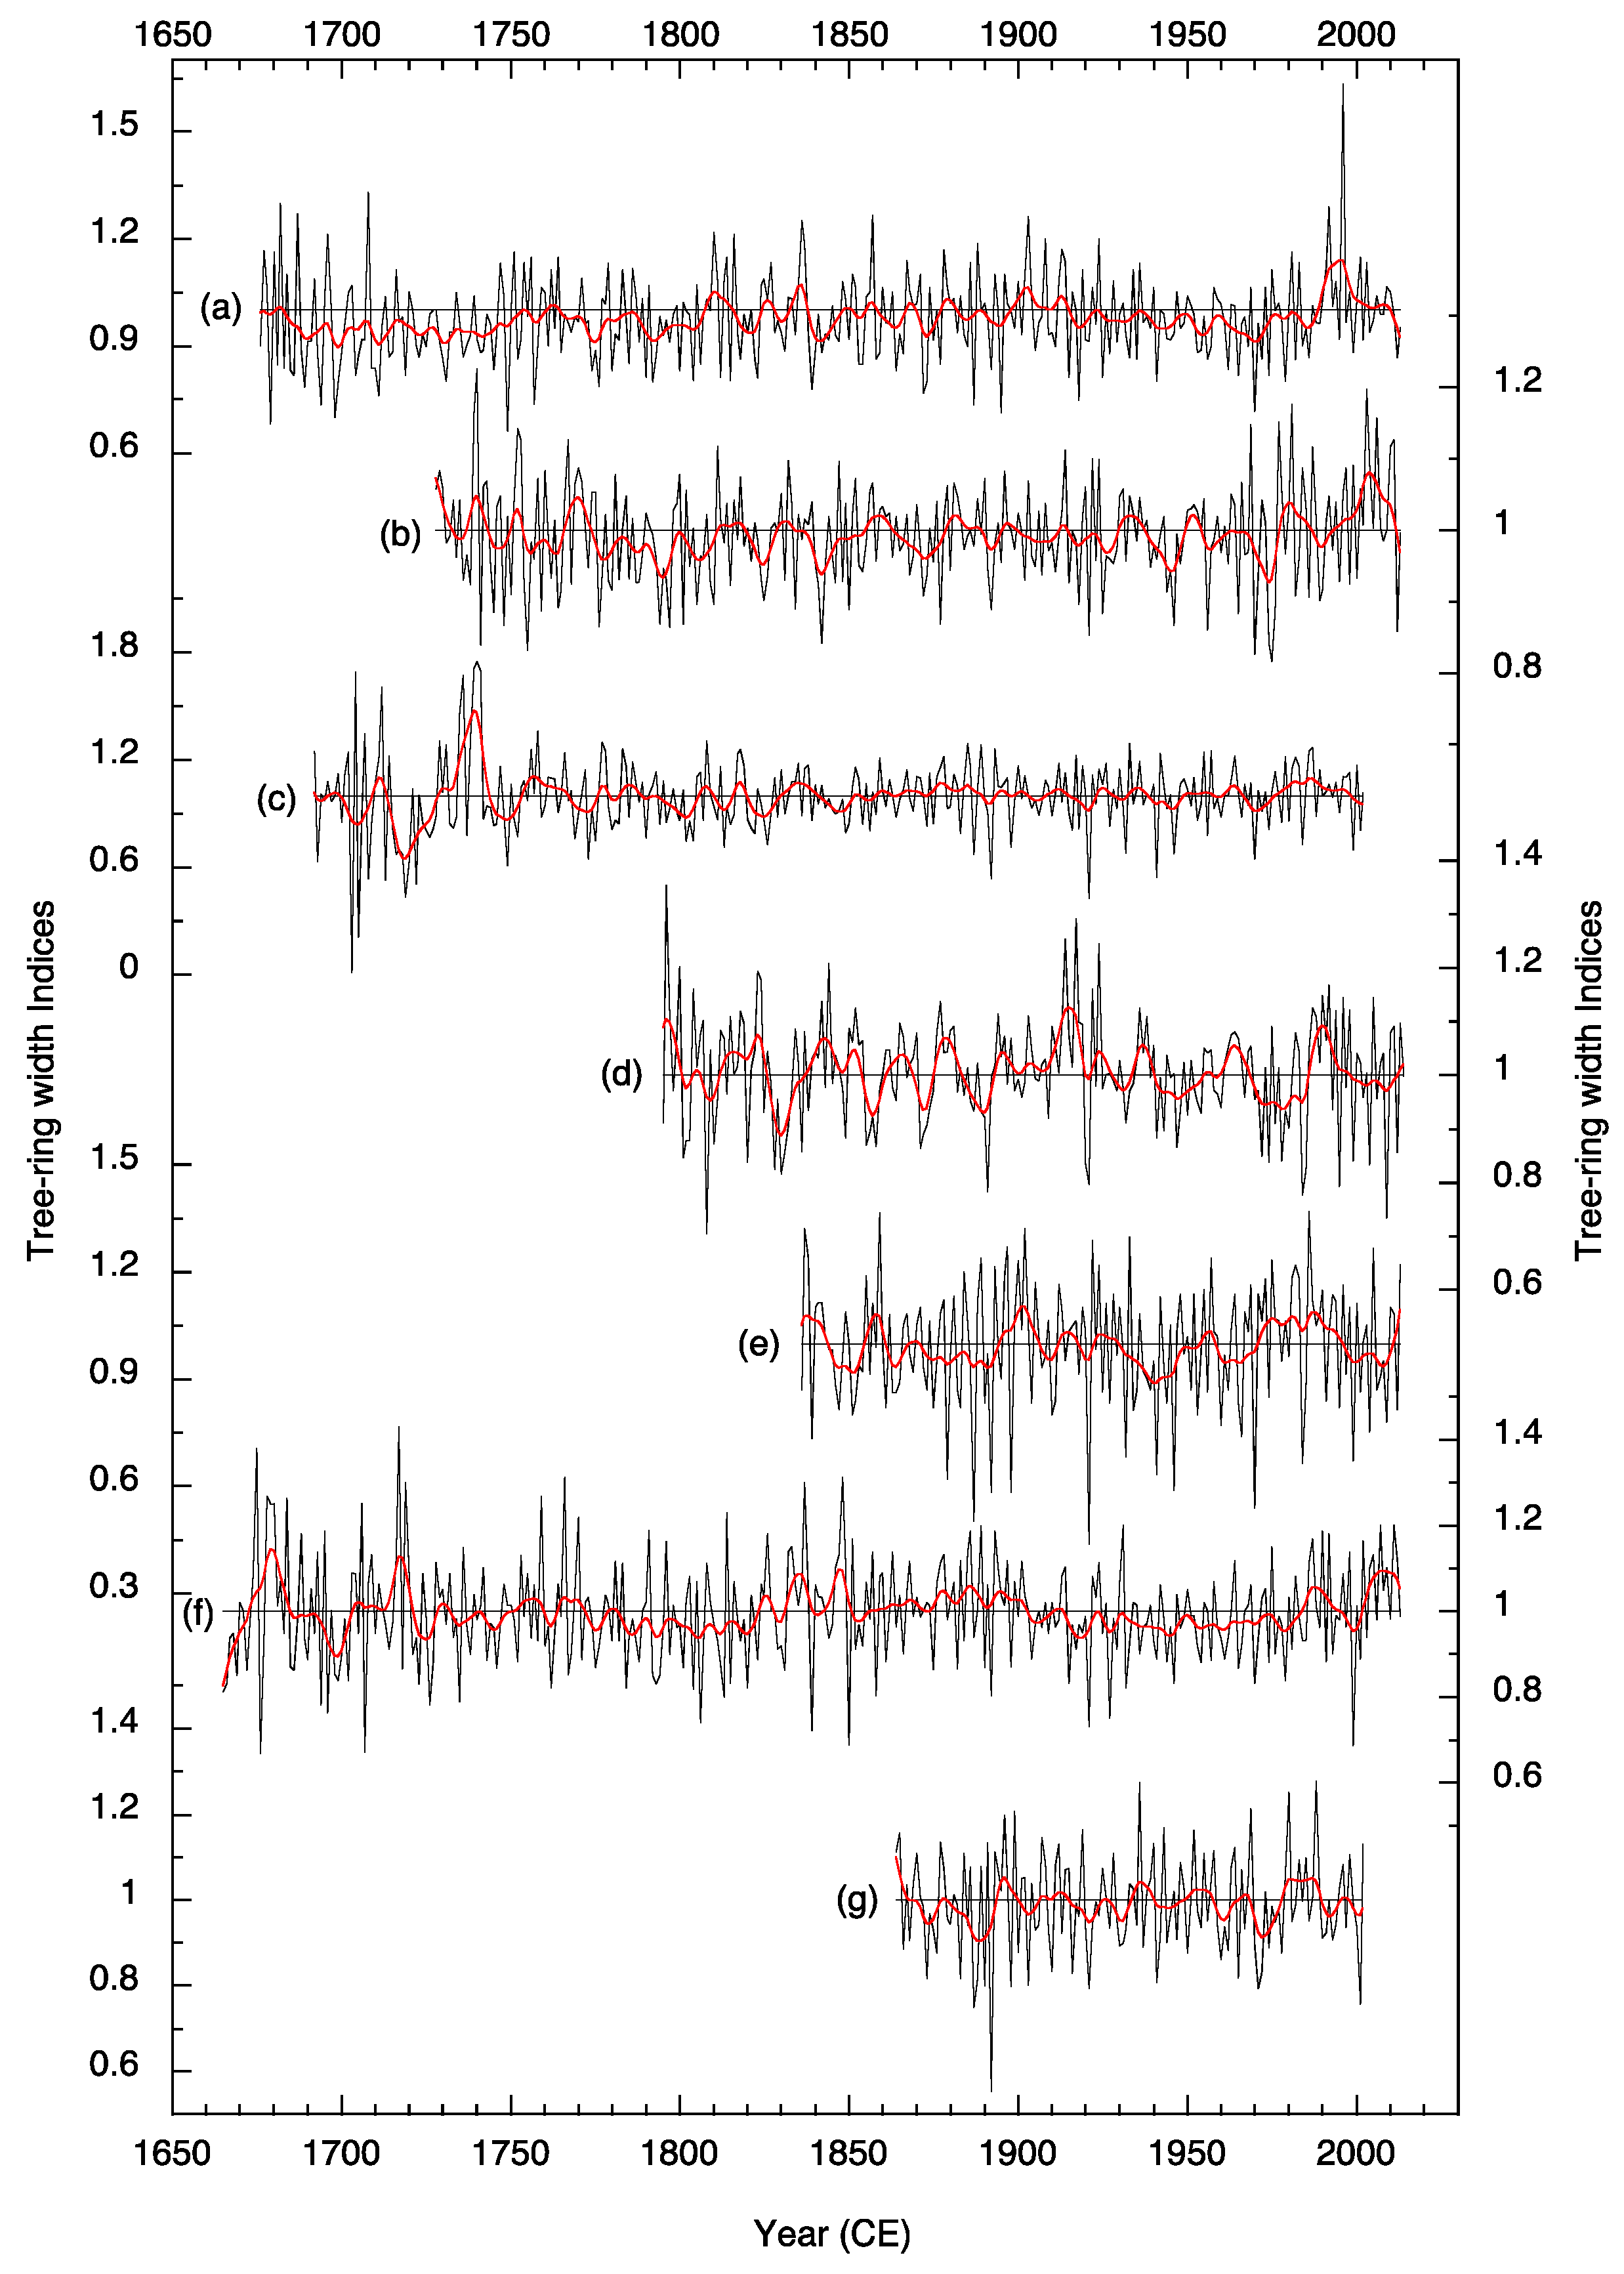
3.1. Tree-Ring Chronology Statistics

Seven tree-ring chronologies based on four conifer taxa (one of P. roxburghii, PIRO-SS), three of C. deodara (CEDE-BSS, CEDE-C, and CEDE-S), one of P. smithiana (PCSM-S), and two of A. pindrow (ABPI-S and ABPI-C) from the Kullu Valley in the Kullu district, western Himalaya, were considered for the present study. The time span of these chronologies varies at different sites and for different species. The tree-ring chronology of P. roxburghii, PIRO-SS, extends from 1864 to 2002 CE (133 years). The tree-ring chronology of C. deodara, CEDE-BSS, CEDE-C, and CEDE-S, spans 311 years (1692–2002 CE), 220 years (1795–2014 CE), and 178 years (1836–2013 CE), respectively. In the case of P. smithiana, PCSM-S, the tree-ring chronology extends from 1665 to 2013 CE (349 years). The tree-ring chronologies of A. pindrow, ABPI-S and ABPI-C, are 338 years (1676–2013 CE) and 286 years (1728–2013 CE), respectively. The time series of all seven tree-ring chronologies are given in Figure 2. The dendroclimatological potentiality of the tree-ring chronologies was evaluated based on various chronology statistics (Table 2) for the full-time period.

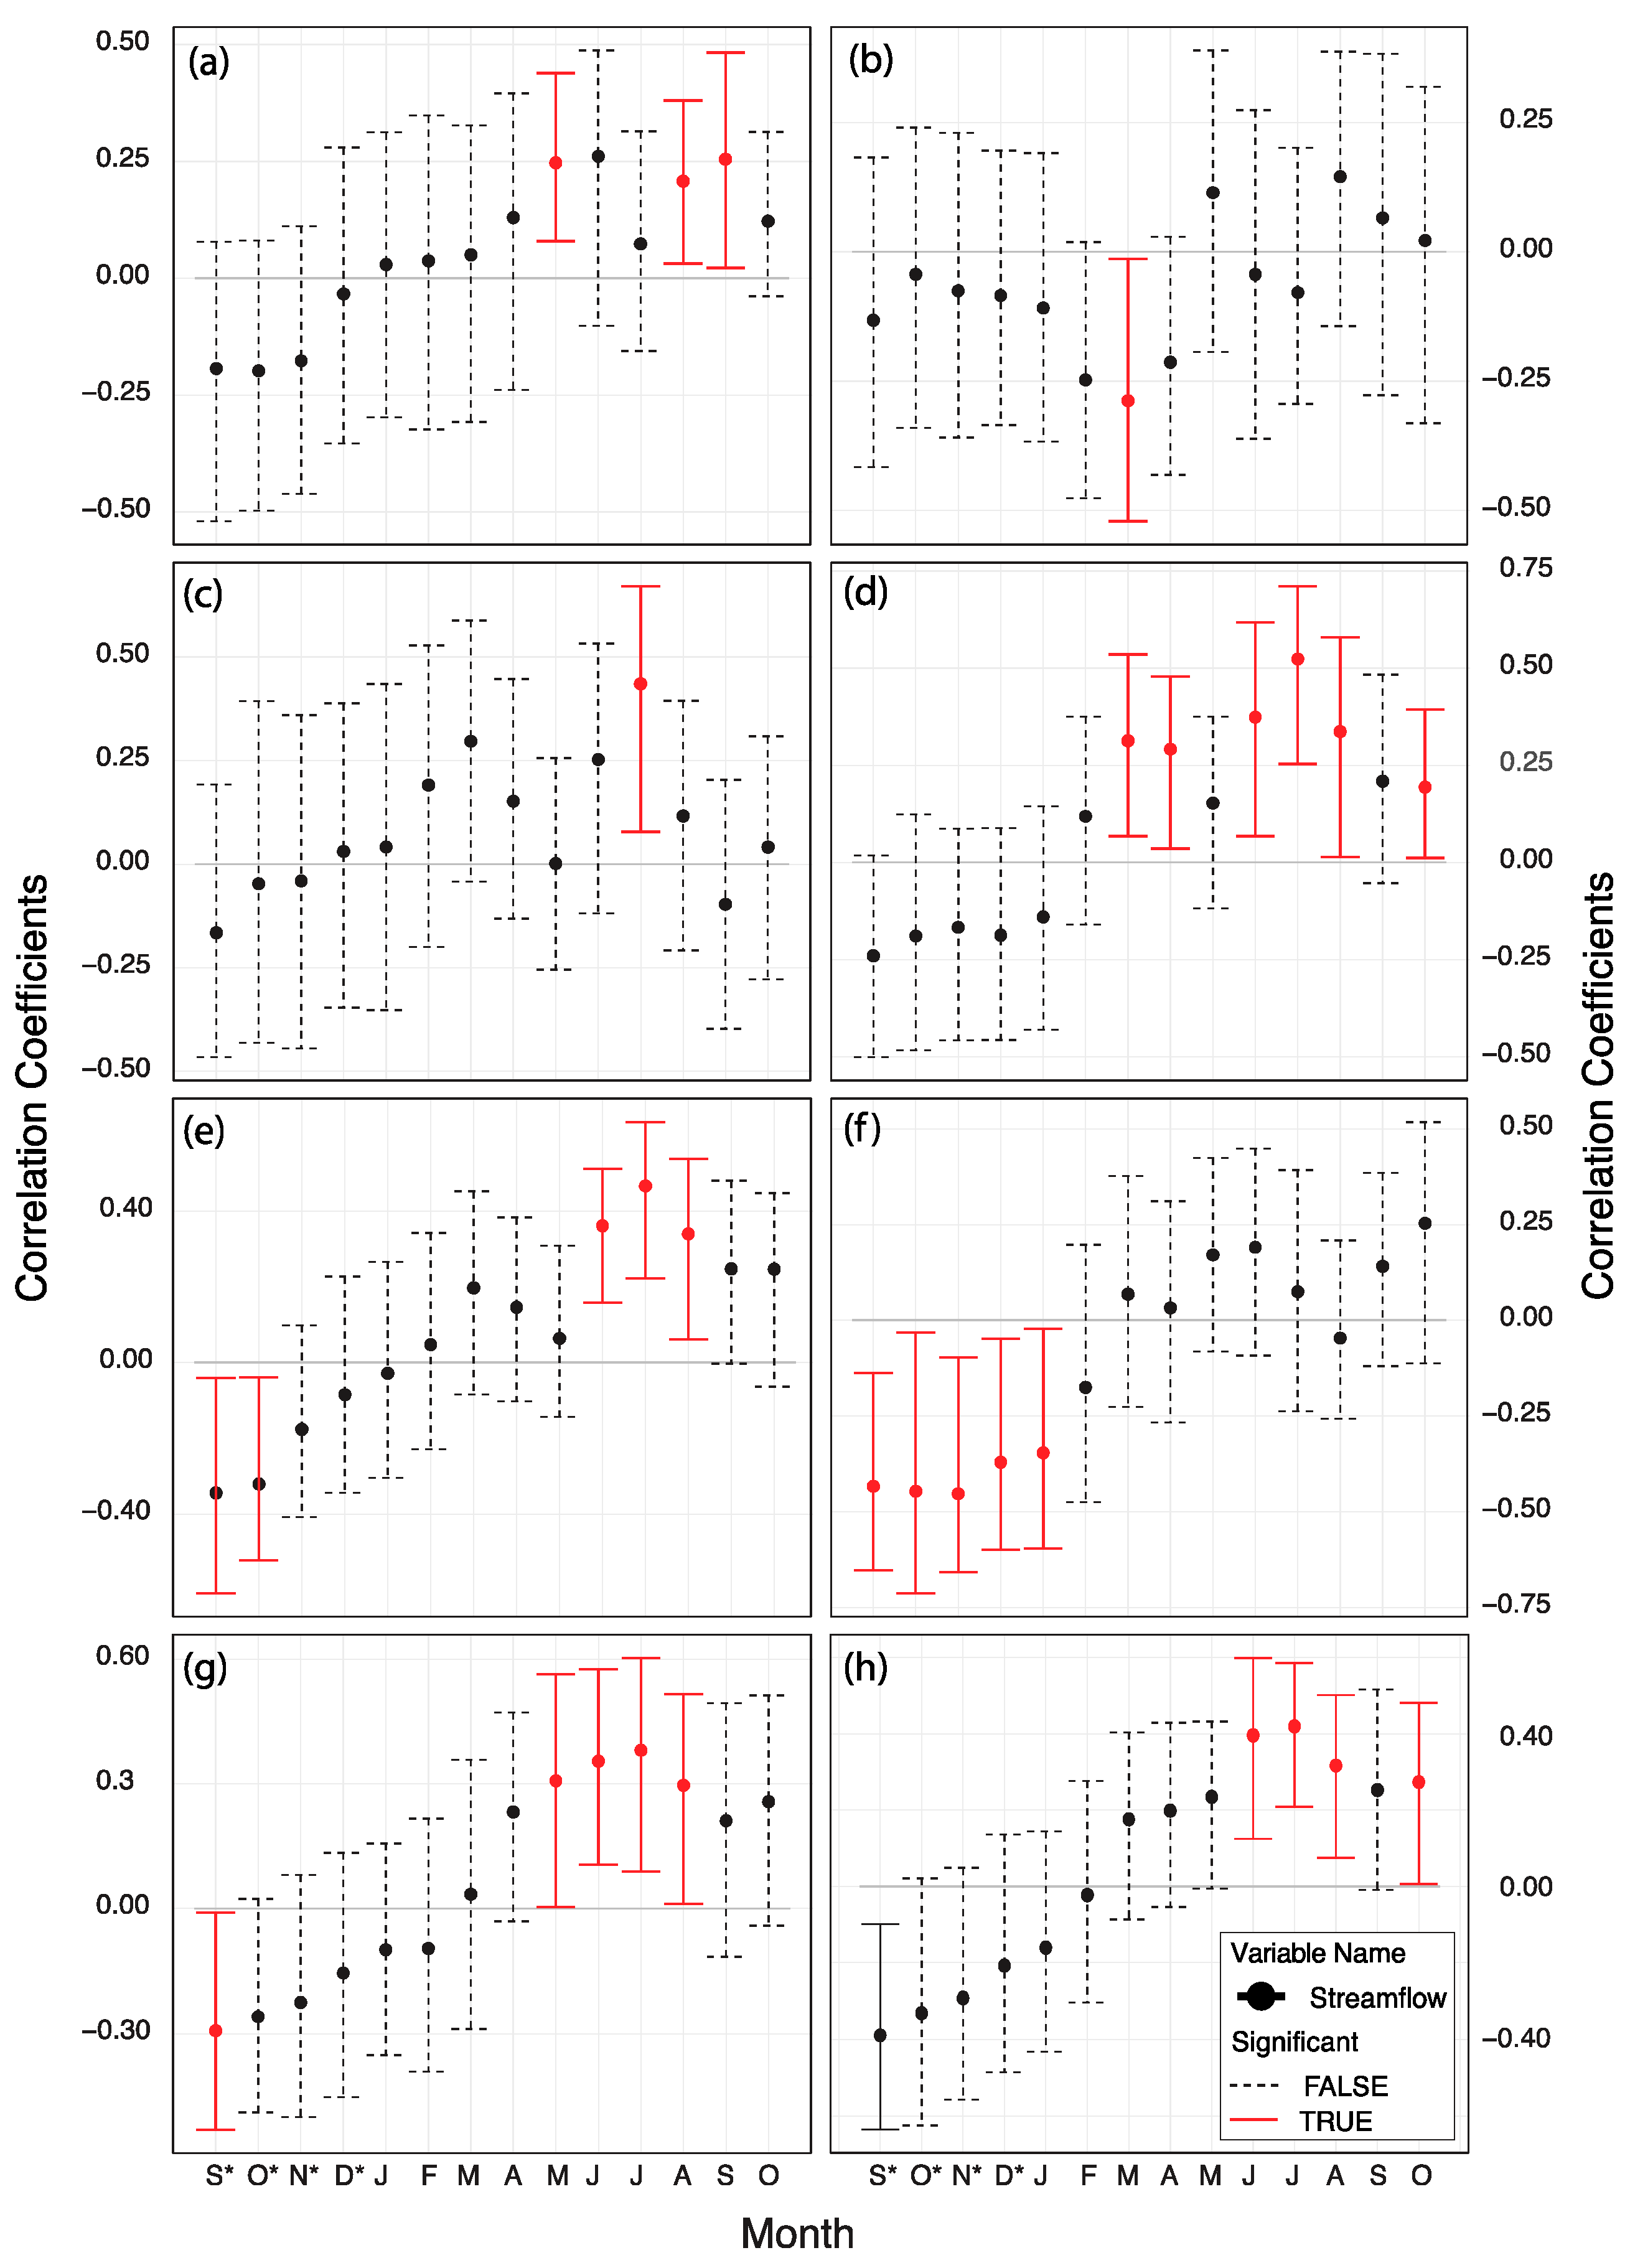
3.2. Correlation of Hydrological Records with Tree Growth

The simple correlation analysis between individual tree-ring chronologies with the streamflow records of the Satluj River (Figure 3) explains that P. roxburghii (PIRO-SS) correlated positively with streamflow in the month of May–July, and C. deodara from three different sites, CEDE-BSS, CEDE-C, and CEDE-S, showed positive correlations in the month of July, June–August, and March–August, respectively. A. pindrow (ABPI-S) showed a positive correlation in the months of May, August, and September, and their relationships were significant (p < 0.05). However, P. smithiana (PCSM-S) and A. pindrow (ABPI-C) did not have any significant positive correlation but did have a significant negative correlation in the months of September–December in the previous year and January and March in the current year, respectively. All of these correlations illustrate that the streamflow in the monsoon period (June–August) has a significant relationship with tree radial growth. Based on the simple correlation analysis (Figure 3), PIRO-SS, CEDE-BSS, CEDE-C, CEDE-S, and ABPI-S showed significant positive correlations, and most of them were correlated with the June–August streamflow record. The average tree-ring chronology for the Kullu Valley was calculated using these five site chronologies truncated in 1787, where the EPS value was greater than 0.85 and correlated with streamflow data, which shows a significant positive correlation for June–August (Figure 3).

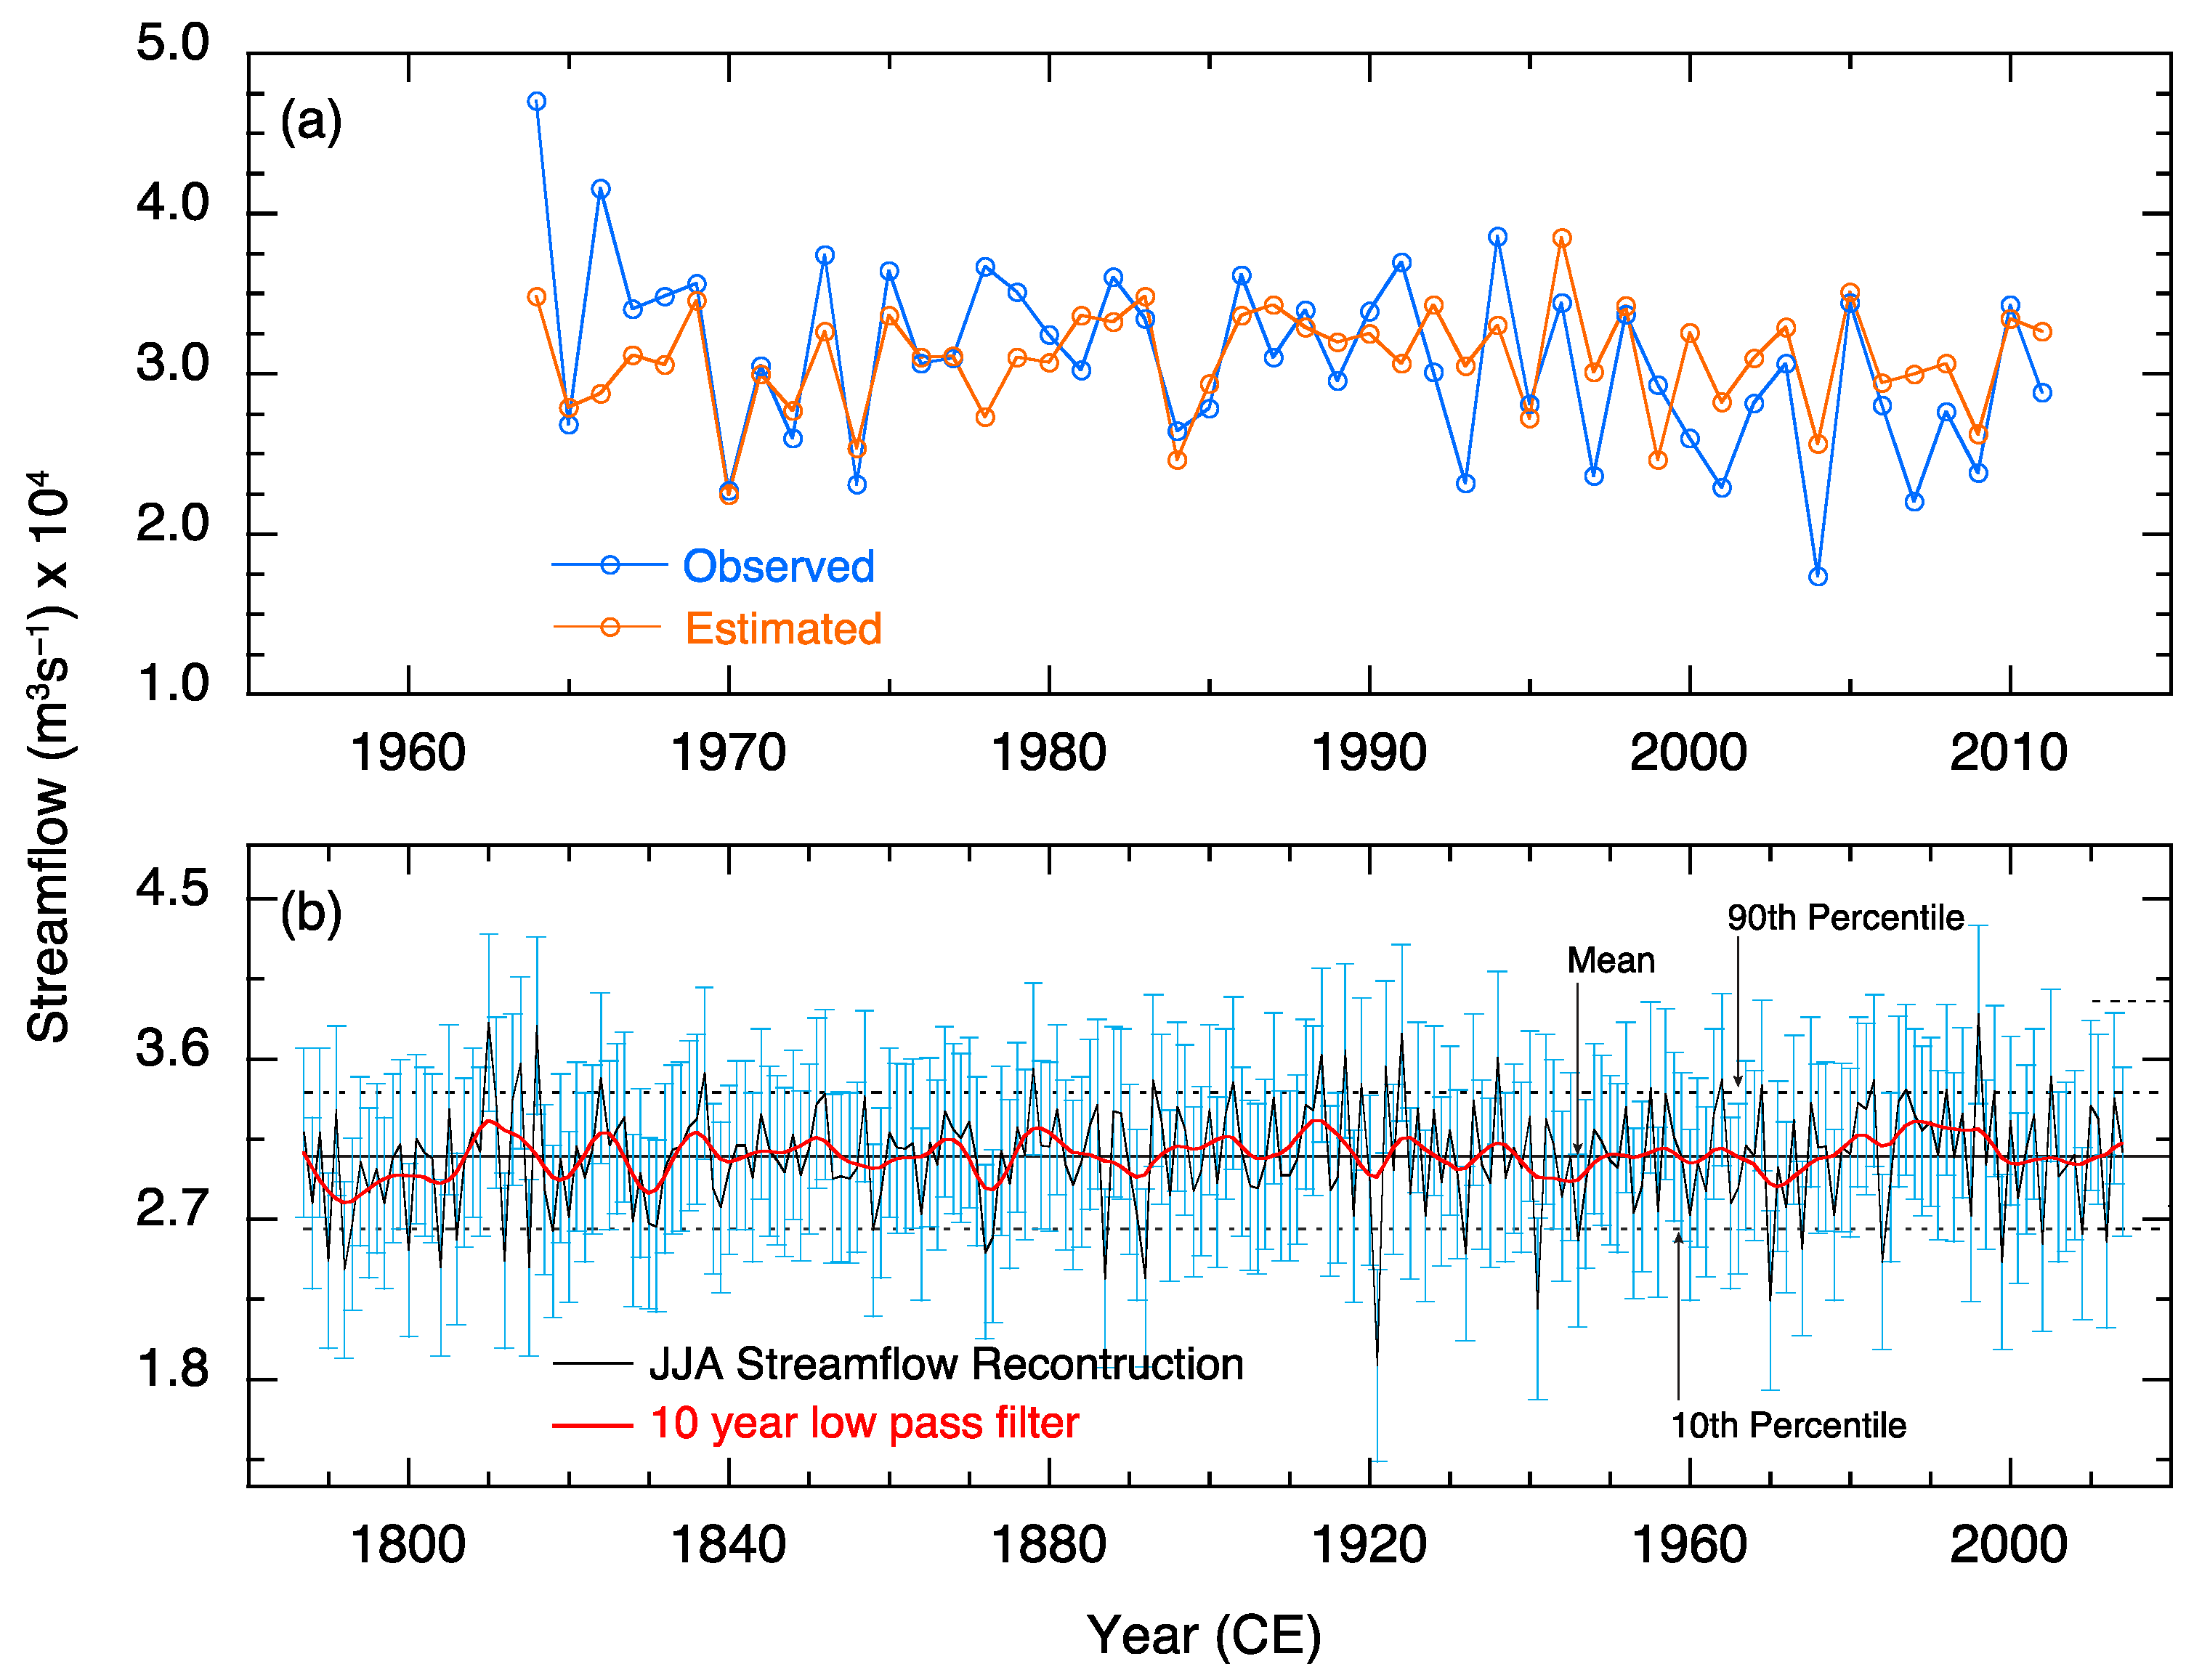
3.3. June–August Streamflow Reconstruction

The average tree-ring chronology for the Kullu Valley calculated based on five site chronologies (PIRO-SS, CEDE-BSS, CEDE-C, CEDE-S, and ABPI-S) was used to reconstruct the June–August streamflow of the Kasol gauge record. The reconstructed June–August streamflow covers 228 years from 1787 to 2014 CE (Figure 4). The calibration model for June–August streamflow explained a total of 36% of the variance from the gauge station records from 1964 to 2011 CE. The “leave-one-out” cross-validation statistics (Table 3) result in a positive RE value (0.30). The values of F-statistics, RMSE, and the Durbin–Watson test (DW) are 25.76, 0.0670, and 1.68, respectively.
The June–August streamflow reconstruction extended from 1787 to 2014 CE and documented a range of variability in flow with several wet and dry episodes (Figure 4). During the reconstruction period, 23 wet years (90th percentile) and 23 dry years (10th percentile) were noted (Figure 4). The annual reconstruction showed above-average high-flow periods during the years 1808–1811, 1823–1827, 1833–1837, 1860–1863, 1876–1881, and 1986–1992 CE and below-average low-flow periods during the year 1792–1798, 1817–1820, 1828–1832, 1853–1856, 1867–1870, 1944–1947, and 1959–1962 CE. Furthermore, a period of prominent prolonged below-average discharge in the low-frequency streamflow record is indicated during the years 1788–1807, 1999–2011, 1966–1977, 1939–1949, and 1854–1864 CE (Figure 2). Additionally, the present reconstruction captured several moderate-to-extreme flow years, and the dry years were matched with the station-declared drought years (1918, 1921, 1927, 1932, 1941, 1946, 1953, 1960, 1970, 1984, 1999, 2004, and 2009) in the Himachal Pradesh [93].
In the power spectral analysis (Figure 5) of streamflow reconstruction, a high-frequency periodicity of 2 to 8.3 years and a low-frequency periodicity of 12.5 years were observed. The wavelet analysis shows that the intensity of high-frequency periodicities observed in the reconstruction has mostly been found to increase over the recent decades. The spatial correlation of reconstructed streamflow with SST (Figure 6) shows a significantly positive correlation with the central–north Pacific flow in the ocean.

4. Discussion

The tree-ring chronologies from the Kullu Valley and adjoining regions showed a positive correlation with precipitation and a negative correlation with temperature in spring and the early monsoon period [79,80,94,95]. Rainfall (precipitation), snow melt, and groundwater storage together contribute to the streamflow [16,96]. In most parts of the Himalayan region, approximately 80% of the total annual flow occurs during the summer months from April to September, which is highest in August as a result of contribution from monsoon rain, preceded by snow and glacial meltwater contribution [1]. In the summer months, the water discharge increases by 20 to 50 times as a result of snow and glacial melting [1], especially during June–August when the temperature reaches its peak. The warming temperature leads to a higher rate of snow and glacial melt, which impacts streamflow and thus influences tree growth, as indicated by their positive correlations.
The “leave-one-out” cross-validation statistics for the reconstruction model result in a positive RE value, which explains the significant accuracy of predictive skill in tree-ring estimates. The F-statistics signifies a linear relationship between the response and tree-ring proxies, and the RMSE value is smaller than the standard deviation from the actual June–August streamflow, indicating that the model results are not a result of over-fitting. Additionally, the Durbin–Watson test expresses very low autocorrelation among regression residuals with normal distribution in the calibration model.
The present streamflow reconstruction captured several moderate-to-extreme flow years, and the dry years were matched with the recorded station-declared drought years. In the drought year 1918, an area of 68.7% of the country was affected [69]. A dry period from 1815 to 1821 was also observed after Tambora eruptions in the Himalayan territory [97,98,99]. Below-average streamflow in 1790, 1792, and 1793 was found in our study during the dry monsoon season drought (East India Drought, 1790–1796). Similar dry and wet periods have also been reported in other streamflow reconstructions, such as in the four-centuries streamflow reconstruction of the Karnali River, central Himalaya [12], and in the Lachen River streamflow reconstruction in eastern Himalaya [65].
Above average flow years 2013, 2005, 1998, 1996, 1992, 1986, 1987, 1924, 1922, and 1908 were captured in the reconstruction match with different high-flow periods recorded in different precipitation and drought reconstructions in this area [23,68,74,100]. The extreme summer monsoon drought in 2004 and the extreme wet year in 2013 captured in our reconstructed data, which created disastrous damage in the region, are consistent with the findings in the central Himalayan region, as reported by Singh et al. [101]. Although some important dry and humid events were captured in the resulting streamflow reconstruction and showed similar results to other research studies in this and nearby regions, some extreme events were missed. For example, the flood years from historical and flow gauge records from this region in 1971, 1978, 1988, 1989, 1995, 2005, and 2013, among which 2005 and 2013 coincide with our reconstruction, and some happened in the year following these incidences, for example, in 1996, which can be explained as a lag effect.
Furthermore, the present streamflow reconstruction was compared with other hydroclimatic reconstructions carried out from the local to regional level from the present study sites (Figure 7). The hydroclimatic reconstructions compared with the present streamflow reconstruction include precipitation reconstruction from Himachal Pradesh [100], precipitation reconstruction from Kishtwar, Kashmir Himalaya [102], the PDSI record from the Hindukush Mountain range in Pakistan [103], the Indus streamflow record at Pratap Bridge [62], and Indus Basin streamflow records at multiple sites, namely Pratap Bridge, Kachora, Dainyor, and Gilgit [63]. During the first dry spell of 1788–1807 CE of the present reconstruction, the lowest flow was recorded during this period. It is comparable to the other records but shows signs of extremely low flows. The precipitation reconstruction from Himachal Pradesh records low precipitation values during this low-flow period (1788–1807) with minimal fluctuation. The precipitation reconstruction from Kishtwar, Kashmir Himalaya, is variable in this period but gradually decreased towards the end. The PDSI record from the Hindukush Mountain range in Pakistan shows a similar trend of dry phase, but slowly, the drought conditions revert back towards a wetter phase by the end of this period. The Indus streamflow record at Pratap Bridge also begins with low flows as in the present record but trends towards a rise in stream flow within this period. The Indus Basin stream flow records at multiple sites observed similar low-flow trends as in the present study during said period. This low-flow period in the early part of the present reconstruction marks the beginning of many further low-flow periods at these Indus River sites and similar concurrent periods in the present record.
The next such period (1817–1821 CE) in the present reconstruction was short, but sudden, extremely low flow was recorded in the region (Figure 7). This period also coincides with the Himachal Pradesh precipitation reconstruction, which was extremely low even before the beginning of this dry phase, with consequent low flow in the region. The Kishtwar precipitation reconstruction does not correspond well to the low-flow trends in the present record during this phase. However, this low-flow period, by its end, marks the beginning of enhanced drought conditions in this Hindukush region PDSI record. Also, the Indus River reconstructions recorded simultaneous low flow as in the present record in said period. The next major low-flow period occurred from 1828 to 1833 CE in the present reconstruction. The Himachal Pradesh precipitation reconstruction also saw a sudden shift in the precipitation pattern, which continued to be low, but the decrease in precipitation was less in comparison with previous low precipitation or flow periods. The precipitation record from Kishtwar also shows a decrease in precipitation in the region parallel to the low flow record in the present record. It again increases suddenly by the end of this period, as in our records. The Hindukush PDSI reconstruction shows a slight lag in enhanced drought and the beginning of a low-flow period in our record, but by the end of the low period, stronger drought begins to occur. The Indus stream flow records have similar low-flow periods during this duration and continue to be low beyond this low-flow period.
There are episodes with minor but low-flow periods recorded in the present stream flow reconstruction, such as from 1854 to 1864 CE (Figure 7). In Himachal Pradesh, there was a sudden drop in precipitation values reconstructed in comparison with the gradual shift towards slightly low flow in our reconstruction in this period. The Kashmir Himalaya precipitation reconstruction also has a low precipitation period during this low-flow period in the present record. The Hindukush PDSI reconstruction recorded lower values, showing an inverse relation with this low-flow period in the present record. The Indus stream flow record at Pratap Bridge is again similar to our record in terms of low flow recorded in this period. At the beginning of this period, all three of the Indus Basin sites recorded high flow regimes in contrast with our record. But towards the middle of this period, the streamflow at these sites was also recorded to have decreased and remained low beyond this period.
The extremely-low-flow period of 1870–1875 CE in the present streamflow reconstruction (Figure 7) is also synchronous to the very low precipitation in Himachal Pradesh and Kashmir Himalaya records, indicating that the hydrological conditions had deteriorated substantially in this period. The PDSI records low drought intensity initially but further increases towards the end of this period in the Hindukush region, and this sudden drought condition escalates and continues beyond this period. The Indus River streamflow reconstructions also continue to be low in this period. Furthermore, the Indus region witnessed a long flow period with minor or no change by the end of our recorded low flow duration.
The subsequent low-flow period from 1886 to 1893 CE recorded extreme variations in the present record, but there was an overall low-flow period (Figure 7). The precipitation reconstructed in Himachal Pradesh is also relatively variable but generally low in the region, in line with this low period in the present record. The regional precipitation in Kashmir Himalaya decreases immensely and corresponds well with the low-flow period of the present reconstruction. The drought intensity recorded in the PDSI reconstruction from the Hindukush region is low and continues beyond this period in contrast with the present low-flow period. The variable flow pattern of the Indus streamflow reconstructions corresponds well to our low-flow regime recorded in the present record.
At the beginning of the twentieth century (1919–1922 CE), a short spell of low-flow years, which were extremely low flows, was recorded in the present reconstruction (Figure 7). The precipitation reconstruction at Himachal Pradesh did not record low values but it increased towards the end of this period. However, the precipitation reconstruction values at Kishtwar Kashmir Himalaya remained low. The PDSI record of Hindukush showed a shift towards extremely dry conditions towards the end of this low-flow period of 1919–1922, and this was the beginning of the strongest drought period observed in this PDSI record in the Hindukush region.
The Indus River stream flow at Pratap Bridge recorded one of the lowest flows prior to this low period in our present record. The following period (1929–1933 CE) again marked short but extremely low flows recorded in the present study area (Figure 7). The precipitation reconstruction records of Himachal Pradesh and Kashmir Himalaya showed variability during the low-flow period but moved towards a declining trend that continued beyond this period. Extreme drought-like conditions were evident in the Hindukush region, with the PDSI record syncing with this low-flow period in the present record. After a short spell of high flow in the Indus River at Pratap Bridge, there was a gradual decline in the streamflow recorded over this period (1929–1933 CE). The other Indus River sites had variable flow patterns during this period, but they were not as low as recorded in this extremely low-flow period at the present study site.
The next prolonged low-flow period for almost a decade spanning from 1939 to 1949 CE is one of the most prominent in the present streamflow reconstruction (Figure 7). The low precipitation recorded in Himachal Pradesh and Kashmir Himalaya is also synchronous with this low-flow record of the present reconstruction. The reconstructed PDSI values of the Hindukush region also indicate the prevailing drought conditions during this decade. But by the end of the decade, the region had recovered and the dry spell had ended towards the last few years of this period. The Indus flow record at Pratap Bridge is variable but ends up declining towards the end of this decade of low flow in the present record. But the other Indus streamflow reconstructions at the sites Kachora, Dainyor, and Gilgit recorded variable streamflow in this decade of low flow in the present data. It begins with higher flows which fluctuate but gradually follow a decreasing trend of the stream flow values reconstructed.
The subsequent period from 1959 to 1962 CE is an extremely short period of low flows in the present reconstruction but is sudden and synchronous with the other comparable records (Figure 7). The precipitation recorded in the Himachal Pradesh study before and after this short time period is extremely high, and thus, the intermittent phase falling in our low-flow period has comparably lower values of precipitation than this extremely high precipitation phase. The Kashmir Himalaya precipitation reconstruction had extremely low values in this time span, also marking the beginning of a prolonged low precipitation phase in the region. The PDSI values remained high in the Hindu Kush region and as the prolonged drought-like conditions began to prevail even before the onset of this low-flow period (1959–1962 CE) of the present reconstruction. The Indus River Pratap Bridge site streamflow reconstruction record also marks the beginning of the long extended low-flow period in the next few decades. This short but distinct flow period in the present reconstruction is parallel with the beginning of a decline in the Indus River flow during the 20th century. The subsequent Indus stream flow records from the other three sites also resonate with the present study stream flow. Here again, we notice the decline in flow pattern at all the sites, which is further prolonged.
The next decade-long low-flow period from 1966 to 1977 CE recorded very little variation in the present reconstruction (Figure 7). The Himachal Pradesh precipitation reconstruction also showed a decline in the strength of precipitation as the low-flow period was experienced in the present study area. The regional precipitation reconstruction from Kashmir Himalaya was extremely low and continued to be low beyond this period. The PDSI values are variable in this period but show distinct trends of drought that existed in the Hindukush region, comparable to the low-flow period in the present study. The Indus streamflow reconstruction record at Pratap Bridge also marks the beginning of the lowest flows extending beyond this period (1966–1972 CE) of low flow in the present study. The other Indus River reconstruction records also have similar periods of low flows, which are prolonged beyond the low-flow spell recorded in the present reconstruction.
The last but final period (1999–2011 CE), low stream flow, records variable flow in the present reconstruction (Figure 7). The precipitation records from Himachal Pradesh, though limited in extent during this period, were trending towards lowered precipitation rates, whereas the Kishtwar precipitation recorded one of the lowest phases, coinciding with our low-flow period (1999–2011 CE). The PDSI recorded an extreme drought phase that continued in the Hindukush region towards the end of this low-flow period. During this period, the Indus River recorded higher flows at the Pratap Bridge site. This is contrary to the low-flow period in the present study. On the other hand, the Indus River flow reconstructions from three sites record a continued spike in flow, trending towards higher flow in recent times. Thus, the sites recorded inverse flow patterns in the Indus River in comparison with the present study.
The power spectral analysis (Figure 5) suggests that small-to-large-scale climate oscillations may be linked with droughts in the western Himalayan region. The high-frequency periodicities observed in the Satluj River streamflow correspond to the El Niño-Southern Oscillation (ENSO) range [104], while decadal periods may be associated with the Pacific Decadal Oscillation (PDO) [105] and solar cycles [106]. These periodicities are also observed in local precipitation, droughts, or streamflow records in the Himalayas [9,11,12,65,107,108,109], Tibetan Plateau, and China region [23,110,111,112]. The droughts of 2009 occurred during a similar El Niño year; however, other drought years, such as 1995 and 2004, occurred in the year following the El Niño event in 1994 and 2003, respectively. Possibly, this can be explained by the lag effect of climate on tree growth in the way that stored food effects offset the impact of El Niño in the same year but hampered photosynthesis due to deficient rainfall felt in the following year and formed wide or narrow tree rings depending on stored food. Similar to our observations, spectral peaks were also observed in different river flow reconstructions in the western and central Himalayan regions [11,12,65,67,68,99] and in the southern Tibetan Plateau [23]. Previous studies also found that ENSO affected hydrological conditions, leading to severe droughts just before, during, and after the ISM season [23,113,114,115]. The wavelet analysis shows that the intensity of high-frequency periodicities observed in the reconstruction has mostly increased over recent decades. Similar observations have also been reported in other hydroclimatic reconstructions from adjoining Himalayan regions [12,23,65].
The spatial correlation of reconstructed streamflow with SST (Figure 6) further supports the periodicity observed in the power spectral analysis. The spatial correlation shows a significantly positive correlation with the central–north Pacific flow in the ocean. This shows that the streamflow variation in the western Himalayan region is linked to SSTs and is influenced by ENSO and PDO. The correlation pattern observed in the present study resembles other findings in nearby areas [23,104,116].
Our monsoon (June–August) streamflow reconstruction in the Satluj River, in western Himalaya, is an updated record that captured the streamflow variabilities of the most recent decades. This reconstruction is longer than the earlier streamflow reconstruction carried out by Shah et al. [69] from the Kullu Valley. Additionally, the earlier reconstruction by Shah et al. [69] was developed using a short river gauge data set, and the reconstruction time span is only 1834 CE and is based on a single tree-ring chronology of C. deodara. Moreover, the reconstruction was for the early or pre-monsoon season, i.e., March–April. Thus, the present streamflow reconstruction can be considered more robust and demonstrates the monsoon’s hydroclimatic scenario in the Kullu Valley of western Himalaya. In the present study, we established the strength of the dendrohydrological potential of the conifer taxa to reconstruct streamflow which is limited to a single gauge station. More such reconstructions based on a higher number of sampling sites and tree-core samples will make it possible to provide more robust streamflow reconstruction of the larger areas of the basin by including multiple gauge station data sets.

5. Conclusions

A 228-year (1787–2014 CE)-long monsoon (June–August) streamflow reconstruction of the Satluj River, western Himalaya, was developed using a tree-ring proxy record of three different conifer tree taxa. The present reconstruction has extended the two-decade-old existing streamflow reconstruction records of the Satluj River to the recent period where climate scenarios have changed substantially. Our streamflow reconstruction is the first monsoon season reconstruction of the runoff variability in the Satluj River Basin in the Kullu Valley. The previous streamflow reconstruction records were mostly of the winter, spring, and early monsoon season variability in the Satluj River flow patterns. The comparison of our reconstruction with other existing records from the Kullu Valley and the adjoining Himalayan region reveals higher regional coherence. Since there are insufficient long-term monsoon season records in the Satluj River catchment, this present streamflow reconstruction would advance our understanding of hydrological conditions in this river under a changing climate. Our reconstruction record can provide useful information on past streamflow variabilities at the decadal to centennial scale. This provides an accurate model of seasonal and annual hydro-climatic variabilities to project climate change scenarios. Such information would help in policy implementation for sustainable use of available freshwater resources, environmentally friendly agricultural practices, and food production. Moreover, the long-term streamflow reconstruction guides respective authorities to adopt constructive strategies to mitigate the effects of climate change. The present study suggests that extending streamflow records by combining existing gauge data with tree-ring proxy datasets can provide better hydrological insights and their potential linkages to the vulnerability towards climatic extremes.

Author Contributions

Conceptualization, S.K.S., A.H. and N.M.; methodology, A.H. and S.K.S.; software, A.H., S.K.S., L.T. and T.W.R.; validation, S.K.S., A.H., N.M., N.I., N.P.G. and D.S.; formal analysis, A.H., S.K.S. and N.M.; investigation, S.K.S.; resources, S.K.S., D.S. and L.T.; data curation, S.K.S., A.H., D.S. and L.T.; writing—original draft preparation, A.H., S.K.S. and N.M.; writing—review and editing, S.K.S., N.M., L.T., D., U.P., N.I., N.P.G. and D.S.; visualization, S.K.S., A.H. and T.W.R.; supervision, S.K.S.; project administration, S.K.S. All authors have read and agreed to the published version of the manuscript.

Funding

The author, Deeksha, was supported by a DST-INSPIRE Fellowship (project number IF 190790). T.W.R. was supported by the Junior Research Fellowship of the University Grants Commission under the UGC NET-JRF scheme, UGC Ref No. 200510639327.

Data Availability Statement

The data that support the findings of this study are available from the corresponding author upon request.

Acknowledgments

The authors (S.K.S., N.M., L.T., Deeksha., T.W.R.) would like to express their gratitude to the Director of the Birbal Sahni Institute of Palaeosciences, Lucknow, for their encouragement to publish this work. This work was carried out under In-house Project 6 with permission number BSIP No. 67/2024-25 to the author S.K.S. The author (A.H.) would also like to thank the director of the BSIP for permitting her to carry out her MSc dissertation through BSIP No. BSIP/IV/SA/Ph.D./2022-23/L-1609, 7/12/2022. The author (S.K.S.) wishes to thank the forest officials, especially Vinod Tiwari, District Forest Officer, Kullu Forest Division, Kullu, Himachal Pradesh, for giving permission and providing necessary facilities for collecting tree-ring samples in 2002. We also sincerely thank the authors of all of the publications from which we have used tree-ring chronologies through digitization. The author (U.P.) is grateful to the Director of the Indian Institute of Tropical Meteorology, Pune, for permission to participate in this research work. The author, Deeksha, would like to thank the Department Head of the Department of Geology, University of Lucknow, for his encouragement. The author, Deeksha, was supported by a DST-INSPIRE Fellowship (project number IF 190790). T.W.R. was supported by the Junior Research Fellowship of the University Grants Commission under the UGC NET-JRF scheme, UGC Ref No. 200510639327. The authors are also grateful to BBMB for providing streamflow data of the Kasol gauge station. The authors are indebted to the anonymous reviewers for both their critical comments and their valuable suggestions to improve the manuscript.

Conflicts of Interest

The authors declare no conflicts of interest.

References

  1. Qazi, N.Q.; Jain, S.K.; Thayyen, R.J.; Patil, P.R.; Singh, M.K. Hydrology of the Himalayas. In Himalayan Weather and Climate and Their Impact on the Environment; Dimri, A.P., Bookhagen, B., Stoffel, M., Yasunari, T., Eds.; Springer: Cham, Switzerland, 2020; pp. 419–450. [Google Scholar] [CrossRef]
  2. Milly, P.C.D.; Wetherald, R.T.; Dunne, K.A.; Delworth, T.L. Increasing risk of great floods in a changing climate. Nature 2002, 415, 514–517. [Google Scholar] [CrossRef] [PubMed]
  3. Arnell, N.W.; Gosling, S.N. The impacts of climate change on river flow regimes at the global scale. J. Hydrol. 2013, 486, 351–364. [Google Scholar] [CrossRef]
  4. Das, S.; Kar, N.S.; Bandyopadhyay, S. Glacial lake outburst flood at Kedarnath, Indian Himalaya: A study using digital elevation models and satellite images. Nat. Hazard. 2015, 77, 769–786. [Google Scholar] [CrossRef]
  5. Gupta, V.; Syed, B.; Pathania, A.; Raaj, S.; Nanda, A.; Awasthi, S.; Shukla, D.P. Hydrometeorological analysis of July-2023 floods in Himachal Pradesh, India. Nat. Hazard. 2024, 120, 7549–7574. [Google Scholar] [CrossRef]
  6. Brohan, P.; Kennedy, J.J.; Harris, I.; Tett, S.F.B.; Jones, P.D. Uncertainty estimates in regional and global observed temperature changes: A new data set from 1850. J. Geophys. Res. 2006, 111, D12106. [Google Scholar] [CrossRef]
  7. Diodato, N.; Bellocchi, G.; Tartari, G. How do Himalayan areas respond to global warming? Int. J. Climatol. 2012, 32, 975–982. [Google Scholar] [CrossRef]
  8. Zhan, Y.-J.; Ren, G.-Y.; Shrestha, A.B.; Rajbhandari, R.; Ren, Y.-Y.; Sanjay, J.; Xu, Y.; Sun, X.-B.; You, Q.-L.; Wang, S. Changes in extreme precipitation events over the Hindu Kush Himalayan region during 1961–2012. Adv. Clim. Chang. Res. 2017, 8, 166–175. [Google Scholar] [CrossRef]
  9. Panthi, S.; Bräuning, A.; Zhou, Z.-K.; Fan, Z.-X. Tree rings reveal recent intensified spring drought in the central Himalaya, Nepal. Glob. Planet. Chang. 2017, 157, 26–34. [Google Scholar] [CrossRef]
  10. Talchabhadel, R.; Karki, R.; Thapa, B.R.; Maharjan, M.; Parajuli, B. Spatio-temporal variability of extreme precipitation in Nepal. Int. J. Climatol. 2018, 38, 4296–4313. [Google Scholar] [CrossRef]
  11. Gaire, N.P.; Dhakal, Y.R.; Shah, S.K.; Fan, Z.X.; Bräuning, A.; Thapa, U.K.; Bhandari, S.; Aryal, S.; Bhuju, D.R. Drought (scPDSI) reconstruction of trans-Himalayan region of central Himalaya using Pinus wallichiana tree-rings. Palaeogeogr. Palaeoclimatol. Palaeoecol. 2019, 514, 251–264. [Google Scholar] [CrossRef]
  12. Gaire, N.P.; Zaw, Z.; Bräuning, A.; Sharma, B.; Raj Dhakal, Y.; Timilsena, R.; Shah, S.K.; Raj Bhuju, D.; Fan, Z.-X. Increasing extreme events in the central Himalaya revealed from a tree-ring based multi-century streamflow reconstruction of Karnali River Basin. J. Hydrol. 2022, 610, 127801. [Google Scholar] [CrossRef]
  13. Sigdel, S.R.; Pandey, J.; Liang, E.; Muhammad, S.; Babst, F.; Leavitt, S.W.; Shen, M.; Zhu, H.; Salerno, F.; Piao, S.; et al. No benefits from warming even for subnival vegetation in the central Himalayas. Sci. Bull. 2021, 66, 1825–1829. [Google Scholar] [CrossRef]
  14. Lutz, A.F.; Immerzeel, W.W.; Shrestha, A.B.; Bierkens, M.F.P. Consistent increase in High Asia’s runoff due to increasing glacier melt and precipitation. Nat. Clim. Chang. 2014, 4, 587–592. [Google Scholar] [CrossRef]
  15. Azam, M.F.; Ramanathan, A.L.; Wagnon, P.; Vincent, C.; Linda, A.; Berthier, E.; Sharma, P.; Mandal, A.; Angchuk, T.; Singh, V.B.; et al. Meteorological conditions, seasonal and annual mass balances of Chhota Shigri Glacier, western Himalaya, India. Ann. Glaciol. 2016, 57, 328–338. [Google Scholar] [CrossRef]
  16. Bookhagen, B.; Burbank, D.W. Toward a complete Himalayan hydrological budget: Spatiotemporal distribution of snowmelt and rainfall and their impact on river discharge. J. Geophys. Res. 2010, 115, F03019. [Google Scholar] [CrossRef]
  17. Zhang, M.; Liu, N.; Harper, R.; Li, Q.; Liu, K.; Wei, X.; Ning, D.; Hou, Y.; Liu, S. A global review on hydrological responses to forest change across multiple spatial scales: Importance of scale, climate, forest type and hydrological regime. J. Hydrol. 2017, 546, 44–59. [Google Scholar] [CrossRef]
  18. Singh, D.; Gupta, R.D.; Jain, S.K. Study of long-term trend in river discharge of Sutlej River (NW Himalayan region). Geogr. Environ. Sustain. 2014, 7, 87–96. [Google Scholar] [CrossRef]
  19. Jaffrés, J.B.D. GHCN-Daily: A treasure trove of climate data awaiting discovery. Comput. Geosci. 2019, 122, 35–44. [Google Scholar] [CrossRef]
  20. Woodhouse, C.A.; Lukas, J.J. Multi-Century Tree-Ring Reconstructions of Colorado Streamflow for Water Resource Planning. Clim. Chang. 2006, 78, 293–315. [Google Scholar] [CrossRef]
  21. Fritts, H.C. Tree Rings and Climate; Academic Press: London, UK, 1976; 567p. [Google Scholar]
  22. DeRose, R.J.; Bekker, M.F.; Wang, S.-Y.; Buckley, B.M.; Kjelgren, R.K.; Bardsley, T.; Rittenour, T.M.; Allen, E.B. A millennium-length reconstruction of Bear River stream flow, Utah. J. Hydrol. 2015, 529, 524–534. [Google Scholar] [CrossRef]
  23. Chen, F.; Shang, H.; Panyushkina, I.P.; Meko, D.M.; Yu, S.; Yuan, Y.; Chen, F. Tree-ring reconstruction of Lhasa River streamflow reveals 472 years of hydrologic change on southern Tibetan Plateau. J. Hydrol. 2019, 572, 169–178. [Google Scholar] [CrossRef]
  24. Rao, M.P.; Cook, E.R.; Cook, B.I.; D’Arrigo, R.D.; Palmer, J.G.; Lall, U.; Woodhouse, C.A.; Buckley, B.M.; Uriarte, M.; Bishop, D.A.; et al. Seven centuries of reconstructed Brahmaputra River discharge demonstrate underestimated high discharge and flood hazard frequency. Nat. Commun. 2020, 11, 6017. [Google Scholar] [CrossRef]
  25. Liu, Y.; Song, H.; An, Z.; Sun, C.; Trouet, V.; Cai, Q.; Liu, R.; Leavitt, S.W.; Song, Y.; Li, Q.; et al. Recent anthropogenic curtailing of Yellow River runoff and sediment load is unprecedented over the past 500 years. Proc. Natl. Acad. Sci. USA 2020, 117, 18251–18257. [Google Scholar] [CrossRef] [PubMed]
  26. Cook, E.R.; Anchukaitis, K.J.; Buckley, B.M.; D’Arrigo, R.D.; Jacoby, G.C.; Wright, W.E. Asian Monsoon Failure and Megadrought During the Last Millennium. Science 2010, 328, 486–489. [Google Scholar] [CrossRef] [PubMed]
  27. Islam, N.; Vennemann, T.; Büntgen, U.; Cherubini, P.; Lane, S.N. Tree-ring hydrological research in the Himalaya: State of the art and future directions. Prog. Phys. Geogr. 2024, 48, 454–489. [Google Scholar] [CrossRef]
  28. Hardman, G. The relationship between Tree-Growths and Stream-Runoff in the Truckee River Basin, California-Nevada. Eos Trans. Am. Geophys. Union. 1936, 17, 491–493. [Google Scholar] [CrossRef]
  29. Cook, E.R.; Jacoby, G.C. Potomac River streamflow since 1730 as reconstructed by tree rings. J. Clim. Appl. Meteorol. 1983, 22, 1659–1672. [Google Scholar] [CrossRef]
  30. Schulman, E. Tree-Ring Hydrology of the Colorado River Basin. University of Arizona: Tucson, AZ, USA, 1946; 51p. [Google Scholar]
  31. Woodhouse, C.A.; Gray, S.T.; Meko, D.M. Updated streamflow reconstructions for the Upper Colorado River basin. Water Resour. Res. 2006, 42, W5415. [Google Scholar] [CrossRef]
  32. Gangopadhyay, S.; Woodhouse, C.A.; McCabe, G.J.; Routson, C.C.; Meko, D.M. Tree rings reveal unmatched 2nd century drought in the Colorado River Basin. Geophys. Res. Lett. 2022, 49, e2022GL098781. [Google Scholar] [CrossRef]
  33. Meko, D.M.; Therrell, M.D.; Baisan, C.H.; Hughes, M.K. Sacramento River flow reconstructed to AD 869 from tree rings. Am. J. Water Resour. 2001, 37, 1029–1039. [Google Scholar] [CrossRef]
  34. Meko, D.M.; Woodhouse, C.A. Application of Streamflow Reconstruction to Water Resources Management. In Dendroclimatology; Hughes, M., Swetnam, T., Diaz, H., Eds.; Book Series Developments in Paleoenvironmental Research (DPER, Volume 11); Springer: Dordrecht, The Netherlands, 2011; pp. 231–261. [Google Scholar] [CrossRef]
  35. St. George, S. Streamflow in the Winnipeg River basin, Canada: Trends, extremes and climate linkages. J. Hydrol. 2007, 332, 396–411. [Google Scholar] [CrossRef]
  36. St. George, S.; Nielson, E. Palaeoflood records for the Red River, Manitoba, Canada, derived from anatomical tree-ring signatures. Holocene 2003, 13, 547–555. [Google Scholar] [CrossRef]
  37. Wu, Y.; Gan, T.Y.; She, Y.; Xu, C.; Yan, H. Five centuries of reconstructed streamflow in Athabasca River Basin, Canada: Non-stationarity and teleconnection to climate patterns. Sci. Total Environ. 2020, 746, 141330. [Google Scholar] [CrossRef] [PubMed]
  38. Jones, P.D.; Briffa, K.R.; Pilcher, J.R. River flow reconstruction from tree rings in southern Britain. J. Climatol. 1984, 4, 461–472. [Google Scholar] [CrossRef]
  39. Formetta, G.; Tootle, G.; Bertoldi, G. Streamflow reconstructions using tree-ring based Paleo Proxies for the Upper Adige River Basin (Italy). Hydrology 2022, 9, 8. [Google Scholar] [CrossRef]
  40. Tootle, G.; Oubeidillah, A.; Elliott, E.; Formetta, G.; Bezak, N. Streamflow Reconstructions Using Tree-Ring-Based Paleo Proxies for the Sava River Basin (Slovenia). Hydrology 2023, 10, 138. [Google Scholar] [CrossRef]
  41. Viorica, N.; Cătălin-Constantin, R.; Andrei, M.; Marian-Ionuț, Ș.; Ionel, P.; Monica, I. The first tree-ring reconstruction of streamflow variability over the last ~250 years in the Lower Danube. J. Hydrol. 2023, 617, 129150. [Google Scholar] [CrossRef]
  42. Agafonov, L.I.; Meko, D.M.; Panyushkina, I.P. Reconstruction of Ob River, Russia, discharge from ring widths of floodplain trees. J. Hydrol. 2016, 543, 198–207. [Google Scholar] [CrossRef]
  43. Holmes, R.L.; Stockton, C.W.; LaMarche, V.C., Jr. Extension of river flow records in Argentina from tree-ring chronologies. J. Am. Water Resour. 1979, 15, 1081–1085. [Google Scholar] [CrossRef]
  44. Cobos, D.R.; Boninsegna, J.A. Fluctuations of some glaciers in the upper Atuel River basin, Mendoza, Argentina. In Quaternary of South America and Antarctica Peninsula, 1st ed.; Cobos, D.R., Boninsegna, J.A., Eds.; CRC Press: Boca Raton, FL, USA, 1983; pp. 61–82. [Google Scholar]
  45. Lara, A.; Villalba, R.; Urrutia, R. A 400-year tree-ring record of the Puelo river summer-fall streamflow in the Valdivian rainforest eco-region, Chile. Clim. Chang. 2008, 86, 331–356. [Google Scholar] [CrossRef]
  46. Lara, A.; Bahamondez, A.; González-Reyes, A.; Munoz, A.A.; Cuq, E.; Ruiz-Gómez, C. Reconstructing streamflow variation of the Baker River from tree-rings in Northern Patagonia since 1765. J. Hydrol. 2015, 529, 511–523. [Google Scholar] [CrossRef]
  47. Urrutia, R.; Lara, A.; Villalba, R.; Christie, D.; Le Quesne, C.; Cuq, A. Multicentury tree ring reconstruction of annual streamflow for the Maule River Watershed in South Central Chile. Water Resour. Res. 2011, 47, W06527. [Google Scholar] [CrossRef]
  48. Barria, P.; Peel, M.C.; Walsh, K.J.; Muñoz, A. The first 300-year streamflow reconstruction of a high-elevation river in Chile using tree rings. Int. J. Climatol. 2018, 38, 436–451. [Google Scholar] [CrossRef]
  49. Allen, K.J.; Nichols, S.C.; Evans, R.; Cook, E.R.; Allie, S.; Carson, G.; Ling, F.; Baker, P.J. Preliminary December–January inflow and streamflow reconstructions from tree rings for western Tasmania, southeastern Australia. Water Resourc. Res. 2015, 51, 5487–5503. [Google Scholar] [CrossRef]
  50. Higgins, P.A.; Palmer, J.G.; Rao, M.P.; Andersen, M.S.; Turney, C.S.M.; Johnson, F. Unprecedented high Northern Australian streamflow linked to an intensification of the Indo-Australian monsoon. Water Resourc. Res. 2022, 58, e2021WR030881. [Google Scholar] [CrossRef]
  51. Higgins, P.A.; Palmer, J.G.; Andersen, M.S.; Turney, C.S.M.; Allen, J.K.; Verdon-Kidd, D.; Cook, E.R. Examining past and projecting future: An 800-year streamflow reconstruction of the Australian Murray river. Environ. Res. Lett. 2023, 18, 104016. [Google Scholar] [CrossRef]
  52. Gou, X.; Chen, F.; Cook, E.; Jacoby, G.; Yang, M.; Li, J. Streamflow variations of the Yellow River over the past 593 years in western China reconstructed from tree rings. Water Resour. Res. 2007, 43, W6434. [Google Scholar] [CrossRef]
  53. Gou, X.; Deng, Y.; Chen, F.; Yang, M.; Fang, K.; Gao, L.; Yang, T.; Zhang, F. Tree ring-based streamflow reconstruction for the Upper Yellow River over the past 1234 years. Chin. Sci. Bull. 2010, 55, 4179–4186. [Google Scholar] [CrossRef]
  54. Yuan, Y.; Shao, X.; Wei, W.; Yu, S.; Gong, Y.; Trouet, V. The potential to reconstruct Manasi River streamflow in the northern Tien Shan Mountains (NW China). Tree-Ring Res. 2007, 63, 81–93. [Google Scholar] [CrossRef]
  55. Yang, B.; Qin, C.; Shi, F.; Sonechkin, D.M. Tree ring-based annual streamflow reconstruction for the Heihe River in arid northwestern China from AD 575 and its implications for water resource management. Holocene 2012, 22, 773–784. [Google Scholar] [CrossRef]
  56. Xiao, D.; Shao, X.; Qin, N.; Huang, X. Tree-ring-based reconstruction of streamflow for the Zaqu River in the Lancang River source region, China, over the past 419 years. Int. J. Biometeorol. 2017, 61, 1173–1189. [Google Scholar] [CrossRef] [PubMed]
  57. Yang, Y.; Chen, Y.; Wang, M.; Sun, H. Reconstruction and analysis of the past five centuries of streamflow on northern slopes on Tianshan Mountains in northern Xinjiang, China. Theor. Appl. Climatol. 2017, 129, 177–184. [Google Scholar] [CrossRef]
  58. Chen, F.; Shang, H.; Panyushkina, I.; Meko, D.; Li, J.; Yuan, Y.; Yu, S.; Chen, F.; He, D.; Luo, X. 500-year tree-ring reconstruction of Salween River streamflow related to the history of water supply in southeast Asia. Clim. Dyn. 2019, 53, 6595–6607. [Google Scholar] [CrossRef]
  59. Cao, H.; Chen, F.; Hu, M.; Hou, T.; Zhao, X.; Wang, S.; Zhang, H. Tree- ring insights into past and future streamflow variations in Beijing, northern China. Water Resourc. Res. 2024, 60, e2024WR038084. [Google Scholar] [CrossRef]
  60. Chen, F.; Man, W.; Wang, S.; Esper, J.; Meko, D.; Büntgen, U.; Yuan, Y.; Hadad, M.; Hu, M.; Zhao, X.; et al. Southeast Asian ecological dependency on Tibetan Plateau streamflow over the last millennium. Nat. Geosci. 2023, 16, 1151–1158. [Google Scholar] [CrossRef]
  61. Gaire, N.P.; Dhakal, Y.R.; Shah, S.K.; Fan, Z.X. Potential of tree-ring chronologies for multi-centennial streamflow reconstructions: An insight from Nepal. Proc. IAHS 2024, 387, 33–39. [Google Scholar] [CrossRef]
  62. Cook, E.R.; Palmer, J.G.; Ahmed, M.; Woodhouse, C.A.; Fenwick, P.; Zafar, M.U.; Wahab, M.; Khan, N. Five centuries of Upper Indus River flow from tree rings. J. Hydrol. 2013, 486, 365–375. [Google Scholar] [CrossRef]
  63. Rao, M.P.; Cook, E.R.; Cook, B.I.; Palmer, J.G.; Uriarte, M.; Devineni, N.; Lall, U.; D’Arrigo, R.D.; Woodhouse, C.A.; Ahmed, M.; et al. Six Centuries of Upper Indus Basin Streamflow Variability and Its Climatic Drivers. Water Resour. Res. 2013, 54, 5687–5701. [Google Scholar] [CrossRef]
  64. Bhattacharyya, A.; Shah, S. Tree-ring studies in India–Past appraisal, present status and future prospects. IAWA J. 2009, 30, 361–370. [Google Scholar] [CrossRef]
  65. Shah, S.K.; Bhattacharyya, A.; Chaudhary, V. Streamflow reconstruction of Eastern Himalaya River, Lachen ‘Chhu’, North Sikkim, based on tree-ring data of Larix griffithiana from Zemu Glacier basin. Dendrochronologia 2014, 32, 97–106. [Google Scholar] [CrossRef]
  66. Shah, S.K.; Singh, R.; Mehrotra, N.; Thomte, L. River flow reconstruction of the Lohit River Basin, North-east India based on tree-rings of Pinus merkusii (Merkus pine). Palaeobotanist 2019, 68, 113–124. [Google Scholar] [CrossRef]
  67. Singh, J.; Yadav, R.R. Tree-ring-based seven century long flow records of Satluj River, western Himalaya, India. Quat. Int. 2013, 304, 156–162. [Google Scholar] [CrossRef]
  68. Misra, K.G.; Yadav, R.R.; Misra, S. Satluj river flow variations since AD 1660 based on tree-ring network of Himalayan cedar from western Himalaya, India. Quat. Int. 2015, 371, 135–143. [Google Scholar] [CrossRef]
  69. Shah, S.K.; Bhattacharyya, A.; Shekhar, M. Reconstructing discharge of Beas river basin, Kullu valley, western Himalaya, based on tree-ring data. Quat. Int. 2013, 286, 138–147. [Google Scholar] [CrossRef]
  70. Meko, D.M.; Woodhouse, C.A.; Morino, K. Dendrochronology and links to streamflow. J. Hydrol. 2012, 412–413, 200–209. [Google Scholar] [CrossRef]
  71. Harley, G.L.; Maxwell, J.T.; Larson, E.; Grissino-Mayer, H.D.; Henderson, J.; Huffman, J. Suwannee River flow variability 1550–2005 CE reconstructed from a multispecies tree-ring network. J. Hydrol. 2017, 544, 438–451. [Google Scholar] [CrossRef]
  72. Stagge, J.H.; Rosenberg, D.E.; DeRose, R.J.; Rittenour, T.M. Monthly paleostreamflow reconstruction from annual tree-ring chronologies. J. Hydrol. 2018, 557, 791–804. [Google Scholar] [CrossRef]
  73. Tamkevičiūtė, M.; Edvardsson, J.; Pukienė, R.; Taminskas, J.; Stoffel, M.; Corona, C.; Kibirkštis, G. Scots pine (Pinus sylvestris L.) based reconstruction of 130 years of water table fluctuations in a peatland and its relevance for moisture variability assessments. J. Hydrol. 2018, 558, 509–519. [Google Scholar] [CrossRef]
  74. Cánovas, J.A.B.; Trappmann, D.; Shekhar, M.; Bhattacharyya, A.; Stoffel, M. Regional flood-frequency reconstruction for Kullu district, Western Indian Himalayas. J. Hydrol. 2017, 546, 140–149. [Google Scholar] [CrossRef]
  75. Singh, J.; Yadav, R.R. Application of tree-ring data in development of long-term discharge. Curr. Sci. 2012, 103, 1452–1454. [Google Scholar]
  76. Jain, S.K.; Tyagi, J.; Singh, V. Simulation of runoff and sediment yield for a Himalayan watershed using SWAT. J. Water Resour. Protect. 2010, 2, 267–281. [Google Scholar] [CrossRef]
  77. Singh, V.; Muñoz-Arriola, F. Improvements in Sub-Catchment Fractional Snowpack and Snowmelt Parameterizations and Hydrologic Modeling for Climate Change Assessments in the Western Himalayas. Hydrology 2021, 8, 179. [Google Scholar] [CrossRef]
  78. Chauhan, M.H.; Sharma, A.; Trivedi, A.; Kumar, K.; Ferguson, D.K.; Rathore, P.S. Late Quaternary vegetation shifts and climate change in the sub-alpine belt of the Parvati Valley, Himachal Pradesh, India. Quat. Int. 2022, 629, 53–64. [Google Scholar] [CrossRef]
  79. Borgaonkar, H.P.; Pant, G.B.; Kumar, K.R. Ring-Width Variations in Cedrus deodara and Its Climatic Response Over the Western Himalaya. Int. J. Climatol. 1996, 16, 1409–1422. [Google Scholar] [CrossRef]
  80. Shah, S.K.; Shekhar, M.; Bhattacharyya, A. Anomalous distribution of Cedrus deodara and Pinus roxburghii in Parbati valley, Kullu, Western Himalaya: An assessment in Dendrochronological perspective. Quat. Int. 2014, 325, 205–212. [Google Scholar] [CrossRef]
  81. Sohar, K.; Altman, J.; Lehečková, E.; Doležal, J. Growth-climate relationships of Himalayan conifers along elevational and latitudinal gradients. Int. J. Climatol. 2017, 37, 2593–2605. [Google Scholar] [CrossRef]
  82. Bunn, A.G. A dendrochronology program library in R (dplR). Dendrochronologia 2008, 26, 115–124. [Google Scholar] [CrossRef]
  83. R Core Team. R Core Team R: A Language and Environment for Statistical Computing; R Foundation for Statistical Computing: Vienna, Austria, 2023; Available online: https://www.R-project.org/ (accessed on 20 January 2024).
  84. Cook, E.R.; Kairiukstis, L.A. Methods of Dendrochronology; Springer: Dordrecht, The Netherlands, 1990; 394p. [Google Scholar] [CrossRef]
  85. Wigley, T.M.L.; Briffa, K.R.; Jones, P.D. On the Average Value of Correlated Time Series, with Applications in Dendroclimatology and Hydrometeorology. J. Clim. Appl. Meteorol. 1984, 23, 201–213. [Google Scholar] [CrossRef]
  86. Khan, M.; Munoz-Arriola, F.; Shaik, R.; Greer, P. Spatial heterogeneity of temporal shifts in extreme precipitation across India. J. Clim. Chang. 2019, 5, 19–31. [Google Scholar] [CrossRef]
  87. Zang, C.; Biondi, F. treeclim: An R package for the numerical calibration of proxy-climate relationships. Ecography 2015, 38, 431–436. [Google Scholar] [CrossRef]
  88. Michaelsen, J. Cross-Validation in Statistical Climate Forecast Models. J. Appl. Meteor. Climatol. 1987, 26, 1589–1600. [Google Scholar] [CrossRef]
  89. Mann, M.E.; Lees, J.M. Robust estimation of background noise and signal detection in climatic time series. Clim. Chang. 1996, 33, 409–445. [Google Scholar] [CrossRef]
  90. Torrence, C.; Compo, G.P. A practical guide to wavelet analysis. Bull. Amer. Meteor. Soc. 1998, 79, 61–78. [Google Scholar] [CrossRef]
  91. Rayner, N.A.; Parker, D.E.; Horton, E.B.; Folland, C.K.; Alexander, L.V.; Rowell, D.P.; Kent, E.C.; Kaplan, A. Global analyses of sea surface temperature, sea ice, and night marine air temperature since the late nineteenth century. J. Geophys. Res. Atmos. 2003, 108. [Google Scholar] [CrossRef]
  92. Trouet, V.; Oldenborgh, G.J.V. KNMI Climate Explorer: A Web-Based Research Tool for High-Resolution Paleoclimatology. Tree-Ring Res. 2013, 69, 3–13. [Google Scholar] [CrossRef]
  93. Chandel, V.; Brar, K. Drought in Himachal Pradesh, India: A historical-geographical perspective, 1901–2009. Trans. Inst. Indian Geogr. 2013, 35, 259–273. [Google Scholar]
  94. Borgaonkar, H.P.; Pant, G.B.; Kumar, K.R. Tree-Ring Chronologies from Western Himalaya and their Dendroclimatic Potential. IAWA J. 1999, 20, 295–309. [Google Scholar] [CrossRef]
  95. Singh, J.; Park, W.-K.; Yadav, R.R. Tree-ring-based hydrological records for western Himalaya, India, since A.D. 1560. Clim. Dyn. 2006, 26, 295–303. [Google Scholar] [CrossRef]
  96. Andermann, C.; Bonnet, S.; Crave, A.; Davy, P.; Longuevergne, L.; Gloaguen, R. Sediment transfer and the hydrological cycle of Himalayan rivers in Nepal. Comptes Rendus Geosci. 2012, 344, 627–635. [Google Scholar] [CrossRef]
  97. Cook, E.R.; Krusic, P.J.; Jones, P.D. Dendroclimatic signals in long tree-ring chronologies from the Himalayas of Nepal. Int. J. Climatol. 2003, 23, 707–732. [Google Scholar] [CrossRef]
  98. Liang, E.; Dawadi, B.; Pederson, N.; Piao, S.; Zhu, H.; Sigdel, S.R.; Chen, D. Strong link between large tropical volcanic eruptions and severe droughts prior to monsoon in the central Himalayas revealed by tree-ring records. Sci. Bull. 2019, 64, 1018–1023. [Google Scholar] [CrossRef]
  99. Gaire, N.P.; Fan, Z.X.; Shah, S.K.; Thapa, U.K.; Rokaya, M.B. Tree-ring record of winter temperature from Humla, Karnali, in central Himalaya: A 229 years-long perspective for recent warming trend. Geogr. Ann. Ser. A 2020, 102, 297–316. [Google Scholar] [CrossRef]
  100. Singh, J.; Yadav, R.R.; Wilmking, M. A 694-year tree-ring based rainfall reconstruction from Himachal Pradesh, India. Clim. Dyn. 2009, 33, 1149–1158. [Google Scholar] [CrossRef]
  101. Singh, J.; Singh, N.; Chauhan, D.P.; Yadav, R.; Mayr, C.; Rastogi, T. Tree-ring δ18O records of abating June-July monsoon rainfall over the Himalayan region in the last 273 years. Quat. Int. 2019, 532, 48–56. [Google Scholar] [CrossRef]
  102. Singh, V.; Misra, K.G.; Singh, A.D.; Yadav, R.R.; Yadava, A.K. Little Ice Age revealed in tree-ring based precipitation record from the northwest Himalaya, India. Geophys. Res. Lett. 2021, 48, e2020GL091298. [Google Scholar] [CrossRef]
  103. Ahmad, S.; Zhu, L.; Yasmeen, S.; Zhang, Y.; Li, Z.; Ullah, S.; Han, S.; Wang, X. A 424-year tree-ring-based Palmer Drought Severity Index reconstruction of Cedrus deodara D. Don from the Hindu Kush range of Pakistan: Linkages to ocean oscillations. Clim. Past 2020, 16, 783–798. [Google Scholar] [CrossRef]
  104. Bridgman, H.A.; Oliver, J.E. The Global Climate System: Patterns, Processes, and Teleconnections; Cambridge University Press: Cambridge, UK, 2014. [Google Scholar]
  105. Wang, S.Y.; Gillies, R.R. Influence of the Pacific quasi-decadal oscillation on the monsoon precipitation in Nepal. Clim. Dyn. 2013, 40, 95–107. [Google Scholar] [CrossRef]
  106. Shrestha, A.; Wake, C.; Dibb, J.; Mayewski, P. Precipitation fluctuations in the Nepal Himalaya and its vicinity and relationship with some large scale climatological parameters. Int. J. Climatol. 2000, 20, 317–327. [Google Scholar] [CrossRef]
  107. Yadav, R.R. Long-term hydroclimatic variability in monsoon shadow zone of western Himalaya, India. Clim. Dyn. 2011, 36, 1453–1462. [Google Scholar] [CrossRef]
  108. Yadav, R.R.; Misra, K.G.; Kotlia, B.S.; Upreti, N. Premonsoon precipitation variability in Kumaon Himalaya, India over a perspective of ~300 years. Quat. Int. 2014, 325, 213–219. [Google Scholar] [CrossRef]
  109. Gaire, N.P.; Bhuju, D.R.; Koirala, M.; Shah, S.K.; Carrer, M.; Timilsena, R. Tree-ring based spring precipitation reconstruction in western Nepal Himalaya since AD 1840. Dendrochronologia 2017, 42, 21–30. [Google Scholar] [CrossRef]
  110. Liu, N.; Bao, G.; Liu, Y.; Linderholm, H.W. Two Centuries-Long Streamflow Reconstruction Inferred from Tree Rings for the Middle Reaches of the Weihe River in Central China. Forests 2019, 10, 208. [Google Scholar] [CrossRef]
  111. Zaw, Z.; Fan, Z.; Bräuning, A.; Xu, C.; Liu, W.; Gaire, N.P.; Panthi, S.; Than, K.Z. Drought Reconstruction Over the Past Two Centuries in Southern Myanmar Using Teak Tree-Rings: Linkages to the Pacific and Indian Oceans. Geophys. Res. Lett. 2020, 47, e2020GL087627. [Google Scholar] [CrossRef]
  112. Zaw, Z.; Fan, Z.-X.; Bräuning, A.; Liu, W.; Gaire, N.P.; Than, K.Z.; Panthi, S. Monsoon precipitation variations in Myanmar since AD 1770: Linkage to tropical ocean-atmospheric circulations. Clim. Dyn. 2021, 56, 3337–3352. [Google Scholar] [CrossRef]
  113. Wang, B.; Ding, Q.; Jhun, J.-G. Trends in Seoul (1778–2004) summer precipitation. Geophys. Res. Lett. 2006, 33, L15803. [Google Scholar] [CrossRef]
  114. Palmer, J.G.; Cook, E.R.; Turney, C.S.M.; Allen, K.; Fenwick, P.; Cook, B.I.; O’Donnell, A.; Lough, J.; Grierson, P.; Baker, P. Drought variability in the eastern Australia and New Zealand summer drought atlas (ANZDA, CE 1500–2012) modulated by the Interdecadal Pacific Oscillation. Environ. Res. Lett. 2015, 10, 124002. [Google Scholar] [CrossRef]
  115. Shi, H.; Wang, B.; Cook, E.R.; Liu, J.; Liu, F. Asian Summer Precipitation over the Past 544 Years Reconstructed by Merging Tree Rings and Historical Documentary Records. J. Clim. 2018, 31, 7845–7861. [Google Scholar] [CrossRef]
  116. Thomte, L.; Shah, S.K.; Mehrotra, N.; Bhagabati, A.K.; Saikia, A. Influence of climate on multiple tree-ring parameters of Pinus kesiya from Manipur, Northeast India. Dendrochronologia 2022, 71, 125906. [Google Scholar] [CrossRef]
Figure 1. Map showing the tree-ring sampling sites (Table 1) and river gauge stations, Kasol in Himachal Pradesh, western Himalaya. Digital terrain elevation is from the ASTER dataset (https://search.earthdata.nasa.gov, accessed on 1 November 2024).
Quaternary 08 00009 g001
Figure 2. Tree-ring chronologies from the Kullu Valley, western Himalaya: (a) average tree-ring chronology of A. pindrow, ABPI-S [81], (b) tree-ring chronology of A. pindrow, ABPI-C [74], (c) average tree-ring chronology of C. deodara, [CEDE-BSS] [69,79,80], (d) average tree-ring chronology of C. deodara, CEDE-C [74], (e) average tree-ring chronology of C. deodara, CEDE-S [81], (f) average tree-ring chronology of P. smithiana, PCSM-S [81], and (g) tree-ring chronology of P. roxburghii, PIRO-SS [69,80].
Quaternary 08 00009 g002
Figure 3. Correlation coefficient of tree-ring chronologies: (a) average tree-ring chronology of A. pindrow, ABPI-S [81], (b) tree-ring chronology of A. pindrow, ABPI-C [74], (c) average tree-ring chronology of C. deodara, [CEDE-BSS] [69,79,80] (d) average tree-ring chronology of C. deodara, CEDE-C [74], (e) average tree-ring chronology of C. deodara, CEDE-S [81], (f) average tree-ring chronology of P. smithiana, PCSM-S [81], (g) tree-ring chronology of P. roxburghii, PIRO-SS [69,80], and (h) average tree-ring chronology of multiple taxa (PIRO-SS, CEDE-BSS, CEDE-C, CEDE-S, and ABPI-S) with the streamflow record of Kasol, Satluj River. The asterisk (*) mark in the x-axis represents month of previous year.
Quaternary 08 00009 g003
Figure 4. (a) Observed and estimated June–August streamflow of the Kasol gauge station, Satluj River; (b) reconstructed June–August streamflow spanning 1787–2014 CE with a 10-year low-pass filter, long-term mean, and extreme high-flow and low-flow based on the 90th and 10th percentiles, respectively.
Quaternary 08 00009 g004
Figure 5. (a) Spectral analysis and (b) Morlet wavelet spectrum (black contours) at the 95% significant level of the reconstructed June–August streamflow of Satluj River during the timeframe 1787–2014 CE.
Quaternary 08 00009 g005
Figure 6. Spatial correlations between the reconstructed June–August streamflow of Satluj River and Had1SST1 [50]. The correlation is calculated for the time period of 1872–2014 CE.
Quaternary 08 00009 g006
Figure 7. Temporal comparison of (a) the June–August streamflow of the Satluj River (this study) with proxy-based hydroclimatic reconstructions, (b) precipitation reconstruction from Himachal Pradesh [100], (c) precipitation reconstruction from Kishtwar, Kashmir Himalaya [102], (d) PDSI record from the Hindukush Mountain range in Pakistan [103], (e) Indus streamflow record at Pratap Bridge [62], and Indus Basin streamflow records at multiple sites, namely (f) Kachora, (g) Dainyor, and (h) Gilgit [63]. The Z-score is calculated based on the long-term mean and standard deviation for each time series compared.
Quaternary 08 00009 g007
Table 2. Tree-ring chronology statistics of the tree-ring chronologies used from the Kullu Valley, Kullu district, western Himalaya.
CRNFYRLYRNYRMSSDRbarEPSEPS > 0.85References
PIRO-SS186120021360.200.1220.2400.8741928[69,80]
CEDE-BSS168620023170.270.1480.2160.8851878[69,79,80]
CEDE-C179520142200.280.2620.228 0.912 1820[74]
CEDE-S183620131780.310.9900.500>0.851919[81]
PCSM-S166520133490.211.1600.370>0.851775[81]
ABPI-S167620133380.230.6500.410>0.851787[81]
ABPI-C172820132860.290.3010.1690.8671805[81]
CRN = chronology code, FYR = first year, LYR = last year, NYR = chronology time span/length, MS = mean sensitivity, SD = standard deviation, Rbar = inter-series correlation, and EPS = expressed population signal, EPS > 0.85 = year with EPS threshold achieved.
Table 3. Statistics of leave-one-out cross-validation for June–August streamflow reconstruction for the Kasol gauge station, Satluj River, western Himalaya.
R2 R2adjRF-Valuep-ValueRERMSEcRMSEvDW
0.3590.3450.5725.760.000010.300.06700.06851.68
R2 = explained variance; R2adj = adjusted explained variance; R = correlation co-efficient, RE = reduction of error; RMSEc = root mean square for calibration, RMSEv = root mean square for verification; DW = Durbin–Watson statistics.
Disclaimer/Publisher’s Note: The statements, opinions and data contained in all publications are solely those of the individual author(s) and contributor(s) and not of MDPI and/or the editor(s). MDPI and/or the editor(s) disclaim responsibility for any injury to people or property resulting from any ideas, methods, instructions or products referred to in the content.

