Article

Current Phylogeographic Structure of Anemone altaica (Ranunculaceae) on the Khamar-Daban Ridge Reflects Quaternary Climate Change in Baikal Siberia

by
Marina Protopopova
1,*,
Polina Nelyubina
1,2 and
Vasiliy Pavlichenko
1
1
Siberian Institute of Plant Physiology and Biochemistry, Siberian Branch of the Russian Academy of Sciences, Lermontov St., 132, 664033 Irkutsk, Russia
2
Faculty of Biology and Soil Sciences, Irkutsk State University, Karl Marx St., 1, 664003 Irkutsk, Russia
*
Author to whom correspondence should be addressed.
Quaternary 2025, 8(2), 20; https://doi.org/10.3390/quat8020020
Submission received: 21 September 2024 / Revised: 26 March 2025 / Accepted: 3 April 2025 / Published: 22 April 2025

Abstract

:
Anemone altaica Fisch. ex C. A. Mey., a component of the tertiary boreo-nemoral vegetation complex, exhibits a disjunct distribution from European Russia to Central China. The Khamar-Daban Ridge, extending along Lake Baikal’s southern coast, has served as a refugium preserving mesophilic forest remnants in South Siberia since the Pleistocene. This study aimed to elucidate the phylogenetic relationships and historical biogeography of A. altaica within the Khamar-Daban refugium using plastid DNA markers (trnL + trnL-trnF). Phylogenetic and mismatch distribution analysis revealed polyphyly (more specifically diphyly) among A. altaica lineages, suggesting past hybridization events with related species followed by backcrossing. Estimation of isolation by distance effect, spatial autocorrelation analysis, PCoA, and AMOVA indicated a clear spatial genetic structure for A. altaica on the Khamar-Daban Ridge. The most reliable geographical model suggests that during periods of Pleistocene cooling, A. altaica persisted in at least six microrefugia within the ridge. Populations associated with these microrefugia formed western, central, and eastern genetic supergroups with limited gene flow among them. Gene flow likely occurred more easily during glaciations or early interglacials when the subalpine zone shifted closer to Lake Baikal due to the depression of the snow boundary, allowing adjacent populations to intermingle along the glacial edges and terminal moraines in mountain forest belt.

1. Introduction

Anemone altaica Fisch. ex C. A. Mey. refers to the tertiary boreo-nemoral vegetation complex and currently exhibits a strongly disjunctive distribution, stretching from the Arctic regions of European Russia to Central China. The species is occasionally regarded as infraspecific taxon of European A. nemorosa L. and has close related and vicariant taxa in East Asia and North America, e.g., A. amurensis (Korsh.) Kom. and A. quinquefolia L. However, comprehensive molecular phylogenetic reconstructions of Anemone L. have not yet fully resolved its phylogenetic relationships with these closely related species, primarily due to the limited sampling of these taxa. At present, at least half of A. altaica range is located in North and Northeast Asia. The range disjunction occurred due to dramatic changes in climatic condition during the Late Cenozoic, particularly progressive cooling and increased continentality, culminating in the Pleistocene. Although North Asia was not covered by a continuous ice shield during the Pleistocene, its vegetation underwent significant alteration compared to its state in the Pliocene [1,2]. Specifically, the degradation of the Tertiary boreo-nemoral floristic complex finally resulted in the fragmentation of the trans-Palearctic broad-leaved forest zone into European and East Asian distinct segments, creating an expansive ‘gap’ spanning continental Eastern Siberia and Central Asia. The mountains of South Siberia played a crucial role as refugia in preserving mesophilous remnants of broad-leaved forests during the Pleistocene [1,2]. This highlights the great importance of these mountains in maintaining the biological diversity of the region. Within South Siberia, well-defined refugia are located in the mountainous areas and foothills of Gornaya Shoria, the Northeastern and Southwestern Altai, the Western Sayan and Eastern Sayan Mountains, and the Khamar-Daban Ridge [3,4,5,6]. The northern macroslope of the Khamar-Daban Ridge, which stretches approximately 320 km from west to east along the southern coast of Lake Baikal [5] and contributes to the formation of its catchment area, represents the easternmost concentration of nemoral relict species among the refugia areas mentioned above [4]. The bottom sediments analysis of Lake Baikal revealed that a nemoral dark coniferous–broad-leaved complex dominated Cis-Baikal region until approximately the midpoint of the Late Pliocene, acquiring more boreal features around the turn of the Pliocene and Eopleistocene [7]. The current climatic conditions here are determined by the influence of the water masses of Lake Baikal and the barrier role of the Khamar-Daban Ridge itself, which sets it apart from the adjacent regions in the south of Eastern Siberia. The climate along the northern macroslope of the ridge exhibits a milder character, featuring increased precipitation and a robust snow coverage, thereby approximating that of a temperate continental conditions [4,8,9]. The relatively even and humid climate contributes to the dominance of dark-coniferous forests, preserving nemoral relict species and allowing for their abundant distribution over a large area. The presence of a nemoral refugium on the northern macroslope of the Khamar-Daban Ridge was first demonstrated by N.A. Epova in 1956 [4,6]. The Pleistocene glaciations in this area had a mountain-valley character [5,7,10,11], which, combined with the fact that nemoral relicts are mostly confined to river and watercourses [12], resulted in the formation of microrefugia in certain valleys of major rivers within the Khamar-Daban Ridge. Originating from the dark coniferous-broad-leaved biome, A. altaica may considered here as Tertiary nemoral relict species [13,14,15]. The present distribution of A. altaica on the ridge extends along its northern macroslope, expanding towards the west up to the Burovshina River [15] and towards the east up to the Timlyuy River near Kamensk settlement (this study). Anemone altaica grows here in floodplain forests and confines to riverbeds and streams. In the highlands, the species is often found in subalpine high-grass meadows. The phylogeographic structure of A. altaica has not been studied, and we know little about how populations survived the Pleistocene cold spells and glaciations on the Khamar-Daban Ridge and how they re-expanded during more favorable periods.
This study aimed to elucidate the phylogenetic relationships of A. altaica with closely related species and to shed light on its historical biogeography within the Khamar-Daban Ridge refugium during climate changes in the late Cenozoic, using molecular markers.

2. Materials and Methods

2.1. Sample Collection

From three to ten individuals were collected from each natural population, and single specimens per species were taken from herbarium collections. Each fresh sample was placed in an individual filter paper bag (23 g·m−2), dried, and stored in dry silica gel until DNA isolation. Anemone altaica plants were collected from 24 natural populations on the Khamar-Daban Ridge (KhD) and Western Sayan Mountains (WS) and respective vouchers were stored in herbarium of Irkutsk State University (IRKU, Irkutsk, Russia). The samples of A. reflexa Steph. & Willd. were collected from the Khamar-Daban Ridge as a reference. The sample of Anemone nemorosa L. was collected from herbarium of V.F. Kuprevich Institute of Experimental Botany of the National Academy of Sciences of Belarus (MSK, Minsk, Republic of Belarus) and A. quinquefolia L. from the herbarium of the Federal Scientific Center of the East Asia Terrestrial Biodiversity of the Far Eastern Branch of the Russian Academy of Sciences (VLA, Vladivostok, Russia). A total of 228 specimens were collected and analyzed. The detailed list of samples is presented in Table 1.

2.2. DNA Isolation, PCR, and Sequencing

Total DNA was isolated from silica gel-dried leaf tissue following the cetyltrimethylammonium bromide (CTAB) method [16] with some authors’ modifications [17]. For phylogenetic reconstruction, sequences of trnL intron and trnL-trnF intergenic spacer of plastid DNA (ptDNA) were used as molecular markers. DNA region including both markers was amplified as an entire fragment using the combination of forward (c) and reverse (f) primers described in the study of P. Taberlet et al. [18]. Polymerase chain reaction (PCR) was performed in 20 μL reaction mixture containing 0.5 units of GoTaq Flexi DNA Polymerase (Promega, Madison, WI, USA), 1 × Green GoTaq Flexi Buffer, 2.5 mM of MgCl2, 250 µM of each dNTP, and 250 nM of each primer. The amplification conditions were 95 °C for 5 min., followed by 35 cycles at 95 °C for 30 s; 57 °C for 30 s, and 72 °C for 1.5 min., with a final extension at 72 °C for 5 min. In the case of herbarium samples, insufficient amplification of the fragment, including both the trnL intron and trnL-trnF region was observed due to DNA degradation, probably caused by long-term storage and treatments involving freezing and/or insecticides. In this case, amplification of each of the two markers was carried out separately, using the primer combinations of c + d for trnL intron and e + f for trnL-trnF [18]. The reaction mixture and amplification condition for both markers were the same as described above, with the only difference being that extension time was reduced to 1 min in each cycle.
Amplicons were visualized in 1% agarose gel stained by ethidium bromide after electrophoresis, then gel-purified using the GeneJET Gel Extraction Kit (Thermo Fisher Scientific, Vilnius, Lithuania), and Sanger sequenced using the BigDye Terminator Cycle Sequencing Kit version 3.1 (Applied Biosystems, Waltham, MA, USA) in a 3500 Genetic Analyzer (Applied Biosystems and Hitachi, Tokyo, Japan). Each amplicon was sequenced using four different region-specific primers (c, d, e, and f).

2.3. Sequence Alignment and Phylogenetic Analysis

Raw sequencing data were edited using SnapGene Viewer software version 2.6.2 (GSL Biotech, San Diego, CA, USA) and MEGA software version 7.0.16 [19] and deposited in GenBank of the National Center for Biotechnology Information (NCBI, https://www.ncbi.nlm.nih.gov, accessed on 10 August 2024). For analysis, we aligned original DNA sequences of A. altaica with the sequences of closely related species (Table 2).
The trnL intron and the trnL-trnF markers were analyzed as combined dataset. The multiple alignments of nucleotide sequences by the MUSCLE application with a gap opening penalty of 500 and an extension penalty of 4 were conducted in MEGA, followed by manual editing. The generated insertion/deletion regions in alignments were considered one evolutionary event, were coded as binary characters (the presence ‘1’ or absence ‘0’ of the gap), and included as a separate binary data partition at the end of the matrix. In particular, 32 indels (site # 50–54, 68–83, 111, 112–114, 187–190, 198–201, 233, 253–266, 282–285, 292, 294–330, 331–333, 338–344, 582–583, 605–609, 610, 610–611, 610–612, 610–613, 610–614, 610–615, 610–617, 645–679, 708–717, 772–775, 779–788, 793–798, 799–804, 821–824, 832–839, 851, 851–854) from a total length of 915 alignment positions, were coded as binary data.
Phylogenetic reconstructions were obtained independently by the maximum likelihood (ML) method based on multiple nucleotide sequence alignments in MEGA and the Bayesian inference (BI) method based on the matrices combining the nucleotide alignments and binary (gaps) datasets in MrBayes version 3.2.5 [24]. The best-fit model of nucleotide substitutions based on the lowest Bayesian Information Criterion (BIC) calculated using the “find best DNA/protein models” tool in MEGA (Neighbor-Joining tree to use and ML as a statistical method were applied as the settings) was selected and then used to perform the analysis. Nucleotide frequencies calculated using the ‘find best DNA/protein models’ tool were also included to optimize the models implemented in MrBayes in the case of the Bayesian inference analysis.
For ML analysis, the Tamura 3-parameter model (T92, [25]) with no among-site rate variation was used for the entire trnL + trnL-trnF dataset and omitting the binary matrix. The initial tree for the heuristic search was obtained by applying the neighbor-joining method to a matrix of pairwise distances estimated using the maximum composite likelihood (MCL) approach. All aligned positions, including the indels, were used in the analysis. A bootstrap of 1000 replicates was used as a test of the phylogeny and the bootstrapped 50% majority-rule consensus trees were constructed.
The BI analysis of the nucleotide datasets was performed using the models implemented in MrBayes, with optimized parameters to better correspond with the model used in the ML analysis. The BI analysis was performed by specifying the model and parameters for each partition of the datasets separately using the ‘applyto’ option. For the DNA sequence data, the HKY-like model [26] was used, with the base frequencies optimized for the T92 model and fixed on the following values: trnL partition: A = 0.34, C = 0.16, G = 0.16, and T = 0.34; trnL-trnF partition: A = 0.35, C = 0.15, G = 0.15, and T = 0.35, with no evolutionary rate variation among the sites for both partitions. The indel partition was analyzed using the F81-like model [27] implemented in MrBayes, with equal stationary state frequencies to match the JC69 model [28].
For each dataset, two simultaneous and independent Markov chain Monte Carlo (MCMC) analyses were run with four parallel chains up to 10,000,000 generations, with sampling every 100 generations and diagnostic calculations every 1000 generations. The first 25% of samples from the cold chain were discarded. The standard deviation of split frequencies below 0.01 was regarded as sufficient convergence, and that value was considered chain stationarity being reached. The fluctuations of the cold chain likelihood in the stable range were also considered for the estimate of reaching stationarity. The sampled trees from both analyses were pooled, and 50% majority-rule consensus trees were constructed from 13,532 trees to estimate clade posterior probability values (PP). The final phylogenetic trees were edited in FigTree version 1.4.3 [29].
The final phylogenetic tree is presented as BI phylogram, with the additional indication of bootstrap values (BS) for the clades on the corresponding ML tree.
A network based on the trnL + trnL-trnF alignment was constructed using the TCS method [30] implemented in PopART software v. 1.7 [31].
The Analysis of Molecular Variance (AMOVA), nucleotide diversity (π), number of segregating sites (S), and Tajima’s D test of neutrality [32] were also calculated using PopArt. The AMOVA was conducted to evaluate several geographical hypotheses regarding A. altaica on the Khamar-Daban Ridge utilizing Ф-statistics [33] which is an optimized approach for haploid data. Specifically, we tested hypotheses concerning 23 distinct populations (without grouping) and explored the potential grouping of these populations into four to six groups, each associated with potential Pleistocene microrefugia, at least four of which were predicted in our previous studies [5,17]. The groups associated with microrefugia, as well as the corresponding micrirefugia discussed in the text, are designated by Roman numerals (I–VI) and are numbered from west to east along the Khamar-Daban Ridge. The hypotheses we tested varied not only in the number of population groups but also in the boundaries of the zones associated with the putative microrefugia, specifically the population composition of these groups. This variation primarily arises from the fact that border populations tend to belong more significantly to one of the adjacent refugia than to the other. This issue was particularly relevant for the boundaries between Microrefugia II and III, as well as between III and IV. In the first case, this involved the locations of populations along the Maliy Mamay and Vydrinaya rivers (localities MM1 and V1), while in the second case, it pertained to the positioning of populations along the Pereemnaya River (locality Pr1). Additionally, we examined three geographical supergroups: western (W), central (C), and eastern (E), which encompassed Microrefugium I, Microrefugia II + III + IV, and Microrefugia V + VI, respectively (Table 2). A more detailed explanation of the hypotheses tested is provided in the results section.
Calculations of genetic diversity metrics, including the Information Index for genetic diversity (equivalent to the Shannon-Weaver Index) and Ф’-indexes (standardized Ф-statistics), Principal Coordinates Analysis (PCoA), and tests of Wright’s Isolation by Distance (IBD) hypothesis [34], as well as estimations of global and local spatial autocorrelation, were performed using GenAlEx v.6.5. [35,36]. The PCoA of all samples was performed using a distance matrix with data standardization. In this case, pairwise distances were calculated following the method outlined by D.R. Huff et al. [37]. Additionally, the PCoA on populations was conducted using a covariance matrix with data standardization based on pairwise Nei unbiased genetic distances [38]. The impact of isolation by distance (IBD) was evaluated by correlating the matrix of geographic distances between populations with the matrix of their genetic differentiation values (Ф-statistics). This analysis was performed using a Mantel test [39,40], which involved statistical testing through 10,000 random permutations. Global spatial autocorrelation was estimated using the method developed by P.E. Smouse & R. Peakall [41], as implemented in GenAlEx. Statistical testing for spatial autocorrelation was performed based on 1000 random permutations, along with bootstrap resampling using 1000 replicates. The significance of the overall correlogram was assessed using the heterogeneity test as outlined by P.E. Smouse et al. [42]. Additionally, the 2-Dimensional Local Spatial Autocorrelation (2D LSA) approach proposed by M.C. Double et al. [43] was employed to examine local patterns of spatial genetic autocorrelation across a two-dimensional landscape. Significance testing was conducted using one-tailed or two-tailed tests with 1000 permutations. Analysis of mismatch distribution was performed in Microsoft Excel [44] based on a pairwise genetic distance matrix of all samples calculated using GenAlEx. All graphs were also created using Microsoft Excel tools.

3. Results

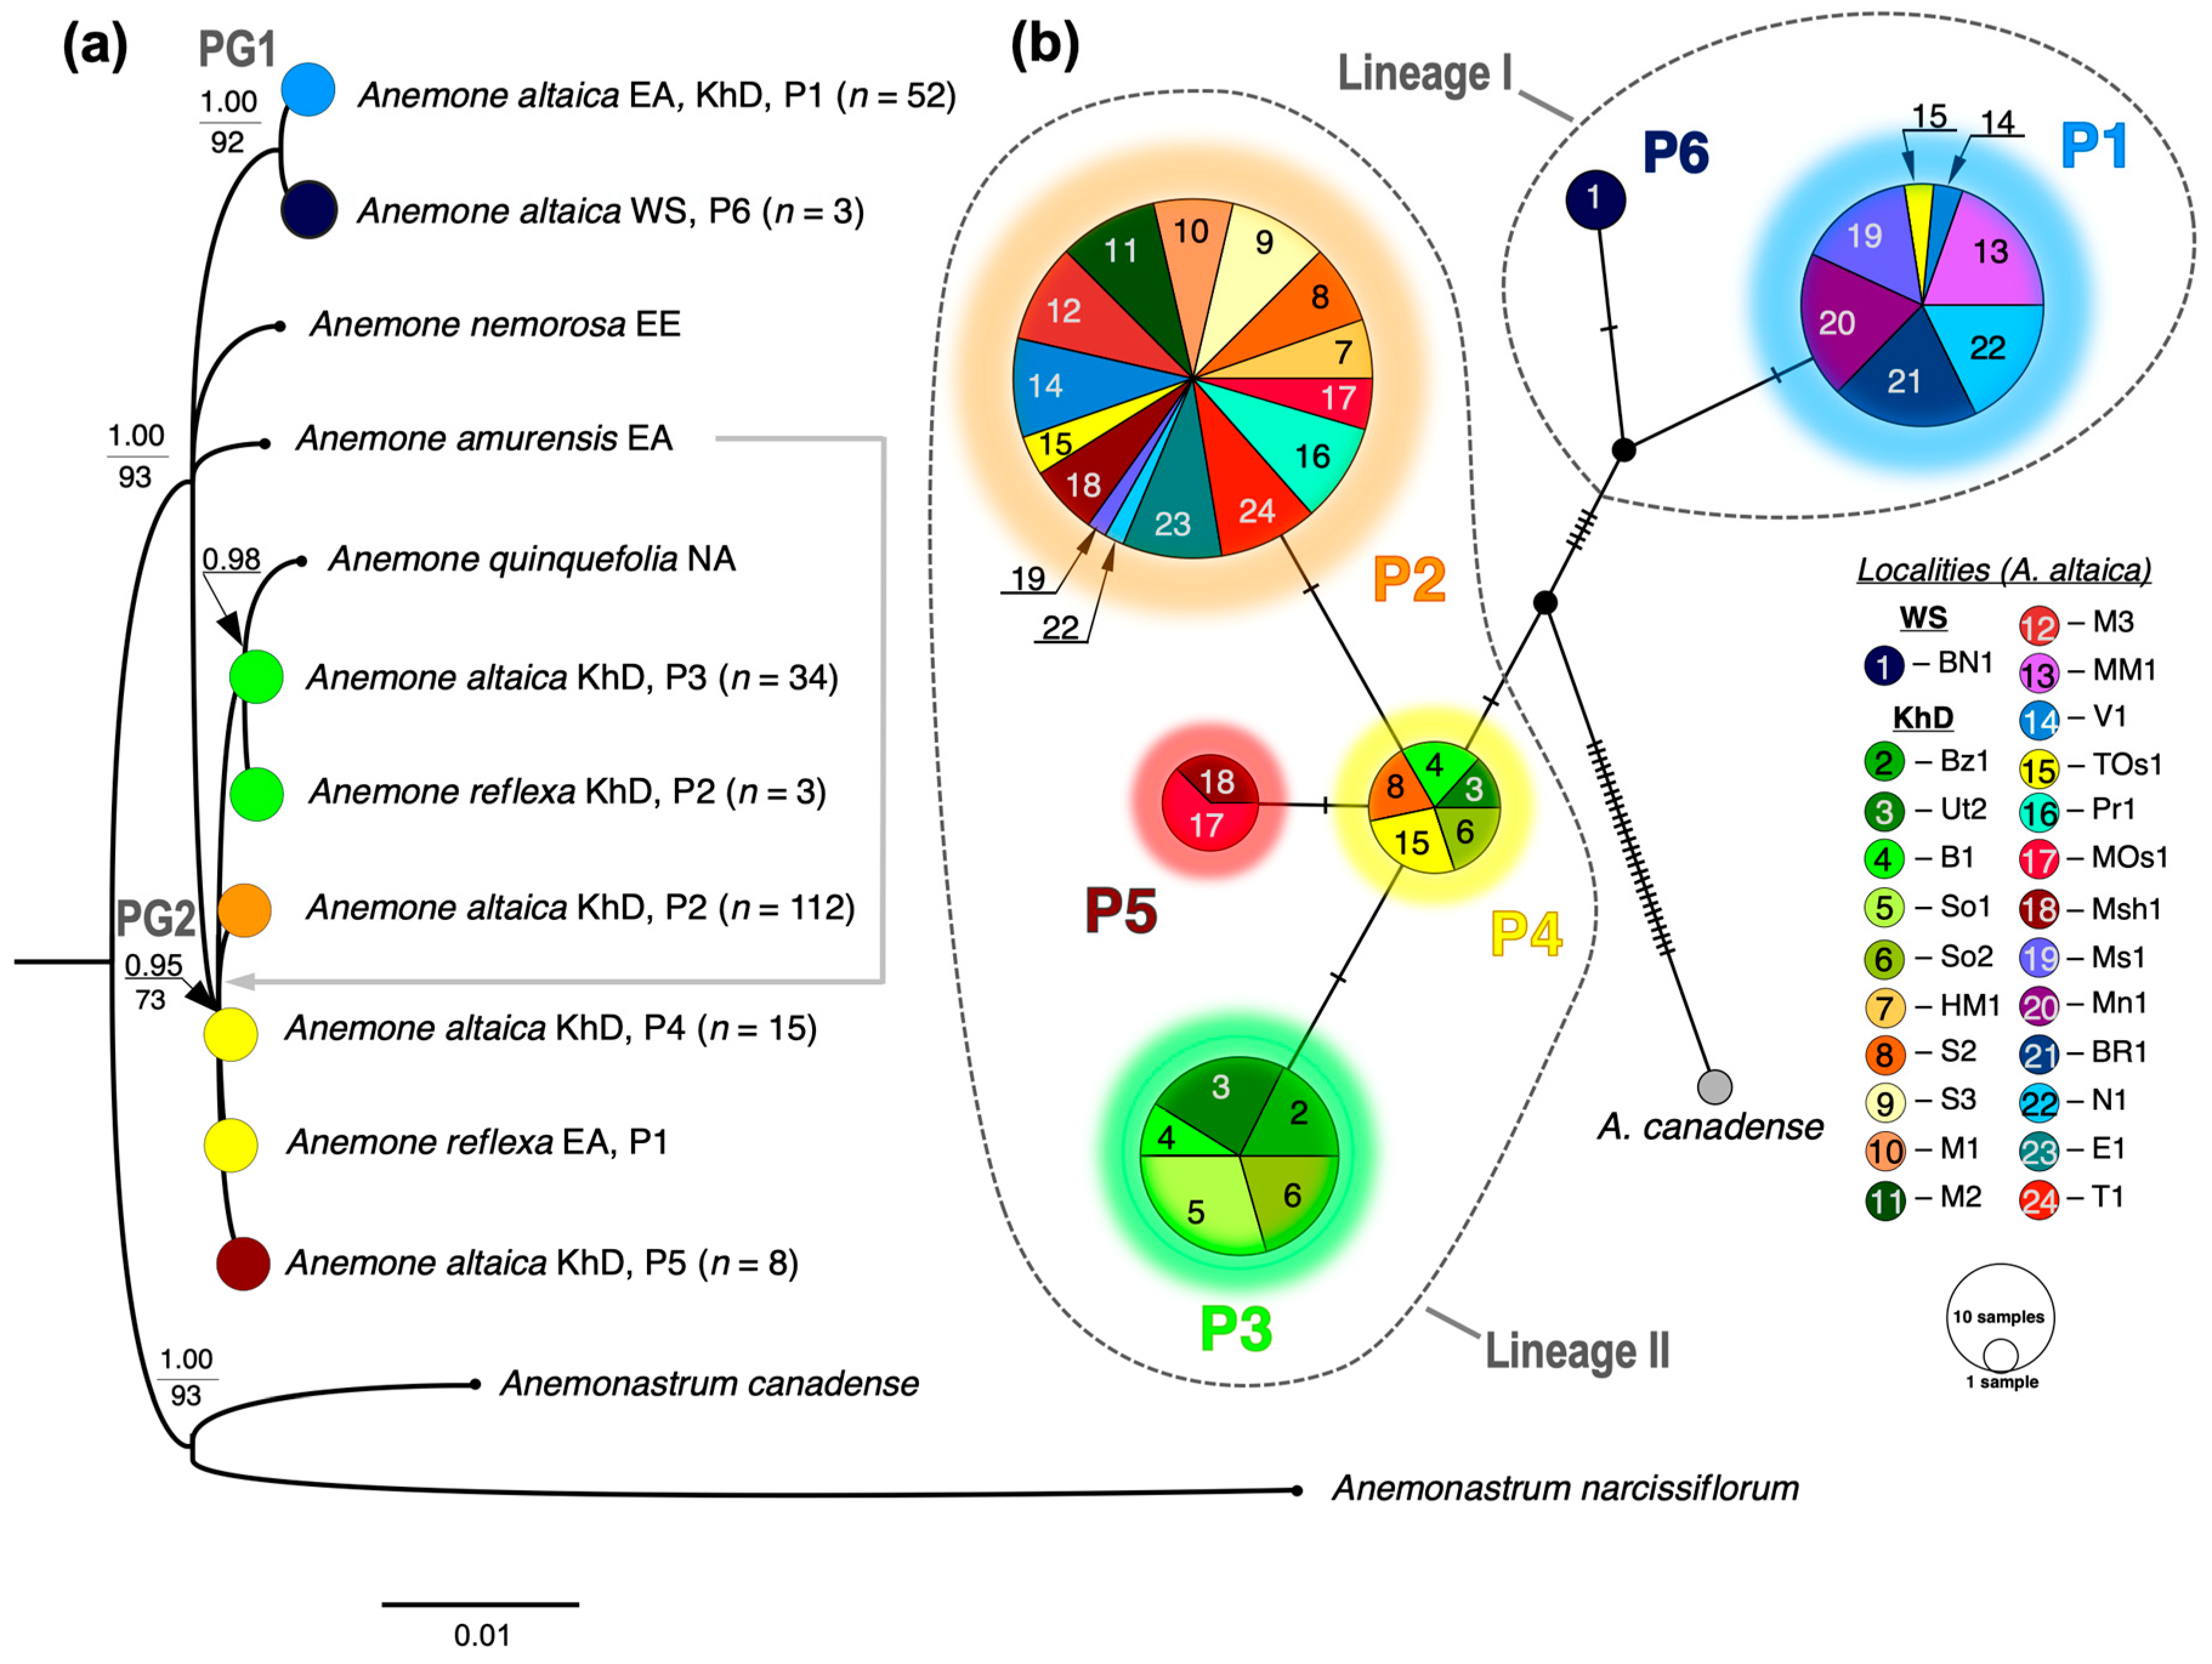
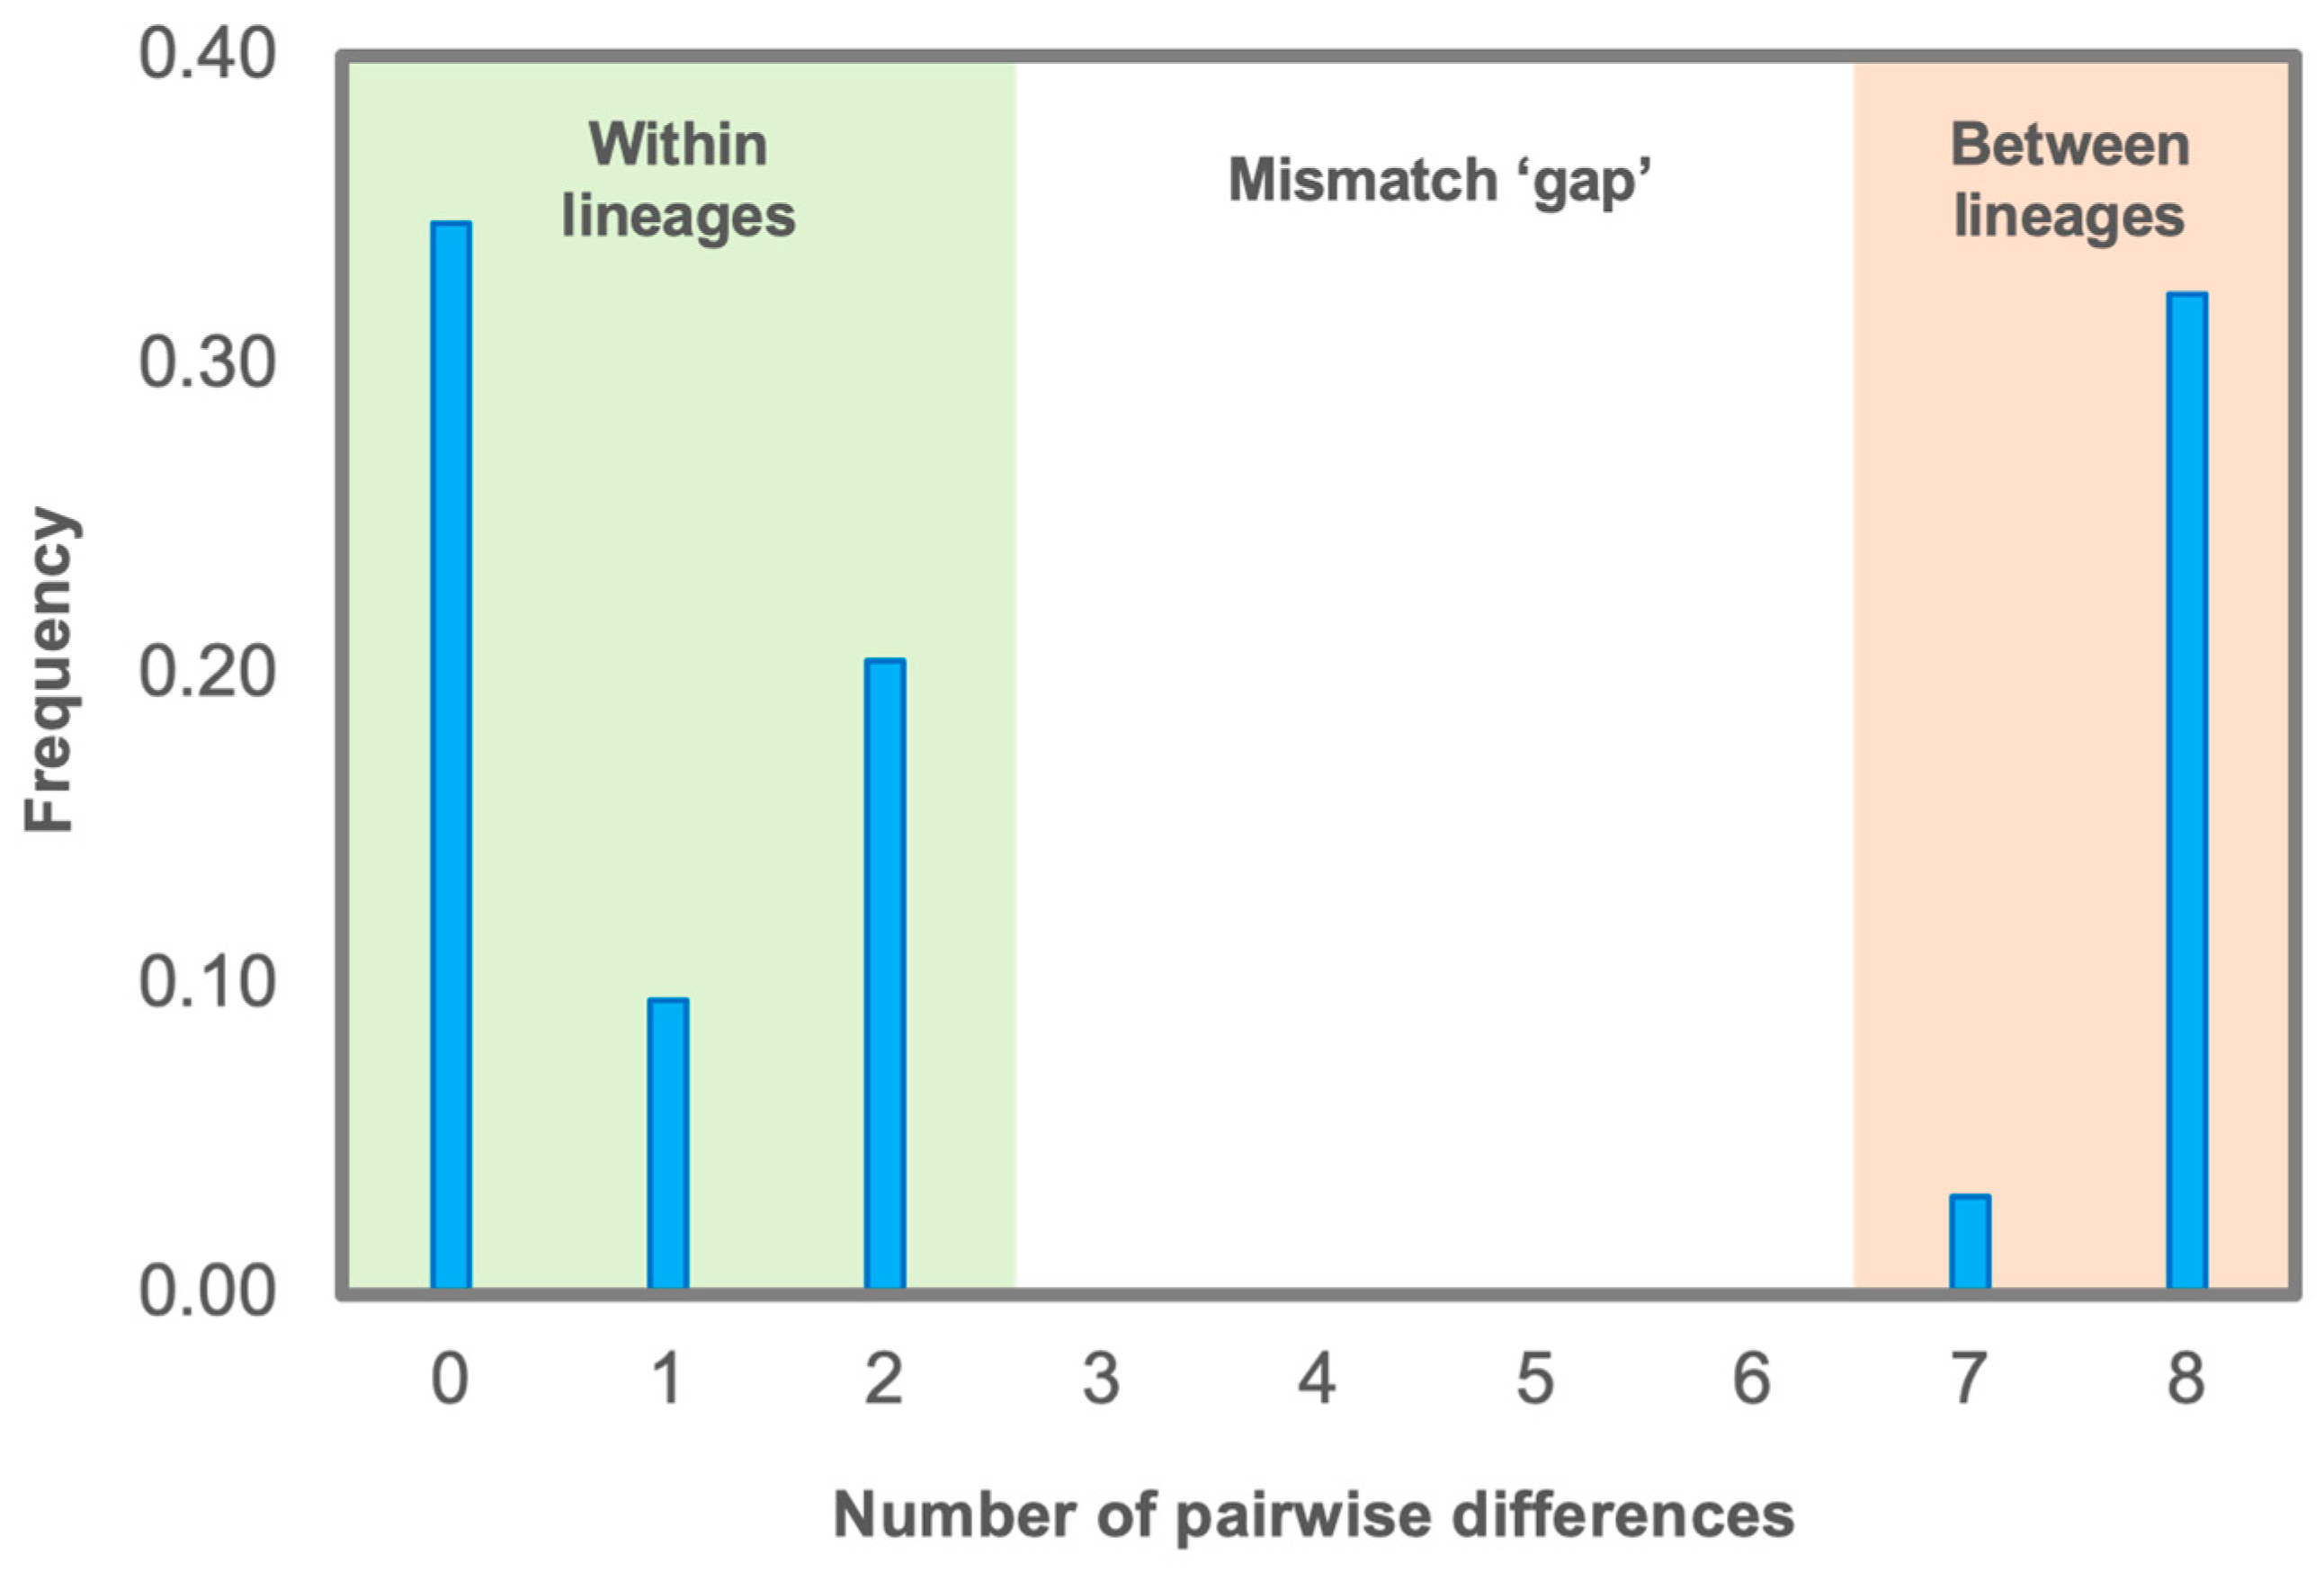
3.1. Phylogenetic Relationships Between Anemone altaica and Close Related Species

The phylogenetic analysis using ptDNA revealed a clear topology, distinguishing at least six plastotypes (P1–P6) of A. altaica (Figure 1). The topology of the tree suggested a curious polyphyletic nature of A. altaica (Figure 1a). In particular, two genetic lineages of A. altaica were found to be significantly associated with different plastogroups (PG). PG1 was exclusively represented by lineage I of A. altaica, while PG2 combined the plastotypes representing lineage II of A. altaica as well as plastotypes of other species, i.e., A. reflexa, A. quinquefolia, and most likely A. amurensis. The lineage I embraced the plastotypes P1 and P6 representing A. altaica from the Western Sayan Mountins, East Asia, and partially from the Khamar-Daban Ridge. The lineage II represents all remaining plastotypes observed exclusively on the Khamar-Daban Ridge populations (Figure 1b). Within PGII, P3 of A. altaica clustered with the plastotypes of other Anemone species such as P2 of A. reflexa and A. quinquefolia. Remarkably, our analysis revealed that both plastotypes of A. reflexa used in the study were identical to either P3 or P4 of A. altaica from the Khamar-Daban Ridge (shown in one color in Figure 1a,b). Notably, the variations among plastotypes of lineage II (P2–P5) were exclusively expressed as indel polymorphisms rather than mismatches, while the distinction between plastotypes of two distinct lineages involved both mismatches and indels.

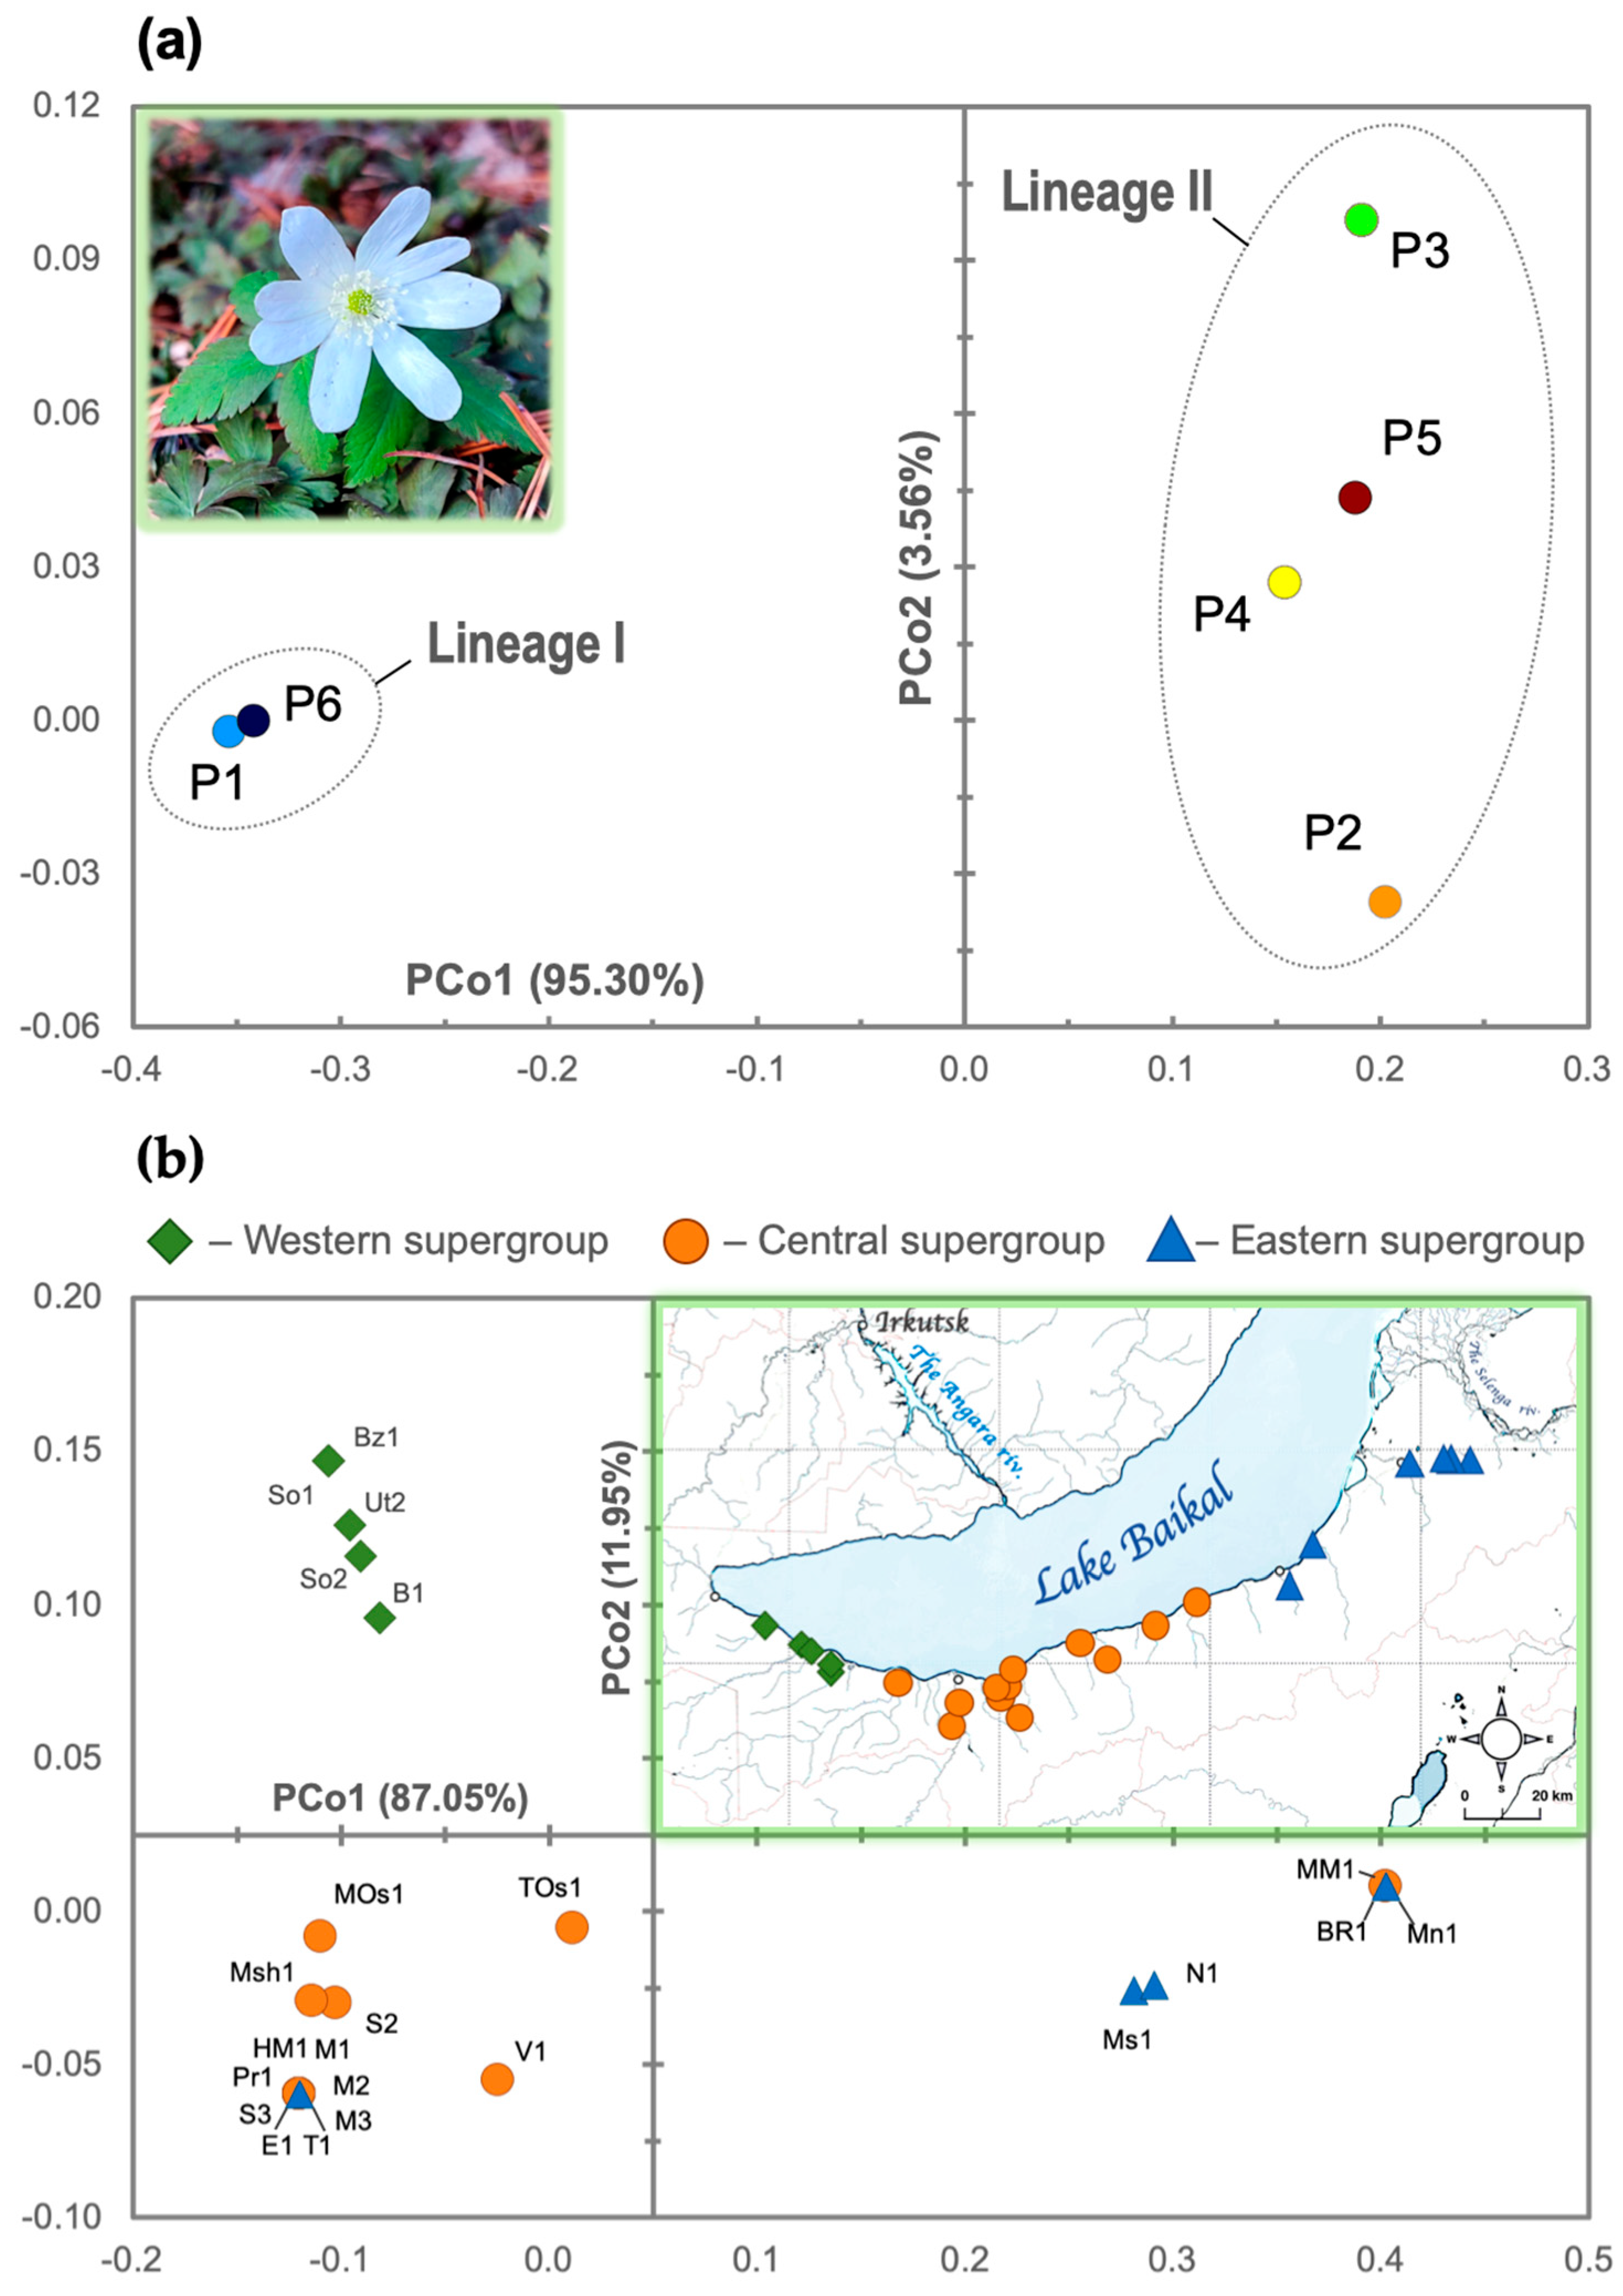
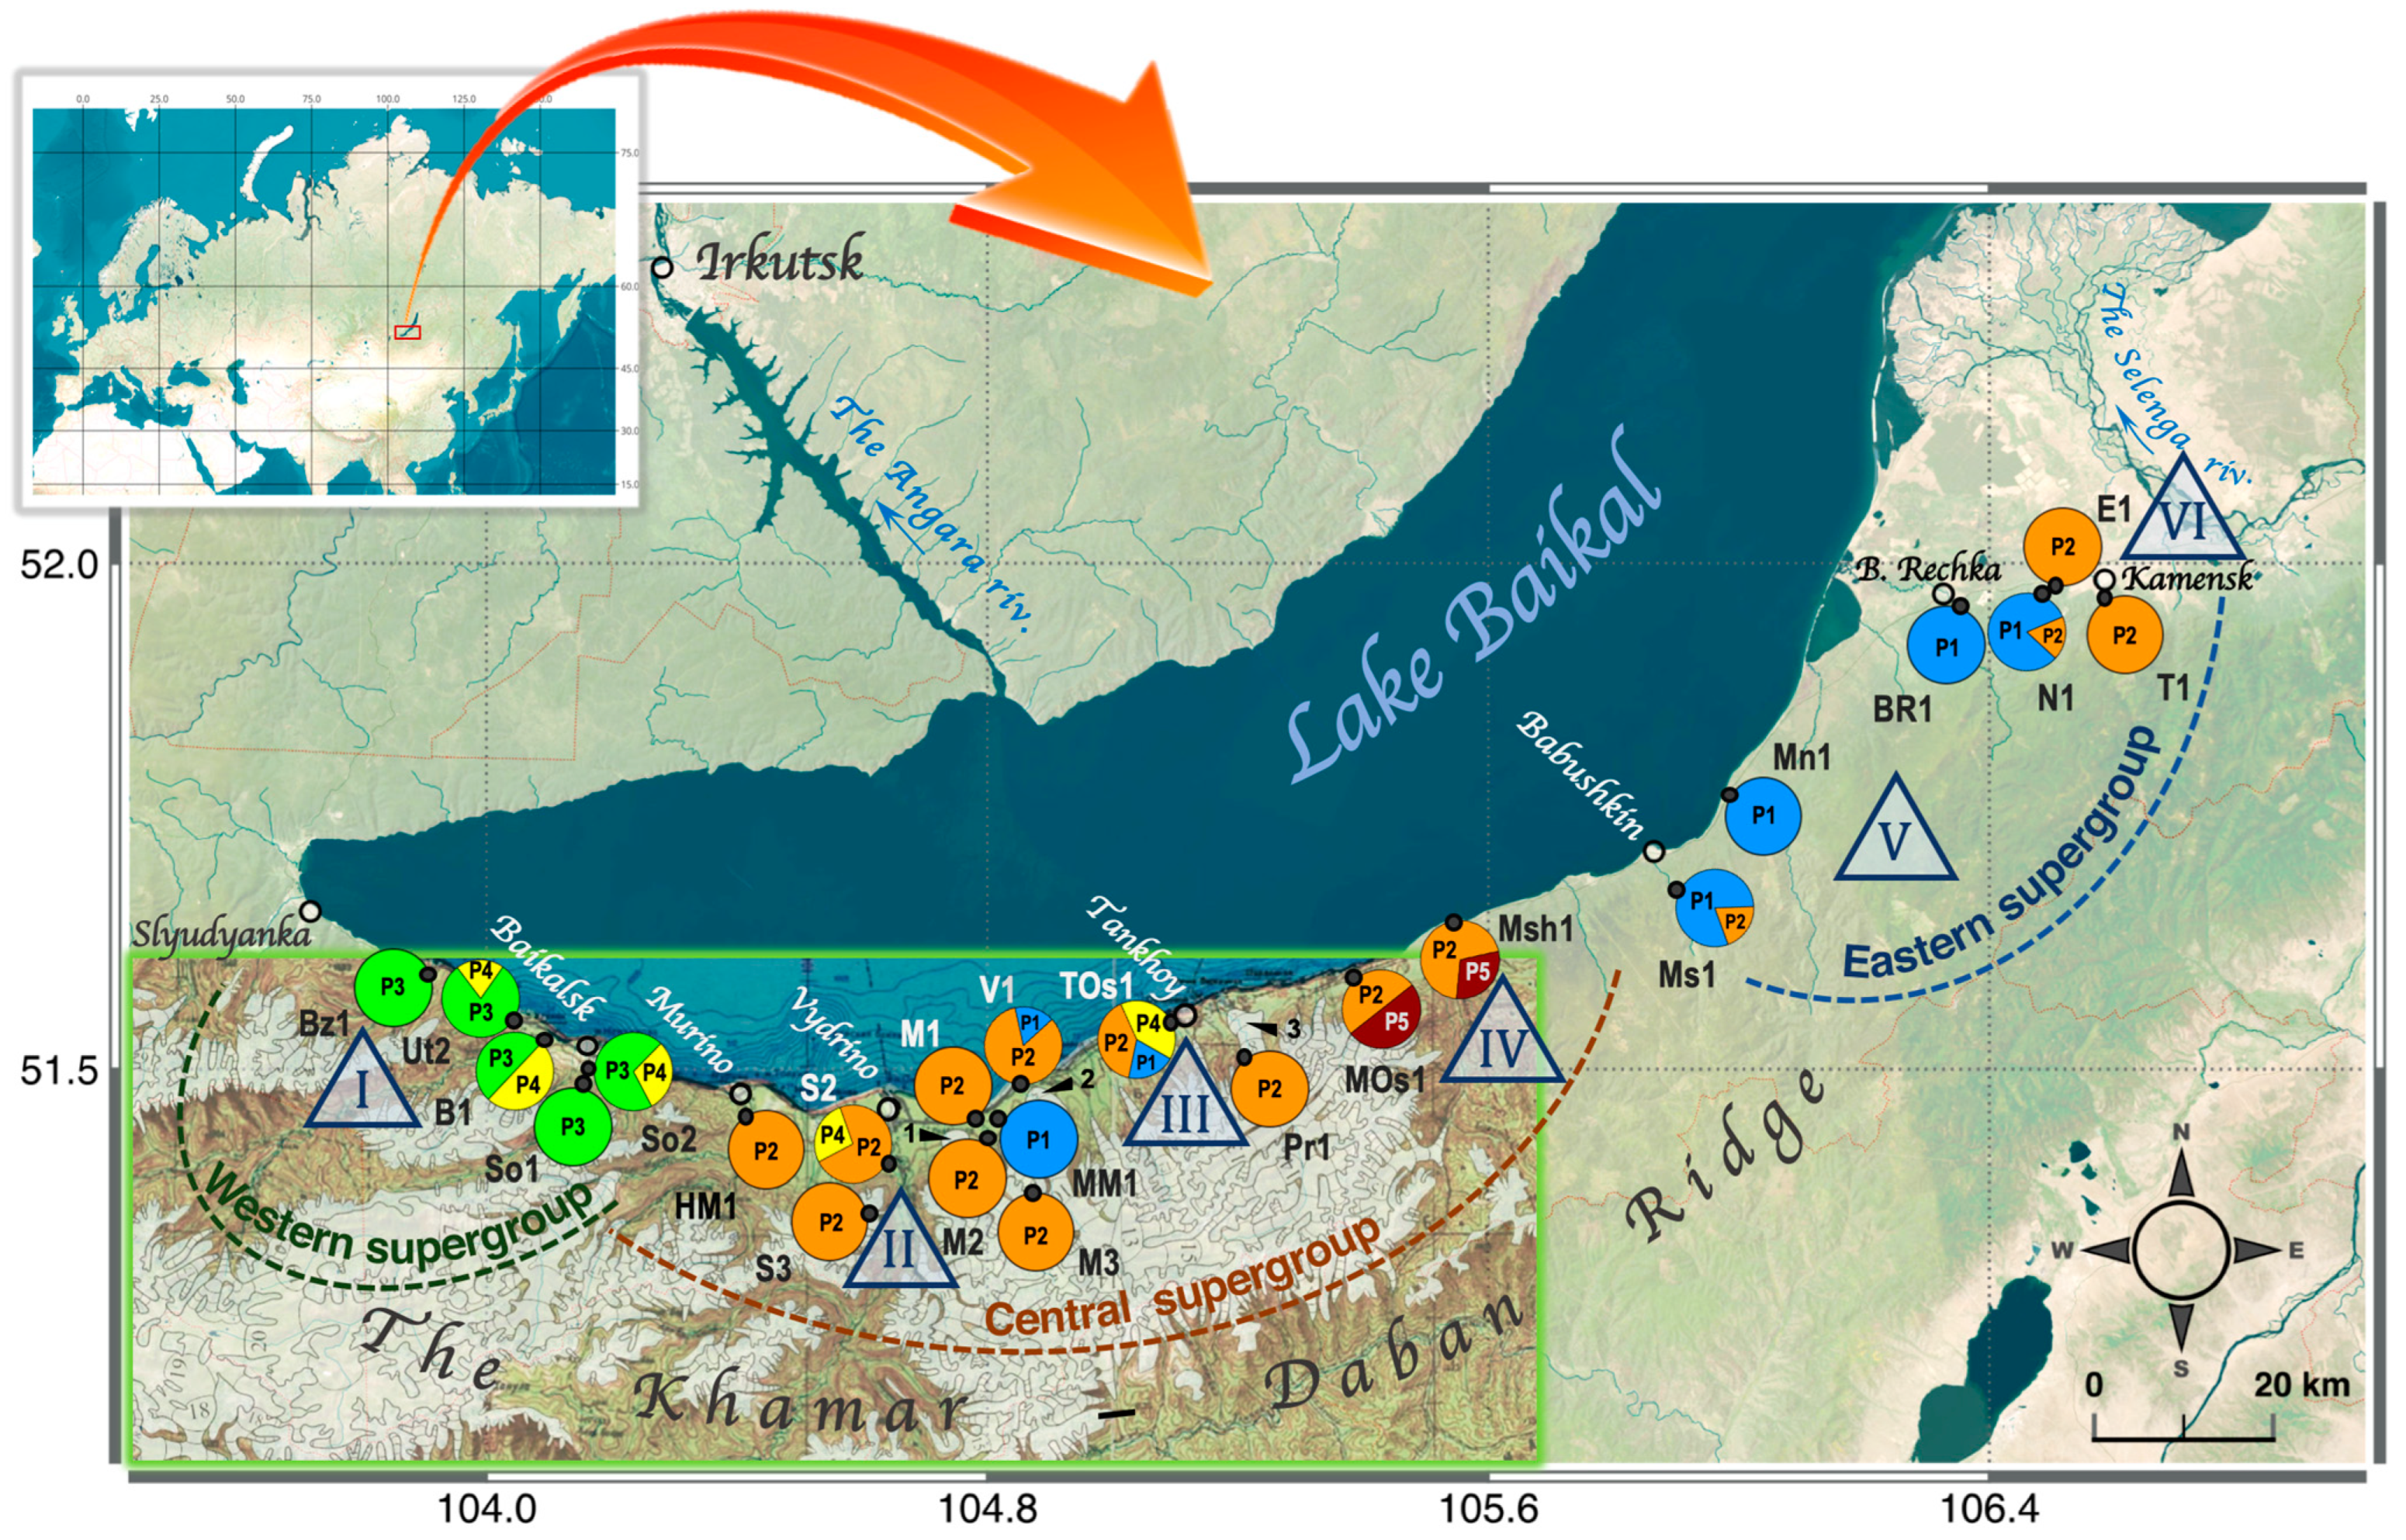
3.2. Phylogeographical Patterns of A. altaica on the Khamar-Daban Ridge Based on ptDNA Data

The dominant plastotype of A. altaica on the Khamar-Daban Ridge was P2, identified in 112 specimens across 15 populations out of a total of 220 individuals and 23 populations (Figure 1b). Plastotype P1 was subdominant, occurring in 51 specimens belonging to 7 populations from the Khamar-Daban Ridge. It was also identical to the one deposited in GenBank which likely belongs to A. altaica from the People’s Republic of China or another part of its East Asian range [20], although the exact origin of the sample is unknown due to insufficient information provided in the original study. In general, the plastotype intrapopulation diversity on the Khamar-Daban Ridge was found to be poor, with most populations (13 out of 23) carrying only one of the five plastotypes, nine populations carrying at least two plastotypes, and only one population carrying three plastotypes.
To evaluate the potential phylogeographic structure of A. altaica, we conducted a Principal Coordinates Analysis (PCoA) based on genetic distances (Figure 2).
As anticipated, the PCoA, which plotted all samples based on their pairwise genetic distance matrix, revealed clustering patterns corresponding to six distinct plastotypes (Figure 2a). The plastotypes grouped into clusters representing two distinct lineages, a pattern consistent with both the phylogenetic analysis and the TCS network (Figure 1). The PCoA results, derived from Nei genetic distances among populations, identified at least three distinct genetic supergroups of populations on the Khamar-Daban Ridge (Figure 2b). This finding allowed us to propose a geographical grouping of populations based on their distribution along the northern macroslope of the ridge, considering the dominance of specific plastotypes. Based on the PCoA results, we conditionally categorized the populations into three supergroups: Western (W), Central (C), and Eastern (E). However, the potential for additional divisions within these supergroups cannot be entirely dismissed (Figure 2b). A detailed geographic distribution of plastotypes among the populations on the Khamar-Daban Ridge is illustrated in Figure 3.
Specifically, within the Khamar-Daban Ridge, Plastotype P1 was dominant in the E supergroup, although it also appeared in other supergroups (Figure 3). Its maximum extent to the west reached the Maliy Mamay River (MM1 locality) in the central region of the macroslope. Plastotype P2 was dominant within the C supergroup and exhibited the most extensive distribution among the Khamar-Daban populations, being present from the Timlyuy River (T1 locality) near Kamensk settlement (E supergroup) in the east to the Khara-Murin River (HM1 locality) near Murino settlement (C supergroup) in the west. Plastotype P3 was exclusively found in the W supergroup, with its occurrence limited to the Solzan River (So1 and So2 localities) near Baikalsk city in the eastward direction. Plastotype P4 was extended from the C to the W supergroup of the populations, at least within the forest belt. Plastotype P5 was identified in the easternmost populations belonging to the C supergroup (MOs1 and Msh1 localities).
To evaluate the detailed phylogeographic structure of A. altaica on the Khamar-Daban Ridge, several geographical hypotheses were proposed and subsequently tested using the Analysis of Molecular Variance (AMOVA). The most representative of these hypotheses are presented in Table 3 and illustrated in Figure 3. The AMOVA for Hypothesis 1, which posits no spatial grouping, revealed a strong genetic differentiation within the Khamar-Daban Ridge populations (ФST = 0.81161, p < 0.001). Notably, the majority of the genetic variation was attributed to interpopulation polymorphism (81.16%) rather than intrapopulation differences (18.84%) (Table 3).
Hypothesis 2 was formulated based on the PCoA results (Figure 2), which identified three phylogeographical supergroups (W, C, and E) of A. altaica on the Khamar-Daban Ridge. AMOVA results (Table 3) revealed significant ФCT (0.367, p = 0.006) and Ф’CT (0.820, p = 0.001) values, coupled with the high Ф’CT estimates (reflecting differentiation among supergroups) relative to Ф’SC-value (reflecting differentiation within supergroups). These results robustly support the three-supergroup structure, rejecting the null hypothesis of genetic homogeneity and panmixia. At the same time, the elevated ФSC-value (0.722) relative to ФCT (0.367) suggests potential finer-scale genetic substructure within the identified supergroup.
All remaining hypotheses were based on different numbers of potential Pleistocene microrefugia that constituted the revealed supergroups. According to these hypotheses, the main refugium located on the northern macroslope of the Khamar-Daban Ridge was divided into population groups that corresponded to several microrefugia and their associated zones of recolonization. In particular, Hypothesis 3 consisted of dividing into groups of populations associated with four refugia as previously suggested [5]. According to this division, the first group was the westernmost, the eastern boundary of which included localities on the Solzan River (So1 and So2), the eastern boundary of the second microrefugium included the locality on the Vydrinaya River (V1), and the eastern boundary of the third microrefugium passed along the Pereemnaya River (Pr1). The fourth group included all the remaining populations located to the east (Figure 3, [5]). The results of the AMOVA not supported this structure hypothesis because ФCT not exceeding zero (ФCT = 0.121, p = 0.138).
Since the hypothesis of four microrefugia proved untenable, our subsequent strategies involved dividing the populations into additional groups on the eastern side of the range and adjusting the boundaries of the potential groups. This approach is based on two main reasons. Firstly, the initial allocation of four microrefugia was derived from a simultaneous analysis of the distribution of 27 relict plants [5], most of which have significantly narrower ranges—especially in the eastern part of the ridge—compared to that of A. altaica. Consequently, it is plausible that there are more than four microrefugia for A. altaica. Therefore, we also tested the hypotheses of five and six microrefugia. Secondly, assessing the affiliation of border populations was challenging due to shared plastotypes with specimens belonging to the adjacent microrefugia (Figure 3). This issue was particularly pertinent at the boundaries between Microrefugia II and III, III and IV, as well as V and VI, due to the close proximity of populations and their shared plastotypes. In the first case, this involved populations along the Maliy Mamay and Vydrinaya rivers (localities MM1 and V1). In the second case, it pertained to the positioning of populations along the Pereemnaya River (locality Pr1), and in the latter case, it involved locality on the Nikitkina River (N1).
In total, 12 alternative hypotheses to Hypothesis 3 were tested, each featuring a different number of microrefugia and varying boundaries positions. The most statistically supported hypotheses are presented in Table 3. Notably, none of the hypotheses proposing a division into groups associated with four microrefugia, in addition to Hypothesis 3, received statistical support. The ФCT indexes exceeded zero for the hypotheses involving five (including Hypothesis 4 in Table 3) and six microrefugia (including Hypotheses 5 and 6 in Table 3). Importantly, the AMOVA results for structural Hypotheses 5 and 6 indicated that ФCT surpassed ФSC, suggesting their reliability. The distinction between Hypotheses 5 and 6 lies not in the number of microrefugia but in the positioning of the boundary between population groups associated with Microrefugia III and IV. In particular, in Hypothesis 6, unlike in Hypothesis 5, the locality near the Pereemnaya River (Pr1) was associated with Microrefugium III rather than IV. Although this division aligns more closely with the original hypothesis [5], Hypothesis 6 was deemed less optimal due to a lower ФCT value compared to that of Hypothesis 5. Moreover, Hypothesis 5 exhibited the greatest excess of ФCT over ФSC (2.4 times) compared to all other tested hypotheses, indicating it represents the most optimal structural division.
According to Hypothesis 5, the populations were clustered into six groups associated with the proposed microrefugia as follows:
  • Microrefugium I: Bz1, Ut2, B1, So1, and So2 localities
  • Microrefugium II: HM1, S2, S3, M1, M2, and M3 localities
  • Microrefugium III: MM1, V1, and TOs1 localities
  • Microrefugium IV: Pr1, MOs1, and Msh1 localities
  • Microrefugium V: Ms1, Mn1, Br1, and N1 localities
  • Microrefugium VI: E1 and T1 localities
The approximate locations of microrefugia are indicated by Roman numerals within triangles in Figure 3. The associations between localities and microrefugia, based on the most supported hypotheses, are detailed in Table 2. According to this model of genetic-geographical division and consistent with Hypothesis 2, Microrefugium I corresponds to the W supergroup, Microrefugia II through IV constitute the C supergroup, while Microrefugia V and VI correspond to the E supergroup.
The estimation of ingroup structures using AMOVA revealed that ΦST values among populations within (super)groups were predominantly greater than zero, indicating genetic segregation among populations (Table 3). Notably, groups associated with Microrefugia I (=W supergroup), V, and VI showed no significant variation between populations. Conversely, groups associated with Microrefugia II and IV displayed moderate ΦST values, while the C and E supergroups, along with Microrefugium III, exhibited high ΦST levels, highlighting significant genetic differentiation among populations, even across short geographical distances.
To estimate the correlation between geographic distance and genetic differentiation among populations, the Mantel test was applied (Figure 4). The results indicated an isolation by distance (IBD) effect among the populations from the Khamar-Daban Ridge (p-value < 0.005). However, the strength of the linear relationship between the two variables varied depending on the sample composition analyzed. In particular, the IBD analysis based on the complete sample comprising all studied populations revealed only a moderate correlation (r = 0.287), indicating that only approximately 8% of genetic variance (r2 = 0.083) can be explained by geographic distance (Figure 4a).
When the sample for IBD analysis was reduced by excluding three populations (MM1, E1, and T1), which, according to the PCoA analysis (Figure 2b), clustered within genetic groups predominantly represented by populations from other geographic supergroups, there was a significant increase in correlation, reaching r = 0.615 (Figure 4b). This suggests that when outliers are excluded, about 38% of the genetic variability (r2 = 0.378) can be attributed to geographic distance. Consequently, in general, nearby populations tend to be genetically more similar than would be expected by chance, and genetic differences increase linearly with geographic distance.
To conduct a more detailed investigation into which sections of the macroslope are most influential in shaping the spatial-genetic structure of A. altaica, we performed an analysis of spatial autocorrelation (Figure 5). The Global Spatial Autocorrelation analysis involved dividing the data into six distance classes, with distances between compared individuals ranging from 0 to 200 km (Figure 5a). The first distance class (0 km) corresponded to the genetic structure observed within local populations, while the 20 km and 40 km classes reflected distances between populations within refugia or between neighboring refugia. The 80 km class pertained to distances between specimens in non-adjacent refugia. Notably, the longest microrefugium (Microrefugium V), which has a maximum distance between populations of just over 50 km, also falls within this category. The remaining two classes represented specimens from the most distant refugia. In a manner similar to Moran’s I criteria, the autocorrelation coefficient (r) utilized here [41,43] conveys the following interpretations. A value of r = 1 indicates perfect positive spatial autocorrelation, where high values or low values of the assessed criteria cluster together; a value of r = −1 suggests perfect negative spatial autocorrelation, where adjacent observations exhibit contrasting values, resulting in a checkerboard pattern; and a value of r = 0 signifies perfect spatial randomness [35,36,46].
The results revealed systematic spatial variation in genetic distances among the specimens (r ≠ 0). Specifically, significant positive spatial autocorrelation was observed in the first distance classes, indicating that adjacent specimens share more similar plastotypes than those that are farther apart. In contrast, within the higher distance classes (80 km, 100 km, and 200 km), negative spatial autocorrelation was noted, suggesting that adjacent specimens within these particular distance classes tend to exhibit contrasting plastotypes. The heterogeneity test also indicated the overall correlogram significance (p-value = 0.001).
The local spatial autocorrelation was also estimated, focusing on the relationships between each population and its surrounding context, rather than on the genetic structure across the entire study site, as is done in global analyses. The results revealed that certain populations from Microrefugia I, II, IV, and V demonstrate high similarities to their nearest neighbors, as indicated by positive autocorrelation values (represented by a ’plus’ sign in the graph). These populations are likely to play a significant role in shaping the spatial genetic structure. In contrast, the negative r-value for the MM1 locality (represented by a ’minus’ sign in the graph) suggests that it is a spatial outlier, as it significantly deviates from the values of its neighboring localities. Importantly, the outlier status of the MM1 locality aligns with previous findings from PCoA and IBD (Figure 2 and Figure 4).
Historical demography was inferred from various diversity metrics, neutrality test, and observed mismatch distribution. The overall population exhibited moderately high nucleotide diversity (π) and plastotype diversity (h), along with a genetic diversity index (I) (Table 4). Notably, all subdivisions displaying the highest genetic diversity metrics included both genetic lineages of A. altaica, represented by plastogroups PGI and PGII. In contrast, subdivisions that contained only one genetic lineage or where one lineage was dominant exhibited significantly lower levels of genetic diversity.
Simultaneously, a limited absolute number of plastotypes (P) and their effective number (Na) were observed. The slight excess of the total number of plastotypes over their effective number indicates a scarcity of rare plastotypes in nearly all studied subdivisions (Table 4). The excess of nucleotide diversity over the expected number of segregating sites coupled with their distribution across a limited number of highly represented plastotypes resulted in a shift in the drift–mutation equilibrium, as evidenced by positive Tajima’s D value in the E supergroup and Microrefugium III, as well as in the overall sample. Furthermore, deviations from the neutral model of evolution were found only for subdivisions, where both genetic lineages of A. altaica co-occurred with equal or nearly equal frequencies. The remaining (super)groups did not exhibit significant deviations from drift-mutation equilibrium (Table 4).
The mismatch distribution graph exhibited a clear bimodal pattern for A. altaica on the Khamar-Daban Ridge (Figure 6).
Specifically, the first peak on the graph, representing low mismatch numbers, reflects the frequency of pairwise genetic differences within genetic lineages. Conversely, the second peak, found at higher mismatch numbers, suggests significant genetic differentiation between lineages. A substantial ‘gap’ separating these two peaks may explain the positive Tajima’s D statistic.

4. Discussion

4.1. Reevaluating the Phylogenetic Relationships of Anemone altaica and Closely Related Species

Anemone altaica [≡ Anemone nemorosa subsp. altaica (Fisch. ex C.A. Mey.) Korsh.], along with several other Anemone species, such as A. quinquefolia [≡ A. nemorosa var. quinquefolia (L.) Pursh] and A. amurensis (≡ A. nemorosa subsp. amurensis Korsh.), are considered closely related to each other and to the European A. nemorosa [47,48,49]. However, the previous molecular phylogenetic reconstructions of the Anemone genus ever did not cover A. altaica and the mentioned close related species together [21,50,51]. Although our reconstruction, using two plastid markers, did not further resolve relationships among closely related taxa beyond previous findings, this was not the primary objective of our study. At the same time, our phylogenetic analysis suggested a curious diphyletic nature of A. altaica based on ptDNA data. Specifically, our analysis identified at least two distinct genetic lineages within A. altaica. We hypothesize that Lineage I represents the authentic line of A. altaica (Figure 1). This hypothesis is based on the fact that this lineage is represented by a monophyletic clade (PG1) that includes plastotypes of A. altaica from diverse geographical regions. In contrast, plastotypes belonging to Lineage II have, to date, only been observed in A. altaica from the Khamar-Daban Ridge. This lineage appears to be shared with the closely related species A. reflexa, A. quinquefolia, and likely A. amurensis, which together form a common plastogroup (PG2) in the phylogenetic tree. Within this group of taxa, A. reflexa is consistently considered related to A. altaica and the other aforementioned species belonging to the same section, although it was previously classified in a separate series, Reflexae. [48,49]. Notably, A. reflexa is clearly morphologically distinct from other species in the group, characterized by very narrow, reflexed tepals that run parallel to the peduncle [52]. Here, we present evidence suggesting the relationship between A. reflexa and the other mentioned species may be closer than previously thought. In this key, our results are consistent with recent data using genomes of several Anemone species [51].
Returning to the genetic divergence between the two A. altaica lineages, it is considerable, with at least seven mismatches, including indels, representing approximately 1% of their alignment length (Figure 1b and Figure 6). This level of divergence approaches that typically observed between species. Furthermore, mismatch distribution analysis revealed a clear bimodal pattern, with a substantial gap in frequencies between within-lineages and between-lineages values, further supporting the divergence of these two lineages. The significant nucleotide divergence of A. altaica plastotypes and the diphyletic nature of its lineage cannot be easily explained by incomplete lineage sorting with closely related species. We believe the best hypothesis may involve incidents of hybridization of A. altaica with related species and backcrossing, resulting in past plastid capture events. Specifically, plastotypes of A. altaica belonging to Lineage II may have arisen in situ on the Khamar-Daban Ridge through this process. We propose that A. reflexa is the most likely candidate for hybridization with A. altaica, as the two species share identical plastotypes. Moreover, these two species are often found growing together on the Khamar-Daban Ridge, though modern hybrids have not been documented in this territory. The lack of observed modern hybrids in the ridge may be tied to differences in flowering time rather than physiological mechanisms of reproductive isolation. This hypothesis can be confirmed by the presence of narrowly localized modern hybrids between these two species, which have been previously described [53].

4.2. Present Phylogeographic Patterns of Anemone altaica on the Khamar-Daban Ridge and Potentional Pleistocene Distribution Scenarios

The geographic distribution of identified plastotypes across the Khamar-Daban Ridge, combined with AMOVA results, revealed significant genetic differentiation among A. altaica populations (ФST = 0.812). This pattern aligns with the species’ fragmented distribution along the ridge. As a mesophilic species, Anemone altaica is primarily confined to riverbeds, similar to other nemoral relicts. The observed genetic isolation likely arises from the barrier effect of riverbeds, particularly in foothill zones, which restrict gene flow. These biogeographic constraints collectively reinforce limited genetic connectivity across the species’ range. The northern macroslope of the Khamar-Daban Ridge exhibits a relief intensely dissected by rivers and streams that drain into Lake Baikal, forming part of its catchment basin. Consequently, high-altitude interfluve areas consist of mountain spurs extending northward from the ridge’s central axis.
Our grid mapping results, previously conducted in a model area situated between two interfluves of the Bolshoy Mamay River (corresponding to M1–M3 and MM localities in Figure 3), indicated that within the forest belt, populations of A. altaica were predominantly found along the riversides and streams [12]. In interfluve areas, populations were sporadic and primarily restricted to temporary watercourses. The species is also found in subalpine wet and high-grass meadows, where it can exhibit high population densities, however, it struggles in drier regions of watershed ridges. Consequently, there exists a partial geographic isolation of populations between neighboring rivers. It is noteworthy that the current distribution of nemoral relicts on the Khamar-Daban Ridge is significantly influenced by their proximity to Lake Baikal. Specifically, at a distance exceeding 10–15 km from the shoreline, the climatic conditions become harsher, leading to a decrease in the presence of many nemoral relicts, with some species disappearing entirely [14]. For instance, A. altaica thrives in the subalpine meadows of rivers with relatively short courses and in the watersheds of low order located close to Lake Baikal. An illustrative case is the Bolshoy Mamay River, where the distance from the shore to its upper reaches is under 10 km. In contrast, for lengthy rivers that flowing from the axial part of the ridge, where the forest boundary may lie 30 km or more from Lake Baikal, the subalpine zone tends to be drier and unsuitable for A. altaica. Consequently, the major rivers of the Khamar-Daban Ridge, such as the Utulik, Snezhnaya, Vydrinnaya, Pereemnaya, Mishikha, and others, act as significant geographic barriers hindering the species from spreading over extensive distances along the ridge. In pre-Pleistocene times, characterized by a warmer and more humid climate featuring expansive broad-leaved forests and smaller mountain ranges compared to the current landscape, it is likely that the isolation of populations was less pronounced than it is in modern times. The examination of Lake Baikal’s bottom sediments reveals the dominance of a nemoral dark coniferous–broad-leaved complex in the Cis-Baikal region until the middle of the Late Pliocene. Subsequently, a transition towards more boreal characteristics occurred towards the end of the Pliocene and into the early Pleistocene.
This climate shift indicates that as the climate cooled and dried during the Pleistocene, populations likely began to become more isolated, congregating along river floodplains near the shores of Lake Baikal. In the southern Baikal area, glaciation was predominantly observed as a mountain-valley phenomenon. The massive volume of water in Lake Baikal and the interception of moist ‘western’ air masses by the Khamar-Daban Ridge have helped mitigate the impact of global climate changes on the southern shore of the lake. These factors played a crucial role in preserving elements of the broad-leaved complex on the northern macroslope of the Khamar-Daban Ridge and its foothills, establishing it as the most significant nemoral refugium within the Baikal region.
Previously, we introduced the concept of several microrefugia on the Khamar-Daban Ridge, identified based on the species richness of nemoral relics [5]. Four possible microrefugia were pinpointed on the Khamar-Daban Ridge, showcasing the highest concentration of relict species. These presumed microrefugia were exclusively located within the floodplains of major rivers, as indicated by triangles in Figure 3: Microrefugium I (corresponding to B1 and Ut2 localities) along the Babkha and Utulik rivers, Microrefugium II (corresponding to S2 and S3 localities) along the Snezhnaya river, Microrefugium III (corresponding to TOs1 and Pr1 localities) along the Osinovka (near Tankhoy settlement) and Pereemnaya rivers, and Microrefugium IV (corresponding to the Msh1 locality) along the Mishikha river. Therefore, some large rivers, in addition to their barrier role in limiting the gene flow along populations, also played a crucial role as Pleistocene microrefugia, allowing relict species to survive in their floodplains.
The positioning of these microrefugia aligns with a recently established model detailing the location of glaciers and their nourishment areas on the ridge during the Sartan glaciation, corresponding to the Last Glacial Maximum (LGM) in Siberia (see inset on Figure 3, adapted from [10]). Analysis of the glacier layout reveals that the floodplains of the Utulik River together with lower course of the Babkha River (corresponding to Microrefugium I), the Snezhnaya River (corresponding to Microrefugium II), and the Mishikha River (corresponding to Microrefugium IV) remained unglaciated during the Last Glacial Maximum. The central ridge area exhibited higher susceptibility to snow cover due to various local factors. This led to Microrefugium III being notably closer to the Baikal shoreline due to glacial activity, resulting in its geographical isolation from Microrefugia II and IV. This isolation was caused by glacier tongues extending towards the lake along the Osinovka (near Vydrino village), Vydrinnaya, and Pereemnaya rivers, as indicated by arrows 1, 2, and 3 in Figure 3. The positioning of the glaciers suggests that the Pereemnaya River was unable to serve as a microrefugium, contrary to our previous assumptions [5], as it was covered by a glacier. Furthermore, the results of the AMOVA indicated that populations from the Pereemnaya River (Pr1 locality) were even more closely associated with Microrefugium IV than with Microrefugium III. This suggests that the Osinovka River and its adjacent areas (near Tankhoy settlement, corresponding to the TOs1 locality) likely played a primary role in Microrefugium III. Conversely, the riverbanks of the Pereemnaya River appear to have been recolonized by A. altaica from Microrefugium IV, or partially from Microrefugium III. It is worth noting that, A. altaica exhibits one of the most elongated ranges from west to east along the Khamar-Daban Ridge among nemoral relics [5,15]. Its range stretches far eastward beyond the boundaries of the indicated microrefugia. Considering the absolute elevation of the snow line on the Khamar-Daban Ridge during the LGM [10], it is plausible that the area east of Microrefugium IV did not experience substantial glacial coverage, given the lower absolute mountain altitudes compared to the central and western parts of the ridge. Therefore, we hypothesized that the eastern populations likely did not originate from re-colonization from Microrefugium IV but were sustained in situ due to the presence of some eastern microrefugia. In support of the existence of more than four Pleistocene microrefugia for A. altaica, the results of the AMOVA indicate that the hypothesis of six, rather than four or five, population groups provides the most optimal scheme for partitioning the observed genetic diversity (Table 3). Specifically, high estimates of ФCT relative to ФSC indicate that nucleotide diversity was partitioned among hierarchical levels, in which variance in nucleotide diversity is maximized among groups and minimized within groups [54]. Consequently, the evidence supports the hypothesis of population groups associated with at least to six microrefugia as the most representative model for the geographic structure of genetic diversity among the sampled populations of A. altaica. More concretely, the geographic locations of four of these microrefugia closely correspond to those previously discussed. Additionally, two further microrefugia are characteristic of A. altaica and are located further east than the others (Figure 3).
It is worth noting that our assumptions are based on glacial reconstructions solely from the LGM period [10]. While it is generally believed that each successive glaciation in the Pleistocene was colder than the previous one, the drier climate linked to Arctic ice accumulation suggests that glaciers from earlier glaciations in Siberia may have been larger than those during the LGM [55]. Therefore, we posit that the distribution patterns of microrefugia and population isolation during the LGM likely hold true and for earlier Pleistocene glaciations, which might be just more extensive in certain places of the Khamar-Daban Ridge.
Furthermore, both the PCoA and standardized Ф’-statistics support the distribution of proposed six microrefugia among three geographic supergroups (W, C, and E), with limited gene flow between them. The results of autocorrelation analysis also confirmed a strong spatial genetic structure of A. altaica on the Khamar-Daban Ridge at both global and local scales. Specifically, the geographical distances between classes, which exhibited significant autocorrelation values in the distribution of spatial variation in genetic distances among specimens, generally aligned with those observed among supergroups and among microrefugia distances (Figure 5). Local spatial autocorrelation, focusing on relationships between each population and its surrounding context, revealed high similarities between populations and their nearest neighbors in most groups associated with microrefugia. High values of ФST and Ф(Ф’)CT in the supergroups and microrefugia models confirm that while some small watersheds on the Khamar-Daban Ridge may have acted as geographic barriers, the major rivers extending into the axial region of the ridge serve as the primary obstacles to gene flow over significant distances, both in the past and present.
At the same time, the IBD assessment revealed that not all differences between individuals and their groups can be attributed to geographic distance alone (Figure 4). For example, the results from PCoA and 2D LSA demonstrated the presence of clear outliers among populations that carry plastotypes poorly correlated with their genetic surroundings (Figure 2 and Figure 5). Specifically, removing these outliers from the IBD analysis significantly strengthened the correlation. The mentioned outliers are exemplified by populations from Microrefugium VI (E1 and T1 localities), which genetically align more closely with the С supergroup rather than the E supergroup to which they belong geographically (Figure 2). Similarly, this applies to a population from Microrefugium III (MM1 locality), which geographically belongs to the С group but are genetically grouped with those from the E supergroup (Figure 2 and Figure 5b).
Mismatches between the geographical location of certain populations and their affiliation with specific genetic groups or supergroups can be attributed to past periods when the A. altaica range was more contiguous, followed by fragmentation events during the Pleistocene. Periodic fragmentation of the range likely led to the preservation of random plastotypes due to bottlenecks and independent genetic drift. This resulted in the retention of similar plastotypes, albeit at different frequencies, in distinct, non-adjacent populations and groups. This process is now evident because some distant populations still carry similar plastotypes. It suggested such plastotypes likely remained in situ from past times rather than arising through recent long-distance migration. Supergroups C and E exhibit greater commonality and appear to have maintained contact for a longer duration, as reflected by their sharing of plastotypes P1 and P2 (Figure 3). These plastotypes dominate the general population, although they occur at different frequencies in the two supergroups. In contrast, W supergroup seems to be more distinct from two mentioned, as it does not share the dominant plastotypes with the other groups. The genetic isolation of the western group of populations has also been demonstrated in our previous studies of other relict species on the ridge, such as Eranthis sibirica DC. [17]. Similar patterns observed across different species likely indicate the existence of temporary or permanent geographic barriers that impede effective gene flow between the western and central parts of the ridge.
On the other hand, sharing of identical plastotypes over short distances, such as between adjacent populations or microrefugia, suggests that genetic isolation is incomplete and that contact between groups persists or has occurred periodically in the past. We believe that the best opportunity for gene flow occurred not during the re-expansion of confined populations during warming periods, but rather during glaciations or the beginning of interglacials. Specifically, as mentioned above, the wide riverbeds in the forest belt, along with the lengthy areas of interfluves exhibiting boreal features, currently serve as significant barriers to population mixing. In the mountain-forest belt, the population density in the interfluve area increases [12], possibly due to the higher density of watercourses. This, combined with a decrease in the barrier function of the river itself due to the narrowing of the main channel, may contribute to the partial mixing of populations from different watersheds. Subalpine meadows provide a favorable biome for A. altaica, where it can form large aggregations, and the barrier function of rivers practically disappears. However, the restriction of population spread in the subalpine belt is mainly caused by the dry watersheds. Therefore, a significant limitation on the mixing of populations in the mountain-forest and subalpine belts, as noted above, is their remoteness from Lake Baikal. Consequently, gene flow is currently possible only within short distances on the watersheds of short rivers. During the Pleistocene cooling periods, due to the depression of the snow line, the upper limit of the forest belt also experienced depression [3]. The shift of the subalpine zone closer to the bowl of Lake Baikal should have contributed to the spread of A. altaica. Consequently, adjacent populations may have had the chance to intermingle across the subalpine region as they expanded along the glacial edge. Furthermore, the mixing of populations from opposite river banks could have taken place via glacial terminal moraines which penetrated the mountain forest belt and served as connecting bridges during that period. Thus, we propose that despite the decrease in air humidity and temperature during Pleistocene cold spells, which appears unfavorable for A. altaica, these periods created conditions conducive to population migration. This was facilitated by the formation of landscape prerequisites during glaciations or early interglacial periods. Additionally, it is hypothesized that the cold spells were more favorable for the development and expansion of forest formations at the expense of steppe landscapes [3]. Consequently, this, combined with the downward shift of the subalpine zone, suggests an expansion of biome zones suitable for A. altaica during these cold periods.
At the same time, if we consider the ‘hybridization hypothesis’, the current phylogeographic patterns of A. altaica may partially reflect the history of another taxon, A. reflexa, a possible plastid donor. Although hybridization incidents likely occurred long ago, the different environmental preferences of the two species could still drive the present phylogeographic patterns of A. altaica. In particular, while A. reflexa can be considered a nemoral-boreal species [56], it may have more pronounced boreal properties than A. altaica. This could explain why, although the species often co-occur, A. reflexa is more frequently found in biomes with stronger boreal features where A. altaica is never present. Consequently, the patterns of genetic and actual divergence of A. altaica populations may not always align precisely due to a trace of introgression.
The overall population of A. altaica on the Khamar-Daban Ridge, along with some of its subdivisions, exhibited moderately high genetic diversity metrics, including nucleotide diversity (π) (Table 4). Generally, the level of genetic variability is positively correlated with effective population size [57]. However, in our case, the diversity indices may not fully capture the underlying dynamics. Notably, the highest values were observed in subdivisions that included two genetic lineages of A. altaica, with both exhibiting high frequencies (Table 4). The mismatch distribution graph (Figure 6) clearly indicates that the differences between lineages are significantly greater than the differences within lineages, which may account for the observed increase in diversity metrics. Considering the ’hybridization hypothesis’ regarding the origin of one of the lineages, the revealed diversity may actually stem from genetic introgression rather than mutation processes. This suggests that these metrics may not reliably reflect effective population size or demographic processes. Interestingly, subdivisions containing only one genetic lineage, or where one lineage was dominant, exhibited significantly lower levels of genetic diversity. Furthermore, we believe that using only a limited number of markers in this study is insufficient to draw reliable conclusions about effective population size or demographic processes based on calculated diversity metrics. Therefore, we do not find it necessary to continue speculating based on this dataset.
A similar situation was encountered during the calculation of Tajima’s D test of neutrality. Specifically, positive Tajima’s D values were found in the E supergroup, Microrefugium III, and the general population, mirroring the previous case where these groups contained both genetic lineages as subdominant components. The positive value of Tajima’s D test suggests a deviation from the neutral model of evolution, which is characterized by a balance between mutations and genetic drift. A positive Tajima’s D value is often associated with either balancing selection or sudden population contraction. However, we propose that the modern phylogeographic structure of A. altaica on the Khamar-Daban Ridge most likely originated via genetic introgression events, offering the most plausible explanation for the observed positive Tajima’s D value. In this scenario, what appears to be balancing selection is, in fact, the result of the emergence of certain plastotypes via plastid capture from closely related species, rather than through mutations and subsequent divergence. Nevertheless, the effects of recent population contractions cannot be excluded, especially considering the dramatic climatic changes during the Pleistocene-Holocene.

5. Conclusions

Based on the polyphyletic (more specifically diphyletic) nature and significant nucleotide divergence of plastotypes in A. altaica, we propose that past hybridization events with related species, followed by subsequent backcrossing, have ultimately led to plastid capture. The current phylogeographic patterns of A. altaica may partially reflect the historical influence of A. reflexa, which is the most reliable candidate for the donor of plastid DNA during these introgression processes. Genetic differentiation among populations of A. altaica indicates that even small watersheds may impede gene flow within the Khamar-Daban Ridge. However, major rivers flowing from the axial part of the ridge have historically served as the main barriers to gene flow during the Pleistocene and continue to do so today. The most reliable geographical model suggests that during periods of Pleistocene cooling, A. altaica persisted in at least six microrefugia within the ridge. Populations associated with these microrefugia formed western, central, and eastern genetic supergroups with limited gene flow among them. The geographic locations of four of six microrefugia closely correspond to our earlier predictions regarding most of the relict species on the Khamar-Daban Ridge. Additionally, two further microrefugia are characteristic of A. altaica and are located further east than the others. The presence of common plastotypes across different populations and groups suggests that genetic isolation is not complete; rather, contact between these groups has either persisted or occurred periodically in the past. Gene flow likely took place during glaciations or early interglacial periods when the subalpine zone shifted closer to Lake Baikal, facilitating intermingling among adjacent populations as they expanded along glacial edges and through terminal moraines in the mountain forest belt.

Author Contributions

Conceptualization, M.P.; methodology, M.P. and V.P.; validation, M.P.; formal analysis, M.P. and P.N.; investigation, M.P., P.N. and V.P.; resources, M.P. and V.P.; data curation, M.P.; writing—original draft preparation, M.P.; writing—review and editing, M.P., V.P. and P.N.; visualization, M.P. and V.P.; supervision, M.P.; project administration, M.P.; funding acquisition, M.P., V.P. and P.N. All authors have read and agreed to the published version of the manuscript.

Funding

The study was financed by the grant of Russian Science Foundation No. 23-24-00501, https://rscf.ru/project/23-24-00501/ (studying Khamar-Daban Ridge populations of A. altaica) and carried out within the state assignment of Ministry of Science and Higher Education of the Russian Federation for Siberian Institute of Plant Physiology and Biochemistry of the Siberian Branch of RAS (Project State Registration No. 125021902487-9) (studying populations of A. nemorosa, A. reflexa, and A. quinquefolia) and the project of Irkutsk State University to support junior scientists (P.N.) No. 091-24-317 (studying the BN1 population of A. altaica).

Institutional Review Board Statement

Not applicable.

Data Availability Statement

Original sequence data are available at GenBank (http://www.ncbi.nlm.nih.gov/genbank, accessed on 10 August 2024) by their accession numbers presented in Table 2.

Acknowledgments

We thank the herbaria of Institute of Experimental Botany named after V.F. Kuprevich of the National Academy of Sciences of Belarus (MSK, Minsk, Republic of Belarus) and especially Dmitriy Dubovik and the Federal Scientific Center of the East Asia Terrestrial Biodiversity of the Far Eastern Branch of the Russian Academy of Sciences (VLA, Vladivostok, Russia) for allowing the collection of samples; the Baikal State Nature Biosphere Reserve for assistance in the field studies carried out on its territory and the protected area; herbarium of Irkutsk State University (IRKU, Irkutsk, Russia) and especially Nadezhda Stepantsova for assistance allowing us to deposit the vouchers, and for help with mounting the herbarium vouchers, Natalya Shvetsova for her help with lab assistance, Nikolay Stepanov and Victor Chepinoga for assistance us with field work during 2018, Pavel Zherebtsov for transportation during fieldwork on the Khamar-Daban Ridge; the Ministry of Natural Resources and Environment of the Republic of Buryatia for the permission for the plant sampling. The research was conducted using the equipment of the Core Facilities Center ‘Bioanalitika’ (Irkutsk, Russia).

Conflicts of Interest

The authors declare no conflict of interest.

References

  1. Krestov, P.V.; Omelko, A.M.; Nakamura, Y. Phytogeography of Higher Units of Forests and Krummholz in North Asia and Formation of Vegetation Complex in the Holocene. Phytocoenologia 2010, 40, 41–56. [Google Scholar] [CrossRef]
  2. Krestov, P.V.; Barkalov, V.Y.; Omelko, A.M.; Yakubov, V.V.; Nakamura, Y.; Sato, K. Relic Vegetation Complexes in the Modern Refugia of Northeast Asia. Komar. Chtenia [V. L. Komar. Meml. Lect.] 2009, 56, 5–63. (In Russian) [Google Scholar]
  3. Malyshev, L.I.; Peshkova, G.A. Osobennosti I Genezis Flory Sibiri (Predbaikalye I Zabaikalye) [Particularities and Genesis of the Flora of Siberia (Prebaikalia and Transbaikalia)]; Nauka: Novosibirsk, Russia, 1984. (In Russian) [Google Scholar]
  4. Polozii, A.V.; Krapivkina, E.D. Relikty Tretichnyh Shirokolistvennyh Lesov vo Flore Sibiri [Relics of Tertiary Deciduous Forests in the Flora of Siberia]; Tomsk University Press: Tomsk, Russia, 1985. (In Russian) [Google Scholar]
  5. Chepinoga, V.V.; Protopopova, M.V.; Pavlichenko, V.V. Detection of the Most Probable Pleistocene Microrefugia on the Northern Macroslope of the Khamar-Daban Ridge (Southern Prebaikalia). Contemp. Probl. Ecol. 2017, 10, 38–42. [Google Scholar] [CrossRef]
  6. Epova, N.A. Relics of Tertiary Broad-Leaved Forests in the Siberian Fir Taiga of the Khamar-Daban Ridge. In Izvestiia Biologo-Geograficheskogo Nauchno-Issledovatel’skogo Instituta pri Irkutskom Gosudarstvennom Universitete Imeni A. A. Zhdanova; Institute of Biology and Geography, A.A. Zhdanov Irkutsk State University: Irkutsk, Russia, 1956; Volume 16, pp. 47–61. (In Russian) [Google Scholar]
  7. Belov, A.V.; Bezrukova, E.V.; Sokolova, L.P.; Abzayeva, A.A.; Letunova, P.P.; Fisher, E.E.; Orlova, L.A. Vegetation of the Baikal Region as an Indicator of Global and Regional Changes in Natural Conditions of North Asia in the Late Cainozoic. Geogr. Nat. Resour. 2006, 6, 5–18. (In Russian) [Google Scholar]
  8. Krasnopevtseva, V.M.; Namzalov, B.B.; Krasnopevtseva, A.S. 3. Peculiarity of the Biology and Rhythm Flowering Ephemeral Plants of Khamar-Daban Mountain Range (Southn Prebaikalye). Bull. Buryat State Univ. 2008, 4, 107–111. (In Russian) [Google Scholar]
  9. Gamova, N.S.; Protopopova, M.V.; Pavlichenko, V.V.; Korotkov, Y.N. First Reliable Finding of Galium odoratum (L.) Scop. And New Findings of Galium Paradoxum Maxim. In the Republic of Buryatia. Trans. Karelian Res. Cent. RAS 2024, 1, 1–10. (In Russian) [Google Scholar] [CrossRef]
  10. Enikeev, F. Paleogeography of the Sartan Glaciation of the Hamar-Daban Ridge (Southern Baikal Region). Transbaikal State Univ. J. 2020, 26, 17–32. [Google Scholar] [CrossRef]
  11. Mel’nikov, Y.I. Pleistocene Gaps in the Areas of Birds of Eastern Siberia and Their Filling in the Modern Period of Climate Warming. IOP Conf. Ser. Earth Environ. Sci. 2023, 1154, 012065. [Google Scholar] [CrossRef]
  12. Chepinoga, V.V.; Protopopova, M.V.; Pavlichenko, V.V.; Dudov, S.V. Habitat Distribution Patterns of Nemoral Relict Plant Species on the Khamar-Daban Ridge (the South of Eastern Siberia) according to Grid Mapping Data. Russ. J. Ecol. 2021, 52, 212–222. [Google Scholar] [CrossRef]
  13. Krasnoborov, I.M. Flora Alpina Montium Sajanesium Occidentalium; Nauka: Novosibirsk, Russia, 1976. (In Russian) [Google Scholar]
  14. Krasnopevtseva, V.M.; Krasnopevtseva, A.S. Relict Plants of the Tertiary Nemoral Complex in Southern Transbaikalia. Tr. Tigirekskogo Zapov. [Proc. Tigirek State Nat. Reserve] 2010, 3, 194–196. (In Russian) [Google Scholar] [CrossRef]
  15. Chepinoga, V.V.; Mishina, A.V.; Protopopova, M.V.; Pavlichenko, V.V.; Bystrov, S.O.; Vilor, M.A. New Data on Distribution of Several Nemoral Relict Plant Species on the Foothills of the Khamar-Daban Ridge (Southern Baikal). Bot. Zhurnal 2015, 100, 478–489. (In Russian) [Google Scholar]
  16. Doyle, J.J.; Doyle, J.L. A Rapid DNA Isolation Procedure for Small Quantities of Fresh Leaf Tissue. Phytochem. Bull. 1987, 19, 11–15. [Google Scholar]
  17. Protopopova, M.V.; Pavlichenko, V.V. Eranthis salisb (Ranunculaceae) in South Siberia: Insights into Phylogeography and Taxonomy. Diversity 2022, 14, 779. [Google Scholar] [CrossRef]
  18. Taberlet, P.; Gielly, L.; Pautou, G.; Bouvet, J. Universal Primers for Amplification of Three Non-Coding Regions of Chloroplast DNA. Plant Mol. Biol. 1991, 17, 1105–1109. [Google Scholar] [CrossRef] [PubMed]
  19. Kumar, S.; Stecher, G.; Tamura, K. MEGA7: Molecular Evolutionary Genetics Analysis Version 7.0 for Bigger Datasets. Mol. Biol. Evol. 2016, 33, 1870–1874. [Google Scholar] [CrossRef]
  20. Zhang, N. Direct Submission in GenBank. Available online: https://www.ncbi.nlm.nih.gov/nuccore/OK267274.1 (accessed on 18 July 2024).
  21. Lee, C.S.; Lee, N.S.; Yeau, S.H. Molecular Phylogenetic Study of Anemone pendulisepala (Ranunculaceae). Korean J. Plant Taxon. 2006, 36, 263–277. [Google Scholar] [CrossRef]
  22. Zhang, N.; Lu, Y.; Zhang, Z. The Complete Chloroplast Genome Sequence of Anemone reflexa (Ranunculaceae). Mitochondrial DNA Part B Resour. 2021, 6, 304–305. [Google Scholar] [CrossRef] [PubMed]
  23. Fujii, N.; Senni, K. Phylogeography of Japanese Alpine Plants: Biogeographic Importance of Alpine Region of Central Honshu in Japan. Taxon 2006, 55, 43–52. [Google Scholar] [CrossRef]
  24. Ronquist, F.; Teslenko, M.; van der Mark, P.; Ayres, D.L.; Darling, A.; Höhna, S.; Larget, B.; Liu, L.; Suchard, M.A.; Huelsenbeck, J.P. MrBayes 3.2: Efficient Bayesian Phylogenetic Inference and Model Choice across a Large Model Space. Syst. Biol. 2012, 61, 539–542. [Google Scholar] [CrossRef]
  25. Tamura, K. Estimation of the Number of Nucleotide Substitutions When There Are Strong Transition-Transversion and G+C-Content Biases. Mol. Biol. Evol. 1992, 9, 678–687. [Google Scholar] [CrossRef]
  26. Hasegawa, M.; Kishino, H.; Yano, T. Dating of the Human-Ape Splitting by a Molecular Clock of Mitochondrial DNA. J. Mol. Evol. 1985, 22, 160–174. [Google Scholar] [CrossRef]
  27. Felsenstein, J. Evolutionary Trees from DNA Sequences: A Maximum Likelihood Approach. J. Mol. Evol. 1981, 17, 368–376. [Google Scholar] [CrossRef] [PubMed]
  28. Jukes, T.H.; Cantor, C.R. Evolution of Protein Molecules; Academic Press: New York, NY, USA, 1969; Volume 3, pp. 21–132. [Google Scholar]
  29. Rambaut, A. FigTree: Tree Figure Drawing Tool, Version 1.4.3. Available online: http://tree.bio.ed.ac.uk/software/figtree/ (accessed on 15 July 2022).
  30. Templeton, A.R.; Crandall, K.A.; Sing, C.F. A Cladistic Analysis of Phenotypic Associations with Haplotypes Inferred from Restriction Endonuclease Mapping and DNA Sequence Data. III. Cladogram Estimation. Genetics 1992, 132, 619–633. [Google Scholar] [CrossRef]
  31. Leigh, J.W.; Bryant, D. PopART: Full-Feature Software for Haplotype Network Construction. Med. Ecol. Evol. 2015, 6, 1110–1116. [Google Scholar] [CrossRef]
  32. Tajima, F. Statistical Method for Testing the Neutral Mutation Hypothesis by DNA Polymorphism. Genetics 1989, 123, 585–595. [Google Scholar] [CrossRef] [PubMed]
  33. Excoffier, L.; Smouse, P.E.; Quattro, J.M. Analysis of Molecular Variance Inferred from Metric Distances among DNA Haplotypes: Application to Human Mitochondrial DNA Restriction Data. Genetics 1992, 131, 479–491. [Google Scholar] [CrossRef] [PubMed]
  34. Wright, S. Isolation by Distance. Genetics 1943, 28, 114–138. [Google Scholar] [CrossRef]
  35. Peakall, R.; Smouse, P.E. GENALEX 6: Genetic Analysis in Excel. Population Genetic Software for Teaching and Research. Mol. Ecol. Notes 2006, 6, 288–295. [Google Scholar] [CrossRef]
  36. Peakall, R.; Smouse, P.E. GenAlEx 6.5: Genetic Analysis in Excel. Population Genetic Software for Teaching and Research—An Update. Bioinformatics 2012, 28, 2537–2539. [Google Scholar] [CrossRef]
  37. Huff, D.R.; Peakall, R.; Smouse, P.E. RAPD Variation within and among Natural Populations of Outcrossing Buffalograss [Buchloë Dactyloides (Nutt.) Engelm.]. Theor. Appl. Genet. 1993, 86, 927–934. [Google Scholar] [CrossRef]
  38. Nei, M. Genetic Distance between Populations. Am. Nat. 1972, 106, 283–292. [Google Scholar] [CrossRef]
  39. Mantel, N. The Detection of Disease Clustering and a Generalized Regression Approach. Cancer Res. 1967, 27, 209–220. [Google Scholar]
  40. Smouse, P.E.; Long, J.C.; Sokal, R.R. Multiple Regression and Correlation Extensions of the Mantel Test of Matrix Correspondence. Syst. Zool. 1986, 35, 627–632. [Google Scholar] [CrossRef]
  41. Smouse, P.E.; Peakall, R. Spatial Autocorrelation Analysis of Individual Multiallele and Multilocus Genetic Structure. Heredity 1999, 82, 561–573. [Google Scholar] [CrossRef] [PubMed]
  42. Smouse, P.E.; Peakall, R.; Gonzales, E. A Heterogeneity Test for Fine-Scale Genetic Structure. Mol. Ecol. 2008, 17, 3389–3400. [Google Scholar] [CrossRef] [PubMed]
  43. Double, M.C.; Peakall, R.; Beck, N.R.; Cockburn, A. Dispersal, Philopatry and Infidelity: Dissecting Local Genetic Structure in Superb Fairy-Wrens (Malurus cyaneus). Evolution 2005, 59, 625–635. [Google Scholar] [CrossRef]
  44. Microsoft Corporation. Microsoft Excel. Available online: https://office.microsoft.com/excel (accessed on 31 December 2016).
  45. QGIS Development Team. QGIS Geographic Information System. Open Source Geospatial Foundation Project. Available online: http://qgis.osgeo.org (accessed on 6 April 2024).
  46. Fu, W.; Zhao, K.; Zhang, C.; Tunney, H. Using Moran’s I and Geostatistics to Identify Spatial Patterns of Soil Nutrients in Two Different Long-Term Phosphorus-Application Plots. J. Plant Nutr. Soil. Sci. 2011, 174, 785–798. [Google Scholar] [CrossRef]
  47. Dutton, B.E.; Keener, C.S.; Ford, B.A. Anemone quinquefolia Linnaeus. In 1993+ Flora of North America North of Mexico; 25+ volumes, volume 3; Flora of North America Editorial Committee, Ed.; Oxford University Press: New York, NY, USA; Oxford, UK, 1997; Available online: http://floranorthamerica.org/Anemone_quinquefolia (accessed on 11 July 2024).
  48. Tamura, M. Angiospermae: Ordnung Ranunculales, Fam. Ranunculaceae, Anemoneae. In Die Natürlichen Pflanzenfamilien; Hiepko, P., Ed.; Duncker and Homblot: Berlin, Germany, 1995; Volume 17a IV, pp. 324–349. [Google Scholar]
  49. Ziman, S.N.; Bulakh, E.V.; Kadota, Y.; Keener, C.S. Modern View on the Taxonomy of the Genus Anemone L. Sensu Stricto (Ranunculaceae). J. Jpn. Bot. 2008, 83, 127–155. [Google Scholar]
  50. Hoot, S.B.; Meyer, K.M.; Manning, J.C. Phylogeny and Reclassification of Anemone (Ranunculaceae), with an Emphasis on Austral Species. Syst. Bot. 2012, 37, 139–152. [Google Scholar] [CrossRef]
  51. Hu, S.; Shi, W.; Huang, Y.; Zhang, Z.; Lin, Q.; Shi, C. Comparative Analysis of Complete Chloroplast Genomes of Five Anemone Species and Phylogenetic Analysis within Tribe Anemoneae (Ranunculaceae). J. Plant Biochem. Biotechnol. 2024, 33, 271–287. [Google Scholar] [CrossRef]
  52. Yuzepchuk, S.V. Anemone L. In Flora of the USSR; Komarov, V.L., Ed.; Academy of Sciences of the USSR: Moscow-Leningrad, Russia, 1937; Volume 7, pp. 236–282. (In Russian) [Google Scholar]
  53. Popov, M.G. Flora Sredney Sibiri [Flora of Central Siberia]; Academy of Sciences of the USSR: Moscow-Leningrad, Russia, 1957; Volume 1. (In Russian) [Google Scholar]
  54. Boyd, O.F.; Philips, T.K.; Johnson, J.R.; Nixon, J.J. Geographically Structured Genetic Diversity in the Cave Beetle Darlingtonea Kentuckensis Valentine, 1952 (Coleoptera, Carabidae, Trechini, Trechina). Subterr. Biol. 2020, 34, 1–23. [Google Scholar] [CrossRef]
  55. Velichko, V.V. Oledeneniya Chetvertichnogo Perioda [the Quaternary Glaciations]. Great Russian Encyclopedia. Electronic Version 2019. Available online: https://old.bigenc.ru/geology/text/5556825 (accessed on 11 May 2024). (In Russian).
  56. Gorchakovsii, P.L.; Shurova, E.A. Redkie I Ischezayushchie Rastenia Urala I Priural’ya Rare and Endangered Plants of the Ural and Cis-Ural Region; Nauka: Moscow, Russia, 1982. (In Russian) [Google Scholar]
  57. Chen, T.; Wang, X.; Tang, H.; Chen, Q.; Huang, X.; Chen, J. Genetic Diversity and Population Structure of Chinese Cherry Revealed by Chloroplast DNA TrnQ-Rps16 Intergenic Spacers Variation. Genet. Resour. Crop Evol. 2013, 60, 1859–1871. [Google Scholar] [CrossRef]
Figure 1. Diversity and phylogenetic relationships of plastotypes (P) in Anemone altaica from various localities. (a) BI phylogram of plastotypes of A. altaica and closely related species. Posterior probabilities (PP) are displayed above the dividing line in proximity to the nodes, Bootstrap values (BS) for the respective clades on the ML tree shown below this line. The gray arrow indicates the supported position of the taxon on ML 50% majority-rule consensus tree compared to the BI tree. The scale bar denotes the number of expected changes (substitutions and/or indels) per site, corresponding to a unit of branch length. The color pattern represents the distinct plastotypes (P1–P6) identifies within A. altaica populations. Plastotypes of A. reflexa that correspond to those in A. altaica are color-coded in the same way. The number of identical sequences found for each plastotype is indicated in brackets next to the branch names. Absence of information regarding the number of sequences indicates that there is only one sequence per plastotype. The plastogroups (PG) discussed in the text indicated above the branches (b) TCS network constructed using only plastotypes from South Siberian populations of A. altaica. Anemonastrum canadense was used as an outgroup. Plastotypes P1-P6 in A. altaica are depicted as colored circles interconnected by lines, with hatch marks indicating the number of evolutionary events (substitutions/indels). The size of each circle reflects the count of identical sequences sampled (refer to the circular scale). The colors of circle sectors and accompanying numbers represent A. altaica populations. Unidentified black dots denote network vertices. Abbreviated regions and locality names correspond to those listed in Table 1 and Table 2.
Quaternary 08 00020 g001
Figure 2. Patterns of genetic structure of Anemone altaica visualized using Principal Coordinate Analysis (PCoA) based on (a) pairwise genetic distances among all samples. The colors and corresponding abbreviations indicate the plastotypes, following a format similar to that shown in Figure 1a; (b) pairwise Nei unbiased genetic distances for the Khamar-Daban population only. Populations abbreviated consistently with Table 1 and Table 2 and Figure 1b, and are colored according to their geographical supergroups, matching the map shown in insert in the upper right section of the graph field.
Quaternary 08 00020 g002
Figure 3. The phylogeographical patterns of Anemone altaica on the Khamar-Daban Ridge. The inset in the lower left corner is a superimposed image displaying the location of glaciers and their nourishment areas (showed as brighten areas with glacier isolines) during the Sartan (the last) glaciation, as referenced from [10]). Each colored circle represents distinct populations, abbreviated in a manner consistent with Table 1 and Figure 1b. The precise location of each population is marked by a small dark dot at the edge of the pie chart. The colors of the circle sectors, along with their corresponding abbreviations, indicate the plastotypes present in each population, following a format similar to that shown in Figure 1a. The size of the sectors reflects the proportion of individual plastotypes within the total sample from the population. Roman numerals within triangles schematically denote hypothesized Pleistocene microrefugia on the northern macroslope of the Khamar-Daban Ridge. Geographic supergroups of the populations discussed in the text are represented by arcuate dashed lines. Additionally, small numbered arrows highlight glacier tongues with maximum descent: 1—the Osinovka River (near Vydrino village), 2—the Vydrinaya River, 3—the Pereemnaya River. The map was generated using QGIS v. 3.36.0 [45], utilizing a map projection of WGS 84-Pseudo-Mercator and datum WGS84.
Quaternary 08 00020 g003
Figure 4. Mantel test for the isolation by distance (IBD) effect conducted on (a) the complete sample comprising all studied populations; and (b) the reduced sample obtained by excluding specimens from MM1, E1, and T1 localities. Significance testing was performed using 10,000 permutations. The regression line is indicated in green.
Quaternary 08 00020 g004
Figure 5. Spatial Autocorrelation for A. altaica on the Khamar-Daban Ridge. (a) The correlogram resulting from Global Spatial Autocorrelation analysis based on a pair-wise genetic distance matrix derived from differences in plastotype composition, along with a geographic distance matrix for all sampled individuals. The autocorrelation coefficient r measures the genetic similarity between pairs of individuals whose geographic separation falls within the specified distance class. Dashed red curves indicate 95% confidence intervals derived from 1000 permutations, while the error bars bound the 95% confidence interval calculated using bootstrap method with 1000 replicates. (b) 2-Dimensional Local Spatial Autocorrelation (2D LSA) analysis based on the pairwise genetic distance matrix and geographic distance matrix for the studied populations. Populations demonstrating significant relationships with their surroundings are marked with ‘plus’ or ‘minus’ symbols. Significance testing was conducted using one-tailed or two-tailed tests with 1000 permutations. Roman numerals and ellipses denote the approximate outlines of Pleistocene microrefugia according to Hypothesis 5.
Quaternary 08 00020 g005
Figure 6. Mismatch distributions for trnL + trnL-trnF ptDNA region in A. altaica on the Khamar-Daban Ridge.
Quaternary 08 00020 g006
Table 1. List of collected specimens of A. altaica and reference species.
Locality Abbr.Voucher Information 1Coordinates, Altitude 2
Anemone altaica
B1Russia, South Siberia, Irkutskaya Oblast’, Slyudyanskiy Rayon, the Khamar-Daban Ridge, the Babkha Riv., 6 June 2018, V. Chepinoga, A. Skornyakova, A. Yudintseva (IRKU094289)51.52832° N
104.09334° E
493 m alt.
BN1Russia, South Siberia, Krasnoyarskiy Kray, Ermakovskiy Rayon, the Western Sayan Mountains, Nizhnyaya Buyba Riv., 11 June 2018, V. Pavlichenko, V. Chepinoga, M. Protopopova (IRKU042130–31)52.824383° N
93.309001° E
1313 m alt.
BR1Russia, South Siberia, the Republic of Buryatia, Kabanskiy Rayon, the Khamar-Daban Ridge, the Bol’shaya Rechka Riv., 31 May 2022, M. Protopopova, V. Pavlichenko, P. Nelyubina (IRKU094254)51.95788° N
106.35214° E
469 m alt.
Bz1Russia, South Siberia, Irkutskaya Oblast’, Slyudyanskiy Rayon, the Khamar-Daban Ridge, the Bezymyannaya Riv., 3 June 2022, M. Protopopova, V. Pavlichenko, P. Nelyubina (IRKU094248)51.59373° N
103.90829° E
461 m alt.
E1Russia, South Siberia, the Republic of Buryatia, Kabanskiy Rayon, the Khamar-Daban Ridge, the Elovka Riv., 31 May 2022, M. Protopopova, V. Pavlichenko, P. Nelyubina (IRKU094252)51.975154° N
106.504712° E
519 m alt.
HM1Russia, South Siberia, Irkutskaya Oblast’, Slyudyanskiy Rayon, the Khamar-Daban Ridge, the Khara-Murin Riv., 3 June 2022, M. Protopopova, V. Pavlichenko (IRKU094247)51.455189° N
104.413624° E
479 m alt.
M1Russia, South Siberia, the Republic of Buryatia, Kabanskiy Rayon, the Khamar-Daban Ridge, the Bol’shoy Mamay Riv., 3 June 2022, M. Protopopova, V. Pavlichenko, P. Nelyubina (IRKU094246)51.44989° N
104.78263° E
472 m alt.
M2Russia, South Siberia, the Republic of Buryatia, Kabanskiy Rayon, the Khamar-Daban Ridge, the Bol’shoy Mamay Riv., 27 June 2023, M. Protopopova, V. Pavlichenko, P. Nelyubina (IRKU IRKU094271)51.433755° N
104.798493° E
518 m alt.
M3Russia, South Siberia, the Republic of Buryatia, Kabanskiy Rayon, the Khamar-Daban Ridge, the Bol’shoy Mamay Riv., 27 June 2023, M. Protopopova, V. Pavlichenko, P. Nelyubina (IRKU IRKU094272–74)51.376564° N
104.868684° E
1208 m alt.
MM1Russia, South Siberia, the Republic of Buryatia, Kabanskiy Rayon, the Khamar-Daban Ridge, the Maliy Mamay Riv., 2 June 2022, M. Protopopova, V. Pavlichenko, P. Nelyubina (IRKU094257)51.450789° N
104.813297° E
466 m alt.
Mn1Russia, South Siberia, the Republic of Buryatia, Kabanskiy Rayon, the Khamar-Daban Ridge, the Manturikha Riv., 31 May 2022, M. Protopopova, V. Pavlichenko, P. Nelyubina (IRKU094242)51.771462° N
105.984607° E
451 m alt.
MOs1Russia, South Siberia, the Republic of Buryatia, Kabanskiy Rayon, the Khamar-Daban Ridge, the Osinovka Riv. (near Mishikha Riv.), 2 June 2024, M. Protopopova, P. Nelyubina, V. Pavlichenko (IRKU094278-80)51.591755° N
105.384154° E
474 m alt.
Ms1Russia, South Siberia, the Republic of Buryatia, Kabanskiy Rayon, the Khamar-Daban Ridge, the Mysovka Riv., 31 May 2022, M. Protopopova, V. Pavlichenko, P. Nelyubina (IRKU094253)51.67841° N
105.89572° E
513 m alt.
Msh1Russia, South Siberia, the Republic of Buryatia, Kabanskiy Rayon, the Khamar-Daban Ridge, the Mishikha Riv., 1 June 2022, M. Protopopova, V. Pavlichenko, P. Nelyubina (IRKU094255)51.645528° N
105.542409° E
461 m alt.
N1Russia, South Siberia, the Republic of Buryatia, Kabanskiy Rayon, the Khamar-Daban Ridge, the Nikitkina Riv., 31 May 2022, M. Protopopova, V. Pavlichenko, P. Nelyubina (IRKU094243)51.971705° N
106.487322° E
487 m alt.
Pr1Russia, South Siberia, the Republic of Buryatia, Kabanskiy Rayon, the Khamar-Daban Ridge, the Pereemnaya Riv., 1 June 2024, M. Protopopova, V. Pavlichenko, P. Nelyubina (IRKU094275-77)51.513294° N
105.207800° E
474 m alt.
S2Russia, South Siberia, Irkutskaya Oblast’, Slyudyanskiy Rayon, the Khamar-Daban Ridge, the Snezhnaya Riv., 2 June 2022, M. Protopopova, V. Pavlichenko, P. Nelyubina (IRKU094251)51.406766° N
104.642759° E
473 m alt.
S3Russia, South Siberia, Irkutskaya Oblast’, Slyudyanskiy Rayon, the Khamar-Daban Ridge, the Snezhnaya Riv., 29 June 2023, M. Protopopova, V. Pavlichenko, P. Nelyubina (IRKU094261-63)51.35570° N
104.61346° E
936 m alt.
So1Russia, South Siberia, Irkutskaya Oblast’, Slyudyanskiy Rayon, the Khamar-Daban Ridge, the Solzan Riv., 3 June 2024, M. Protopopova, V. Pavlichenko, P. Nelyubina (IRKU094281-83,87)51.488595° N
104.157478° E
534 m alt.
So2Russia, South Siberia, Irkutskaya Oblast’, Slyudyanskiy Rayon, the Khamar-Daban Ridge, the Solzan Riv., 3 June 2024, M. Protopopova, V. Pavlichenko, P. Nelyubina (IRKU094284-86)51.498915° N
104.158083 E
513 m alt.
T1Russia, South Siberia, the Republic of Buryatia, Kabanskiy Rayon, the Khamar-Daban Ridge, the Timlyuy Riv., 31 May 2022, M. Protopopova, V. Pavlichenko, P. Nelyubina (IRKU094244)51.965865° N
106.581702° E
516 m alt.
TOs1Russia, South Siberia, the Republic of Buryatia, Kabanskiy Rayon, the Khamar-Daban Ridge, the Osinovka (near Tankhoy setl.) Riv., 1 June 2022, M. Protopopova, V. Pavlichenko, P. Nelyubina (IRKU094256)51.549228° N
105.094652° E
469 m alt.
Ut2Russia, South Siberia, Irkutskaya Oblast’, Slyudyanskiy Rayon, the Khamar-Daban Ridge, the Utulik Riv., 30 May 2022, M. Protopopova, V. Pavlichenko, P. Nelyubina (IRKU094250)51.54594° N
104.04675° E
453 m alt.
V1Russia, South Siberia, the Republic of Buryatia, Kabanskiy Rayon, the Khamar-Daban Ridge, the Vydrinaya Riv., 1 June 2022, M. Protopopova, V. Pavlichenko, P. Nelyubina (IRKU094245)51.485538° N
104.848959° E
457 m alt.
Anemone nemorosa
Republic of Belarus, Eastern Europe, Minskaya Oblast’, Minskiy Rayon, 16 May 1979, G.A. Kim (MSK-V388)Unknown
Anemone reflexa
Bz1Russia, South Siberia, Irkutskaya Oblast’, Slyudyanskiy Rayon, the Khamar-Daban Ridge, the Bezymyannaya Riv., 30 June 2023, M. Protopopova, V. Pavlichenko, P. Nelyubina (IRKU094288)51.59373° N
103.90829° E
461 m alt.
Anemone quinquefolia
USA, North America, Massachusetts, Belchertown, 14 May 1989, C.R. Lombardi (VLA)Unknown
Notes: 1 Bold and underlined letters in the vouchers indicate those included in the locality abbreviations. 2 The geographic coordinates and altitude data were referenced by combined GPS/GLONASS positioning, datum WGS84.
Table 2. The taxa and DNA sequences used for the phylogenetic reconstructions.
Taxon NameRegion 1LocalityMicrorefugium 2Supergroup 2Plastotype 3n 4GenBank Accession NumbersRef.
trnLtrnL-trnF
Anemone altaicaEA *P11OK267274.1OK267274.1[20]
Anemone altaicaKhDB1IWP33PQ660085PQ660123curr.
Anemone altaicaKhDB1IWP43PQ660086PQ660124curr.
Anemone altaicaKhDBR1VEP110PQ660087PQ660125curr.
Anemone altaicaKhDBz1IWP36PQ660088PQ660126curr.
Anemone altaicaKhDE1VIEP210PQ660089PQ660127curr.
Anemone altaicaKhDHM1IICP26PQ660090PQ660128curr.
Anemone altaicaKhDM1IICP28PQ660091PQ660129curr.
Anemone altaicaKhDM2IICP210PQ660092PQ660130curr.
Anemone altaicaKhDM3IICP210PQ660093PQ660131curr.
Anemone altaicaKhDMM1IIICP110PQ660094PQ660132curr.
Anemone altaicaKhDMn1VEP110PQ660095PQ660133curr.
Anemone altaicaKhDMOs1IVCP25PQ660096PQ660134curr.
Anemone altaicaKhDMOs1IVCP55PQ660097PQ660135curr.
Anemone altaicaKhDMs1VEP18PQ660098PQ660136curr.
Anemone altaicaKhDMs1VEP22PQ660099PQ660137curr.
Anemone altaicaKhDMsh1IVCP27PQ660100PQ660138curr.
Anemone altaicaKhDMsh1IVCP53PQ660101PQ660139curr.
Anemone altaicaKhDN1VEP19PQ660102PQ660140curr.
Anemone altaicaKhDN1VEP22PQ660103PQ660141curr.
Anemone altaicaKhDPr1IV(III)CP210PQ660104PQ660142curr.
Anemone altaicaKhDS2IICP28PQ660105PQ660143curr.
Anemone altaicaKhDS2IICP43PQ660106PQ660144curr.
Anemone altaicaKhDS3IICP210PQ660107PQ660145curr.
Anemone altaicaKhDSo1IWP310PQ660108PQ660146curr.
Anemone altaicaKhDSo2IWP37PQ660109PQ660147curr.
Anemone altaicaKhDSo2IWP43PQ660110PQ660148curr.
Anemone altaicaKhDT1VIEP210PQ660111PQ660149curr.
Anemone altaicaKhDTOs1IIICP12PQ660112PQ660150curr.
Anemone altaicaKhDTOs1IIICP24PQ660113PQ660151curr.
Anemone altaicaKhDTOs1IIICP44PQ660114PQ660152curr.
Anemone altaicaKhDUt2IWP38PQ660115PQ660153curr.
Anemone altaicaKhDUt2IWP42PQ660116PQ660154curr.
Anemone altaicaKhDV1IIICP12PQ660117PQ660155curr.
Anemone altaicaKhDV1IIICP210PQ660118PQ660156curr.
Anemone altaicaWSBN1P63PQ660119PQ660157curr.
Anemone amurensisEA1EF139341.1EF139341.1[21]
Anemone nemorosaEE1PQ660120PQ660158curr.
Anemone reflexaEAP11MW043774MW043774[22]
Anemone reflexaKhDBz1P23PQ660121PQ660159curr.
Anemone quinquefoliaNA1PQ660122PQ660160curr.
Anemonastrum canadense (L.) Mosyakin1AB248018.1AB248018.1[23]
Anemonastrum narcissiflora L.1AB248017.1AB248017.1[23]
Notes: 1 EA—East Asia; EE—Eastern Europe; KhD—the Khamar-Daban Ridge; NA—North America; WS—the Western Sayan Mountains; * indicates the proposed region of sample due to the lack of detailed information in the original study. 2 Association with microrefugium and/or supergroup is based on geographic models that are strongly supported by statistical evidence, as presented in the results section. 3 The identified plastotypes were continuously numbered for each species separately. 4 The number of sequences used in the analysis.
Table 3. AMOVA statistics for different structure hypothesis of Anemone altaica on the Khamar-Daban Ridge.
Source of Variationd.f.Sum of SquaresVariation, %Ф-Statistics 1p-Value 2
Hypothesis 1: 23 distinct populations (without grouping)
Among populations222124.58381.16ФST = 0.81161<0.001
Within populations197431.57618.84
Hypothesis 2: Population supergroups: Western, Central, and Eastern
Among groups2811.97736.69ФCT = 0.36693=0.006
Ф’CT = 0.81955=0.001
Among populations within groups201312.60747.61ФSC = 0.75199<0.001
Ф’SC = 0.68006=0.001
Within populations197431.57615.70ФST = 0.84299<0.001
Hypothesis 3: Population groups associated with 4 microrefugia according to [5]
Among groups3493.42512.08ФCT = 0.12082=0.138
Among populations within groups191631.15870.36ФSC = 0.80028<0.001
Within populations197431.57617.56ФST = 0.82441<0.001
Hypothesis 4: Population groups associated with 5 microrefugia: I, II, III, IV, and V + VI
Among groups41112.20839.22ФCT = 0.39223=0.011
Ф’CT = 0.54290=0.001
Among populations within groups181012.37644.00ФSC = 0.72231<0.001
Ф’SC =0.69092 =0.001
Within populations197431.57616.88ФST = 0.83123<0.001
Hypothesis 5: Population groups associated with 6 microrefugia (main): I, II, III, IV, V, and VI
Among groups51812.85570.98ФCT = 0.70983<0.001
Ф’CT = 0.86459=0.001
Among populations within groups17311.72812.71ФSC = 0.43817<0.001
Ф’SC = 0.36053=0.001
Within populations197431.57616.30ФST = 0.83698<0.001
Hypothesis 6: Population groups associated with 6 microrefugia (alternative): I, II, III, IV, V, and VI
Among groups51717.00366.45ФCT = 0.66449<0.001
Ф’CT = 0.85700=0.001
Among populations within groups17407.58017.93ФSC = 0.51245<0.001
ФSC = 0.39447=0.001
Within populations197431.57616.36ФST = 0.83642<0.001
Within (super)groups
Western supergroup (W):
Among populations41.27610.79ФST = 0.10791=0.058
Within populations375.20089.21
Central supergroup (C):
Among populations11586.78669.77ФST = 0.69769<0.001
Within populations105219.24830.23
Eastern supergroup (E):
Among populations5724.54575.44ФST = 0.75442<0.001
Within populations55207.12724.56
Microrefurium (group) I:
Among populations41.27610.79ФST = 0.10791=0.058
Within populations375.20089.21
Microrefurium (group) II:
Among populations50.65514.99ФST = 0.14992=0.020
Within populations492.18285.01
Microrefurium (group) III:
Among populations2280.83354.92ФST = 0.54926<0.001
Within populations29198.66745.07
Microrefurium (group) IV:
Among populations25.06715.34ФST = 0.15337=0.019
Within populations2718.40084.66
Microrefurium (group) V:
Among populations323.8973.00ФST = 0.03002=0.227
Within populations37207.12797.00
Microrefurium (group) VI:
Among populations10NaNNaN<0.001
Within populations180NaN
Notes: 1 Ф-statistics were derived from an individual-by-individual genetic distance matrix, which was derived from the total number of locus differences. Additionally, Ф’-values are presented for hypotheses that are statistically supported. The Ф’-values were obtained by dividing the Ф-values by the maximum theoretical Ф-values. In this context, Ф’-values were calculated using an alternative approach based on genetic distances matrix derived from differences in plastotype composition rather than from the number of locus differences; significant ФCT values, which indicate differentiation among the tested groups, are highlighted in bold. 2 Statistical testing was conducted through 1000 random permutations.
Table 4. Diversity metrics and test of neutrality hypothesis for (super)groups of A. altaica on the Khamar-Daban Ridge.
Group/SupergroupNpopPhNeISπTajima’s D (p-Value)
Western supergroup (W)520.3161.4460.48710.000400.5060 (0.305)
Central supergroup (C)1240.4151.7000.82090.002560.4412 (0.321)
Eastern supergroup (E)620.4851.9130.67080.004983.3435 (0.000)
Microrefurium (group) I520.3161.4460.48710.000400.5060 (0.305)
Microrefurium (group) II620.1051.1150.21210.00013−0.6810 (0.735)
Microrefurium (group) III330.6212.5100.98380.005223.1312 (0.000)
Microrefurium (group) IV320.4051.6420.58020.001031.2349 (0.119)
Microrefurium (group) V420.1801.2140.32080.00185−0.6464 (0.722)
Microrefurium (group) VI210.0001.0000.00000.000000.0000 (0.000)
The general population2350.6602.9171.275100.004292.2914 (0.017)
Notes: Npop—Number of local populations in the sample, P—Number of plastotypes, h—Unbiased plastotype (haplotype) diversity, Ne—effective number of plastotypes, I—Information index for genetic diversity (equivalent to the Shannon-Weaver Index) calculated based on plastotype frequencies, S—Number of segregating sites, π—Nucleotide diversity. Significant D-values are indicated in bold.
Disclaimer/Publisher’s Note: The statements, opinions and data contained in all publications are solely those of the individual author(s) and contributor(s) and not of MDPI and/or the editor(s). MDPI and/or the editor(s) disclaim responsibility for any injury to people or property resulting from any ideas, methods, instructions or products referred to in the content.

