Abstract
The purpose of this research is to develop a model for measuring the efficiency of the TTO incubation process performance to accelerate the commercialization of research results in universities. The method of analyzing the efficiency used in this research is the Data Envelopment Analysis (DEA) method based on Banker, Charnes, and Cooper (BCC), which is output-oriented. The software used in analyzing the efficiency of TTO performance is MaxDEA 8. The output of this research is a mathematical model tool for measuring the efficiency of TTO performance by DEA, which considered 17 parameters and proposed recommendations for TTO performance strategies. The limitation of this research is the object of research in one university that has succeeded in the commercialization of research. This research implies that the performance efficiency measurement model is an alternative predictive way to increase the acceleration of commercialization. The practical implications of this research are that it can evaluate performance or inefficient strategies in the incubation process of higher education research results to the Technology Transfer Office (TTO). This research also provides recommendations on strengthening the TTO function that can be used as a reference for improving performance at universities. This research measures the level of performance evaluation of TTO in the incubation process, which refers to the Death Valley framework. This incubation process is the main process accelerating the commercialization of research results in universities.
1. Introduction
Nowadays, the government encourages universities to conduct research that has an impact on communities. Therefore, the research activities, ideas, or problem solutions for community issues could be expanded to be a business organization such as spin-off companies in the universities or external organizations that work together as distributors of innovative products through a partnership scheme (license/royalty) based on the Law of Higher Education Republic Indonesia. This down-streaming process can be interpreted as the commercialization process of research results. According to [1], the downstream process of research results in Indonesia is still small, with 22% reaching the market and around 60% usually failing economically. Furthermore, 40% of the research is economically successful, and only 8% of the research is successful and applied sustainably, implemented, and served to the community. Many factors have influenced the success of a research result towards the business organization. One of the factors is the gap between academic and industrial research [2]. Thus, universities must take on a role by establishing a Technology Transfer Office (TTO), which has a key role in providing structural links between universities and industry.
One of the strategies carried out by the TTO in the technology commercialization process is mentoring and coaching activities through a business incubator. The role of the incubator is very important for startup entrepreneurs/SMEs (technology-based innovative tenants) because the incubator is designed to help new and developing businesses become independent entrepreneurs through a series of integrated assistance, including the provision of office facilities, production testing, market testing, management consulting, technology, marketing and finance, training, and the creation of business networks both locally and internationally [3]. Pre-incubation, incubation, and post-incubation are the three steps of the incubation process. The pre-incubation stage aims to build a synergistic partnership between technology producers and users and their supporting elements. The incubation stage aims to realize the facilities needed by tenants in business development efforts; at this stage, technology and business transfer occur. For the post-incubation stage, mass product accessibility occurs, with tenants having passed the incubation stage and being able to start mass production [4].
To assess whether the incubation process is running well or not, it is necessary to measure performance efficiency. The process of finding, defining, and employing indicators to monitor organizational performance is known as performance measurement. Monitoring is carried out to determine how successful and efficient the organization is in fulfilling the goals that have been established [5]. The results of measuring the efficiency of commercialization acceleration performance can then be used as a reference for other higher education institutions to formulate strategies for accelerating the commercialization of research results. In measuring the performance of the incubation process, it is necessary to measure the Technology Readiness Level (TRL). This TRL measurement is an indicator that shows how ready or mature technology can be applied or adopted by users or potential users. In the framework of the incubation process at BIT-BPPT (Institute of Technology Incubator Agency for the Assessment and Application of Technology), if the product to be incubated is worth more than TRL 7, then it is feasible to follow the incubation process. This explains that there is a role for TRL measurement in the incubation process, so this research uses the TRL measurement framework in compiling a model for measuring the efficiency of the incubation process in universities. The goldsmith commercialization model can integrate technical aspects, market aspects, and business aspects to commercialize into a matrix of sequential, concurrent activities [4]. This research combines the goldsmith model and the TRL measurement framework to serve as indicators in compiling this research questionnaire. The questionnaire will be used as input in compiling a performance-efficiency measurement model.
Several research models for measuring performance efficiency have been established. Researchers frequently employ Data Envelopment Analysis (DEA) to assess the level of performance efficiency. DEA is used to measure the efficiency of the decision of an activity unit in charge of converting several inputs into outputs. This method works by determining the efficient decision-making unit (DMU) based on input and output criteria and then calculating the relative efficiency of each DMU to the efficient DMU. Several previous studies have developed a DEA model for measuring performance efficiency. A DEA model assuming Variable Return to Scale (VRS) in the study was carried out [6]. The Robust Data Envelopment Analysis (RDEA) approach was used in research on a case study of technical efficiency from Indonesian high schools [7]. The application of the DEA model oriented to the output of CCR and BCC with the object of research in the food industry in Croatia [8]. It is different again in research [9] using a super slack-based DEA for the largest freight train research object in Russia. It can be seen that the application of the DEA model is quite widely used to measure the efficiency of performance in an environment or company. Thus, the DEA method is used in research to measure the efficiency of the incubation process in universities.
Based on previous research exploring the effect of organizational identification (OID) on organizational innovativeness (OINN) in universities, the findings show that the OID has a positive impact on the ORTC and OINN [10]. According to [11], developing a work-integrated learning (WIL) model for university–society research collaboration can facilitate societal impact toward short lag yet sustainable societal impact for local innovation. According to [12], the capability to create and manage innovations is recognized as an important skill not only for entrepreneurial activities but also for the survival of organizations. According to [13], organizational strategists are considered critical in determining the success or failure of organizations. Recent research using the DEA method discusses Fuzzy DEA in the Tehran Stock Market [14] and Fuzzy Stochastic in the Presence of Undesirable Outputs [15]. In addition, there is also a MOLP and DEA study based on the output-oriented CCR dual model [16] and also a DEA cross-efficiency evaluation in a study [17]. From the explanation of this previous research, it is explained that, until 2020, the theme related to innovation continues to develop and is interesting to study from the side of industry, universities, or the government.
In this study, the BCC model was chosen due to the assumption that an increase in the input value will result in an increase in the output value disproportionately or will vary. This means that an increase in input of x times does not necessarily result in an increase in output of x times as well, but can be smaller or larger. This assumption is called Variable Return to Scale (VRS). The orientation used in this study refers to the output orientation, because the purpose of this study is to maximize the output of TTO performance by using existing inputs. The limitation of this method is that statistically hypothesis testing for DEA is difficult to do, and it uses a separate linear programming formulation for each DMU (and manual calculations are difficult, especially for large-scale problems).
The measurement framework can contribute to accelerating the commercialization of research results in universities. To accelerate the commercialization of research results in universities, assessment indicators are needed. This assessment indicator is divided into two, namely, accelerating time to market and reducing investment costs [18]. These two indicators are the final goal that will be seen to find out that efforts to accelerate the commercialization of research results in universities have been carried out.
The objectives to be achieved in this research are to (1) design a model for measuring the efficiency of TTO performance in accelerating the commercialization of research results; (2) measure the efficiency level of higher education TTO performance in accelerating the commercialization of research results; and (3) provide recommendations for efficient performance strategies in accelerating the commercialization of research results. The hypotheses of this research can be formulated as follows: (1) the performance-efficiency measurement model in the incubation process can be approached with a questionnaire compiled from goldsmith and TRL to accelerate the commercialization of research results in universities; (2) the mathematical model of Data Envelopment Analysis (DEA) can be used to quantify measuring tools in accelerating the commercialization of research results in universities; and (3) the application of the DEA model can be used as a basis for decision-making to accelerate the commercialization of research results in universities. Table 1 describes the state of the art of this research.

Table 1.
State-of-the-art research.
2. Methods
2.1. Operationalization Variables
The TTO performance efficiency measurement model was built based on the questionnaire and the incubation process framework at BIT-BPPT. The operationalization of variables in this study is divided into input and output variables as attributes in defining the questionnaire. After the variables operationalization of the research formed as shown in Table 2, a research questionnaire was compiled, which was then tested for questionnaires. The performance efficiency measurement framework is shown in Figure 1.
Table 2.
Operationalization of input variables and identification of indicators.
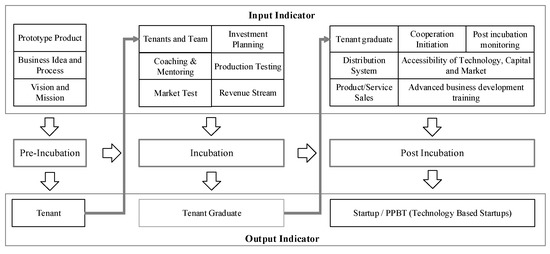
Figure 1.
Performance efficiency measurement framework.
2.2. Questionnaire Testing
- a.
- Validity Test
The validity test referred to in this study is a process carried out to ensure that the statement items in the research instrument can measure the object of research correctly. The research instrument is valid if the measuring instrument used to obtain data is following what is intended to be measured. Valid research results mean there are similarities between the data collected and the data that occur in the research object. Validity testing is completed by calculating the correlation between the numbers of each statement item on the variable in question. A factor test or critical R is used to test the validity [28]. The instrument validity test can use the correlation formula based on the Pearson Product Moment; r ≥ 0.30 means the question items are valid, while, if r ≤ 0.30, then the question items from the questionnaire are invalid.
- b.
- Reliability Test
The research instrument said to be reliable is an instrument that, when used several times to measure the same object, will produce the same data. Reliable research results are research data that have similarities from several research activities carried out at different times [29]. In this study, the reliability test was carried out using Cronbach’s Alpha formula. With the criterion of Cronbach’s Alpha value, if Cronbach’s Alpha value is less than 0.6, the instrument reliability is bad; if it is more than 0.6, the instrument reliability is good.
2.3. Decision Making Unit Selection
The selected DMU is a unit whose performance efficiency is measured. By taking into account the similarity of character and the treatment of DMU, it is determined that DMU in this study is an entity related to the incubation process of a university. The selected universities are universities that already have a good reputation and have commercialized research results for more than 10 years, namely, at the Bandung Institute of Technology (ITB) TTO. The institution that functions as a TTO at ITB is the Institute for Innovation and Entrepreneurship Development ITB (LPIK-ITB). LPIK ITB has successfully incubated 175 tenants and produced 29 Spin-Offs (data as of June 2021). In this research, three DMUs were used that were seen in the past 5 years, between 2016 and 2020 for each DMU, and described in Table 3.
Table 3.
Decision-making units (DMUs) in this study.
The respondents’ criteria in this study represent each stage of the commercialization process described in the Death Valley scheme. Then, each stage of the incubation process has an indicator of success described in Table 4. Thus, in the performance-efficiency benchmark process, tenants/business organizations could be categorized as successful, having the potential to succeed, being in the developing stage, or having failed.
Table 4.
Table of indicators of the success of the incubation process.
2.4. DEA Model Selection
The commercialization of research results in the incubation process in universities has a variable return to scale. This means that the addition of inputs in commercialization activities will cause a disproportionate increase in output. For example, if the performance at the incubation stage is carried out well until the incubation period is complete, it will not necessarily produce more tenant graduates. Thus, in this study, the relationship between input and output variables is still unknown or is in what is called a black box state. Therefore, the DEA model chosen in this study is the BCC model, where this model holds the assumption of a return to scale (VRS) variable [30,31].
The DEA model’s orientation was chosen with the DMU’s ability to regulate the input and output variables of research commercialization operations in mind. DMU has greater control over the output of research outcomes when they are commercialized. As a result, this study employs an output orientation (maximize input), in which efficiency is defined as increasing the number of outputs while maintaining the same number of inputs. These three stages use the same DEA model, namely, the output-oriented BCC model. The equation in the dual form of the primal equation for maximizing the output is shown by Equation (1) [30,31,32,33].
subject to:
Meanwhile, the dual equation from the primal model to minimize input is shown in Formula (2)
subject to:
where:
- n: DMU, n = 1, 2, …, N;
- i: Input, i = 1, 2, …, I;
- j: Output, j = 1, 2, …, J;
- yjn: output value to-j from DMU to-n;
- xin: output value to-i from DMU to-n;
- vjm: input value to-j from DMU to-n;
- yjn: input value to-i from DMU to-n;
- ε: small positive number.
The constraint equation (subject to) number in the dual equation is dependent on the variable number. The variable in the dual equation is a constraint equation (equality constraint) that results from the normalization of the total weight from the input, whereas the variable is a dual variable that is an inequality constraint from the primal. The formula depicts the dual equation from the primal to maximize output (1).
2.5. DEA with Likert Scale Data
The fundamental DEA model presupposes that all input and output variables can be freely moved/changed. In the case of a new product launch performance evaluation, as mentioned below, all input and output variables contained survey data on a Likert scale of 1–5. As a result, the recommended value of improvements for input and output variables cannot exceed the range of values 1–5. If we wished to analyze the questionnaire’s performance/efficiency data-limited scale, we should have modified the standard model of DEA above into an exclusive model with some deviations in character from the general model. The mathematical formulae incorporate the additional constraints of Formulae (1 and 2), which limit the scale value that a DMU can obtain. As a result, the mobility of input and output will be limited since mathematical processing will be constrained from the smallest value of a given number to the greatest feasible value.
A questionnaire was utilized to collect the data for this investigation. Respondents were asked to evaluate the research findings in the context of the commercialization strategy in which they worked. For the input variable (xij) and output variable (yrj) of each DMU, the maximum scale value of the questionnaire, which was five, was taken as the upper limit, and the minimum one, which was one, was used as the lower limit. The DMU in this study was the university units in charge of implementing the commercialization of research outcomes, which are currently referred to as technology transfer offices (TTO) at universities.
3. Results
3.1. Designing the TTO Performance Efficiency Measurement Model in the Incubation Process
The function of the TTO in higher education is as a business incubator for research/innovation results. The incubator is one alternative to accelerate the commercialization of technology: a program carried out to assist entrepreneurs/industry in starting a business so that the business can grow rapidly. An incubator is an assistance program that is designed to assist, foster, and guide a new company/industry and has a target for startups so that the company can grow rapidly [34]. Thus, in this case, the core of the commercialization acceleration process is in the business-incubation process. This study examines the business-incubation process to assess the efficiency level of TTO performance to accelerate the commercialization of technology in universities. The model for measuring the efficiency of TTO performance in the incubation process was developed from the questionnaire and the incubation process performance framework at BIT-BPPT. Figure 2 describes the TTO performance efficiency measurement model in the incubation process.
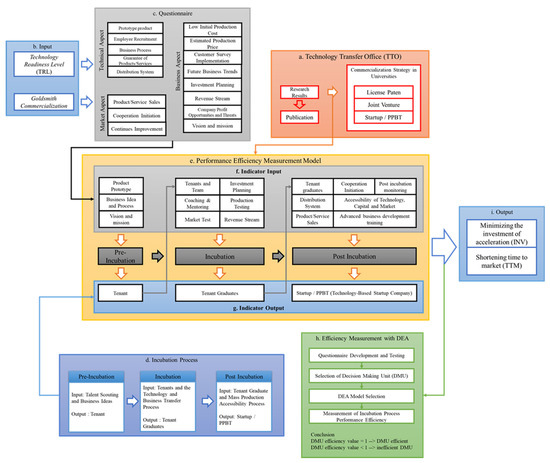
Figure 2.
Performance efficiency measurement model.
- (a)
- Technology Transfer Office (TTO): The role of the technology transfer service unit/TTO in the technology transfer process is very decisive. TTO has a function as a bridge for innovation/research results to be commercialized. However, in addition to commercializing the research results, it can also be published, where the publication results can also be commercialized by registering copyright based on new findings or methods.
- (b)
- Input: The input, in this case, is a framework or measurement framework to assess whether a research/innovation result is feasible or not to be commercialized. Generally, what is used as feasibility in the commercialization process is the measurement of TRL (Technology Readiness Level). However, this model is integrated with the goldsmith commercialization model to create a new framework.
- (c)
- Questionnaire: The questionnaire was built based on inputs, namely, the TRL measurement framework and the goldsmith commercialization model. The limitations studied include the product launch process and product success as a business. This questionnaire consists of three inputs, namely, technical aspects, market aspects, and business aspects.
- (d)
- Incubation process: The incubation process generally consists of three stages of the process, namely, the pre-incubation process, the incubation process, and the post-incubation process. The three stages of this process have their respective inputs and outputs. The input, in this case, is the activity or entity needed to carry out the process. In contrast, the output, in this case, is the result that is expected to be achieved.
- (e)
- Performance efficiency measurement model: The TTO performance efficiency measurement model consists of three interconnected stages. These three stages look at the main processes carried out to accelerate the commercialization of technology. In this case, the main process carried out by a TTO is the incubation process. A technology transfer office (TTO) can also be referred to as a business incubator in a university. However, the technology transfer process is not limited to the business incubation process, but the incubation process becomes an important part and becomes the main thing so that research/innovation results are commercialized.
- (f)
- Input indicator: The input indicators in the efficiency measurement model are compiled based on a questionnaire that has been built. The indicators in the questionnaire were remapped to the input indicators. The input indicators are divided into three stages of the process, namely, the pre-incubation process, the incubation process, and the post-incubation process. The Input Indicators, which consist of 16 indicators, are the results of the performance evaluation indicators of the Technology Transfer Office (TTO), which have been validated by FGDs by experts.
- (g)
- Output indicator: The output indicator of the efficiency measurement model is built based on the general incubation process framework. From this framework, it is found that the output in the pre-incubation process is the tenant; in the incubation process, it is the tenant graduate; and in the post-incubation process, it is the formation of the startup/PPBT.
- (h)
- Efficiency measurement with DEA: After the formation of a performance efficiency measurement model, the next step is the application of this measurement model using the DEA method to figure out whether a product’s relative efficiency value is a DMU under study. The efficiency measurement process is divided into four stages, namely, the development and testing of questionnaires, the determination of the DMU, the selection of the DEA model, and the measurement of performance efficiency using the DEA method. The conclusion of this measurement process is divided into two, namely, if the efficiency value if <1, then it is inefficient, and if the efficiency value is 1, then the DMU is considered efficient.
- (i)
- Output: This efficiency measurement model leads to the ultimate goal of minimizing time to market and investment costs.
3.2. Application of the TTO Performance Efficiency Measurement Model in the Incubation Process
Respondents in this study were respondents who gave perceptions of performance efficiency assessments to accelerate commercialization. When viewed from age and title, most respondents are still in the productive age group, 30–49 years, with the majority of master’s degrees being able to plan, manage, and carry out TTO performance functions well. Respondents who answered the questionnaire must represent institutions, not individuals, so that the answers were not personal opinions but rather opinions of organizations. The data that were collected were processed using maxDEA 8 to determine the relative efficiency value of each DMU. Previously, the data were first processed into Microsoft Excel to obtain the average of each input variable and output variable. Table 5 is the result of the recapitulation of the average value of each indicator of the input and output variables obtained from the data collection results, with a questionnaire in the form of a Likert scale.
Table 5.
Input and output variable data recapitulation.
Table 5 shows that the output at each stage of the incubation process is different. In 2017, it was seen that, in the pre-incubation process, the output was worth 1, at the incubation stage, it was worth 5, and the post-incubation stage was worth 2. This explains that from one stage to the next in the incubation process, it is not necessarily becoming bigger/better. It depends on the program and process (input) that is run and how to maximize the existing input so that the maximum output is obtained.
Data processing in this study used max DEA 8 software to see the relative efficiency. Data processing was carried out in three stages, which are pre-incubation, incubation, and post-incubation, respectively. Before data processing, a mathematical model with the output-oriented BCC model was formulated. The equation was formulated using Equation (1) and the data in Table 5.
- (a)
- Pre-incubation program
Table 6 displays the findings of the computation of DMU X’s (pre-incubation organization) relative efficiency in expediting the commercialization of university research outcomes over the last 5 years (2016–2020). The score column displays the relative efficiency of DMUs, whereas the Benchmark column (lambda) displays the efficient DMUs that inefficient DMUs utilize as benchmarks, as well as their intensity.
Table 6.
Table of efficiency score calculation results on DMU at the pre-incubation stage (X).
- (b)
- Incubation program
Table 7 shows the results of calculating the relative efficiency of DMU Y (Incubation Organization) in the time series for the past 5 years (2016–2020) in accelerating the commercialization of university research results. The Score column shows the relative efficiency of DMUs, and the Benchmark column (lambda) shows the efficient DMUs used as benchmarks by inefficient DMUs and their intensity.
Table 7.
Table of efficiency score calculation results on DMU Y.
- (c)
- Post-Incubation Program
Table 8 shows the results of calculating the relative efficiency of DMU Z (Post-Incubation Organization) in the time series for the past 5 years (2016–2020) in accelerating the commercialization of higher education research results. The Score column shows the relative efficiency of DMUs, and the Benchmark column (lambda) shows the efficient DMUs used as benchmarks by inefficient DMUs and their intensity.
Table 8.
Table of efficiency score calculation results on DMU Z.
4. Discussion
4.1. Efficiency Value Analysis of the Entire DMU
Data processing using the max DEA program yields an efficiency value that represents DMU’s relative efficiency. Because this value is relative, the efficiency score may change if a DMU is changed. The efficiency score is a number between 0 and 1. A DMU with an efficiency score of 1 is considered to be efficient. This indicates that no other DMU with the same number of outputs can employ inputs with fewer inputs than the DMU with the same number of outputs. A DMU that is efficient is one that can optimize output performance. The efficient DMU table is described in Table 9. With a (V) mark, the description column explains which DMU has been efficient.
Table 9.
Efficient DMU table.
Measurement of the efficiency of TTO performance in the incubation process of LPIK ITB is shown in Figure 3. Measurements were carried out on 3 DMUs represented on the letters X, Y, and Z. By measuring the past 5 years (2016–2020), it can be seen in the figure that in 2016 and 2017, each DMU achieved an efficiency value, which shows that, in that year, it was efficient by minimizing input and maximizing output.
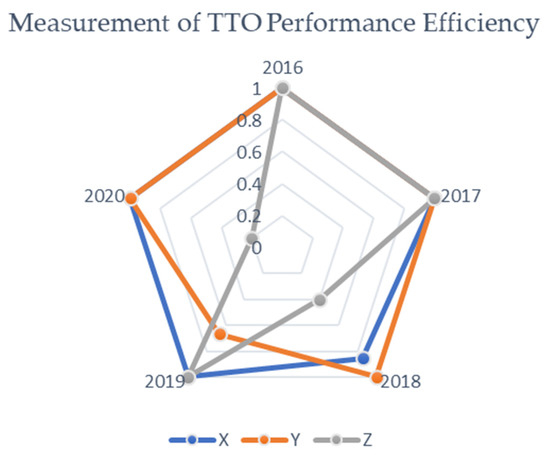
Figure 3.
Results of measuring efficiency of TTO performance.
4.2. Efficiency Value Analysis between Variables
The analysis of efficiency values between variables aims to see the efficiency values reviewed for each DMU, as shown in Figure 4, Figure 5 and Figure 6. Figure 4 describes the analysis of the performance efficiency value of DMU X (pre-incubation organization) in the last 5 years, namely, 2016 to 2020. Based on the figure, the pre-incubation organization at LPIK ITB achieved performance efficiency levels in 2019 and 2020. Based on the data obtained, 2019 and 2020 is the peak period for LPIK ITB to produce a finding/innovation during the period under study.
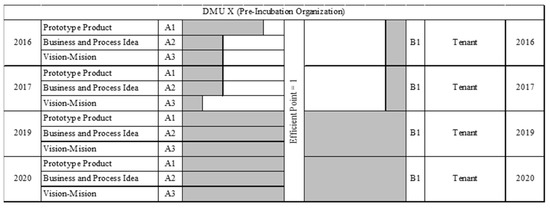
Figure 4.
Analysis of DMU X efficiency value.
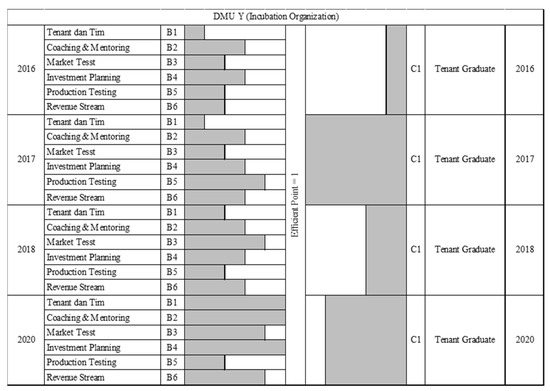
Figure 5.
Analysis of DMU Y efficiency value.
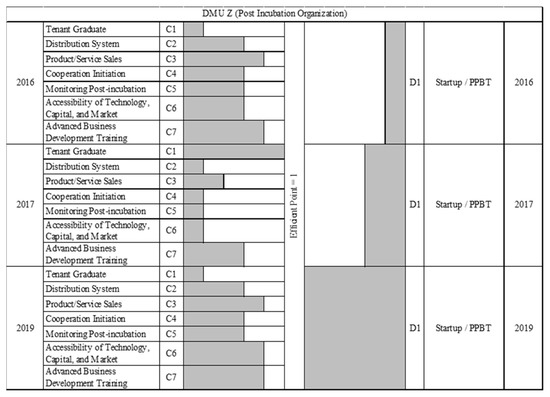
Figure 6.
Analysis of DMU Z efficiency value.
Figure 5 describes the analysis of the efficiency value of the performance of DMU Y (Incubation Organization) in the last 5 years, from 2016 to 2020. It can be seen that, in the last five years, the performance of the incubation organization at LPIK ITB has not maximized the existing inputs, so the output produced has not yet been realized efficiently. However, in 2017, it was seen that the output produced was efficient by producing 64 innovations that were ready to be commercialized. Then, 2020 was also approaching efficiency by producing 46 innovations that were ready to be commercialized in the post-incubation stage.
Figure 6 below describes the analysis of the performance efficiency value of DMU Z (Post-incubation Organization) in the last 5 years, 2016 to 2020. It can be seen that, in 2019, the output produced was efficient. Based on the data obtained, in that year, 32 startups were produced. This startup has various business fields that refer to the four main priorities of research innovation at LPIK ITB. From this analysis, it was found that there are three main priorities in the post-incubation process to accelerate tenant graduates who produce a startup, namely, product/service sales, technology accessibility, capital and market, and further business.
4.3. Model Applicability Analysis
The analysis of the model’s applicability is an analysis to determine whether the efficiency measurement model of the commercialization of higher education research results can be applied to a real system or not. Based on data processing carried out in measuring the efficiency of TTO commercialization performance at ITB, the model was developed by the characterization of the case study used. The model also tested for reliability and validity, and the results obtained show that the developed model is valid and reliable. The developed model has also revealed in more detail the influence of process inputs and outputs. The results obtained are the relative efficiency values of each incubation process in TTO and their detailed descriptions. The developed model has also been able to integrate the concept approach to the performance of technology commercialization by simultaneously considering multiple inputs and one output in a single unit based on the DMU so that the model can be used as an alternative for selecting commercialization performance policies and predicting how to accelerate commercialization in universities. Whereas the DEA model for measuring the efficiency of TTO performance in the incubation process has been successfully formed, this measurement framework can be used to evaluate the performance of a TTO to accelerate the commercialization of research results in universities.
4.4. Proposed TTO Performance Strategy Recommendations in Accelerating Commercialization Technology in Universities
The proposed TTO performance strategy recommendations in accelerating the commercialization of higher education research results are analyzed based on the stages of the incubation process. At the pre-incubation process stage, in accelerating prospective tenants to become tenants, the focus is on two main priorities, namely, product-prototyping programs and business ideas and processes. These two things become important in the incubation process stage to produce a tenant and produce mature business ideas, and the resulting product has a TRL of ≥7.
Then, in the incubation stage, accelerating tenant graduates and being ready to build a business and products/services that have been accepted in the market are paramount and accomplished by focusing on three main priorities, namely, the tenant and team formation program, coaching and mentoring program, and investment design. These three features are important to accelerate the commercialization of research results to achieve minimal time to market and minimum investment costs.
The next stage is the post-incubation stage. The post-incubation stage in accelerating tenant graduates to establish a startup/Technology-Based Startup Company (PPBT) focuses on three main priorities, namely, product/service sales, technology accessibility, capital and market, and further business development training. The final output of a post-incubation process is mass production readiness and business acceleration. The readiness for mass production is related to the readiness of funding (investment costs) and business acceleration related to the time to market. In the end, this incubation process is a process to accelerate the commercialization of research results by accelerating time to market and minimizing investment costs.
This research is a continuation of research conducted by [35], where the results obtained are recommendations for the commercialization strategy of higher education research results. The development of this research is added to the final goal of accelerating the commercialization of research results measured in the incubation process. This explains that there is a deepening of problem solutions to achieve a more specific final goal. There are no previous studies that have specifically discussed the development of this measuring instrument model. Additionally, in general, this measuring tool can be used to measure the efficiency level of TTO performance at other universities with prior adjustments. Then, the proposed TTO performance strategy recommendations can also be used by other universities to accelerate the commercialization of research results to achieve profitable business organizations. This research has a sufficient level of novelty and can be an initial finding for studies of accelerating the commercialization of research results in universities in the future. The novelty of the research is in the form of a measuring tool to determine the efficiency level of TTO performance to accelerate the commercialization of research results in universities.
The following are the recommendations for the TTO performance strategy in the form of supporting programs to accelerate the commercialization of research results in universities, which are seen from accelerating time to market (time to market) and reducing investment costs, described in Figure 7 below in the framework of the valley of death. This framework explains that the core and supporting programs in the incubation process in universities are important to assess the level of efficiency.
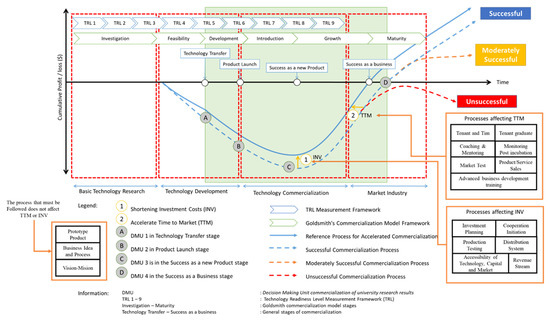
Figure 7.
Picture of the death valley skeleton of the incubation process.
To accelerate time to market, seven programs are most influential, namely, tenants and teams, coaching, and mentoring, market testing, tenant graduates, post-incubation monitoring, product/service sales, and further business development training. The seven programs/processes can be divided into three groups, namely, human, mentoring, and business groups. The human groups in question are tenants and teams, as well as graduate tenants. This group focuses on forming a solid team to succeed in the business incubation process that is being carried out. The second group is assistance, which is described in the post-incubation monitoring program, coaching, and mentoring as well as in further business development training. These three programs represent the incubation mentoring process because the core of the incubation process is the business mentoring process, so this program becomes important and central to achieving the accelerated commercialization of research results. When this program runs well, the incubation process goes well and it can maximize the existing inputs to achieve maximum output. The third group is the business group, which means market testing and product/service sales. The faster the market testing, the faster the sale of products/services, which means the faster the product is accepted in the market by the public.
To reduce investment costs, six processes affect investment design, production testing, technology accessibility, capital and market, initiation of cooperation, the distribution system, and revenue stream. These six processes can be grouped into two groups, namely, costs and cooperation. In the cost group, there are investment planning, production testing, and revenue streams. These three processes affect the costs needed in this incubation process so that in the process of formulating investment costs, formulating revenue (revenue streams), and testing can be minimized, as well as the total investment costs. Then, the second group is cooperation, where good cooperation can be maximized to external parties. This can also reduce investment costs. The details of these processes can be seen in Figure 7.
This research succeeded in designing a model for measuring the efficiency of higher education research performance using the Data Envelopment Analysis (DEA) method that can be used for policy recommendations and efficient commercialization strategies. The performance efficiency measurement model was developed from the goldsmith commercialization model, TRL measurement, BIT-BPPT Incubation Concept, and other literature studies to obtain input and output variables in determining the success of the commercialization of research results verified at TTO universities that have successfully commercialized innovations/research results. There were 16 (sixteen) performance input variables which were divided into three incubation processes, namely, the pre-incubation process, the incubation process, and the post-incubation process. Additionally, there were three output variables at each incubation stage.
An analysis of the proposed TTO performance strategy recommendations has been carried out in the case study at LPIK ITB, which consists of three recommendations. The first recommendation is that the main priority in accelerating prospective tenants to become tenants is to focus on product prototype programs and ideas and business processes at the pre-incubation stage. These two things become important in the incubation process stage; the output from the pre-incubation stage not only produces a tenant but also produces mature business ideas and products with a TRL above 7. The second recommendation is that the three main priorities in accelerating tenant graduates and building a business and products/services be accepted in the market by focusing on tenants and teams, coaching and mentoring, and investment planning. The third recommendation is that the three main priorities in accelerating tenant graduates to establish a startup/Technology-Based Startup Company (PPBT) are product/service sales, technology accessibility, capital, and market, as well as further business development training.
4.5. Comparative Analysis with Previous Research
The novelty of this research, seen from the literature review/previous research, is that no one has measured the incubation process of a university in an effort to accelerate the commercialization of research results, and no one has used the DEA model (BCC with output oriented) in measuring the efficiency level of the incubation process in universities, as well as generate a death valley framework and look at which processes aim to speed up time to market and which can reduce investment costs.
This model has used techniques such as Data Envelopment Analysis (DEA) to measure and predict commercialization performance, but it has limitations because it is only a benchmarking tool that evaluates relative efficiencies or a black box that provides no modeling information.
5. Conclusions
This research focused on measuring the level of performance efficiency on the results of higher education research using the output-oriented Banker, Charnes, and Cooper (BCC) model with a decision-making unit (DMU) in the form of an organization that has the authority to assess performance efficiency to accelerate commercialization. The number of DMUs measured was 15 (fifteen) at three stages of the incubation process in the last 5 years (2016–2020), carried out in a case study at LPIK ITB. From the analysis, there are 11 (eleven) efficient DMUs and 4 (four) inefficient DMUs. The 11 efficient DMUs can be used to determine policy priorities to accelerate commercialization.
An analysis of the proposed TTO performance strategy recommendations has been carried out in the case study at LPIK ITB, which consists of three recommendations. The final output of this incubation process is mass production readiness and business acceleration. The readiness for mass production is related to the readiness of funding (investment costs) and business acceleration related to the time to market (time to market). Thus, in the end, this incubation process is a process to accelerate the commercialization of research results by accelerating time to market and reducing/minimizing investment costs.
The DEA model only measures the relative efficiency of the DMU and is not absolute, so statistically testing the hypothesis is difficult. A suggestion for further research is to use other efficiency measurement methods as a comparison so that it can test hypotheses to reduce measurement errors. The next suggestion is that, in implementing the TTO performance efficiency measurement model at other universities, it is necessary to pay attention to the provisions of the respondents, the use of measuring instruments, and the party taking the measurements so that the measurements are right on target and implemented properly.
Author Contributions
Conceptualization, W.S., N.A.K. and M.H.; methodology, W.S., N.A.K. and M.H.; software, W.S., N.A.K. and M.H.; validation, W.S., N.A.K., M.H. and A.M.; formal analysis, W.S. and N.A.K.; investigation, W.S. and N.A.K.; resources, W.S. and N.A.K.; data curation, W.S. and N.A.K.; writing—original draft preparation, W.S., N.A.K., M.H. and A.M.; writing—review and editing, W.S., N.A.K., M.H. and A.M.; visualization, N.A.K.; supervision, W.S., M.H. and A.M.; project administration, W.S. and N.A.K.; funding acquisition, W.S. All authors have read and agreed to the published version of the manuscript.
Funding
This work is founded by Ministry of Education, Culture, Research, and Technology Republic of Indonesia.
Data Availability Statement
Not applicable.
Acknowledgments
The research is supported by Institution of Research and Community Services, Universitas Sebelas Maret with program “penelitian kolaborasi internasional” (Contract 260/UN27.22/HK.07.00/2021, 18 March 2021).
Conflicts of Interest
The authors declare no conflict of interest.
References
- Astirin, O.P. Downstream of Research Products through Community Service Activities; Sinemas UAD: Yogyakarta, Indonesia, 2018. [Google Scholar]
- Sutopo, W.; Astuti, R.W.; dan Suryandari, R.T. Accelerating a Technology Commercialization; with a Discussion on the Relation between Technology Transfer Efficiency and Open Innovation. J. Open Innov. Technol. Mark. Complex. 2019, 5, 95. [Google Scholar] [CrossRef]
- BIT-BPPT. BIT’s Profile Was Posted on 13 February 2016. Available online: https://bit.bppt.go.id/index.php/organisasi/profil-bit (accessed on 12 July 2021).
- Sutopo, W.; Hisjam, M.; Yuniaristanto Astuti, R.W.; Khoofiyah, N.A. Technology Incubation in Uniersity—To Support Technopreneur Activities, CV; Ilmu Madani Press: Lentera, Indonesia, 2021. [Google Scholar]
- Poister, T.H. Measuring Performance in Public and Non Profit Organizations; Jossey-Bass: San Fransisco, CA, USA, 2003. [Google Scholar]
- Banker, R.D.; Cooper, W.W.; Seiford, L.M.; Zhu, J. Returns to scale in DEA. In Handbook on Data Envelopment Analysis; Springer: Boston, MA, USA, 2011. [Google Scholar]
- Mahmudah, U.; Suhartono, S.; Rohayana, A.D. A Robust Data Envelopment Analysis for Evaluating Technical Efficiency of Indonesian High Schools. J. Pendidik. IPA Indones. 2018, 7, 114–121. [Google Scholar] [CrossRef][Green Version]
- Pervan, M. Efficiency of Large Firms Operating in the Croatian Food Industry: Data Envelopment Analysis. WSEAS Trans. Bus. Econ. 2020, 17, 487–495. [Google Scholar] [CrossRef]
- Maltseva, V.; Na, J.; Kim, G.; Ha, H.-K. Efficiency Analysis of Russian Rail Freight Transportation Companies with Super Slack-Based Measurement Data Envelopment Analysis. J. Int. Logist. Trade 2020, 18, 77–89. [Google Scholar] [CrossRef]
- Khorshid, S.; Mehdiabadi, A. Effect of organizational identification on organizational innovativeness in universities and higher education institutions of Iran, mediated by risk-taking capability. Eur. J. Innov. Manag. 2020, 24, 1430–1458. [Google Scholar] [CrossRef]
- Olsson, A.K.; Bernhard, I.; Arvemo, T.; Snis, U.L. A conceptual model for university-society research collaboration facilitating societal impact for local innovation. Eur. J. Innov. Manag. 2020, 24, 1335–1353. [Google Scholar] [CrossRef]
- Chandra, P.; Tomitsch, M.; Large, M. Innovation education programs: A review of definitions, pedagogy, frameworks and evaluation measures. Eur. J. Innov. Manag. 2020, 24, 1268–1291. [Google Scholar] [CrossRef]
- Rahimnia, F.; Molavi, H. A model for examining the effects of communication on innovation performance: Emphasis on the intermediary role of strategic decision-making speed. Eur. J. Innov. Manag. 2020, 24, 1035–1056. [Google Scholar] [CrossRef]
- Aqidawati, E.F.; Sutopo, W.; Zakaria, R. Model to Measure the Readiness of University Testing Laboratories to Fulfill ISO/IEC 17025 Requirements (A Case Study). J. Open Innov. Technol. Mark. Complex. 2019, 5, 2. [Google Scholar] [CrossRef]
- Sahney, S. Use of multiple methodologies for developing a customer-oriented model of total quality management in higher education. Int. J. Educ. Manag. 2016, 30, 326–353. [Google Scholar] [CrossRef]
- He, J.; Wan, Y.; Feng, L.; Ai, J.; Wang, Y. An integrated data envelopment analysis and emergy-based ecological footprint methodology in evaluating sustainable development, a case study of Jiangsu Province, China. Ecol. Indic. 2016, 70, 23–34. [Google Scholar] [CrossRef]
- Wang, N. Optimization of Agricultural Input Efficiency for Wheat Production n China Applying Data Envelopment Analysis Method. Appl. Ecol. Environ. Res. 2017, 15, 293–305. [Google Scholar] [CrossRef]
- Stawowy, A.; Duda, J. A Study of the Efficiency of Polish Foundries Using Data Envelopment Analysis. Arch. Foundry Eng. 2017, 17, 223–227. [Google Scholar] [CrossRef]
- Sutopo, W. The Roles of Industrial Engineering Education for Promoting Innovations and Technology Commercialization in the Digital Era. IOP Conf. Ser. Mater. Sci. Eng. 2019, 495, 012001. [Google Scholar] [CrossRef]
- Haider, M.A. A Comparative Study of Operational Efficiency of Pakistani and Malaysian Islamic Banks: Data Envelopment Analysis Approach. Asian Econ. Financ. Rev. 2019, 9, 559–580. [Google Scholar] [CrossRef]
- Inel, M.N. An empirical study on measurement of efficiency of digital transformation by using data envelopment analysis. Manag. Sci. Lett. 2019, 9, 549–556. [Google Scholar] [CrossRef]
- Pramono, S.N.W.; Ulkhaq, M.M.; Pujotomo, D.; Ardhini, M.A. Assessing the Efficiency of Small and Medium Industry: An Application of Data Envelopment Analysis. IOP Conf. Ser. Mater. Sci. Eng. 2019, 598, 012043. [Google Scholar] [CrossRef]
- Zeng, Z.; Yang, W.; Zhang, S.; Witlox, F. Analysing Airport Efficiency in East China Using A Three-Stage Data Envelopment Analysis. Transport 2020, 35, 255–272. [Google Scholar] [CrossRef]
- Ahrens, R.D.B.; Lirani, L.D.S.; De Francisco, A.C. Construct Validity and Reliability of the Work Environment Assessment Instrument WE-10. Int. J. Environ. Res. Public Health 2020, 17, 7364. [Google Scholar] [CrossRef]
- Jogiyanto, H. Business Research Methodology: Misguided and Experiences; BPFE: Yogyakarta, Indonesia, 2011. [Google Scholar]
- Banker, R.D.; Charnes, A.; Cooper, W.W. Some Models for Estimating Technical and Scale Inefficiencies in Data Envelopment Analysis. Manag. Sci. 1984, 30, 1078–1092. [Google Scholar] [CrossRef]
- Charnes, A.; Cooper, W.W.; Rhodes, E. Measuring the efficiency of decision making units. Eur. J. Oper. Res. 1978, 2, 429–444. [Google Scholar] [CrossRef]
- Cooper, S.; Hetherington, L. Facilitating academic entrepreneurship: Encouraging technology commercialization through the development of entrepreneurial capability. In Frontiers of Entrepreneurship Research; Babson College Center: Babson College, MA, USA, 2003. [Google Scholar]
- Cooper, W.; Seiford, L.; Tone, K. Data Envelopment Analysis: A Comprehensive Text with Models, Application, Reference and DEA Solver Sofware, 2nd ed.; Springer Science & Business Media, LLC.: New York, NY, USA, 2007. [Google Scholar]
- Nasution, R.; Djuanda, D.; Rachmah, R. Literature Study on the Commercialization of Technology in Higher Education: Process, Potential, Models, and Actors. J. Manajemen Teknologi 2009, 8, 1–15. [Google Scholar]
- Astuti, R.W.; Yuniaristanto Sutopo, W.; Purwanto, A.; Nizam, M. Timing model to launch spin-off company: The case study of mini manufacturing plant of 10kWH Li-ion batteries. Lect. Notes in Eng. Comput. Sci. 2019, 2210, 113110. [Google Scholar]
- Peykani, P.; Namakshenas, M.; Arabjazi, N.; Shirazi, F.; Kavand, N. Optimistic and Pessimistic Fuzzy Data Envelopment Analysis: Empirical Evidence from Tehran Stock Market. Fuzzy Optimization and Modeling 2021, 2, 12–21. [Google Scholar] [CrossRef]
- Gholami, O. A Novel Approach for Solving Fuzzy Stochastic Data Envelopment Analysis Model in the Presence of Undesirable Outputs. Fuzzy Optim. Modeling 2021, 3, 22–36. [Google Scholar] [CrossRef]
- Lotfi, F.H.; Jahanshahloo, G.; Soltanifar, M.; Ebrahimnejad, A.; Mansourzadeh, S. Relationship between MOLP and DEA based on output-orientated CCR dual model. Expert Syst. Appl. 2010, 37, 4331–4336. [Google Scholar] [CrossRef]
- Maddahi, R.; Jahanshahloo, G.R.; Lotfi, F.H.; Ebrahimnejad, A. Optimising proportional weights as a secondary goal in DEA cross-efficiency evaluation. Int. J. Oper. Res. 2014, 19, 234. [Google Scholar] [CrossRef]


Publisher’s Note: MDPI stays neutral with regard to jurisdictional claims in published maps and institutional affiliations. |
© 2022 by the authors. Licensee MDPI, Basel, Switzerland. This article is an open access article distributed under the terms and conditions of the Creative Commons Attribution (CC BY) license (https://creativecommons.org/licenses/by/4.0/).