
Modular Open-Core System for Collection and Near Real-Time Processing of High-Resolution Data from Wearable Sensors


 , , , ,
Abstract
:1. Introduction
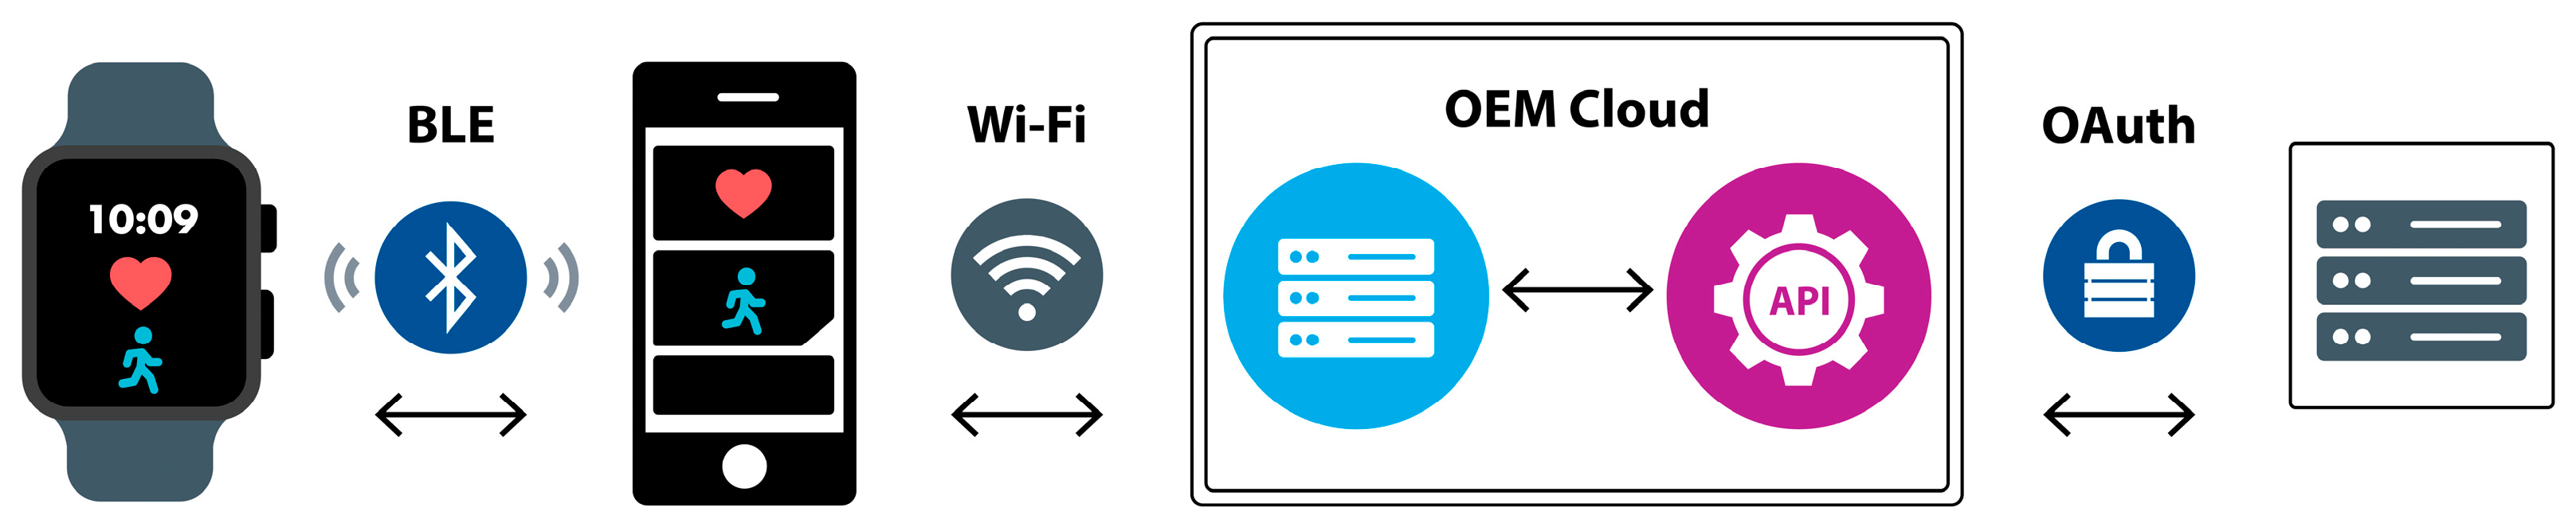
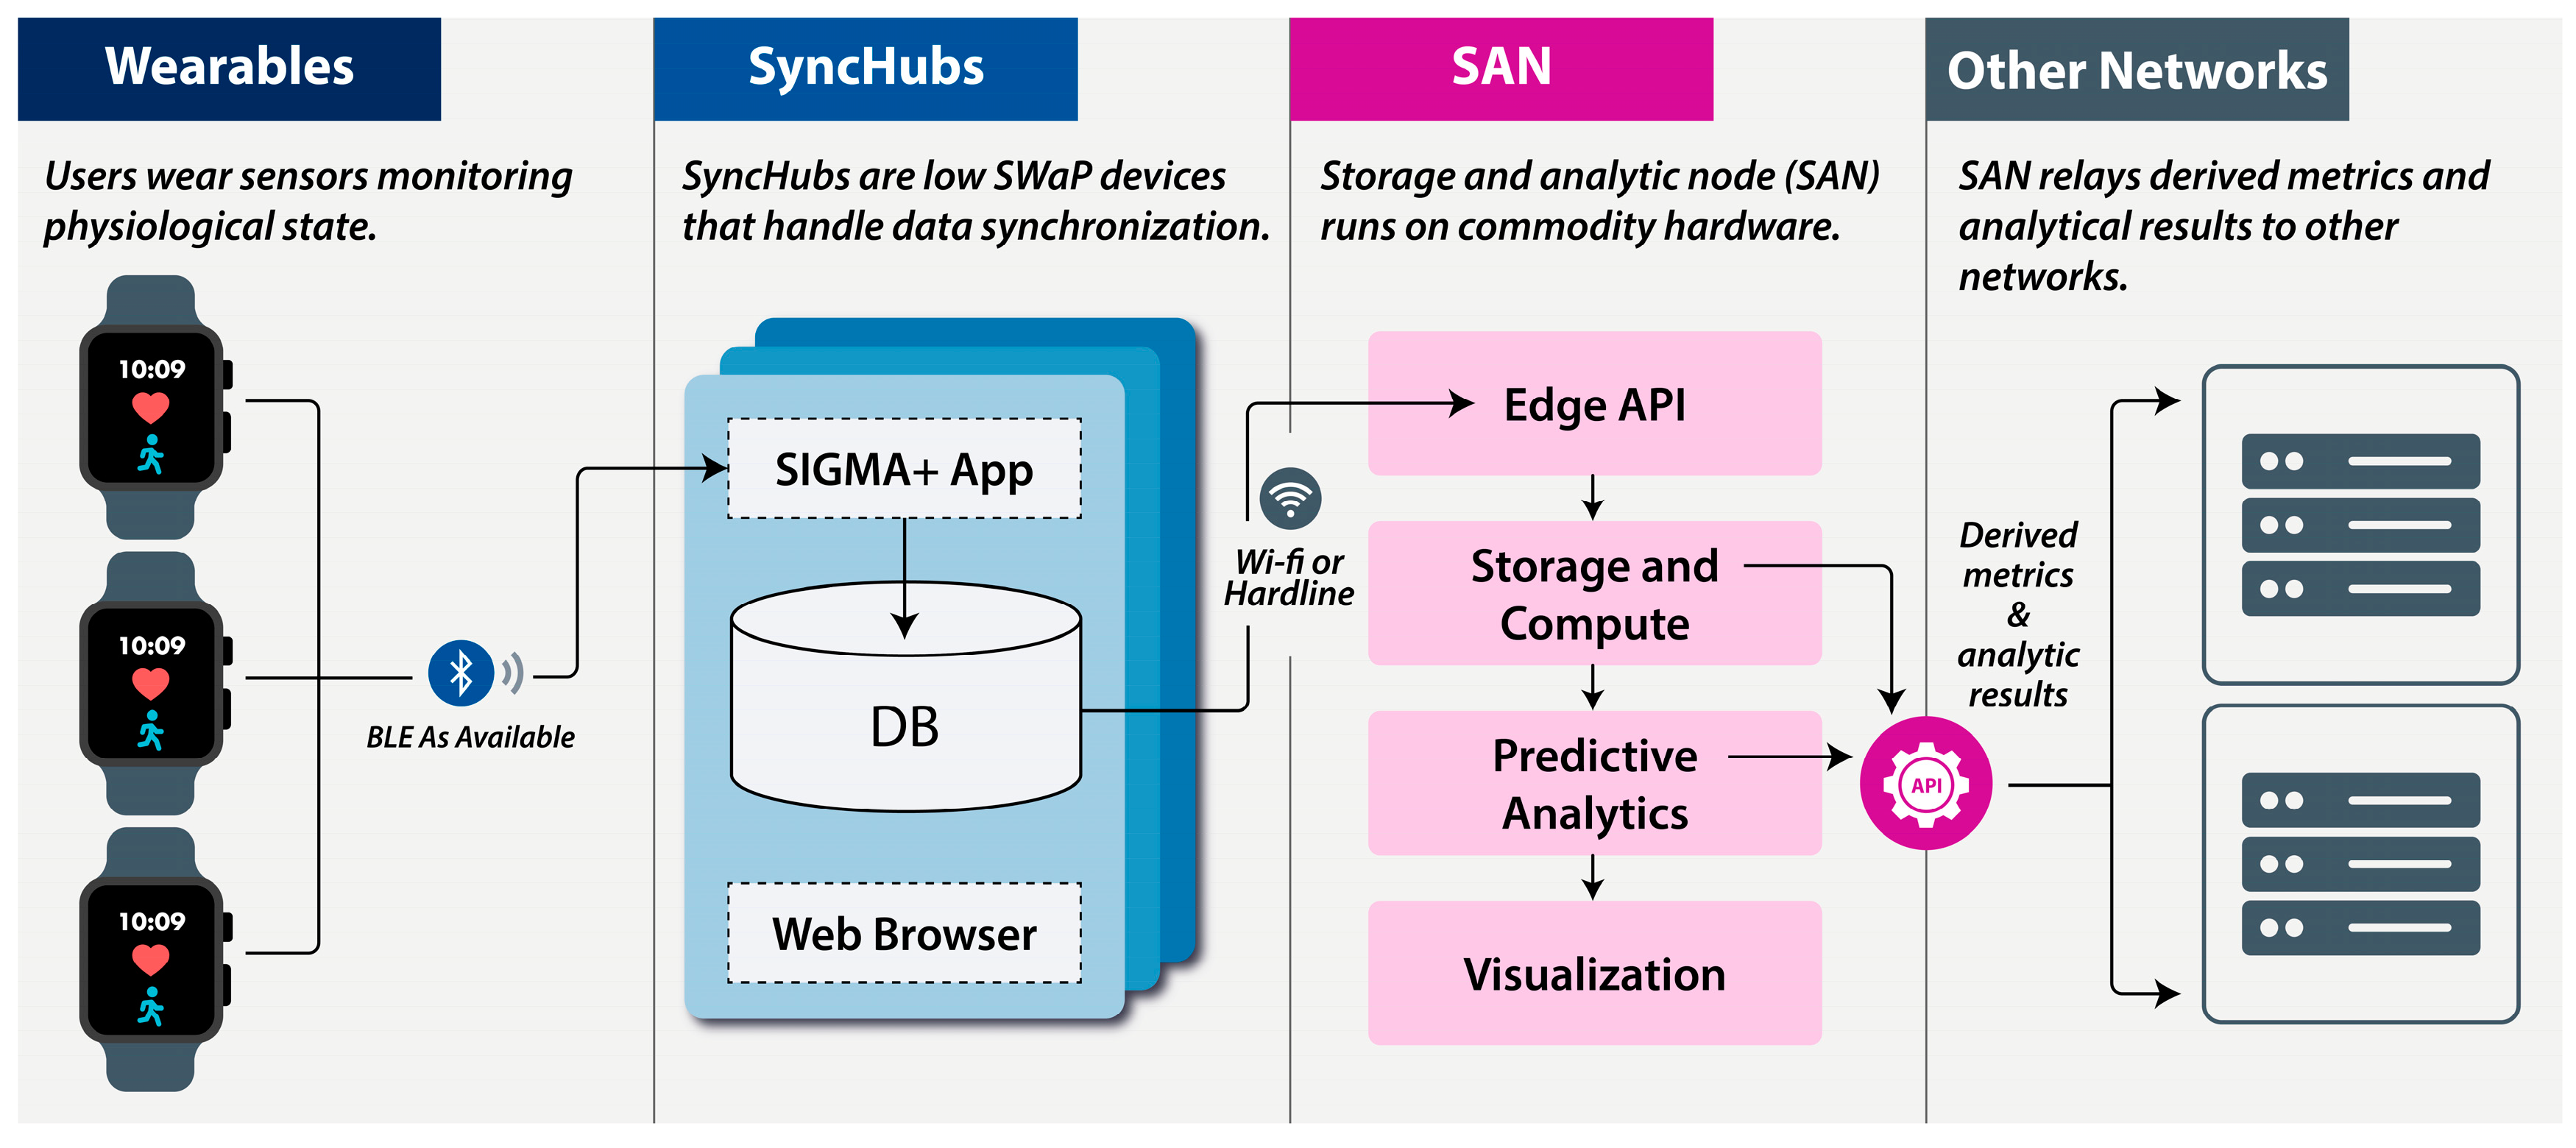
2. System Architecture
2.1. Wearables
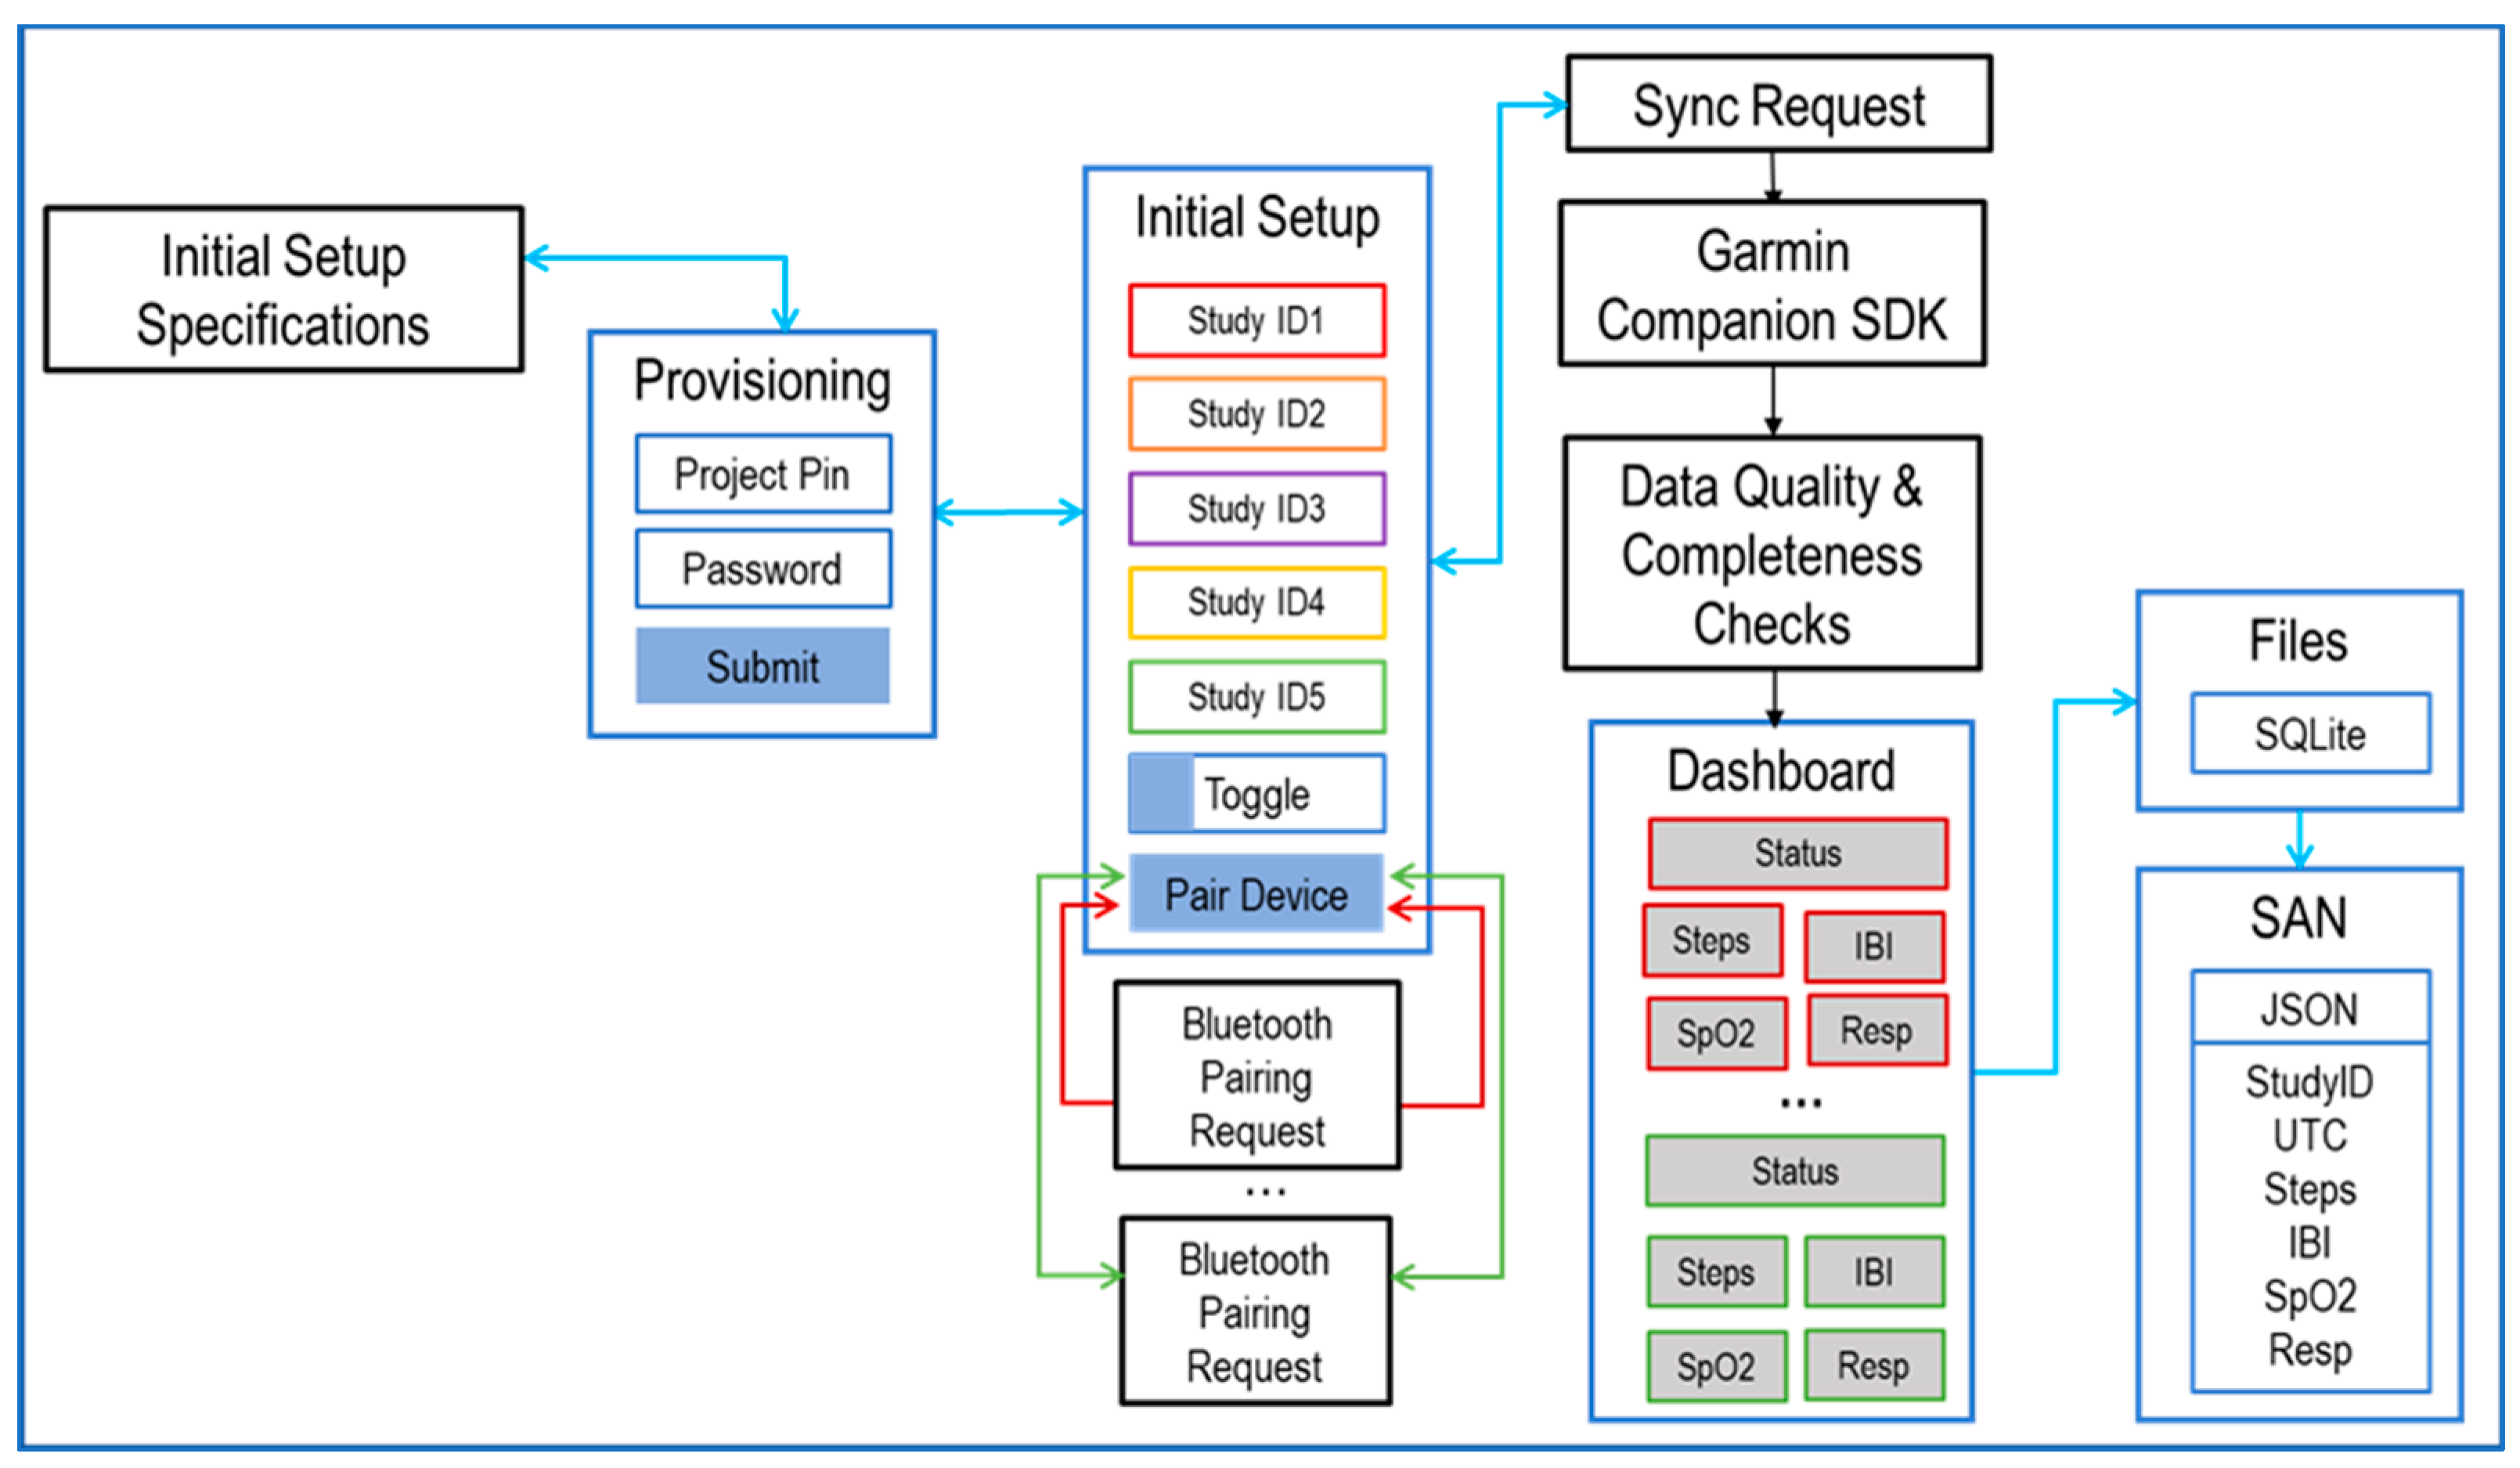
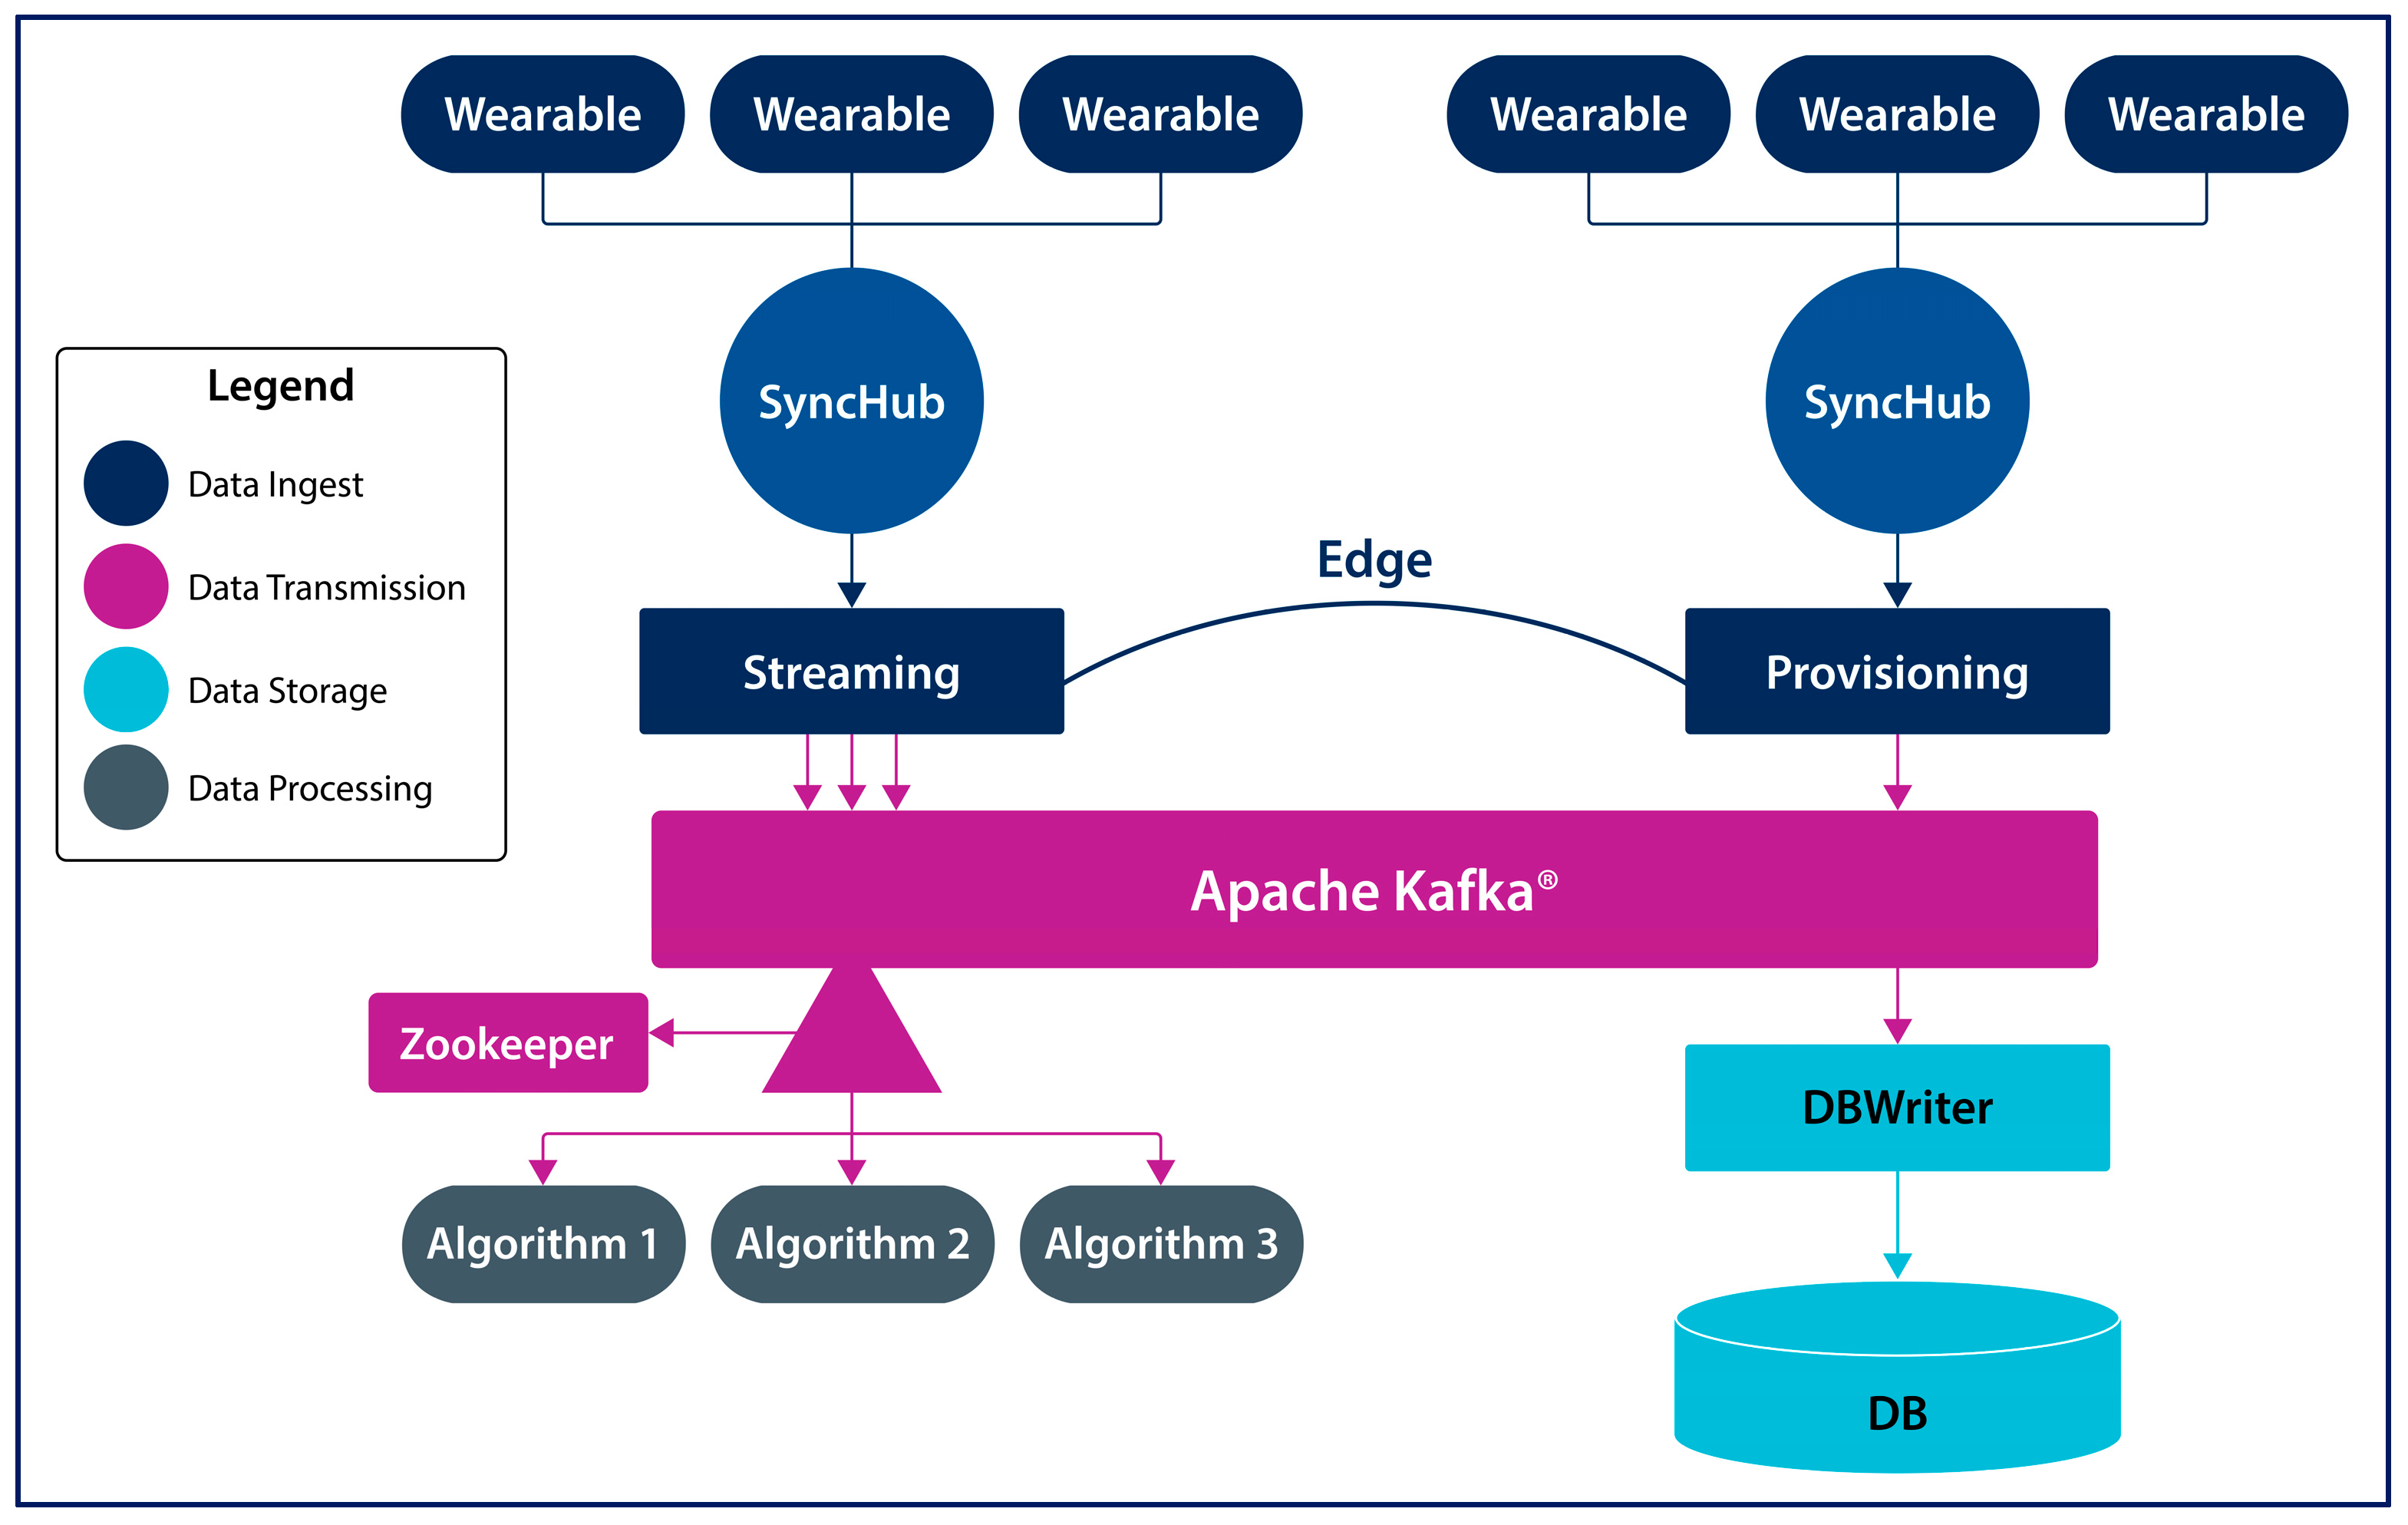
2.2. SyncHubs
2.3. Storage and Analytics Node
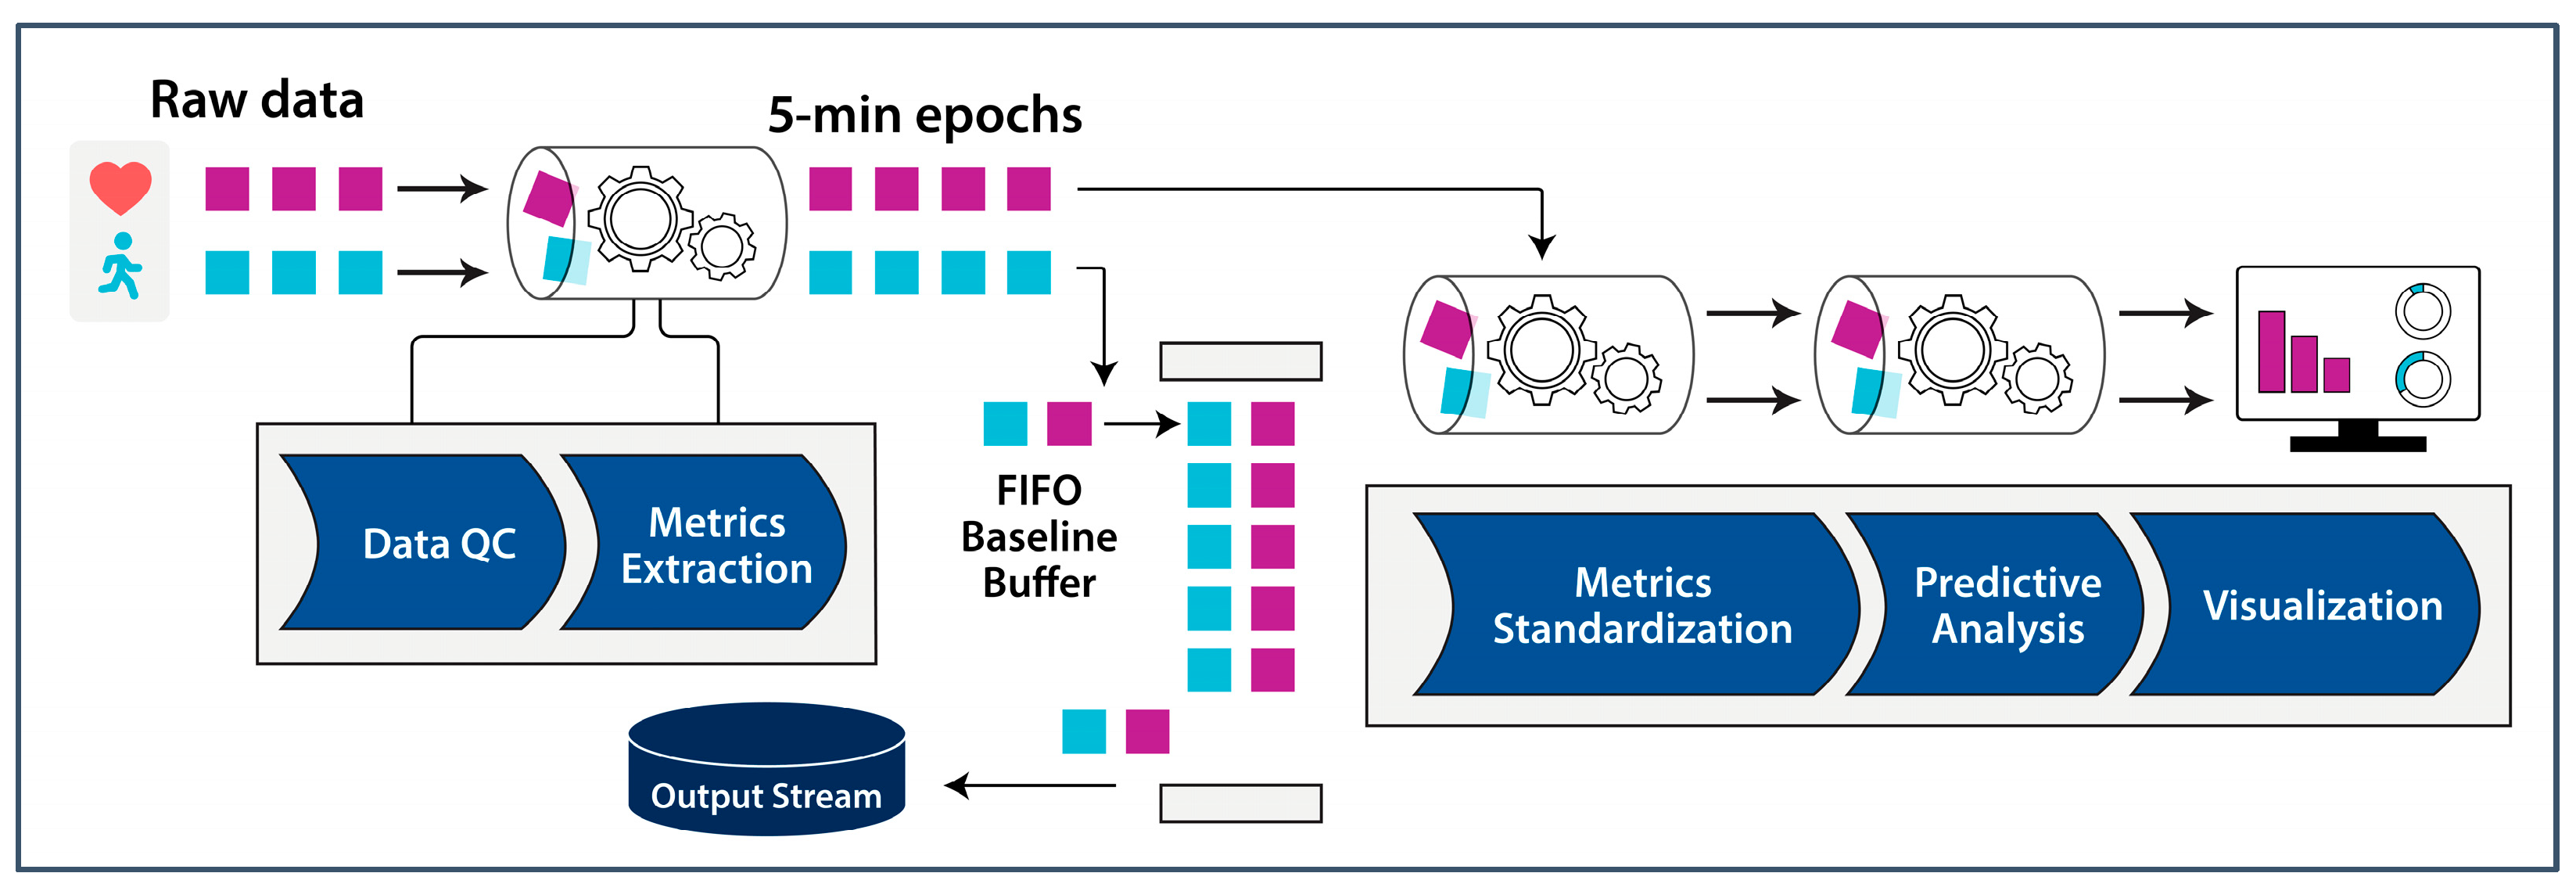
3. Data-Processing Methodology
3.1. Data Quality Control
- Raw data fraction, RDF (%), is calculated as the ratio of the number of datapoints collected to the maximum number of datapoints possible in the monitoring period;
- Artifact data fraction, ADF (%), is calculated as the ratio of the number of the artifacts removed by the QC checks from the data stream to the total number of datapoints collected in the monitoring period.
3.2. Metrics Extraction
3.3. Metrics Standardization
- Data with step counts exceeding an UPPER_STEP threshold are considered equivalent;
- Data with step counts below a LOWER_STEP threshold are considered equivalent;
- Data with step counts between the LOWER_STEP and UPPER_STEP thresholds are matched based on step counts within 30% of the current value. Lower limits on the minimum step match (e.g., ±10 steps) and lower bound (e.g., greater than 0 steps) are applied.
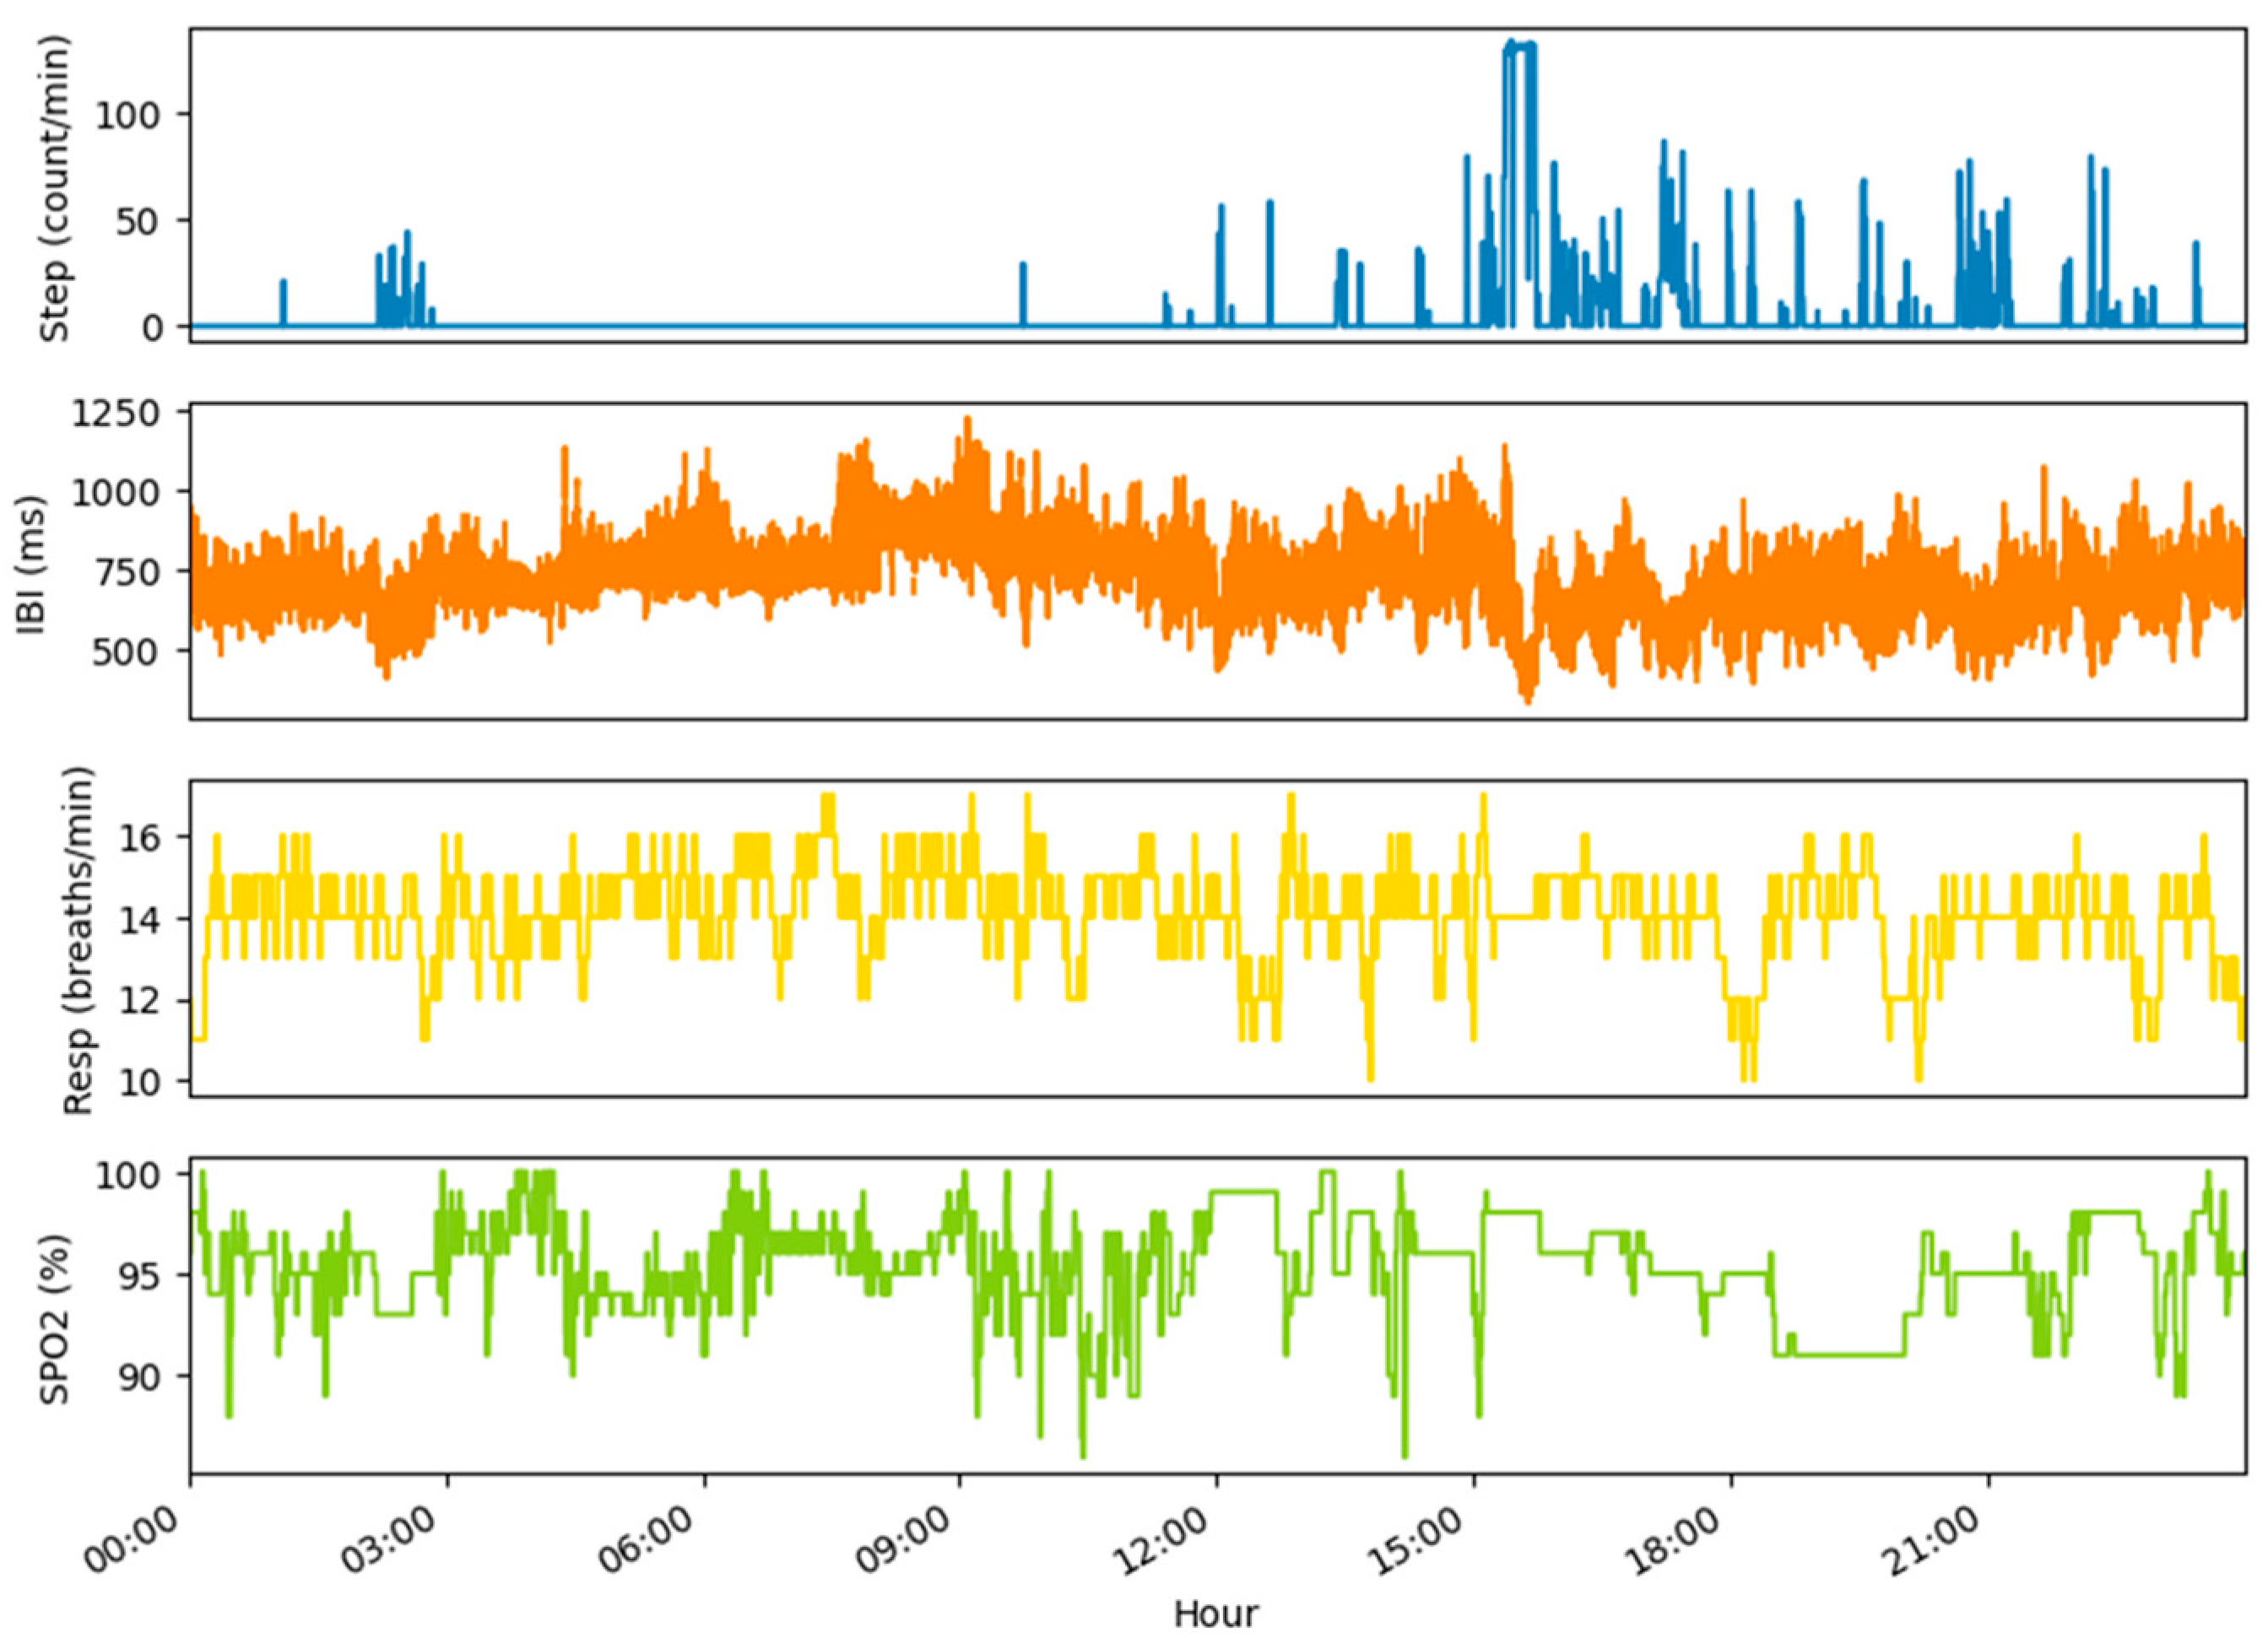
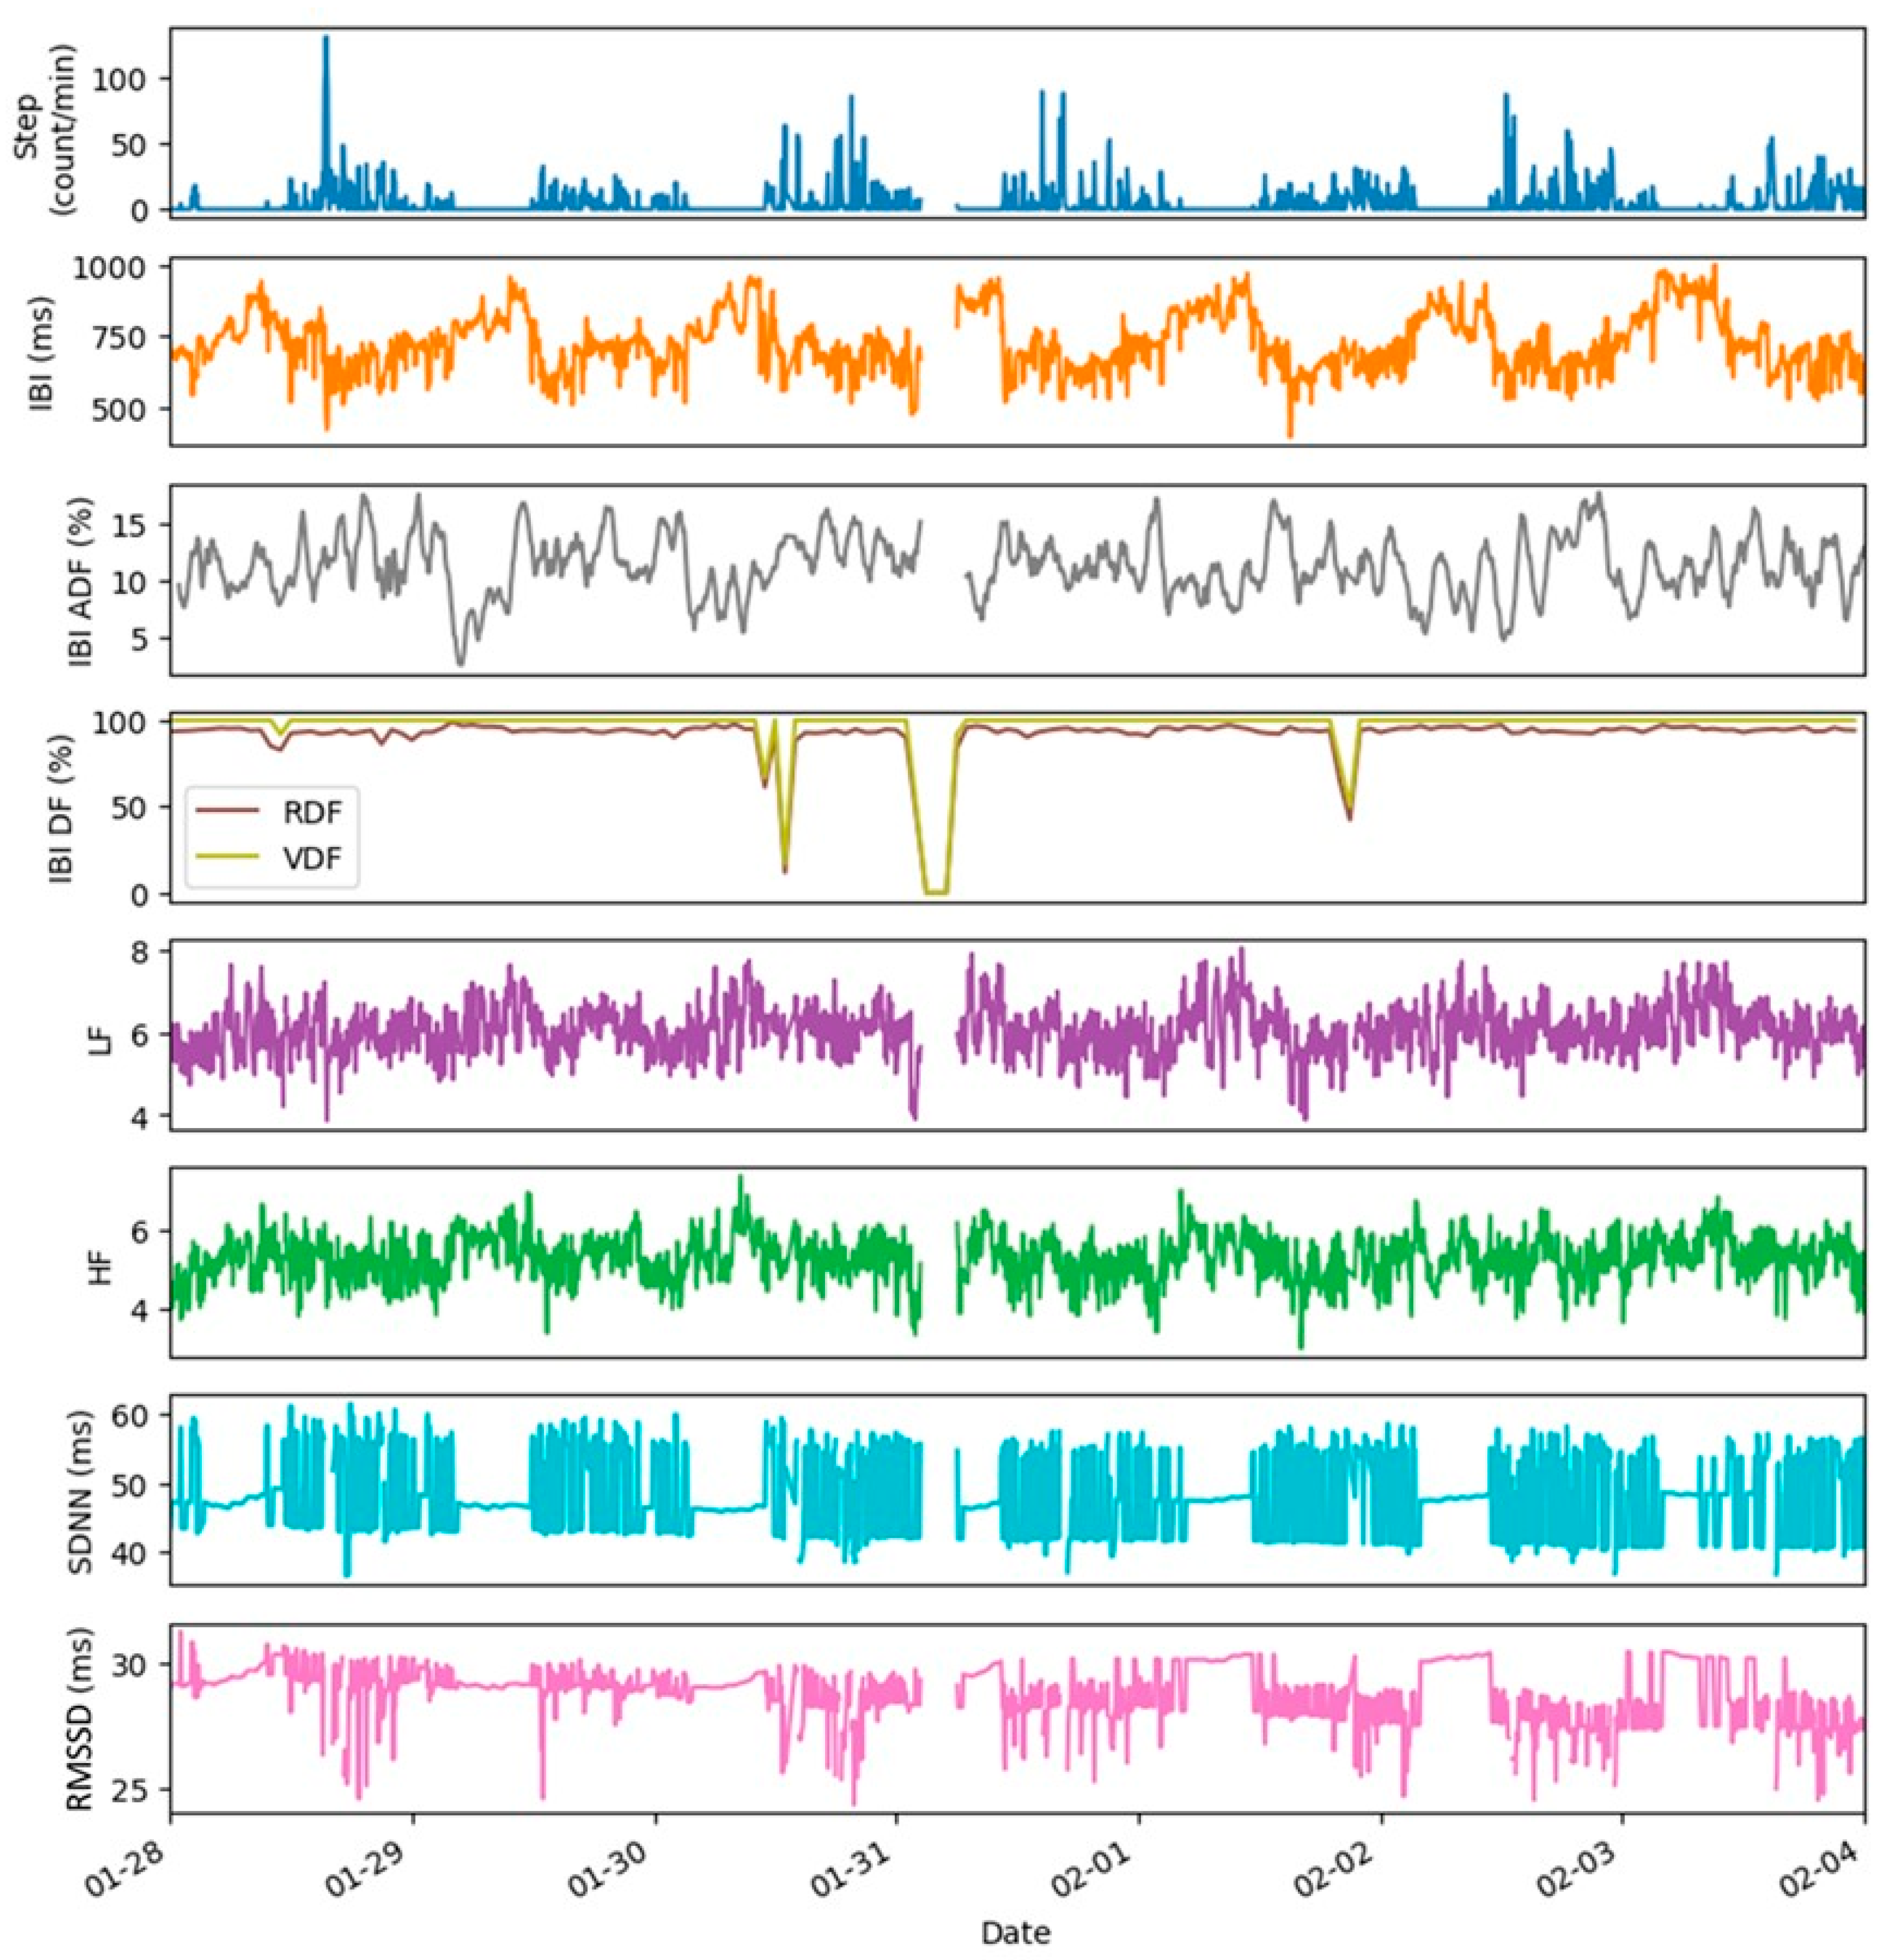
4. Examples of Datasets and Metrics
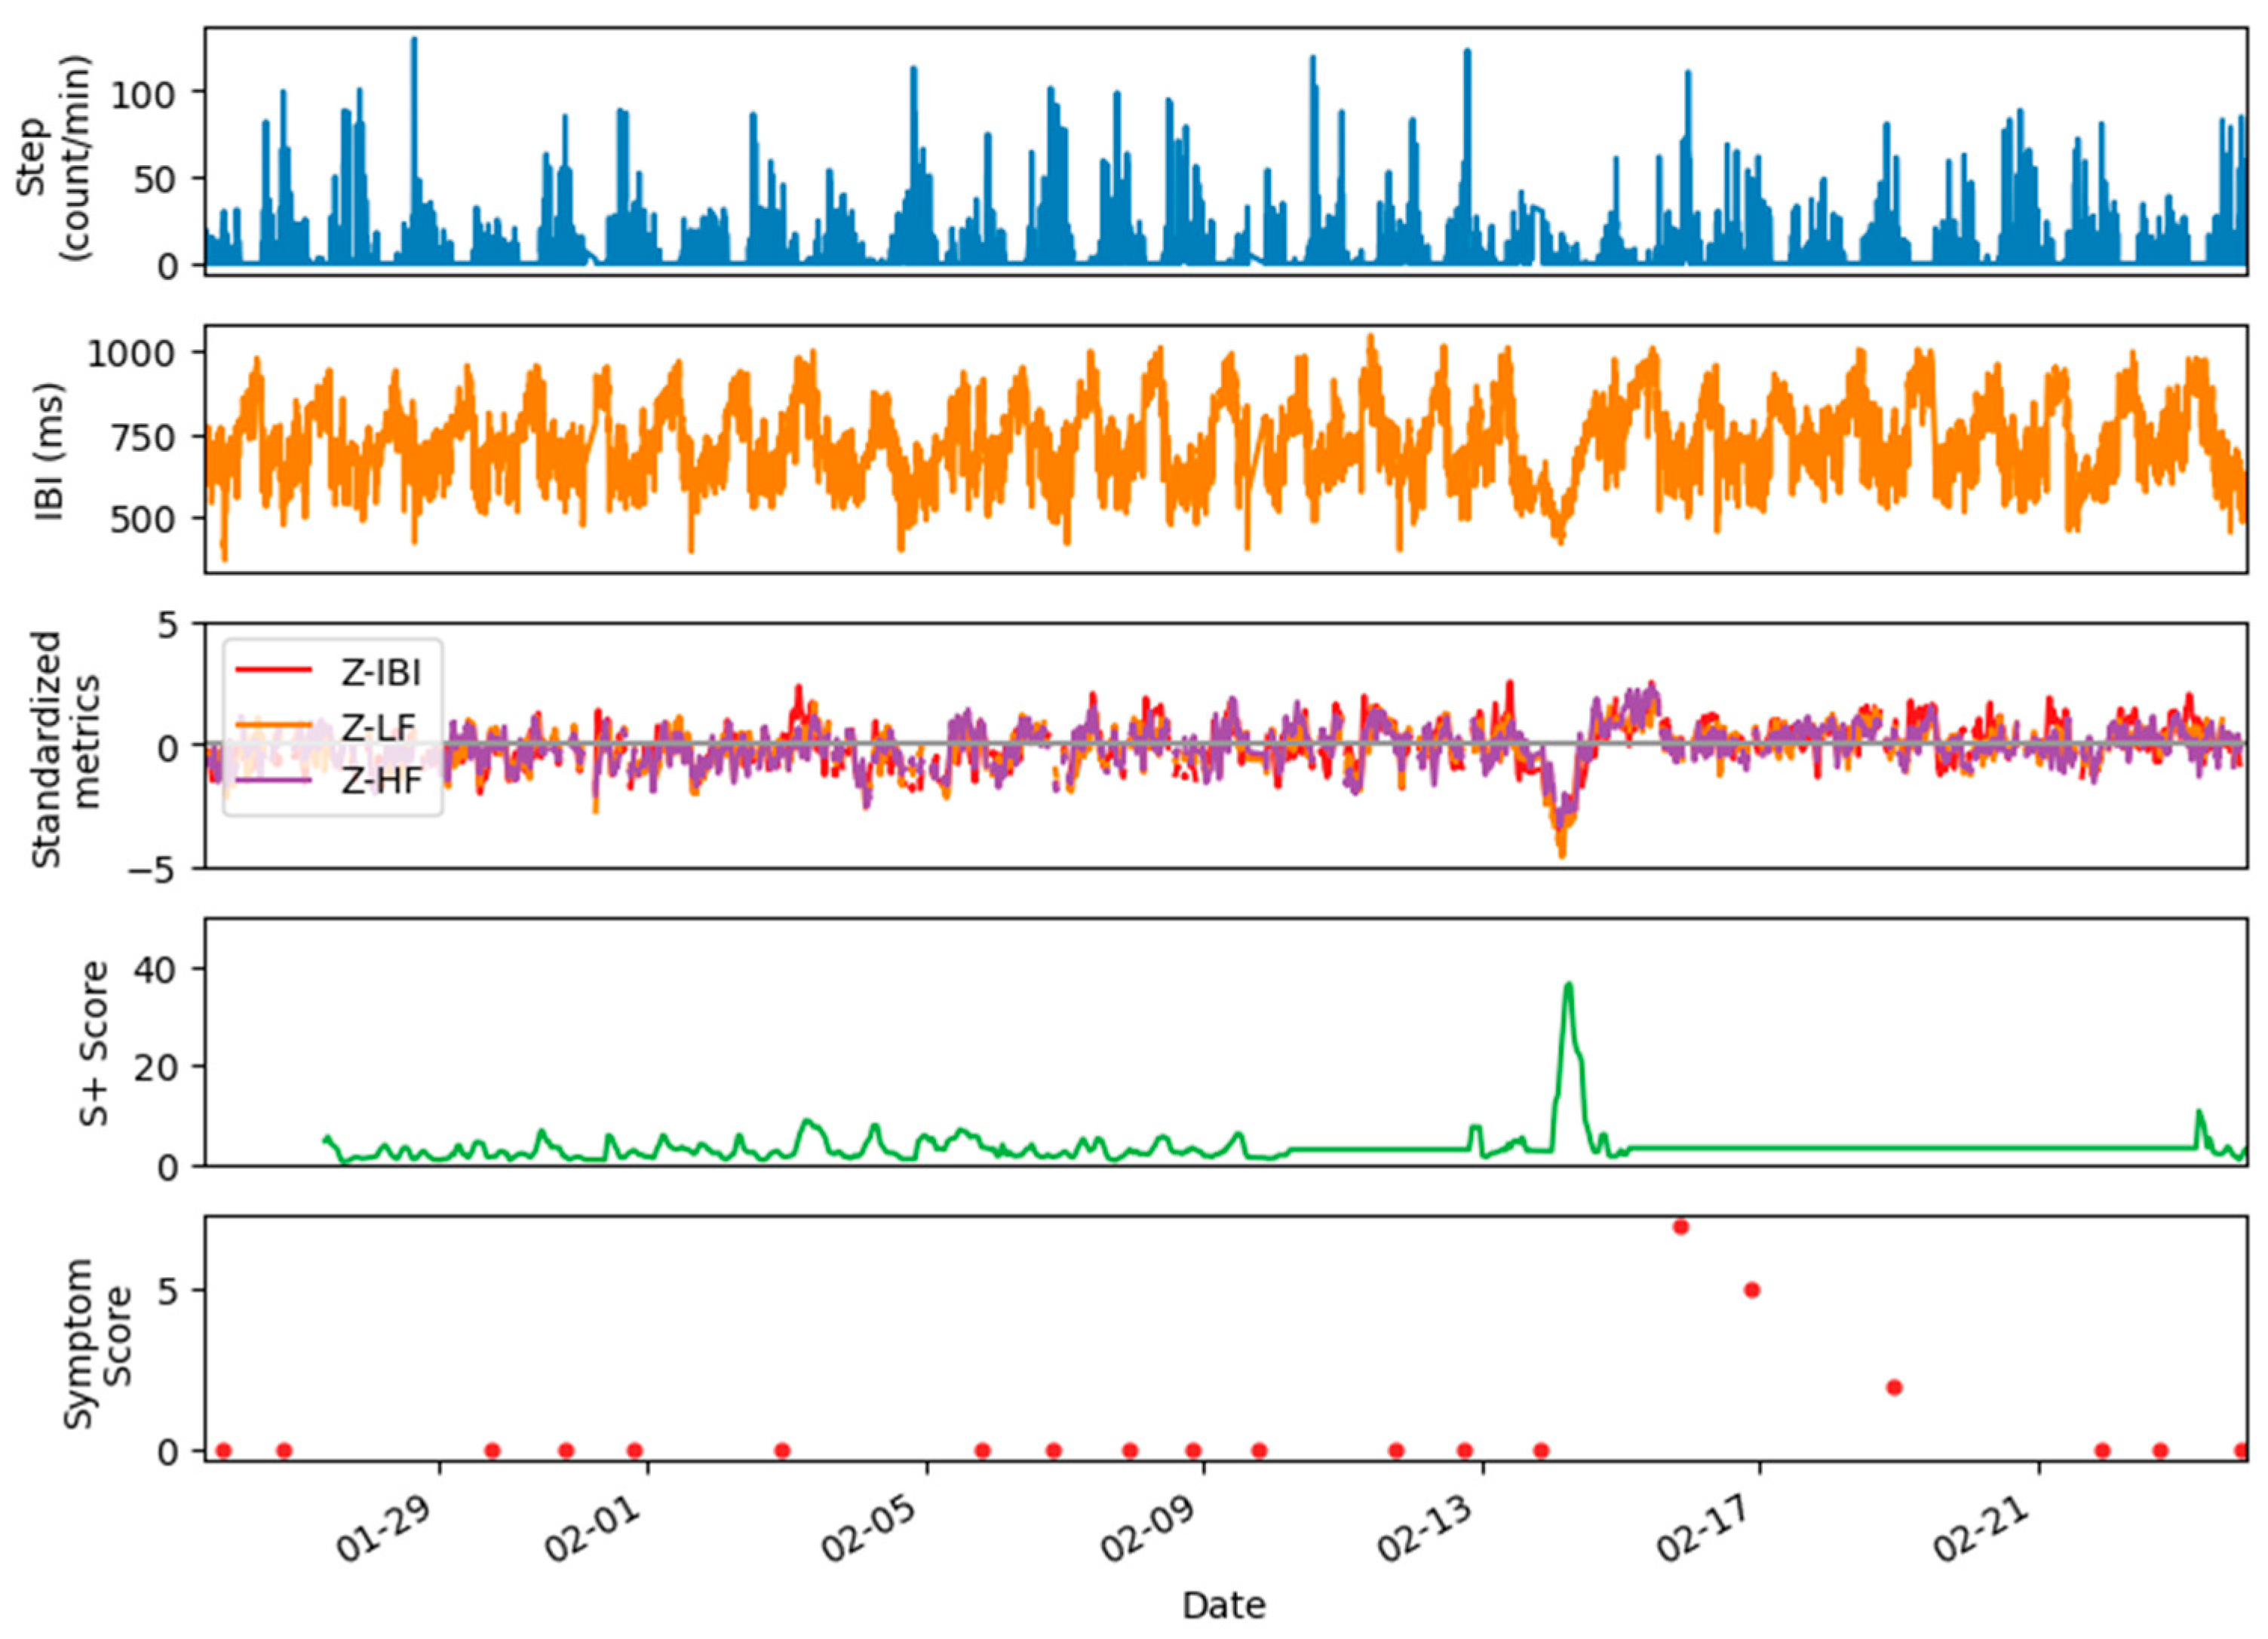
5. Applications

| Application | HRV Metrics | Ref. |
|---|---|---|
| Coronary artery disease | SD1, SD2 | [27] |
| Atrial fibrillation | IBI | [28] |
| Obstructive sleep apnea | VLF, LF, HF, TP, SDNN, RMSDD, pNN50, TI, SampEn | [29] |
| Chronic obstructive pulmonary disease | SDNN, LF, HF | [30] |
| Viral respiratory infection | IBI, LF, HF, LF/HF | [17] |
| Mild traumatic brain injury | IBI, LF, HF, LF/HF | [31] |
| Epilepsy | IBI, LF, HF, LF/HF | [32] |
| Major depressive disorder | LF, HF | [33] |
| Chronic fatigue syndrome | RMSSD, SDNN, pNN50, LF, HF | [34] |
| Sleep quality assessment | RMSSD, SDNN, pNN50, LF, HF | [35] |
| Fitness tracking: aerobic threshold determination | DFA | [36] |
6. Summary and Outlook
Author Contributions
Funding
Data Availability Statement
Acknowledgments
Conflicts of Interest
Abbreviations
| ADF | Artifact data fraction |
| API | Application programming interface |
| BLE | Bluetooth Low Energy |
| CUI | Controlled unclassified information |
| DARPA | Defense Advanced Research Projects Agency |
| DB | Database |
| DFA | Detrended fluctuation analysis (non-linear HRV) |
| FIFO | First-in, first-out |
| GPS | Global Positioning System |
| HF | High Frequency (frequency-domain HRV) |
| HR | Heart rate |
| HRV | Heart rate variability |
| Hz | Hertz |
| IBI | Interbeat interval (the time between heart beats in milliseconds) |
| JSON | Java Script Object Notation |
| LF | Low frequency (frequency-domain HRV) |
| ln() | Natural logarithm |
| Log | Logarithm |
| ms | Millisecond |
| OAuth | Open Authentication |
| OEM | Original equipment manufacturer |
| PNN50 | Percentage of successive IBIs that differ by more than 50 ms (time-domain HRV) |
| PPG | Photoplethysmography |
| QC | Quality control |
| RDF | Raw data fraction |
| Resp | Respiration rate |
| RMSSD | Root mean square of successive differences in IBIs (time-domain HRV) |
| s | Second |
| S+ | SIGMA+ |
| SampEn | Sample entropy (non-linear HRV) |
| SAN | Software and analytics node |
| SD1 | Standard deviation of points perpendicular to the line-of-identity in the Poincare plot (non-linear HRV) |
| SD2 | Standard deviation of the points along the line-of-identity in the Poincare plot (non-linear HRV) |
| SDNN | Standard deviation of IBIs (time-domain HRV) |
| SDK | Software development kit |
| SpO2 | Blood oxygen saturation |
| TI | HRV triangular index (time-domain HRV) |
| TP | Total spectral power (frequency-domain HRV) |
| UTC | Coordinated Universal Time |
| VLF | Very low frequency (frequency-domain HRV) |
References
- Li, X.; Dunn, J.; Salins, D.; Zhou, G.; Zhou, W.; Schussler-Fiorenza Rose, S.M.; Perelman, D.; Colbert, E.; Runge, R.; Rego, S.; et al. Digital Health: Tracking Physiomes and Activity Using Wearable Biosensors Reveals Useful Health-Related Information. PLoS Biol. 2017, 15, e2001402. [Google Scholar] [CrossRef] [PubMed]
- Bayo-Monton, J.L.; Martinez-Millana, A.; Han, W.; Fernandez-Llatas, C.; Sun, Y.; Traver, V. Wearable Sensors Integrated with Internet of Things for Advancing eHealth Care. Sensors 2018, 18, 1851. [Google Scholar] [CrossRef] [PubMed]
- Ates, H.C.; Nguyen, P.Q.; Gonzalez-Macia, L.; Morales-Narvaez, E.; Guder, F.; Collins, J.J.; Dincer, C. End-to-end design of wearable sensors. Nat. Rev. Mater. 2022, 7, 887–907. [Google Scholar] [CrossRef]
- Radin, J.M.; Quer, G.; Jalili, M.; Hamideh, D.; Steinhubl, S.R. The hopes and hazards of using personal health technologies in the diagnosis and prognosis of infections. Lancet Digital Health 2021, 3, e455–e461. [Google Scholar] [CrossRef]
- Quer, G.; Radin, J.M.; Gadaleta, M.; Baca-Motes, K.; Ariniello, L.; Ramos, E.; Kheterpal, V.; Topol, E.J.; Steinhubl, S.R. Wearable sensor data and self-reported symptoms for COVID-19 detection. Nat. Med. 2021, 27, 73–77. [Google Scholar] [CrossRef] [PubMed]
- Zhu, G.; Li, J.; Meng, Z.; Yu, Y.; Li, Y.; Tang, X.; Dong, Y.; Sun, G.; Zhou, R.; Wang, H.; et al. Learning from Large-Scale Wearable Device Data for Predicting Epidemics Trend of COVID-19. Discret. Dyn. Nat. Soc. 2020, 2020, 615204. [Google Scholar] [CrossRef]
- Conroy, B.; Silva, I.; Mehraei, G.; Damiano, R.; Gross, B.; Salvati, E.; Feng, T.; Schneider, J.; Olson, N.; Rizzo, A.G.; et al. Real-time infection prediction with wearable physiological monitoring and AI to aid military workforce readiness during COVID-19. Sci. Rep. 2022, 12, 3797. [Google Scholar] [CrossRef]
- Perez, M.V.; Mahaffey, K.W.; Hedlin, H.; Rumsfeld, J.S.; Garcia, A.; Ferris, T.; Balasubramanian, V.; Russo, A.M.; Rajmane, A.; Cheung, L.; et al. Large-Scale Assessment of a Smartwatch to Identify Atrial Fibrillation. N. Engl. J. Med. 2019, 381, 1909–1917. [Google Scholar] [CrossRef]
- Chen, Y.; Wang, W.; Guo, Y.; Zhang, H.; Chen, Y.; Xie, L. A Single-Center Validation of the Accuracy of a Photoplethysmography-Based Smartwatch for Screening Obstructive Sleep Apnea. Nat. Sci. Sleep 2021, 13, 1533–1544. [Google Scholar] [CrossRef]
- Friedl, K.E. Military applications of soldier physiological monitoring. J. Sci. Med. Sport 2018, 21, 1147–1153. [Google Scholar] [CrossRef]
- Hinde, K.; White, G.; Armstrong, N. Wearable Devices Suitable for Monitoring Twenty Four Hour Heart Rate Variability in Military Populations. Sensors 2021, 21, 1061. [Google Scholar] [CrossRef] [PubMed]
- Buller, M.J.; Delves, S.K.; Fogarty, A.L.; Veenstra, B.J. On the real-time prevention and monitoring of exertional heat illness in military personnel. J. Sci. Med. Sport 2021, 24, 975–981. [Google Scholar] [CrossRef] [PubMed]
- de Arriba-Perez, F.; Caeiro-Rodriguez, M.; Santos-Gago, J.M. Collection and Processing of Data from Wrist Wearable Devices in Heterogeneous and Multiple-User Scenarios. Sensors 2016, 16, 1538. [Google Scholar] [CrossRef] [PubMed]
- Fuller, D.; Colwell, E.; Low, J.; Orychock, K.; Tobin, M.A.; Simango, B.; Buote, R.; Van Heerden, D.; Luan, H.; Cullen, K.; et al. Reliability and Validity of Commercially Available Wearable Devices for Measuring Steps, Energy Expenditure, and Heart Rate: Systematic Review. JMIR Mhealth Uhealth 2020, 8, e18694. [Google Scholar] [CrossRef]
- Cilliers, L. Wearable devices in healthcare: Privacy and information security issues. Health Inf. Manag. 2020, 49, 150–156. [Google Scholar] [CrossRef]
- Chinoy, E.D.; Cuellar, J.A.; Huwa, K.E.; Jameson, J.T.; Watson, C.H.; Bessman, S.C.; Hirsch, D.A.; Cooper, A.D.; Drummond, S.P.A.; Markwald, R.R. Performance of Seven Consumer Sleep-Tracking Devices Compared with Polysomnography. Sleep 2020, 44, zsaa291. [Google Scholar] [CrossRef]
- Temple, D.S.; Hegarty-Craver, M.; Furberg, R.D.; Preble, E.A.; Bergstrom, E.; Gardener, Z.; Dayananda, P.; Taylor, L.; Lemm, N.M.; Papargyris, L.; et al. Wearable sensor-based detection of influenza in presymptomatic and asymptomatic individuals. J Infect. Dis. 2022, 227, 864–872. [Google Scholar] [CrossRef]
- Fenix 6 Series Owner’s Manual. Available online: https://www8.garmin.com/manuals/webhelp/fenix6-6ssport/EN-US/GUID-418F1FCA-C3CE-4606-B639-15225651039E-homepage.html (accessed on 28 December 2022).
- Charlton, P.H.; Kyriaco, P.A.; Mant, J.; Marozas, V.; Chowienczyk, P.; Alastruey, J. Wearable Photoplethysmography for Cardiovascular Monitoring. Proc. IEEE Inst. Electr. Electron. Eng. 2022, 110, 355–381. [Google Scholar] [CrossRef]
- Montes, J.; Tandy, R.; Young, J.; Lee, S.P.; Navalta, J.W. Step Count Reliability and Validity of Five Wearable Technology Devices While Walking and Jogging in both a Free Motion Setting and on a Treadmill. Int. J. Exerc. Sci. 2020, 13, 410–426. [Google Scholar]
- Camm, A.J.; Malik, M.; Bigger, J.T.; Breithardt, G.; Cerutti, S.; Cohen, R.J.; Singer, D.H. Heart rate variability: Standards of measurement, physiological interpretation and clinical use. Task Force of the European Society of Cardiology and the North American Society of Pacing and Electrophysiology. Circulation 1996, 93, 1043–1065. [Google Scholar] [CrossRef]
- Mejia-Mejia, E.; Budidha, K.; Abay, T.Y.; May, J.M.; Kyriacou, P.A. Heart Rate Variability (HRV) and Pulse Rate Variability (PRV) for the Assessment of Autonomic Responses. Front. Physiol. 2020, 11, 779. [Google Scholar] [CrossRef] [PubMed]
- Tarvainen, M.P.; Niskanen, J.P.; Lipponen, J.A.; Ranta-Aho, P.O.; Karjalainen, P.A. Kubios HRV—Heart rate variability analysis software. Comput. Methods Programs. Biomed. 2014, 113, 210–220. [Google Scholar] [CrossRef] [PubMed]
- Lewis, G.F.; Furman, S.A.; McCool, M.F.; Porges, S.W. Statistical strategies to quantify respiratory sinus arrhythmia: Are commonly used metrics equivalent? Biol. Psychol. 2012, 89, 349–364. [Google Scholar] [CrossRef]
- Dahou, A.; Al-qaness, M.A.A.; Elsayed Abd Elaziz, M.; Helmi, A. MLCNNwav: Multi-level Convolutional Neural Network with Wavelet Transformations for Sensor-based Human Activity Recognition. IEEE Internet. Things J. Early Access 2023. [Google Scholar] [CrossRef]
- Dahou, A.; Al-qaness, M.A.A.; Abd Elaziz, M.; Helmi, A. Human activity recognition in IoHT applications using Arithmetic Optimization Algorithm and deep learning. Measurement 2022, 199, 111445. [Google Scholar] [CrossRef]
- Haensel, A.; Mills, P.J.; Nelesen, R.A.; Ziegler, M.G.; Dimsdale, J.E. The relationship between heart rate variability and inflammatory markers in cardiovascular diseases. Psychoneuroendocrinology 2008, 33, 1305–1312. [Google Scholar] [CrossRef]
- Park, J.; Lee, S.; Jeon, M. Atrial fibrillation detection by heart rate variability in Poincare plot. Biomed. Eng. Online 2009, 8, 38. [Google Scholar] [CrossRef]
- Sequeira, V.C.C.; Bandeira, P.M.; Azevedo, J.C.M. Heart rate variability in adults with obstructive sleep apnea: A systematic review. Sleep Sci. 2019, 12, 214–221. [Google Scholar] [CrossRef]
- Park, S.C.; Saiphoklang, N.; Jung, D.; Gomez, D.; Phillips, J.E.; Dolezal, B.A.; Tashkin, D.P.; Barjaktarevic, I.; Cooper, C.B. Use of a Wearable Biosensor to Study Heart Rate Variability in Chronic Obstructive Pulmonary Disease and Its Relationship to Disease Severity. Sensors 2022, 22, 2264. [Google Scholar] [CrossRef]
- Russell, K.N.; Preble, E.A.; Hegarty-Craver, M.; Arrieux, J.P.; Cole, W.R.; Choi, Y.S.; Grego, S.; Rae Olmsted, K.; Gilchrist, K.H. Feasibility of Mild Traumatic Brain Injury Assessment Based on Cardiovascular Response to Postural Change. J. Head. Trauma. Rehabil. 2020, 35, E422–E428. [Google Scholar] [CrossRef]
- Hegarty-Craver, M.; Kroner, B.L.; Bumbut, A.; DeFilipp, S.J.; Gaillard, W.D.; Gilchrist, K.H. Cardiac-based detection of seizures in children with epilepsy. Epilepsy Behav. 2021, 122, 108129. [Google Scholar] [CrossRef] [PubMed]
- Shinba, T.; Murotsu, K.; Usui, Y.; Andow, Y.; Terada, H.; Kariya, N.; Tatebayashi, Y.; Matsuda, Y.; Mugishima, G.; Shinba, Y.; et al. Return-to-Work Screening by Linear Discriminant Analysis of Heart Rate Variability Indices in Depressed Subjects. Sensors 2021, 21, 5177. [Google Scholar] [CrossRef] [PubMed]
- Capdevila, L.; Castro-Marrero, J.; Alegre, J.; Ramos-Castro, J.; Escorihuela, R.M. Analysis of Gender Differences in HRV of Patients with Myalgic Encephalomyelitis/Chronic Fatigue Syndrome Using Mobile-Health Technology. Sensors 2021, 21, 3746. [Google Scholar] [CrossRef] [PubMed]
- Tsou, M.M.; Lung, S.C.; Cheng, C.H. Demonstrating the Applicability of Smartwatches in PM(2.5) Health Impact Assessment. Sensors 2021, 21, 4585. [Google Scholar] [CrossRef]
- Rogers, B.; Giles, D.; Draper, N.; Mourot, L.; Gronwald, T. Influence of Artefact Correction and Recording Device Type on the Practical Application of a Non-Linear Heart Rate Variability Biomarker for Aerobic Threshold Determination. Sensors 2021, 21, 821. [Google Scholar] [CrossRef]
- Gaur, P.; Temple, D.S.; Hegarty-Craver, M.; Holt, J.; Preble, E.A.; Dausch, D.E. Continuous Monitoring of Heart Rate Variability in Free-Living Conditions Using Wearable Sensors: A Prospective Observational Study for Respiratory Illness Detection. J. Med. Internet Res. 2023, in press.
- Buller, M.J.; Tharion, W.J.; Duhamel, C.M.; Yokota, M. Real-time core body temperature estimation from heart rate for first responders wearing different levels of personal protective equipment. Ergonomics 2015, 58, 1830–1841. [Google Scholar] [CrossRef]
| Metric | Unit | Description |
|---|---|---|
| Time Domain | ||
| IBI | ms | Median IBI |
| SDNN | ms | Standard deviation of interbeat intervals |
| RMSSD | ms | Root mean square of successive differences in interbeat intervals |
| PNN50 | % | Percentage of successive interbeat intervals that differ more than 50 ms |
| TI | - | HRV triangular index = the integral of the HRV histogram divided by the height of the histogram |
| Frequency Domain | ||
| TP | ms2 | Total spectral power |
| VLF | Log of very-low-frequency power (0–0.04 Hz) | |
| LF | - | Log of low-frequency power (0.04–0.15 Hz) |
| HF | - | Log of high-frequency power (0.15–1.0 Hz) |
| Resp | Hz | Respiration rate |
| Nonlinear Domain | ||
| DFA | Short- and long-term fluctuations in detrended fluctuation analysis | |
| SD1 | - | Standard deviation of the points perpendicular to the line-of-identity in the Poincare plot |
| SD2 | Standard deviation along the line-of-identity in the Poincare plot | |
| SampEn | - | Sample entropy |
Disclaimer/Publisher’s Note: The statements, opinions and data contained in all publications are solely those of the individual author(s) and contributor(s) and not of MDPI and/or the editor(s). MDPI and/or the editor(s) disclaim responsibility for any injury to people or property resulting from any ideas, methods, instructions or products referred to in the content. |
© 2023 by the authors. Licensee MDPI, Basel, Switzerland. This article is an open access article distributed under the terms and conditions of the Creative Commons Attribution (CC BY) license (https://creativecommons.org/licenses/by/4.0/).
Share and Cite
Temple, D.S.; Hegarty-Craver, M.; Gaur, P.; Boyce, M.D.; Holt, J.R.; Preble, E.A.; Eckhoff, R.P.; Davis-Wilson, H.; Walls, H.J.; Dausch, D.E.; et al. Modular Open-Core System for Collection and Near Real-Time Processing of High-Resolution Data from Wearable Sensors. Appl. Syst. Innov. 2023, 6, 79. https://doi.org/10.3390/asi6050079
Temple DS, Hegarty-Craver M, Gaur P, Boyce MD, Holt JR, Preble EA, Eckhoff RP, Davis-Wilson H, Walls HJ, Dausch DE, et al. Modular Open-Core System for Collection and Near Real-Time Processing of High-Resolution Data from Wearable Sensors. Applied System Innovation. 2023; 6(5):79. https://doi.org/10.3390/asi6050079
Chicago/Turabian StyleTemple, Dorota S., Meghan Hegarty-Craver, Pooja Gaur, Matthew D. Boyce, Jonathan R. Holt, Edward A. Preble, Randall P. Eckhoff, Hope Davis-Wilson, Howard J. Walls, David E. Dausch, and et al. 2023. "Modular Open-Core System for Collection and Near Real-Time Processing of High-Resolution Data from Wearable Sensors" Applied System Innovation 6, no. 5: 79. https://doi.org/10.3390/asi6050079