1. Introduction
One crucial facet of effective project management involves quantifying efficiency in attaining goals [
1]. Achieving this objective often demands adept management of intermediate project stages and milestones, encompassing inter-team communication, task scheduling, resource utilization efficiency, compliance, and the conformity of results [
2].
Project management (PM) activities aim to minimize unexpected impacts associated with typical management uncertainties, exploit opportunities for lower costs, expedite critical tasks, and ensure adherence to deadlines and scope, all while staying within the established budget [
3]. Handling multiple factors is a multifaceted and intricate undertaking, given the inherent uncertainty, the array of adverse factors that can impede task progress, and, especially in the context of advanced manufacturing systems, the rapid technological changes that can influence pivotal decisions, making it challenging to establish a repository of historical data [
4]. One of PM’s core objectives is to effectively steer projects while aligning them with the company’s operational strategy [
5].
Manufacturing companies engaged in complex projects often establish a dedicated organizational unit solely focused on project management, known as the Project Management Office (PMO). The PMO’s primary role encompasses critical project functions, including defining governance protocols, resource allocation planning, and assessing interim and overall outcomes [
6]. Additionally, the PMO is responsible for adhering to business constraints [
7] and ensuring alignment with the operational strategy [
8]. Companies that adopt a PMO-type structure tend to achieve heightened efficiency in project execution [
9].
Authors like [
7,
10,
11,
12] delve into aspects related to project efficiency. Assessing a project’s efficiency involves considering the resources employed during execution and the outcomes achieved upon completion compared to the optimal utilization of resources and the maximal output generation benchmark. However, such comparative assessments encounter limitations because benchmarking analyses are typically external, involving comparisons with similar projects carried out by competitors [
13]. An appealing alternative is internal benchmarking, where projects executed by the same organization are compared [
14]. In internal benchmarking, each project led by the Project Management Office (PMO) is a decision-making unit (DMU) for comparisons with other projects sharing similar attributes, either over time or longitudinally. Data Envelopment Analysis (DEA) evaluates a DMU, such as companies or projects, by employing multiple inputs and outputs, which facilitates the identification of best practices and promotes organizational learning [
15].
A Scopus database search in October 2023 yielded 5935 articles, published between 2017 and 2023, containing the phrase “project management efficiency” in both the title and as a keyword. Subsequently, a second search identified only three articles during the same period in the same database, featuring “project management efficiency” in the title and the keyword “efficiency.” These findings suggest that examining efficiency in project execution within the domain of PM still needs to be explored in existing research. This is the research gap the study aims to bridge. The research question posed is how to measure the efficiency of PM activities. The purpose of this article is to quantify the efficiency of the execution of a project portfolio managed by a project management office (PMO) structure. The research subject is a PMO operating within a petrochemical manufacturing company in southern Brazil. The research method is quantitative modeling.
The remainder of this article is structured as follows: it begins with a comprehensive review of theoretical perspectives on efficiency assessments, followed by an explanation of the methodological procedures employed. Subsequently, the article presents the results, discusses the findings, and concludes with final remarks.
2. Efficiency in PM: The PMO
The PMO is an organizational unit responsible for centralized and coordinated project management that carries out distinct functions and performs specific roles in PM [
16], adapting its structure to the overall organizational framework [
17]. Refs [
18,
19] shed light on the evolving roles and changing responsibilities of PMOs over time. Additionally, [
20] emphasizes the PMO’s crucial role in facilitating knowledge transfer among similar projects. By operating centrally, the PMO plays a pivotal role in fostering the exchange of insights among stakeholders. According to [
21], a PMO model can take on different forms, serving as a service provider, a control center, or a management partner. In summary, the PMO can be categorized as an entity that offers various services, ranging from maintaining standardization systems to resource management, all with the overarching objective of supporting executive management and bolstering the project portfolio [
22].
According to [
23], the earliest implementations of PMO in companies date back to the early 1990s. [
22] point out that the majority, approximately 65%, of the implementations encountered during the study occurred after the 2000s. Consequently, uncertainties persist regarding the methods and techniques available for centralizing PM activities [
24]. Centralized PM activities in PMO-type entities can be a critical success factor in projects, given their ability to standardize procedures and focus on objectives linked to deadlines, costs, and scope compliance. Another critical success factor in PM is the PMO’s position in the organizational structure, which must be autonomous and cross-functional to be effective [
25].
Assessing and managing the efficiency of PMOs can play a pivotal role in enhancing project outcomes. PMOs with a higher efficiency index yield improved compliance with deadlines, costs, and scope, enhancing overall project effectiveness [
26]. When strategically positioned, the PMO enhances results [
27] and fosters organizational learning [
28]. This improvement results from acquiring superior knowledge, implementing standardized processes, and enhancing training. As [
29] emphasized, there should be seamless integration between success factors and governance. Despite the acknowledged necessity of efficiency control, the existing literature, according to [
30], has predominantly focused on PMO functionalities rather than tangible outcomes. Another gap in the literature pertains to uncertainties surrounding the significance of PMOs [
31] and the integration of multiple roles [
32]. A recent gap relates to the ambiguity surrounding the decision-making processes within PMOs [
16].
To characterize the evaluation variables of a PMO, one must first discern how the PMO operates within each organization [
7]. By establishing measurable parameters and metrics, the PMO can showcase its efficiency [
33], overseeing performance in every activity and project phase. With a comprehensive view of project management, the PMO can pinpoint efficiencies at various process stages. Practical and significant results, considering both internal and external environmental variables, can contribute to managing the PMO’s efficiency. Internal variables can be managed within the system’s control, while external variables, often referred to as natural states, remain beyond management’s influence and are contingent upon external forces, such as market dynamics and economic growth [
34]. Typically, a PMO succeeds in reducing project duration and costs while simultaneously maintaining scope and expected quality [
35]. It also advances project management maturity within organizations [
36]. Assessing a PMO’s impact on project efficiency can deliver quantitative and qualitative benefits, which requires comprehension of the context in which the PMO operates and its evolving maturity level. This understanding helps define how a PMO engages in projects, consequently affecting its efficiency and, by extension, the project’s efficiency [
37].
In the context of PM, the literature highlights efficiency in several areas, such as execution, organization, PMO functions, portfolio, and communication efficiency. In particular, it is feasible to identify a correlation between the PMO and the efficiency of the project portfolio. As a company’s portfolio expands, its management extends its involvement in projects, and the PMO can offer support in defining objectives and delivering results about efficiency [
34]. For example, [
10,
34,
38] evaluate project efficiency and show benefits such as return on investment, cost reduction, and increased accuracy.
There are various PMO typologies and functionalities, encompassing practical and theoretical approaches that involve implementing project management procedures and standards for practices and documents [
32]. Adhering to such standards contributes significantly to project success [
24].
Table 1 outlines and synthesizes the PMO’s multiple expected roles and functionalities retrieved from the literature reviewed.
3. Methodology
The research method was quantitative modeling (Lacerda et al., 2013). The research object focused on the project portfolio of a petrochemical company located in southern Brazil over the past seven years. Longitudinal analyses are a necessary condition for the application of internal benchmarking [
50]. The company boasts more than 8000 employees, 36 industrial units (29 in Brazil, 5 in the United States, and two in Germany), and offices and commercial bases across the Americas, Europe, and Asia. The annual revenue is USD 5 billion (USD 1 = BR
$ 4.89, the Brazilian currency, on 3 November 2023). On average, the company maintains a project portfolio of USD 105 million. Since 2018, a tactical and operational PMO for PM has been in place within the company. Tactical PMO refers to the processes and methods of implementation, while operational PMO pertains to project results [
43]. Based on the level of PMO performance, measurable parameters and criteria in the form of metrics can be established to identify the influence of the PMO on project efficiency [
47].
Figure 1 presents the methodology and the outcomes of each stage.
The projects range from class I to IV, depending on the complexity (class I embraces the less complex projects, according to the value and number of agents involved; the more agents, the greater the complexity). The research considered class II, III, and IV projects, as no class I or V projects were concluded during the period. The company also classifies the projects into SHE (safety, health, and environment), PI (profitability increase), and RM (reliability management). SHE projects focus mainly on managing safety issues on the shop floor [
51], energy recovery and renewable energy sources, and the reuse and exchange of materials and energy among companies [
52]. PI projects focus mainly on profitability increases through new sources of revenue and cost reductions in processes [
53]. RM projects focus mainly on retrofitting [
54] and overhauling critical equipment [
55].
The intensity of involvement of the PMO depends on the project classification: the higher the class, the greater the number of deliverables. Each level of maturity requires specific documents and analyses according to their complexity, size, and characteristics. Deliverables are mandatory documents released by the PMO. In addition, the PMO is also responsible for communicating about investments, adjustments, and improvements to the investment management software, planning the project portfolio, and closing the qualitative and quantitative results of completed projects, among others.
Table 2 displays the number of deliverables according to class and degree of project maturity.
The DEA Model
Each project is a DMU, which includes 49 class II, 54 class III, and 25 class IV projects, totaling 128 DMUs. Individual variable data per project for the DEA was retrieved from the project management system database between January 2015 and December 2021. The type of DEA was constant returns to scale (CRS) with output orientation. The efficiency levels were estimated assuming constant returns to scale (CRS), given the comparability of projects in terms of size. This is inherent in internal benchmarking. In an output-oriented approach, the emphasis is placed on optimizing output levels given a set of inputs. Consequently, this analysis provides insights into the extent to which the project management office (PMO) should have enhanced the performance of each project. Such an approach should produce internal benchmarks for any project. The specific project characteristics determine the extent to which inputs can be modified, which often leaves little room for input adjustments. Therefore, opting for Constant Returns to Scale (CRS) is the more effective strategy for improving performance by enhancing outcomes without compromising income. The model follows Equations (1)–(3).
subject to:
= weight calculated for the input i, i = 1, … n.
= weight calculated for the output j, j = 1, … m.
= quantity of the input i for the DMU under analysis.
= quantity of the output j for the DMU under analysis.
= quantity of the input i for DMU k, k = 1, … N.
= quantity of the output j for DMU k, k = 1, … N.
= number of DMUs under analysis.
n = number of inputs.
m = number of outputs.
The professionals listed in
Table 3 supported the development of the DEA model.
The model was developed through two focus group sessions conducted by one of the researchers at the company’s headquarters. During the first session, the researcher gathered comments and feedback from the participants and then compiled the results. In the second session, the researcher presented the model to the participants, who accepted it and confirmed that there was enough data to proceed with the research. As inputs to the model, participants emphasized the importance of the cost and time expected to complete the project (input01 and input03) and the complexity indicated by the number of agents who must interact (input02 and input04). As outputs of the model, participants pointed out cost compliance (output01), the success rate in meeting deadlines (output02), and the absolute time until the end of projects (output03).
Table 4 showcases the model.
4. Results
Table 5 shows the efficiencies calculated by the free software SAGEPE for the entire set of projects (one project, one DMU). The analysis discarded projects finished before 2018, as the PMO was not fully activated, and many projects were conducted by a different method.
Appendix A shows the gains for the variables of all the DMUs.
An Analysis of Variance (ANOVA) test is useful to determine if there are significant differences in the average efficiencies, which can also be useful in project management [
63,
64,
65]. This test involves multiple comparisons among treatment groups to ascertain whether the set of samples exhibits significant differences in means. Since Fcritical < Fscore and
p-value < 0.05, there is at least one significant difference among the average efficiencies, which supports the statement that efficiency varies according to the service provided by the PMO.
Table 6 shows the ANOVA test.
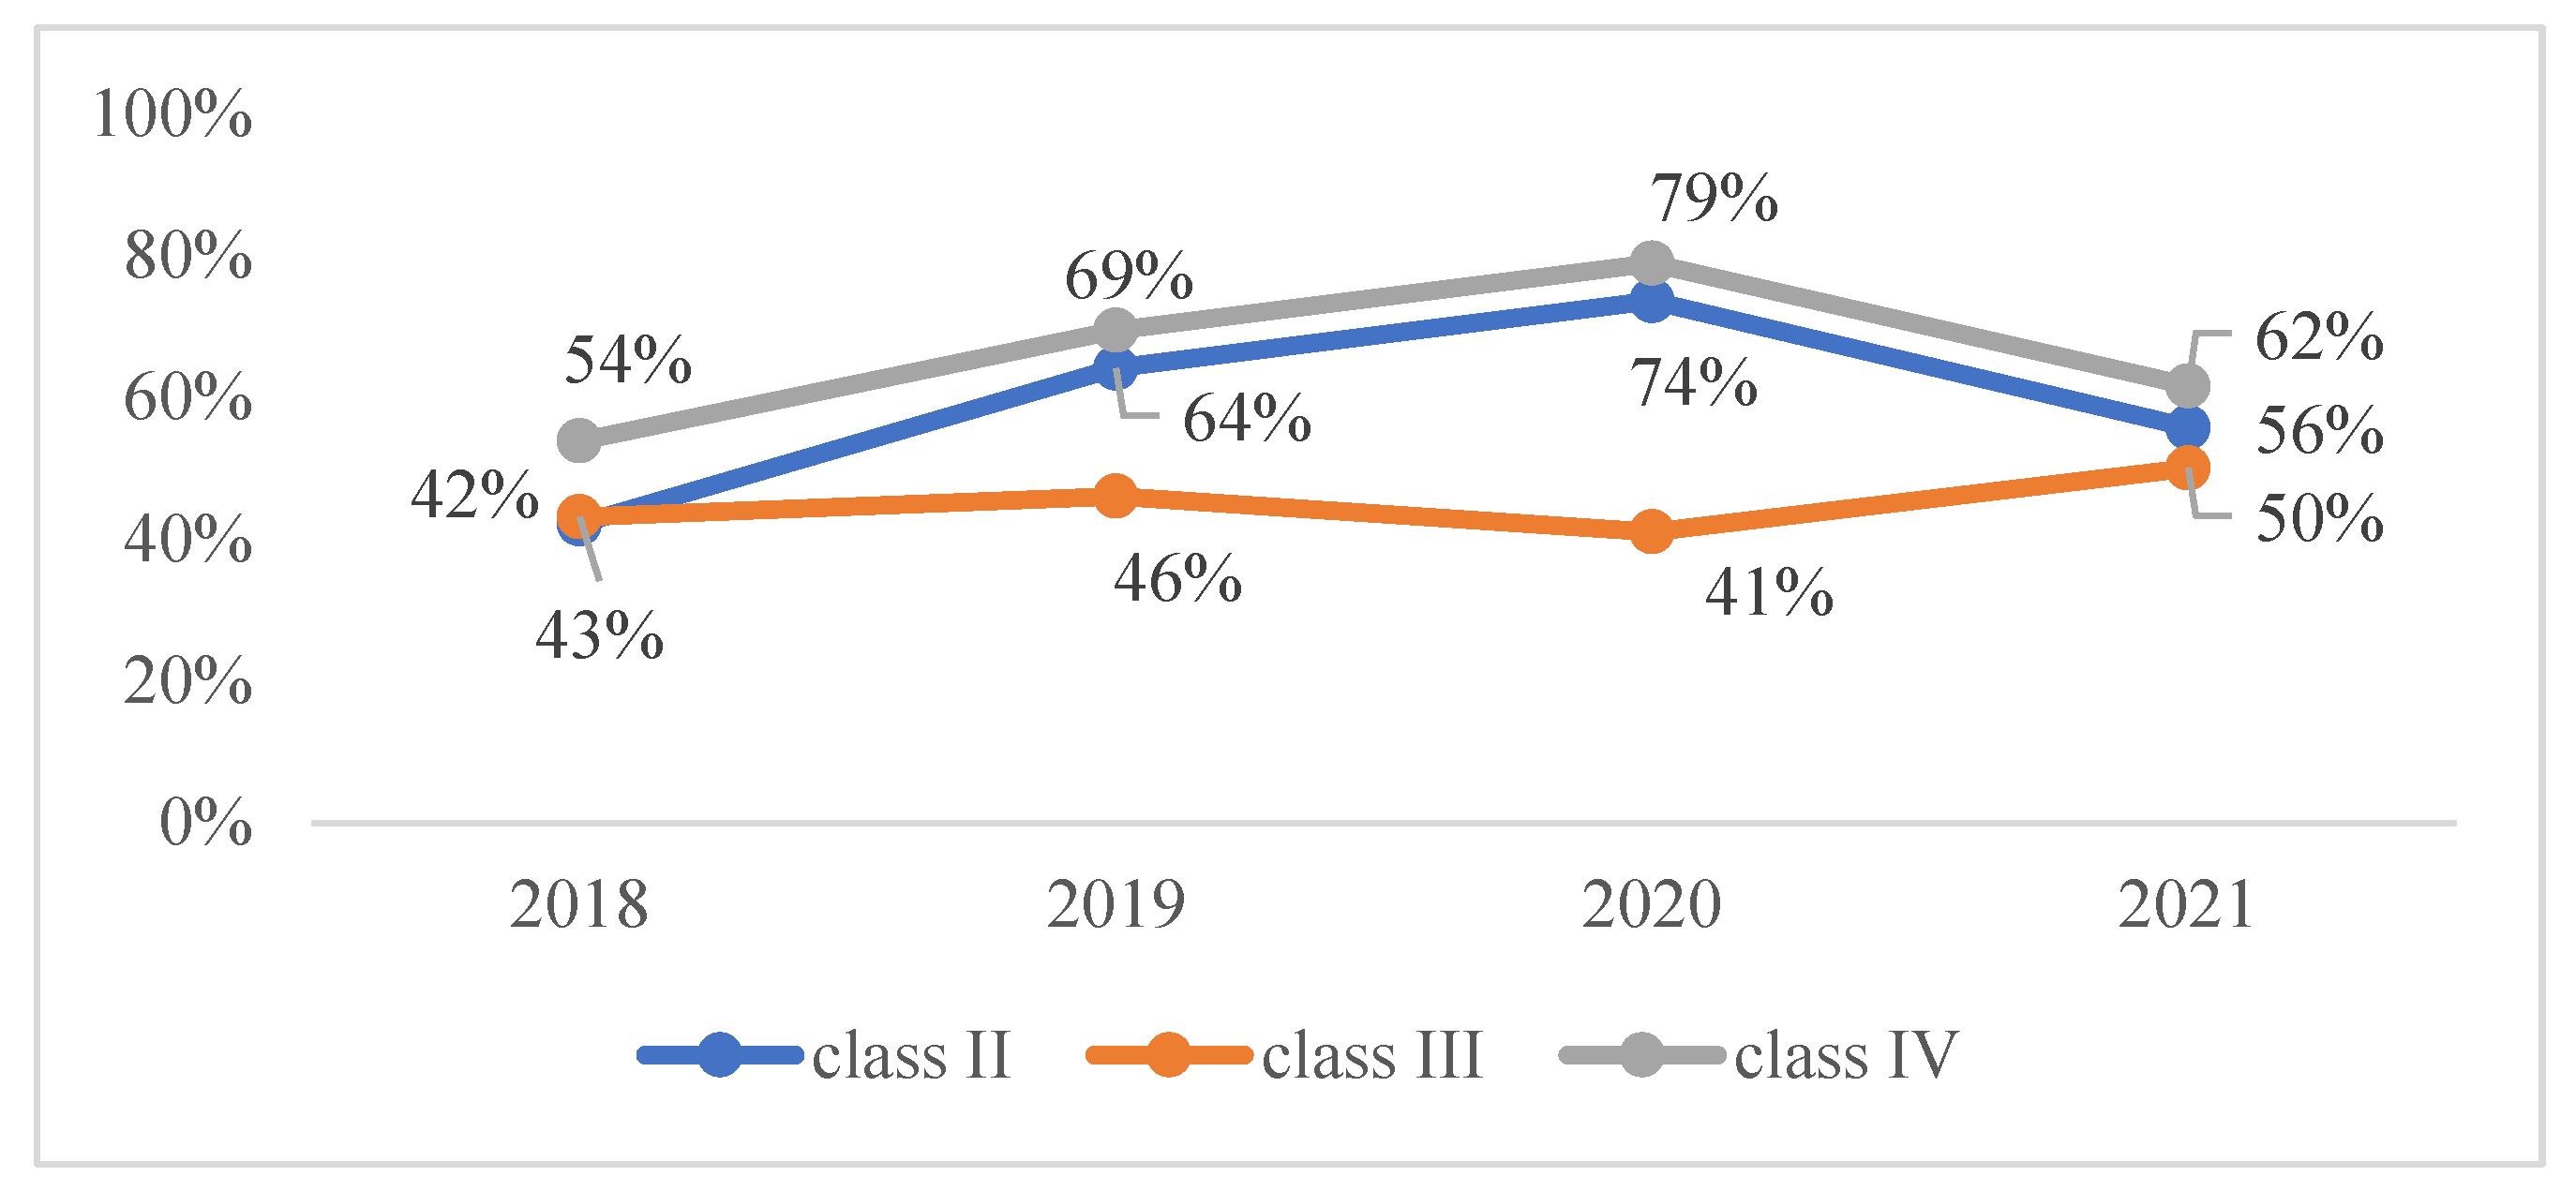
Figure 2 highlights average project efficiencies by year and by class.
The efficiency increased until 2020 for classes II and IV but not for class III, reflecting the strategic choices of the PMO. The class II projects are simple and require less managerial effort, while failure in the more challenging class IV projects could jeopardize future revenues. Therefore, the PMO focuses on expediting simple projects and does not take risks with expensive or revenue-focused projects. Given the wrong results in class III, by the end of 2020, the PMO management had decided to prioritize such a class, which was reflected in the 2021 results.
To assess the appropriateness of average efficiency in project control, this study also computed efficiencies weighted by cost and time. The rationale behind employing weighted indicators lies in the fact that maintaining cost efficiency, often associated with low-cost projects, holds less significance than achieving an intermediate efficiency level in high-cost projects. The same principle applies to project completion time. While a short, high-efficiency project can help mitigate resource idleness in critical areas, a large project with intermediate efficiency has the potential to reduce more idle hours. Hence, considering both cost and project completion time may be relevant in evaluating the implications of efficient management. Equations (4) and (5) below depict cost and time efficiency, respectively.
where:
Effcw and Efftw = cost- and time-weighted efficiencies;
Ci and Ti = cost and time to completion of the ith project;
ΣCi and ΣTi = total cost and total time to completion of all the projects.
Table 7 presents the weighted and average efficiencies for the different classes.
Notably, Class II and IV exhibited a major disparity between average and cost-weighted efficiency. In Class II, projects with higher costs received lower priority, leading to a 4.8 percentage point difference below the average. Conversely, in Class IV, the PMO prioritized projects with larger budgets, resulting in a positive difference of 9.5 percentage points, which was an outcome that made sense.
Appendix B shows the entire calculation for weighted efficiencies.
Table 8 presents the partial success rate of projects by class, showing the absolute number and the percentage of projects that finished on time and at the expected cost.
It is interesting to note that the greater the class (and the value), the greater the percentage on time, which reflects the initial prioritization given by PMO to class IV projects. The low accuracy in cost in class IV projects highlights that on-time performance is achieved, jeopardizing cost. Regarding the cost, class II is significantly more accurate than the other classes due to such projects’ low complexity and uncertainty.
Another issue is the relationship between the type and class of the project and its efficiency.
Table 9 shows the characteristics of the class II projects located in the lower and upper quartiles (LQ and UQ) of efficiency (respectively under 25% and above 75% thresholds).
Class II has no PI projects in the lower quartile, while nine of the twelve projects (75%) regard RM. This result may be associated with organizational strategy since projects to increase profitability require significant investments, usually more than USD 10 million. Such projects add financial resources, requiring detailed financial analysis and more rigorous monitoring, which implies more care from the PMO. Additionally, the PMO supports the publication of financial results, analyzes the results achieved throughout the project’s life cycle, and calculates the financial performance, balancing benefits and investment. As the projects are more straightforward, the PMO succeeds in managing them. In the upper quartile, there are four RM projects, developed mainly to be implemented during the shutdown of the industrial plant for regular maintenance. As the fulfillment of the downtime is crucial for the plant’s productivity, these projects resulted in high efficiency given the strict control exercised by the PMO. SHE projects a swing between the lower and upper quartiles. In class III, many PI projects (70%) lie in the upper quartile for the same reason: the need for stricter control by the PMO. As the complexity and the need for control increase, 30% of projects are less efficient. The four high-efficiency RM projects are also linked to plant shutdowns for maintenance, which forces more accurate time control. In class IV, SHE projects present a balance between high and low efficiency. PI projects are situated more in the low-efficiency quartile. The increasing complexity forces the PMO to make riskier decisions and deal with more uncertainty, reflecting lower efficiency. Finally, RM projects have higher than average efficiency in this class. The reason is that, in this range of high investment value, a large part of the projects is linked to purchasing new equipment, which requires more management efforts, as they can be reflected in the loss of new revenue opportunities.
Table 10 presents correlation analyses for each class of projects, which is a useful tool for performance evaluation [
66]. Bold highlights indicate moderate or strong correlations, while underlined highlights point to weak or very weak correlations with efficiency.
Correlation and benchmark analysis complement each other. The second one highlights the key variables that have the greatest impact on efficiency, while the first identifies the DMUs that should serve as a reference for guiding future initiatives. The two reference variables for the three classes are Output02 and Output03, respectively, the disparity between the project’s actual and initially planned completion date and the planned period required for the project. Synthesizing, the variables with the most significant positive influence on efficiency are Output2 and Output3. Hence, forthcoming initiatives should concurrently emphasize greater accuracy in meeting deadlines and reducing the estimated time to completion.
5. Conclusions
This research contributes to knowledge by examining PM efficiency. This discussion holds significance for project managers as it aids in the identification of variables that exhibit a stronger correlation with project efficiency. These identified variables can then be the focal point of future improvement initiatives in PM practices.
Within the academic domain, this research enhances our comprehension of project portfolio management processes. Unlike many existing studies that primarily concentrate on factors such as costs, time-to-completion, and adherence to project scope, this study delves into the intricacies of project complexity. Moreover, it is outstanding for investigating the interplay between project performance, PMO strategic decisions, project classifications, and complexity. To the best of our knowledge, based on a review of recent literature, no prior research has established a correlation between efficiency outcomes and the complexity of projects in conjunction with the PMO’s activities.
Comparing the conclusions drawn in this study with findings from existing literature yields insights. [
67] examined the role of active PMOs in 35 companies, specifically in relation to project performance metrics encompassing time, cost, and scope. The study revealed that the attainment of targets in these dimensions (time, cost, and scope) was less dependent on the PMO’s activities. Instead, the research suggested that PMOs wielded a more pronounced influence on project maturity, portfolio value, and the achievement of strategic objectives. [
5] introduced a model for assessing PMO efficiency within the software industry, employing a multicriteria approach. The study scrutinized project efficiency while interlinking it with PMO activities. It is worth noting that this study relied solely on practitioners’ viewpoints, thus introducing a degree of uncertainty into the analysis.
From a theoretical perspective, this research offers a valuable contribution by presenting an evaluation model that encompasses novel variables, extending beyond the conventional aspects of scope, cost, and time. Notably, it factors in parameters such as the number of interfaces and specialties involved. The outcomes of this study pinpoint the most proficient DMUs, serving as internal benchmarks to guide the management of forthcoming projects and shape strategies for enhancement. It is worth highlighting that the analysis highlights 35 out of 124 benchmark projects, underscoring the company’s substantial pool of high-performing projects that can provide valuable insights for strategic decision-making in future endeavors.
From a managerial perspective, this research supplies pertinent information concerning the efficiency outcomes of each project. This evaluation takes into account the PMO’s performance in relation to the project’s maturity level, class, and distinctive characteristics. Consequently, it facilitates the formulation of a strategy centered around benchmark projects and project efficiency. This, in turn, empowers the PMO to make informed decisions and take targeted actions in areas where further improvement is required, ultimately ensuring superior project outcomes.
The results confirm that Class IV projects, characterized by their extensive scope, increased deliverables, and heightened demand for PMO engagement, consistently yield superior efficiency averages throughout the entire study period. Notably, projects aimed at reducing equipment downtime and value-adding projects exhibit enhanced efficiency. This enhancement is attributed to the PMO’s dual role as a standardizer and advisor, directly impacting deliverables across project classes. Enhanced efficiency is particularly pronounced when the PMO takes a more active role and collaborates closely with project teams, as observed in Class IV projects. In summary, the strategic decisions made by the PMO have a positive impact on project outcomes throughout their lifecycle, resulting in improved efficiency.
The primary limitations of this study include: (i) focusing only on a single industrial plant, which precluded replication of results across different international industrial facilities; and (ii) excluding routine maintenance projects and projects involving simple purchases (class I). Such an omission could potentially impact and skew the results of the DEA model. For further research, it would be beneficial to replicate the evaluation using the internal benchmarking method employed in this study. Additionally, external benchmarking could be conducted across various international industrial facilities within the company under examination. Such an approach could help in identifying best practices that would positively influence the PMO’s effectiveness. Finally, future research should prioritize investigating management techniques that increase the likelihood of completing projects within their specified deadlines.
Author Contributions
Conceptualization, M.B.C. and D.P.L.; methodology, F.A.S.P.; software, M.B.C. and F.A.S.P.; validation, D.O.d.S., F.A.S.P. and M.A.S.; formal analysis, F.A.S.P.; investigation, M.B.C.; resources, D.P.L. and M.A.S.; data curation, F.A.S.P.; writing—original draft preparation, M.B.C.; writing—review and editing, M.A.S.; visualization, D.O.d.S.; supervision, D.P.L.; project administration, D.P.L.; funding acquisition, D.P.L. and M.A.S. All authors have read and agreed to the published version of the manuscript.
Funding
This research is funded by CAPES, FAPERGS, and CNPq, Brazilian research agencies, under grant numbers 88887.343299/2019-00 (CAPES), 22/2551-0000625-6 (FAPERGS), and 311924/2020-4 and 303496/2022-3 (CNPq), respectively. The APC was funded by co-author M.A.S.
Data Availability Statement
Data are contained within the article.
Conflicts of Interest
The authors declare no conflict of interest.
Appendix A
Table A1.
Gains for Class II projects.
Table A1.
Gains for Class II projects.
| DMU | Input01 | Input02 | Input03 | Input04 | Output01 | Output02 | Output03 |
|---|
| 1 | - | - | - | - | - | - | - |
| 2 | - | - | - | - | - | - | - |
| 3 | 0 | 0 | 0 | 0 | 5.77 | −49.46 | −0.04 |
| 4 | 0 | 0 | 0 | 0 | 0 | 0 | 0 |
| 5 | 0 | 571.75 | 0 | 35.28 | 1246.99 | −8415.89 | 216.19 |
| 6 | 0 | 0 | 0 | 0 | 0 | 0 | 0 |
| 7 | 1.50 | 38.63 | 0 | 68.85 | 501.26 | −842.20 | 122.19 |
| 8 | 0 | 0 | 1.67 | 0 | 3699.62 | −401.51 | 37.98 |
| 9 | 1.36 | 466.13 | 0 | 0 | 1034.80 | −1501.66 | 300.78 |
| 10 | 0 | 0 | 0 | 0 | 0 | 0 | 0 |
| 11 | 1.00 | 0 | 0 | 172.15 | 1.625.46 | −1945.41 | 96.49 |
| 12 | 2.36 | 0 | 0 | 0 | 1560.01 | −1083.43 | 89.33 |
| 13 | 0.50 | 584.06 | 0 | 110.05 | 2150.24 | −7184.99 | 212.97 |
| 14 | 0 | 0 | 0 | 0 | 1406.77 | −17.63 | 0 |
| 15 | 0 | 0 | 0 | 0 | 2135.29 | 0 | 0 |
| 16 | 0 | 289.24 | 1.93 | 0 | 240.36 | −17,328.95 | 0 |
| 17 | 0 | 0 | 0 | 32.37 | 2196.42 | −1055.73 | 0.96 |
| 18 | 0 | 0 | 0.81 | 0 | 781.24 | −6786.10 | 114.40 |
| 19 | 0 | 0 | 0 | 0 | 0 | 0 | 0 |
| 20 | 0 | 1380.59 | 0.15 | 0 | 4082.66 | −2510.22 | 262.08 |
| 21 | 1.00 | 251.79 | 0 | 111.09 | 2214.93 | −4365.94 | 142.80 |
| 22 | 0 | 0 | 0.52 | 0 | 2313.48 | −464.06 | 170.21 |
| 23 | 0.27 | 0 | 0 | 0 | 3137.11 | −4430.64 | 8.19 |
| 24 | 0 | 0 | 0 | 0 | 2062.92 | −170.48 | 0 |
| 25 | 0 | 320.22 | 2.54 | 0 | 1548.27 | −11,592.41 | 134.84 |
| 26 | 0 | 0 | 0 | 0 | 0 | 0 | 0 |
| 27 | 0 | 0 | 0 | 0 | 3682.39 | −73.74 | 34.41 |
| 28 | 0 | 0 | 0 | 0 | 0 | 0 | 0 |
| 29 | 0 | 0 | 0 | 0 | 2145.66 | 0.55 | 44.77 |
| 30 | 0 | 0 | 0 | 0 | 1345.51 | −67.30 | 19.44 |
| 31 | 0 | 0 | 0 | 0 | 1903.05 | −1341.03 | 3.44 |
| 32 | 1.67 | 0 | 1.84 | 0 | 1200.07 | −2548.64 | 78.71 |
| 33 | 0 | 0 | 0 | 0 | 0 | 0 | 0 |
| 34 | 0.70 | 194.10 | 0 | 1.62 | 810.07 | −5905.01 | 90.35 |
| 35 | 0 | 0 | 0 | 0 | 0 | 0 | 0 |
| 36 | 0 | 0 | 0 | 0 | 0 | 0 | 0 |
| 37 | 0 | 111.86 | 0.27 | 0 | 1178.82 | −319.25 | 91.74 |
| 38 | 0.31 | 136.74 | 1.34 | 0 | 128.41 | −289.35 | 8.55 |
| 39 | 1.53 | 0 | 3.24 | 24.06 | 1026.76 | −9039.35 | 71.75 |
| 40 | 0 | 0 | 0 | 19.74 | 2688.52 | −1444.51 | 81.02 |
| 41 | 0 | 0 | 0 | 0 | 2129.94 | −86.60 | 11.30 |
| 42 | 0 | 261.00 | 1.04 | 0 | 426.04 | −5028.66 | 15.27 |
| 43 | 1.50 | 0 | 0 | 87.53 | 336.05 | −987.47 | 38.37 |
| 44 | 0 | 0 | 0.65 | 0 | 2874.74 | −561.43 | 196.39 |
| 45 | 0 | 422.79 | 1.55 | 0 | 1835.61 | −2571.77 | 89.04 |
| 46 | 0 | 1056.74 | 0 | 16.35 | 0 | −6297.24 | 1.09 |
| 47 | 0 | 0 | 0 | 0 | 0 | 0 | 0 |
| 48 | 0 | 0 | 0 | 0 | 2546.70 | −2505.49 | 95.90 |
| 49 | 0 | 0 | 0 | 0 | 2419.11 | −234.68 | 46.48 |
Table A2.
Gains for Class III projects.
Table A2.
Gains for Class III projects.
| DMU | Input01 | Input02 | Input03 | Input04 | Output01 | Output02 | Output03 |
|---|
| 1 | - | - | - | - | - | - | - |
| 2 | - | - | - | - | - | - | - |
| 3 | 0 | 0.42 | 3018.99 | 0 | −1153.23 | −103.66 | 113.94 |
| 4 | 6835.88 | 0.46 | 0 | 1.25 | −3985.28 | −711.51 | 746.03 |
| 5 | 0 | 0 | 0 | 0 | 839.02 | −2114.01 | 503.34 |
| 6 | 7682.83 | 4.91 | 0 | 3.83 | −1401.25 | −182.12 | 0 |
| 7 | 0 | 0 | 0 | 0 | 0 | 0 | 0 |
| 8 | 0 | 0 | 0 | 0 | 0 | 0 | 0 |
| 9 | 2749.39 | 0.98 | 0 | 0 | −550.77 | −313.23 | 302.11 |
| 10 | 0 | 1.72 | 888.29 | 0.53 | −1226.74 | −390.47 | 229.33 |
| 11 | 0 | 0 | 0 | 0 | NA | NA | NA |
| 12 | 0 | 3.26 | 39.97 | 0.50 | −4190.59 | −58.68 | 4.15 |
| 13 | 0 | 3.19 | 849.17 | 3.89 | −839.32 | −504.36 | 368.91 |
| 14 | 3048.72 | 2.35 | 0 | 0.04 | −524.55 | −488.89 | 300.92 |
| 15 | 0 | 2.93 | 739.97 | 2.64 | −1359.73 | −538.79 | 380.95 |
| 16 | 7537.61 | 3.14 | 0 | 2.59 | −7834.91 | −83.98 | 4.21 |
| 17 | 0 | 4.78 | 407.61 | 5.78 | −3443.28 | −170.23 | 0 |
| 18 | 0 | 2.03 | 283.74 | 0.83 | −837.22 | −349.30 | 35.61 |
| 19 | 286.12 | 1.85 | 0 | 1.65 | −830.85 | −375.95 | 345.43 |
| 20 | 0 | 3.19 | 461.99 | 3.94 | 0 | −330.77 | 0 |
| 21 | 0 | 0 | 0 | 0 | 18.38 | −25.78 | 41.47 |
| 22 | 2601.86 | 0.37 | 0 | 0.12 | −952.90 | −460.57 | 358.25 |
| 23 | 0 | 0 | 0 | 0 | −4436.82 | 0 | 273.82 |
| 24 | 0 | 0 | 0 | 0 | −320.82 | 0 | 137.58 |
| 25 | 0 | 2.97 | 332.71 | 0.90 | −813.84 | −171.02 | 123.29 |
| 26 | 5658.11 | 0.32 | 0 | 0 | −4554.50 | 0 | 195.12 |
| 27 | 0 | 2.29 | 2583.57 | 1.20 | −1776.73 | −273.23 | 30.38 |
| 28 | 0 | 3.73 | 944.60 | 2.58 | −180.68 | −256.72 | 161.69 |
| 29 | 1560.17 | 0 | 579.89 | 0 | −1470.07 | −289.94 | 250.50 |
| 30 | 448.81 | 1.32 | 0 | 2.05 | −2332.93 | −614.48 | 612.90 |
| 31 | 0 | 1.52 | 705.96 | 1.66 | −4684.83 | −332.24 | 122.58 |
| 32 | 8547.82 | 1.25 | 0 | 0.09 | −2224.91 | −608.94 | 308.89 |
| 33 | 0 | 0 | 0 | 0 | 0 | 0 | 0 |
| 34 | 8973.58 | 2.88 | 0 | 1.93 | −2422.78 | −173.96 | 28.63 |
| 35 | 9925.02 | 1.40 | 0 | 0.10 | −860.21 | −423.79 | 349.88 |
| 36 | 1406.75 | 2.56 | 0 | 1.79 | −4329.26 | −96.41 | 92.98 |
| 37 | 0 | 0 | 0 | 0 | −526.45 | −27.71 | 247.72 |
| 38 | 0 | 1.31 | 129.04 | 0.17 | −956.46 | −286.47 | 16.35 |
| 39 | 0 | 0 | 0 | 0 | −19,835.83 | −48.40 | 246.69 |
| 40 | 3919.24 | 1.80 | 0 | 2.12 | −3959.68 | −209.44 | 3.50 |
| 41 | 0 | 2.10 | 270.75 | 1.06 | −709.23 | −315.71 | 0 |
| 42 | 0 | 4.99 | 692.97 | 2.96 | −1237.72 | −153.73 | 124.62 |
| 43 | 1528.40 | 1.35 | 0 | 2.99 | −1435.26 | −643.34 | 465.90 |
| 44 | 0 | 3.55 | 874.87 | 3.93 | −5433.56 | −54.29 | 96.29 |
| 45 | 0 | 0 | 0 | 0 | −0.34 | −191.41 | 427.00 |
| 46 | 0 | 0 | 0 | 0 | 0 | 0 | 0 |
| 47 | 0 | 1.91 | 279.38 | 0.65 | −1645.34 | −527.99 | 549.42 |
| 48 | 936.68 | 1.27 | 0 | 2.28 | −2448.52 | −237.73 | 178.59 |
| 49 | 0 | 0 | 0 | 0 | 148.50 | −460.96 | 192.65 |
| 50 | 0 | 0 | 0 | 0 | −1895.18 | −56.15 | 404.31 |
| 51 | 0 | 0 | 0 | 0 | −261.92 | −1094.77 | 410.80 |
| 52 | 8760.07 | 1.60 | 0 | 0.36 | −1497.24 | −309.97 | 167.68 |
| 53 | 0 | 0 | 0 | 0 | 231.07 | −1739.67 | 624.21 |
| 54 | 0 | 2.31 | 804.37 | 4.11 | −208.77 | −311.72 | 82.82 |
Table A3.
Gains for Class IV projects.
Table A3.
Gains for Class IV projects.
| DMU | Input01 | Input02 | Input03 | Input04 | Output01 | Output02 | Output03 |
|---|
| 1 | 0 | 0 | 0 | 0 | 0 | 0 | 0 |
| 2 | 0 | 0 | 0 | 0 | −240.39 | 0 | 373.44 |
| 3 | 0 | 0 | 0 | 0 | −4358.58 | 0 | 535.83 |
| 4 | 0 | 0 | 0 | 0 | 27.76 | −28.64 | 43.00 |
| 5 | 0 | 0 | 0 | 0 | 40.51 | 0 | 246.86 |
| 6 | 0 | 0 | 0 | 0 | 0 | 0 | 274.54 |
| 7 | 0 | 0 | 0 | 0 | 0 | 0 | 196.61 |
| 8 | 0 | 0 | 0 | 0 | −65.34 | 0 | 213.74 |
| 9 | 0 | 0 | 0 | 0 | −13.79 | 0 | 35.87 |
| 10 | 0 | 0 | 0 | 0 | −1842.23 | 0 | 244.98 |
| 11 | 0 | 0 | 0 | 0 | 0 | 0 | 0 |
| 12 | 0 | 0 | 0 | 0 | 0 | 0 | 598.75 |
| 13 | 0 | 0 | 0 | 0 | 0 | 0 | 0 |
| 14 | 0 | 0 | 0 | 0 | 0 | 0 | 0 |
| 15 | 0 | 0 | 1180.47 | 0 | −0.01 | −24.47 | 719.58 |
| 16 | 0 | 0 | 0 | 0 | −59.84 | −64.07 | 73.72 |
| 17 | 0 | 0 | 0 | 0 | 0 | 0 | 0 |
| 18 | 0 | 0 | 0 | 0 | −2177.17 | 69.43 | 237.59 |
| 19 | 0 | 0 | 0 | 0 | 0 | 0 | 0 |
| 20 | 0 | 0 | 0 | 0 | 0 | 0 | 0 |
| 21 | 0 | 0 | 0 | 2.06 | −146.62 | −232.34 | 13.56 |
| 22 | 0 | 0 | 0 | 0 | −428.24 | 0 | 246.19 |
| 23 | 0 | 0 | 0 | 0 | −223.86 | −166.01 | 288.18 |
| 24 | 0 | 0 | 0 | 0 | −13,035.16 | 0 | 319.57 |
| 25 | 9800.40 | 0 | 0 | 3.44 | −591.99 | −86.16 | 169.02 |
Appendix B
Table A4.
Average and weighted efficiencies for class II projects.
Table A4.
Average and weighted efficiencies for class II projects.
| DMU | Eff | Cost (R$M) | Eff.Ci | Time (Days) | Eff.Ti |
|---|
| 1 | - | - | - | - | - |
| 2 | - | - | - | - | - |
| 3 | 7.6% | 1870 | 142 | 264 | 0.46 |
| 4 | 4.4% | 3163 | 140 | 820 | 0.22 |
| 5 | 100.0% | 1583 | 1583 | 1525 | 4.00 |
| 6 | 39.4% | 3174 | 1252 | 718 | 1.18 |
| 7 | 44.5% | 1213 | 539 | 703 | 1.33 |
| 8 | 57.0% | 471 | 269 | 685 | 2.28 |
| 9 | 11.5% | 2690 | 309 | 1505 | 0.57 |
| 10 | 100.0% | 1933 | 1933 | 898 | 4.00 |
| 11 | 77.6% | 1429 | 1110 | 903 | 3.11 |
| 12 | 22.8% | 1200 | 273 | 769 | 1.14 |
| 13 | 71.4% | 1463 | 1045 | 1843 | 3.57 |
| 14 | 31.7% | 1037 | 329 | 295 | 1.27 |
| 15 | 50.1% | 3042 | 1523 | 734 | 3.00 |
| 16 | 100.0% | 1693 | 1693 | 600 | 6.00 |
| 17 | 57.8% | 3312 | 1915 | 963 | 2.89 |
| 18 | 100.0% | 1065 | 1065 | 564 | 3.00 |
| 19 | 100.0% | 2110 | 2110 | 292 | 5.00 |
| 20 | 69.1% | 184 | 127 | 2892 | 2.76 |
| 21 | 100.0% | 202 | 202 | 1095 | 4.00 |
| 22 | 81.3% | 245 | 199 | 1.034 | 1.63 |
| 23 | 40.6% | 1586 | 644 | 779 | 2.44 |
| 24 | 11.6% | 1016 | 118 | 518 | 0.46 |
| 25 | 99.8% | 1204 | 1202 | 1120 | 4.99 |
| 26 | 67.5% | 3856 | 2604 | 594 | 2.03 |
| 27 | 68.4% | 1498 | 1024 | 659 | 4.10 |
| 28 | 100.0% | 1282 | 1282 | 490 | 2.00 |
| 29 | 45.8% | 1198 | 549 | 463 | 1.83 |
| 30 | 69.3% | 1799 | 1246 | 414 | 4.16 |
| 31 | 46.3% | 1659 | 768 | 808 | 1.39 |
| 32 | 38.5% | 198 | 76 | 485 | 1.54 |
| 33 | 100.0% | 3783 | 3783 | 1499 | 3.00 |
| 34 | 100.0% | 91 | 91 | 408 | 3.00 |
| 35 | 17.9% | 3206 | 572 | 2466 | 0.36 |
| 36 | 6.0% | 2932 | 176 | 456 | 0.18 |
| 37 | 12.9% | 2105 | 272 | 1035 | 0.39 |
| 38 | 4.4% | 2447 | 107 | 537 | 0.13 |
| 39 | 100.0% | 232 | 232 | 261 | 5.00 |
| 40 | 83.3% | 503 | 420 | 937 | 2.50 |
| 41 | 66.8% | 1697 | 1134 | 663 | 2.00 |
| 42 | 100.0% | 443 | 443 | 499 | 2.00 |
| 43 | 57.4% | 1169 | 671 | 426 | 1.72 |
| 44 | 45.2% | 1215 | 549 | 1594 | 1.81 |
| 45 | 86.8% | 1577 | 1369 | 1987 | 4.34 |
| 46 | 100.0% | 3302 | 3302 | 2288 | 4.00 |
| 47 | 100.0% | 3060 | 3060 | 1637 | 2.00 |
| 48 | 23.3% | 1461 | 340 | 775 | 1.16 |
| 49 | 31.4% | 1997 | 627 | 939 | 1.26 |
| Effic. | 60.6% | | 55.8% | | 63.3% |
Table A5.
Average and weighted efficiencies for class III projects.
Table A5.
Average and weighted efficiencies for class III projects.
| DMU | Eff | Cost (R$M) | Eff.Ci | Time (Days) | Eff.Ti |
|---|
| 1 | - | - | - | - | - |
| 2 | - | - | - | - | - |
| 3 | 31.9% | 1490 | 475 | 3572 | 1139 |
| 4 | 5.8% | 12,136 | 699 | 1492 | 86 |
| 5 | 16.8% | 1990 | 334 | 2519 | 423 |
| 6 | 83.6% | 8711 | 7285 | 303 | 253 |
| 7 | 100.0% | 4472 | 4472 | 471 | 471 |
| 8 | 100.0% | 34 | 34 | 846 | 846 |
| 9 | 15.7% | 3928 | 615 | 439 | 69 |
| 10 | 34.3% | 1955 | 670 | 1478 | 507 |
| 11 | 0.0% | 5273 | 0 | 3268 | 0 |
| 12 | 43.3% | 3151 | 1364 | 799 | 346 |
| 13 | 21.3% | 1942 | 414 | 1471 | 314 |
| 14 | 41.6% | 4599 | 1912 | 523 | 217 |
| 15 | 24.3% | 2361 | 573 | 1473 | 357 |
| 16 | 25.7% | 14,079 | 3624 | 1597 | 411 |
| 17 | 100.0% | 1878 | 1878 | 911 | 911 |
| 18 | 61.6% | 1468 | 905 | 744 | 458 |
| 19 | 13.3% | 1961 | 260 | 518 | 69 |
| 20 | 82.8% | 619 | 512 | 736 | 609 |
| 21 | 92.1% | 1524 | 1404 | 633 | 583 |
| 22 | 28.4% | 4643 | 1318 | 632 | 179 |
| 23 | 13.1% | 1582 | 207 | 1385 | 181 |
| 24 | 59.5% | 6018 | 3579 | 470 | 279 |
| 25 | 19.9% | 1014 | 202 | 629 | 125 |
| 26 | 100.0% | 8716 | 8716 | 930 | 930 |
| 27 | 50.6% | 1879 | 951 | 3119 | 1578 |
| 28 | 23.3% | 707 | 165 | 1187 | 277 |
| 29 | 27.5% | 4006 | 1101 | 1275 | 350 |
| 30 | 8.1% | 3928 | 316 | 1025 | 83 |
| 31 | 33.3% | 4962 | 1655 | 1987 | 663 |
| 32 | 48.7% | 13,026 | 6343 | 1255 | 611 |
| 33 | 100.0% | 801 | 801 | 875 | 875 |
| 34 | 23.7% | 11,089 | 2629 | 550 | 130 |
| 35 | 33.6% | 11,538 | 3872 | 534 | 179 |
| 36 | 11.9% | 5429 | 643 | 1001 | 119 |
| 37 | 39.4% | 12,190 | 4799 | 1319 | 519 |
| 38 | 72.9% | 1488 | 1084 | 575 | 419 |
| 39 | 100.0% | 12,714 | 12,714 | 3063 | 3063 |
| 40 | 16.3% | 8400 | 1367 | 1089 | 177 |
| 41 | 38.3% | 1045 | 400 | 565 | 217 |
| 42 | 6.7% | 1252 | 83 | 1041 | 69 |
| 43 | 30.5% | 4169 | 1272 | 834 | 254 |
| 44 | 1.6% | 5331 | 84 | 2172 | 34 |
| 45 | 6.5% | 6931 | 449 | 1452 | 94 |
| 46 | 100.0% | 4827 | 4827 | 902 | 902 |
| 47 | 4.1% | 2629 | 108 | 1074 | 44 |
| 48 | 19.2% | 3646 | 700 | 724 | 139 |
| 49 | 100.0% | 6246 | 6246 | 3864 | 3864 |
| 50 | 21.8% | 1993 | 434 | 943 | 205 |
| 51 | 100.0% | 1904 | 1904 | 1133 | 1133 |
| 51 | 61.3% | 10,556 | 6471 | 562 | 344 |
| 53 | 100.0% | 1665 | 1665 | 923 | 923 |
| 54 | 54.6% | 1002 | 547 | 1141 | 623 |
| Effic. | 45.2% | | 43.6% | | 43.2% |
Table A6.
Average and weighted efficiencies for class IV projects.
Table A6.
Average and weighted efficiencies for class IV projects.
| DMU | Eff | Cost (R$M) | Eff.Ci | Time (Days) | Eff.Ti |
|---|
| 1 | 100.0% | 17,300 | 17,300 | 1500 | 1500 |
| 2 | 35.5% | 4596 | 1634 | 1000 | 355 |
| 3 | 2.6% | 1833 | 47 | 1582 | 41 |
| 4 | 100.0% | 15,720 | 15,720 | 1811 | 1811 |
| 5 | 59.8% | 3876 | 2317 | 1305 | 780 |
| 6 | 40.1% | 2910 | 1167 | 765 | 307 |
| 7 | 38.7% | 1086 | 420 | 751 | 291 |
| 8 | 24.5% | 1475 | 361 | 603 | 148 |
| 9 | 88.3% | 1876 | 1656 | 519 | 458 |
| 10 | 43.3% | 18,575 | 8047 | 1239 | 537 |
| 11 | 100.0% | 11,800 | 11,800 | 858 | 858 |
| 12 | 29.7% | 10,736 | 3189 | 630 | 187 |
| 13 | 100.0% | 1939 | 1939 | 1633 | 1633 |
| 14 | 100.0% | 13,383 | 13,383 | 706 | 706 |
| 15 | 14.1% | 8583 | 1207 | 2307 | 324 |
| 16 | 100.0% | 1428 | 1428 | 1125 | 1125 |
| 17 | 100.0% | 1820 | 1820 | 842 | 842 |
| 18 | 100.0% | 38,063 | 38,063 | 479 | 479 |
| 19 | 100.0% | 753 | 753 | 678 | 678 |
| 20 | 100.0% | 180 | 180 | 153 | 153 |
| 21 | 57.6% | 5998 | 3458 | 849 | 489 |
| 22 | 59.1% | 3793 | 2243 | 621 | 367 |
| 23 | 32.4% | 1546 | 501 | 1271 | 412 |
| 24 | 100.0% | 19,116 | 19,116 | 2272 | 2272 |
| 25 | 52.3% | 14,645 | 7660 | 1014 | 530 |
| Effic. | 67.1% | | 76.5% | | 65.2% |
References
- Taher, M.; Almansoori, S.; Rahman, I.; Memon, A. International Journal of Sustainable Construction Engineering and Technology Correlation Between the Management Factors Affecting PMO Implementation in UAE Construction. Int. J. Sustain. Constr. Eng. Technol. 2021, 12, 155–165. [Google Scholar]
- Sun, X.; Zhu, F.; Sun, M.; Müller, R.; Yu, M. Facilitating Efficiency and Flexibility Ambidexterity in Project-Based Organizations: An Exploratory Study of Organizational Antecedents. Proj. Manag. J. 2020, 51, 556–572. [Google Scholar] [CrossRef]
- Yeganeh, F.T.; Zegordi, S.H. A multi-objective optimization approach to project scheduling with resiliency criteria under uncertain activity duration. Ann. Oper. Res. 2020, 285, 161–196. [Google Scholar] [CrossRef]
- Hansen, Z.N.L.; Haug, A.; Afandi, S.; Hvam, L. Complexity management in project organisations. Prod. Eng. 2021, 15, 361–370. [Google Scholar] [CrossRef]
- Viglioni, T.G.; Cunha, J.A.O.; Moura, H.P. A Performance Evaluation Model for Project Management Office Based on a Multicriteria Approach. Procedia Comput. Sci. 2016, 100, 955–962. [Google Scholar] [CrossRef]
- Le Dinh, T.; Van, T.; Nomo, T. A framework for knowledge management in project management offices. J. Mod. Proj. Manag. 2015, 3, 22–35. [Google Scholar] [CrossRef]
- Oliveira, R.R.; Martins, H.C. Strategy, people and operations as influencing agents of the project management office performance: An analysis through structural equation modeling. Gest. Prod. 2018, 25, 410–429. [Google Scholar] [CrossRef]
- Philbin, S.; Kaur, R. Measuring PMO Performance—Application of the Balanced Scorecard in a Collaborative Research Context. J. Mod. Proj. Manag. 2020, 7, 1–21. [Google Scholar] [CrossRef]
- Al Khoori, A.A.A.G.; Affairs, M.O.P.; Hamid, M.S.R.A.; Melaka, U.T.M. Success Factors of PMO Implementation for UAE Project-Based Organizations. Int. J. Sustain. Constr. Eng. Technol. 2022, 13, 224–237. [Google Scholar] [CrossRef]
- Van Der Linde, J.; Steyn, H. The effect of a project management office on project and organisational performance: A case study. S. Afr. J. Ind. Eng. 2016, 27, 151–161. [Google Scholar] [CrossRef]
- Oliveira, R.R.; Martins, H.C. Project management office performance: Divergence of the perceptions between academic instruction and professional experience. Innovar 2020, 30, 119–134. [Google Scholar] [CrossRef]
- Favoretto, C.; de Carvalho, M.M. An analysis of the relationship between knowledge management and project performance: Literature review and conceptual framework. Gest. Prod. 2021, 28, 1–21. [Google Scholar] [CrossRef]
- Piran, F.; Camanho, A.; Silva, M.; Lacerda, D. Internal Benchmarking for Efficiency Evaluations Using Data Envelopment Analysis: A Review of Applications and Directions for Future Research. Adv. Math. Methods Econ. Effic. Anal. Theory Empir. Appl. 2023, 642, 143–162. [Google Scholar]
- Carpinetti, L.C.; de Melo, A.M. What to benchmark? A systematic approach and cases. Benchmarking Int. J. 2002, 9, 244–255. [Google Scholar] [CrossRef]
- Desouza, K.C.; Evaristo, J.R. Project management offices: A case of knowledge-based archetypes. Int. J. Inf. Manag. 2006, 26, 414–423. [Google Scholar] [CrossRef]
- Wood, A.J.; Rodgers, C.; Hai, T. Selection and engagement of professional consulting services: Decision-making processes used by project management offices in South Australia. J. Mod. Proj. Manag. 2022, 9, 124–137. [Google Scholar]
- Bredillet, C.; Tywoniak, S.; Tootoonchy, M. Why and how do project management offices change? A structural analysis approach. Int. J. Proj. Manag. 2018, 36, 744–761. [Google Scholar] [CrossRef]
- Braun, T. Configurations for Interorganizational Project Networks: The Interplay of the PMO and Network Administrative Organization. Proj. Manag. J. 2018, 49, 53–61. [Google Scholar] [CrossRef]
- Patanakul, P. How to Achieve Effectiveness in Project Portfolio Management. IEEE Trans. Eng. Manag. 2022, 69, 987–999. [Google Scholar] [CrossRef]
- Tshuma, B.; Steyn, H.; van Waveren, C.C. The mediation role of the PMO in the transfer of knowledge between projects—A case study of five PMOs. Int. J. Manag. Proj. Bus. 2022, 15, 150–174. [Google Scholar] [CrossRef]
- Müller, R.; Glückler, J.; Aubry, M.; Shao, J. Project Management Knowledge Flows in Networks of Project Managers and Project Management Offices: A Case Study in the Pharmaceutical Industry. Proj. Manag. J. 2013, 44, 4–19. [Google Scholar] [CrossRef]
- Kutsch, E.; Ward, J.; Hall, M.; Algar, J. The Contribution of the Project Management Office: A Balanced Scorecard Perspective. Inf. Syst. Manag. 2015, 32, 105–118. [Google Scholar] [CrossRef]
- Dai, C.X.; Wells, W.G. An exploration of project management office features and their relationship to project performance. Int. J. Proj. Manag. 2004, 22, 523–532. [Google Scholar] [CrossRef]
- Yesica, N.; Jerahmeel, G.; Ichsan, M.; Kertapati, M.S.; Aditya, R.B.; Pradana, A. Project management office manager’s competences: Systematic literature review. Int. J. Proj. Organ. Manag. 2023, 15, 253–278. [Google Scholar] [CrossRef]
- Khoori, G.; Hamid, M. Topology of Project Management Office in United Arab Emirates Project-Based Organizations. Int. J. Sustain. Constr. Eng. Technol. 2022, 4, 8–20. [Google Scholar] [CrossRef]
- Ko, J.-H.; Park, S.-H.; Kim, D.-C. Efficiency Analysis of Project Management Offices for Large-scale Information System Projects: Insights for Construction Megaprojects. Constr. Econ. Build. 2015, 15, 34–47. [Google Scholar] [CrossRef]
- Aubry, M.; Hobbs, B.; Thuillier, D. A new framework for understanding organisational project management through the PMO. Int. J. Proj. Manag. 2007, 25, 328–336. [Google Scholar] [CrossRef]
- Wiewiora, A.; Chang, A.; Smidt, M. Individual, project and organizational learning flows within a global project-based organization: Exploring what, how and who. Int. J. Proj. Manag. 2020, 38, 201–214. [Google Scholar] [CrossRef]
- Tsaturyan, T.; Müller, R. Integration and governance of multiple project management offices (PMOs) at large organizations. Int. J. Proj. Manag. 2015, 33, 1098–1110. [Google Scholar] [CrossRef]
- Paton, S.; Andrew, B. The role of the Project Management Office (PMO) in product lifecycle management: A case study in the defence industry. Int. J. Prod. Econ. 2019, 208, 43–52. [Google Scholar] [CrossRef]
- Hobbs, B.; Aubry, M.; Thuillier, D. The project management office as an organisational innovation. Int. J. Proj. Manag. 2008, 26, 547–555. [Google Scholar] [CrossRef]
- Aubry, M.; Müller, R.; Glückler, J. Exploring PMOs through Community of Practice Theory. Proj. Manag. J. 2011, 42, 42–56. [Google Scholar] [CrossRef]
- Spalek, S. Improving Industrial Engineering Performance through a Successful Project Management Office. Eng. Econ. 2013, 24, 88–98. [Google Scholar] [CrossRef]
- Ko, J.H.; Kim, D. The Effects of Maturity of Project Portfolio Management and Business Alignment on PMO Efficiency. Sustainability 2019, 11, 238. [Google Scholar] [CrossRef]
- Grandage, A.J. Advancing capital project management. J. Public Budg. Account. Financ. Manag. 2021, 33, 618–634. [Google Scholar] [CrossRef]
- Anantatmula, V.S.; Rad, P.F. Role of Organizational Project Management Maturity Factors on Project Success. Eng. Manag. J. 2018, 30, 165–178. [Google Scholar] [CrossRef]
- Aubry, M.; Richer, M.-C.; Lavoie-Tremblay, M. Governance performance in complex environment: The case of a major transformation in a university hospital. Int. J. Proj. Manag. 2014, 32, 1333–1345. [Google Scholar] [CrossRef]
- Unger, B.N.; Gemünden, H.G.; Aubry, M. The three roles of a project portfolio management office: Their impact on portfolio management execution and success. Int. J. Proj. Manag. 2012, 30, 608–620. [Google Scholar] [CrossRef]
- Pemsel, S.; Wiewiora, A. Project management office a knowledge broker in project-based organisations. Int. J. Proj. Manag. 2013, 31, 31–42. [Google Scholar] [CrossRef]
- Hobbs, B.; Aubry, M. A Multi-Phase Research Program Investigating Project Management Offices (PMOS): The Results of Phase 1. Proj. Manag. J. 2007, 38, 74–86. [Google Scholar] [CrossRef]
- Jalal, M.P.; Koosha, S.M. Identifying organizational variables affecting project management office characteristics and analyzing their correlations in the Iranian project-oriented organizations of the construction industry. Int. J. Proj. Manag. 2015, 33, 458–466. [Google Scholar] [CrossRef]
- Tywoniak, S.; Tootoonchy, M.; Bredillet, C. Grasping the dynamics of co-evolution between pmo and pfm: A box-changing multilevel exploratory research grounded in a routine perspective. J. Mod. Proj. Manag. 2015, 2, 90–107. [Google Scholar] [CrossRef]
- Müller, R.; Drouin, N.; Sankaran, S. Modeling Organizational Project Management. Proj. Manag. J. 2019, 50, 499–513. [Google Scholar] [CrossRef]
- Sandhu, M.A.; Al Ameri, T.Z.; Wikström, K. Benchmarking the strategic roles of the project management office (PMO) when developing business ecosystems. Benchmarking Int. J. 2019, 26, 452–469. [Google Scholar] [CrossRef]
- Sergeeva, N.; Ali, S. The Role of the Project Management Office (PMO) in Stimulating Innovation in Projects Initiated by Owner and Operator Organizations. Proj. Manag. J. 2020, 51, 440–451. [Google Scholar] [CrossRef]
- Arbabi, H.; Salehi-Taleshi, M.-J.; Ghods, K. The role of project management office in developing knowledge management infrastructure. Eng. Constr. Arch. Manag. 2020, 27, 3261–3287. [Google Scholar] [CrossRef]
- Hadi, A.; Liu, Y.; Li, S. Transcending the silos through project management office: Knowledge transactions, brokerage roles, and enabling factors. Int. J. Proj. Manag. 2022, 40, 142–154. [Google Scholar] [CrossRef]
- Ershadi, M.; Jefferies, M.; Davis, P.; Mojtahedi, M. Comparative Analysis of PMO Functions between the Public and Private Sectors: Survey of High-Performing Construction Organizations. J. Constr. Eng. Manag. 2021, 147, 04021151. [Google Scholar] [CrossRef]
- Ichsan, M.; Sadeli, J.; Jerahmeel, G.; Yesica, Y. The role of project management office (PMO) manager: A qualitative case study in Indonesia. Cogent Bus. Manag. 2023, 10, 2210359. [Google Scholar] [CrossRef]
- Bruwer, M.; Scholtz, S.E.; De Beer, L.T.; Rothmann, J.C. The Human Capital Risk Reporting of Listed South African Companies: Exploring a Reporting Framework to Support Corporate Governance. Adm. Sci. 2022, 12, 123. [Google Scholar] [CrossRef]
- Nara, E.O.B.; Sordi, D.C.; Schaefer, J.L.; Schreiber, J.N.C.; Baierle, I.C.; Sellitto, M.A.; Furtado, J.C. Prioritization of OHS key performance indicators that affecting business competitiveness—A demonstration based on MAUT and Neural Networks. Saf. Sci. 2019, 118, 826–834. [Google Scholar] [CrossRef]
- Sellitto, M.; Murakami, F. Industrial symbiosis: A case study involving a steelmaking, a cement manufacturing, and a zinc smelting plant. Chem. Eng. Trans. 2018, 70, 211–216. [Google Scholar] [CrossRef]
- Ichsan, M.; Hamsal, M. The importance of PMO practices in strategic initiative implementation: An empirical study of Indonesian banks. Pertanika J. Soc. Sci. Humanit. 2019, 27, 49–61. [Google Scholar]
- Edwards, D.J.; Holt, G.D. Construction plant and equipment management research: Thematic review. J. Eng. Des. Technol. 2009, 7, 186–206. [Google Scholar] [CrossRef]
- Kosztyán, Z.T.; Pribojszki-Németh, A.; Szalkai, I. Hybrid multimode resource-constrained maintenance project scheduling problem. Oper. Res. Perspect. 2019, 6, 100129. [Google Scholar] [CrossRef]
- Barbalho, S.C.M.; de Toledo, J.C.; Farias, A.C.C. Transitions in Project Management Offices: A Framework Relating Functions, Success Factors and Project Performance in a High-Technology Company. Eng. Manag. J. 2021, 34, 357–373. [Google Scholar] [CrossRef]
- Aubry, M.; Hobbs, B. A Fresh Look at the Contribution of Project Management to Organizational Performance. Proj. Manag. J. 2011, 42, 3–16. [Google Scholar] [CrossRef]
- Barbalho, S.C.M.; de Toledo, J.C.; Rojic, J.; Sillos, M.d.A. Functions of project management offices in product development: Action research in a high-tech company. Production 2014, 24, 322–336. [Google Scholar] [CrossRef]
- Otra-Aho, V.J.; Arndt, C.; Bergman, J.-P.; Hallikas, J.; Kaaja, J. Impact of the PMOs’ Roles on Project Performance. Int. J. Inf. Technol. Proj. Manag. 2018, 9, 41–53. [Google Scholar] [CrossRef]
- Lacruz, A.; Cunha, E. Project management office in non-governmental organizations: An ex post facto study. Revista de Gestão 2018, 25, 212–227. [Google Scholar] [CrossRef]
- Beste, T.; Klakegg, O.J. Strategic change towards cost-efficient public construction projects. Int. J. Proj. Manag. 2022, 40, 372–384. [Google Scholar] [CrossRef]
- Duarte, R.; Deschamps, F.; de Lima, E.P.; Pepino, A.; Clavijo, R.M.G. Performance Management Systems for Project Management Offices: A Case-Based Study. Procedia Manuf. 2019, 39, 923–931. [Google Scholar] [CrossRef]
- Lalic, D.C.; Lalic, B.; Delić, M.; Gracanin, D.; Stefanovic, D. How project management approach impact project success? From traditional to agile. Int. J. Manag. Proj. Bus. 2022, 15, 494–521. [Google Scholar] [CrossRef]
- Ibrahim, M.W.; Hanna, A.; Kievet, D. Quantitative comparison of project performance between project delivery systems. J. Manag. Eng. 2020, 36, 04020082. [Google Scholar] [CrossRef]
- Sweis, R.J.; Jaradat, M. Project management performance of construction projects in Jordan: A comparative study of ISO 9001-certified and non-certified companies. TQM J. 2022, 34, 1341–1364. [Google Scholar] [CrossRef]
- Barbalho, S.C.M.; Reis, A.C.B.; Bitencourt, J.A.; Leão, M.C.L.D.A.; Da Silva, G.L. A Project Based Learning approach for Production Planning and Control: Analysis of 45 projects developed by students. Production 2017, 27, e20162259. [Google Scholar] [CrossRef][Green Version]
- Barbalho, S.; Silva, G.; Toledo, J. The impact analysis of functions of project management office on performance of triple constraint of new-product development projects. Dirección y Organización 2017, 61, 19–31. [Google Scholar]
| Disclaimer/Publisher’s Note: The statements, opinions and data contained in all publications are solely those of the individual author(s) and contributor(s) and not of MDPI and/or the editor(s). MDPI and/or the editor(s) disclaim responsibility for any injury to people or property resulting from any ideas, methods, instructions or products referred to in the content. |
© 2023 by the authors. Licensee MDPI, Basel, Switzerland. This article is an open access article distributed under the terms and conditions of the Creative Commons Attribution (CC BY) license (https://creativecommons.org/licenses/by/4.0/).


 ,
, 


