Article

An Organizational Perspective on Robotic Process Automation Adoption and Usage Factors

by
Daniel Durão
1,* and
António Palma dos Reis
2
1
Department of Management, ISEG School of Economics and Management, Universidade de Lisboa, 1200-181 Lisbon, Portugal
2
Department of Information Systems and Operations Management, ISEG School of Economics and Management, Universidade de Lisboa, 1200-181 Lisbon, Portugal
*
Author to whom correspondence should be addressed.
Appl. Syst. Innov. 2025, 8(2), 33; https://doi.org/10.3390/asi8020033
Submission received: 20 November 2024 / Revised: 1 January 2025 / Accepted: 3 January 2025 / Published: 4 March 2025

Abstract

:
The adoption of Information Technologies in organizations is a crucial decision for growth, productivity, competitiveness, and even survival in an increasingly competitive market. It highlights the growing importance of automation solutions such as Robotic Process Automation to achieve or maintain competitiveness. Although there is research on Robotic Process Automation, most of it focuses on technology, and what it can provide, rather than on the effective contribution to the better performance of organizations, which depends on adoption and use. This work studies the propensity to the adoption and usage of Robotic Process Automation. As a basis for the conceptual model of this research, the Diffusion of Innovation and Technology Organization Environment theoretical models were used in order to evaluate the propensity for adoption and use of Robotic Process Automation from an organizational perspective. This research uses mixed methods. Initially, in the exploratory phase, interviews were carried out to complement the information collected in the literature with a view to developing a model for assessing the propensity to use Robotic Process Automation, and, subsequently, hypotheses were made based on the existing literature and combined with the exploratory phase results; in addition, data from surveys collected from 141 organizations were utilized to evaluate the suggested model, as well as the underlying hypotheses. The findings suggest that it is in the technological context that the antecedents prove to be significant in the propensity for the adoption and use of Robotic Process Automation, namely Compatibility and Relative Advantage. The implications of these findings are discussed from a practical and research perspective.

1. Introduction

In order to achieve competitiveness, organizations tend to strive to improve the efficiency of their operations, with the need to reformulate their management, and, in this field, the emerging development of digital tools, especially Information Technologies (IT) is the key to achieving the efficiency improvement [1].
Robotic Process Automation (RPA) integrates a Lightweight (Lightweight IT), defined by a focus on business objectives, ease of experimentation, and user-centered solutions. Typically, these are solutions that do not alter the core structure of systems, as they leverage existing system resources and user interfaces. It is a term generally used to describe commercially available front-end software associated with applications for mobile devices, sensors, and devices, also known as the Internet of Things [2] automation approach and emerges as a solution to automate commercial and operational processes, which involve extensive labor and the risk of human error [3]. Its implementation is feasible in various areas of business processes and aims to increase company productivity, reduce costs, and create value, increasing customer satisfaction and improving the company’s competitiveness [4].
The adoption of RPA in the corporate environment has grown in recent years; consequently, it is anticipated that companies’ investment in this type of technology will follow the trend [4].
Despite the vast potential of RPA, it remains necessary to demonstrate its viability, its strengths, and its value to the various stakeholders [5]. Based on quantifiable measures, according to [6], with RPA, the cost of full-time employees can be reduced between 20% and 50% and the cost of processing per transaction can be reduced between 30% and 60%.
Previous studies on RPA have provided insights into its benefits, implementation process, and technical perspectives. However, we could not find a comprehensive study approach analyzing RPA adoption and usage which included organizational and strategic factors. Subsequently, there is a lack of knowledge regarding RPA adoption and usage from an organizational perspective, leaving a research gap. The potential of RPA to improve the performance of organizations recommends analyzing what assumptions or under what conditions organizations are most likely to adopt RPA. The article offers contributions for researchers and people who deal, in practice, with RPA. In the first case, it provides a validated model for estimating the organization’s propensity for the adoption and usage of RPA, confirming the usefulness of the TOE (Technology Organization Environment) for organizational-level studies. The article is also an additional example of the combination of qualitative and quantitative approaches when conducting an investigation.
The research question guiding this paper is: What are the main factors influencing organizations’ decision to adopt and use RPA?
This article is structured as follows: Section 1 provides the introduction and literature review, emphasizing the features of RPA and the theoretical framework, followed by the methodology, qualitative data analysis, the research model, and hypothesis in Section 2. The subsequent section, namely Section 3, describes the data and data analysis from the confirmatory study. This is followed by the discussion (Section 4). Finally, the conclusions, including limitations and implications of this research are presented (Section 5).

Literature Review

This literature review describes the characteristics of RPA and its potential contributions and addresses the two most influential theoretical frameworks for IT innovation adoption at the organizational level, DOI and TOE.
Currently, there is a great propensity to automate repetitive tasks with the aim of reducing human error and costs and improving response time [7]. This trend, in turn, implies new business processes [8] that may benefit from automation. There are several differences between RPA and other forms of automation, emphasizing the need to develop an integrated model to analyze the use of RPA. According to [9], RPA becomes a viable option to consider when the objective is driven by cost reduction, quality improvement, and efficiency. RPA can provide contributions in terms of (i) operational efficiency through cost reduction [10]; (ii) service quality, possible due to the reduction in the rate of human error [11]; (iii) ease of implementation and integration, allowing the transfer of information between various systems [12]; and (iv) risk and reliability management, inherent to the standardization of procedures, since it is possible to identify deviations in processes with greater transparency [1], as illustrated in Figure 1.
The increase in operational efficiency results from the reduction of time, cost, and human resources, as well as the reduction of manual work and workload, being noticeable in the reduction of process cycle time, task handling, waiting time [18], and errors caused by incorrect data entry and failed steps, among other human errors [19].
Compared to conventional back-end integration processes, RPA is comparatively simpler, more cost-effective to implement, configure, and maintain, and offers greater intuitiveness for users [20]. RPA replicates work processed by humans, uses user interfaces, and is integrated into the infrastructure of existing systems [21].
RPA reduces risk and increases reliability by monitoring the activities of human beings, triggering alerts whenever actions are performed that do not adhere to predefined rules [22].
The purpose of this investigation is to analyze the propensity to adopt and use RPA from an organizational perspective, with the unit of analysis being the organization. To study the use of RPA in organizations, theoretical support is needed to explain how innovations are adopted and used by organizations [23]. The two most prominent theoretical models of IT innovation adoption at the organizational level are the DOI (Diffusion of Innovation) theory proposed by [24] (first edition published in 1962) and the TOE proposed by [16]. The first emphasizes the characteristics of innovation, the second focuses on the context of innovation. Both were found to be significant in previous adoption studies [13].
Based on this theoretical basis and previous research with an organizational RPA perspective [5,6], we intend to determine the antecedents of the use of RPA.
The DOI theory attributes the organizational use of an innovation to its organizational attributes and characteristics. The authors of [24] propose five main characteristics: (i) Relative Advantage—innovation produces benefits for the organization; (ii) Compatibility—the innovation is compatible with the existing organization; (iii) Complexity—the degree of difficulty in using the innovation; (iv) Observability—the results of using the innovation are visible; and (v) Trialability—possibility for the innovation to be tried. According to [15], the most important and noteworthy characteristics are the initial three, that is, Relative Advantage, Compatibility, and Complexity.
The TOE framework emerges as an important theoretical perspective for the study of contextual factors. This theory identifies three aspects that can influence the use of a technological innovation at the organizational level: (i) technological context—describes the existing technologies and technical capacities in the organization; (ii) organizational context—characteristics of the organization such as size or quantity of resources available; and (iii) environmental context—organization’s business, its industry, its competitors, and commercial partners, the latter being an innovation in relation to the DOI theory [16]. The TOE framework has been used, for example, in the context of manufacturing industries [25,26], healthcare [27], retail, and financial services [26].
So, both the DOI and the TOE address the issue of technological innovation and organizational characteristics when related to adoption and use; however, the TOE provides additional contributions as it includes factors of the organizational environment. Their combination was used with the purpose of better explaining the adoption and use of RPA instead of using only one framework individually [14].

2. Methodology and Qualitative Data Analysis

In order to fill the identified gap in the literature, this research employed the mixed methods approach to examine the adoption and use of RPA. A well-structured mixed-methods approach enhances the validity of a conceptual model by integrating qualitative insights with quantitative data.
A sequential research design (qualitative followed by quantitative) was adopted, following [28], according to whom, a qualitative exploratory study allows the performance of a subsequent confirmatory study, and [29], who suggest that if the aim of a research investigation is to explore and assess theoretical concepts and mechanisms in a novel context, so a qualitative study followed by a quantitative analysis is suitable. The combination of methods provides better opportunities to respond to the formulated hypotheses [30].
The qualitative study provides a deeper contextual understanding; in this case, the interviews aimed to capture perceptions of the key determinants driving RPA adoption. On the other hand, the quantitative study ensures the statistical validation, generalization, and measurement of relationships between variables. For this study, a questionnaire was designed based on theoretical RPA concepts and validated scales, adapted to the RPA context, with the goal of confirming the findings of the literature review and the exploratory study; that is, the development and validation of the nomological network based on data collected from 141 organizations. Figure 2 presents the outline of the investigation with the various stages developed to achieve the objectives of the study.
This integration ensures a more holistic understanding, strengthening the validity and applicability of the conceptual model across different contexts.

2.1. Exploratory Study

Given the novelty of the concept and the absence of theoretical models aimed at the determinants of RPA adoption, we conducted a study to validate the potential RPA adoption determinants and explore additional insights that could support future investigations. The empirical content was obtained from in-depth semi-structured interviews [31], with key informants [32], and published articles (e.g., [5,17,33,34], etc.).
Drawing on the value hierarchy outlined in Figure 1 and previous investigations, it appears that RPA is likely to improve operational efficiency and the quality of service, integrate and leverage the potential of existing information technology resources, reduce risk, and increase reliability.
The qualitative study aims to validate the definitions and measures of the factors that are likely to influence the propension for RPA adoption and use. The sample of interviewees was selected based on a purposeful sampling strategy; that is, only people with RPA knowledge or experience were selected. The diversity of sectors of operation of the individuals surveyed increases the usability of the results [35]. In Portugal, there is already a large number of organizations with investments in information technologies, and it is expected that, in 2023, according to IDC, 45% of Portuguese companies will increase their investment in digital initiatives and sustainable technologies by 10% [36].
The exploratory study selected 6 organizations (energy sector, postal services, banking, telecommunications) with significant use of RPA and interviewed one person familiar with RPA projects from each of these organizations. Additionally, an academic with RPA research was also interviewed. Appendix A presents the demographics of the respondents.
The number of interviews was determined by achieving saturation, the common standard for data gathering in qualitative studies [37]. Saturation was achieved at the 6th interview, with a previously scheduled interview also being carried out, with a total of 7 interviews being carried out. The interviews were carried out in 2021, each of which lasted for about 1 h and was carried out in Portuguese. These sessions were audio-recorded and subsequently transcribed. To clarify some reasonings in the transcription of the interviews, telephone conversations were carried out and emails were exchanged.

Exploratory Study Data Analysis and Results

The analysis of the responses to the interviews was carried out by counting the number of times each interviewee mentioned the factors driving RPA adoption in organizations. The results are presented in Table 1.
RPAs are presented as a solution to automate commercial and operational processes, carried out manually, which involve extensive labor and the risk of human error, aiming to increase the productivity of organizations, reduce costs, create value, increase customer satisfaction, and improve the competitiveness of the organization.
The results obtained provided information on the determinants that lead organizations to adopt RPA. The construct presented in Table 1 (and its components) on adoption determinants emerged from the literature review and was largely confirmed during the interviews. Several drivers were identified, with a particular emphasis on reducing routine work and increasing process quality/efficiency. RPA enables the automation of repetitive manual processes, helping to reduce the time spent on certain tasks, to prevent fatigue caused by such activities, to minimize human errors, and to increase employee satisfaction. The strategic reallocation of employees allows them to focus more on analytical and value-added tasks. Additionally, RPA promotes standardization, as robots follow predefined rules, ensuring process consistency and reducing operational risks, which, in turn, enhances quality and efficiency.

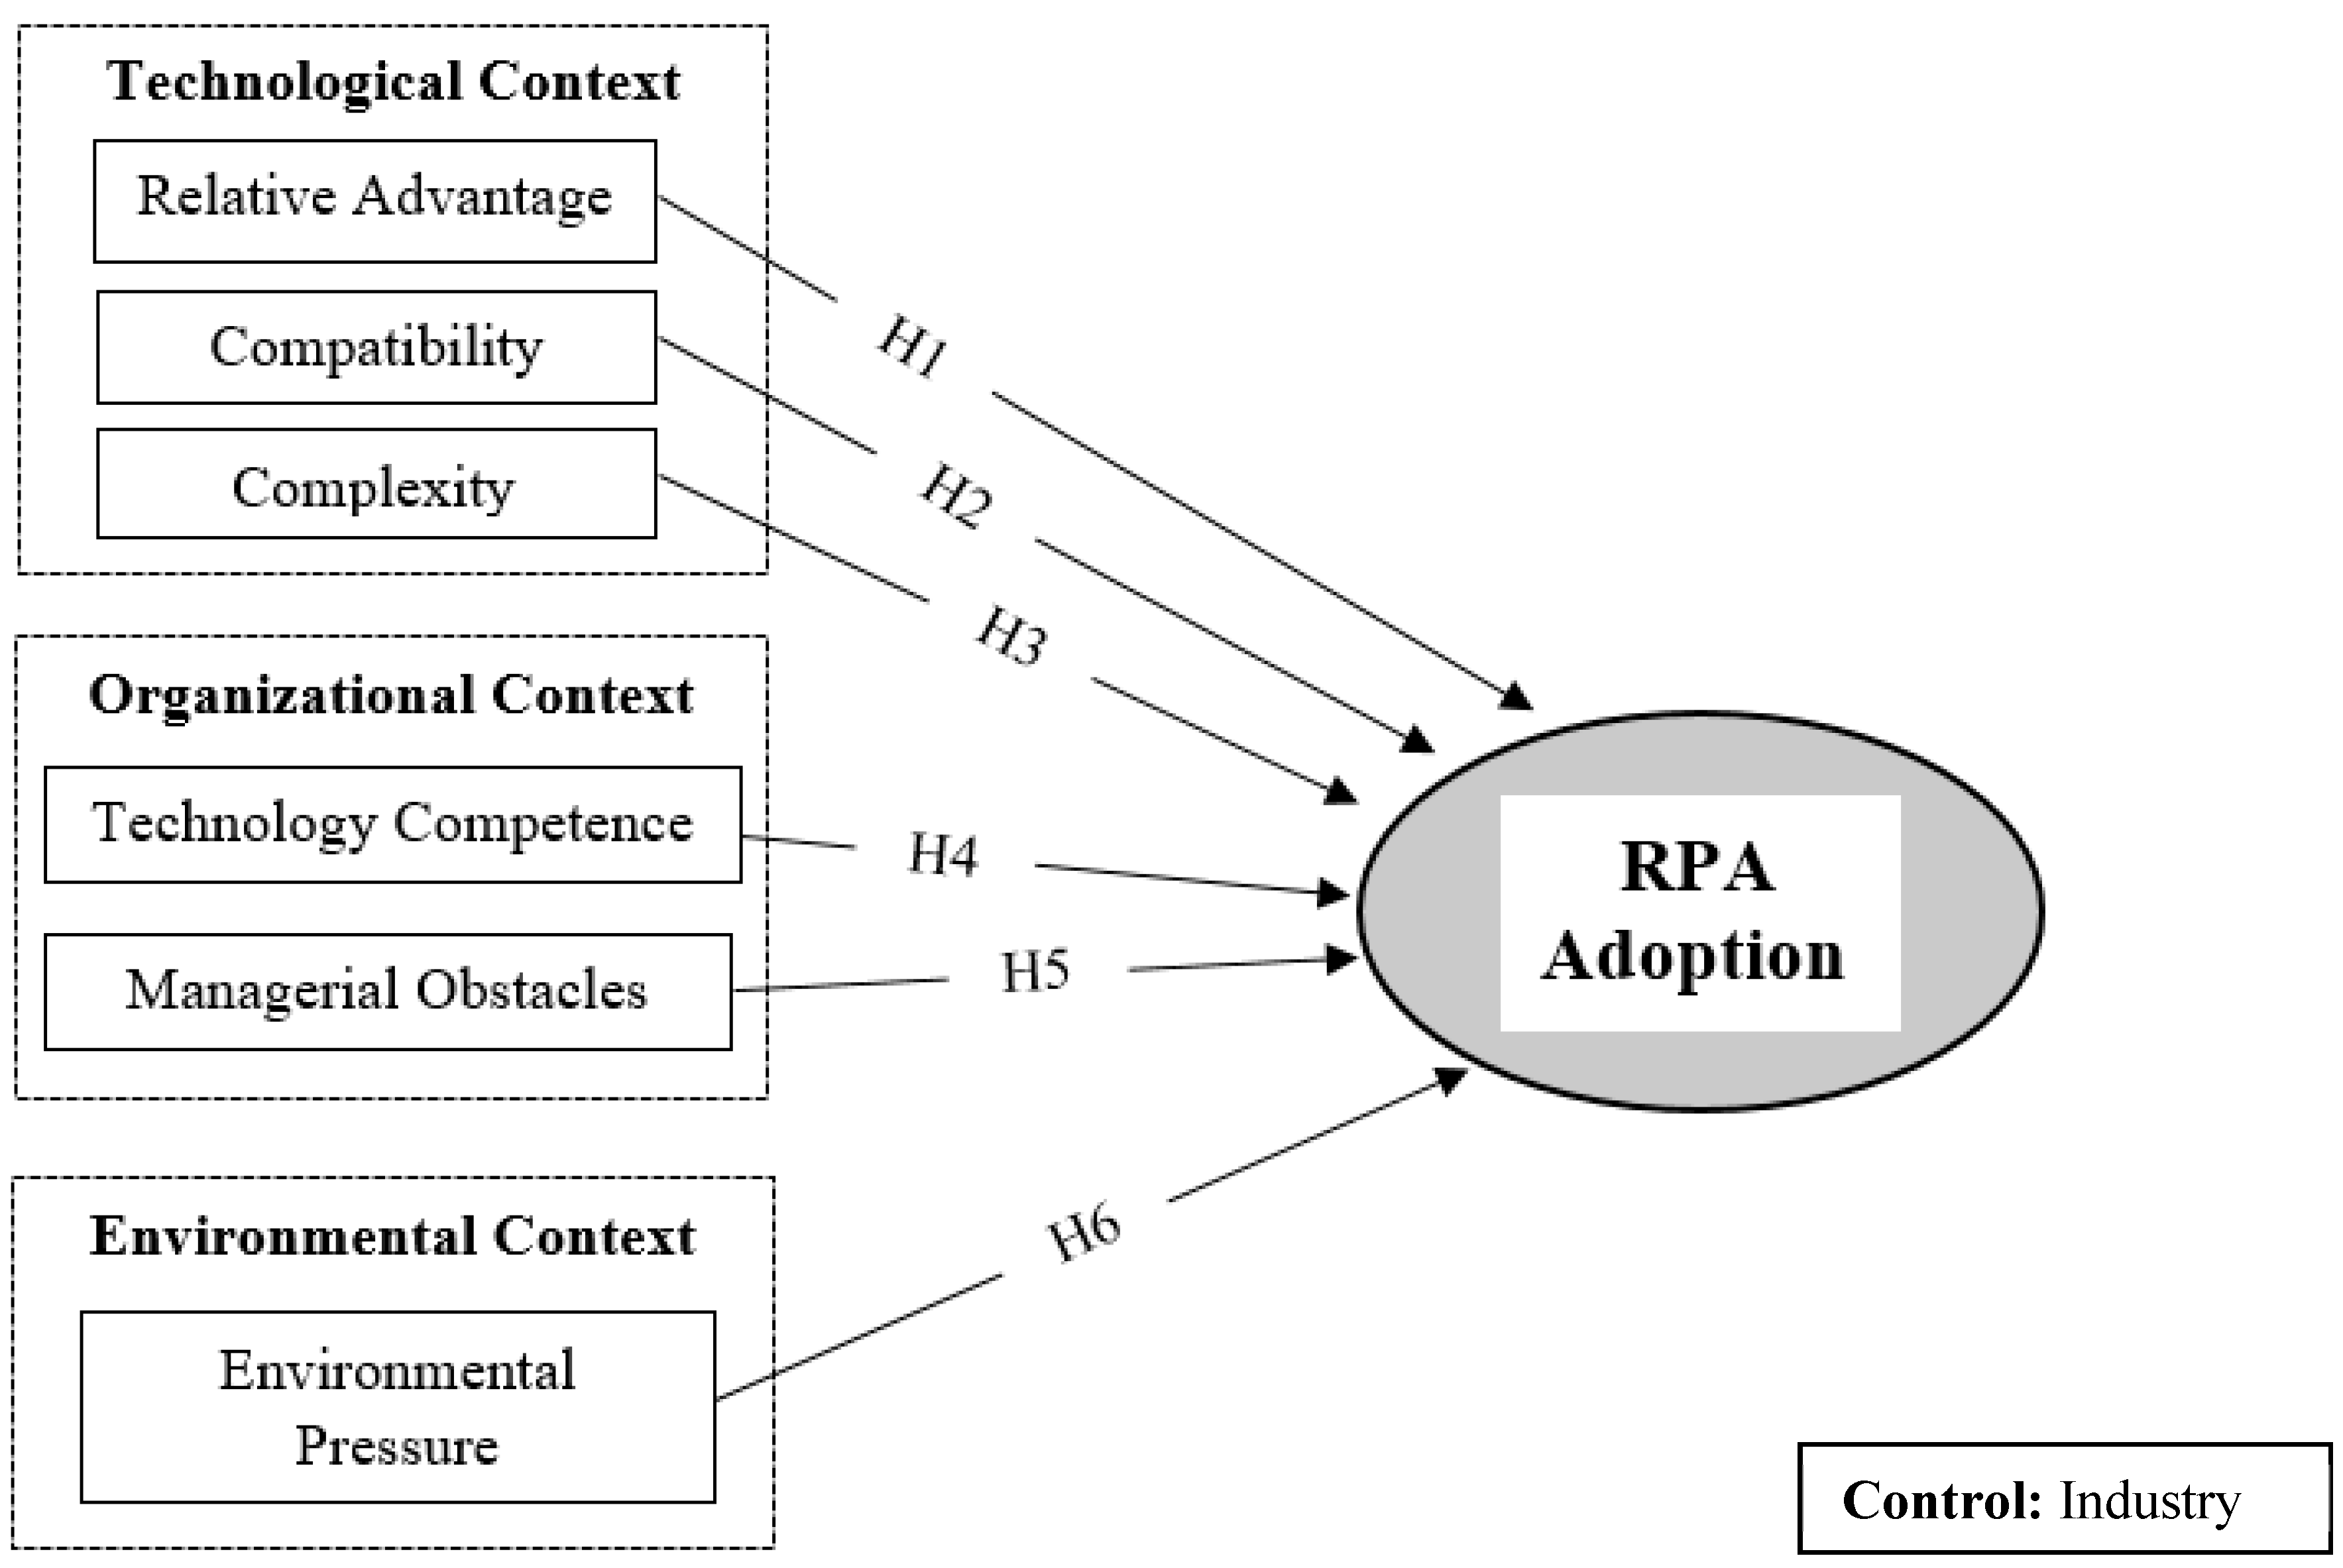
2.2. Research Model and Hypotheses

The determinants of the adoption and use of RPA in the research model (Figure 3) derive from the TOE and DOI, previous research on RPA ([38,39,40], etc.), as well as the exploratory study. The TOE allowed the identification of relevant categories; on the other hand, the DOI helped to identify the most relevant determinants related to technological and organizational factors. According to DOI theory, the contribution of an innovation is dependent on the level of use for conducting business activities [14].
However, due to the specificity of each organization arising from the sector in which it operates and the resources it has, the control variable industry was included in order to control possible variations. The control variable made it possible to divide organizations into two large sectors, namely, the production of goods and the provision of services.
In addition to the hypotheses based on TOE and DOI, previous research on RPA adoption [40] suggests that service industry firms are more likely to adopt RPAs than industrial firms, which confirms Hypothesis 7, as shown in Table 2.
Underlying the model proposed above, we consider the hypotheses listed below in Table 2.
Table 2. Hypotheses. Source: own elaboration.
HypothesesReferences
H1: The relative advantage over competitors increases with the adoption/use of RPA.Results from the exploratory study.
H2: Compatibility with other technologies increases the propensity to adopt/use RPA.Adapted from [41] and results from the exploratory study.
H3: The low complexity of RPA increases the propensity to adopt/use RPA.Results from the exploratory study.
H4: The organization’s technological competence increases the propensity to adopt/use RPA.Adapted from [40,41].
H5: Management obstacles in an organizational context reduce the propensity for adopting/using RPA.Adapted from [41].
H6: The environmental pressure that arises from the environmental context increases the propensity to adopt/use RPA.Adapted from [40].
H7: In the service industry, there is a greater propensity for the adoption and use of RPA.Adapted from [42].

2.3. Confirmatory Study

The quantitative study tests the research model through a questionnaire-based research approach. The questionnaire structure was built on the theoretical concepts of Robotic Process Automation (RPA), the results of the exploratory study, and scales tested and published adapted to fit the RPA context. For the antecedents of RPA use, items from the existing literature were adapted (see Appendix B). The nature of each construct (reflective or formative) must be taken into consideration [43]. When measures are used to analyze an underlying latent variable, and it is the latent variable that causes the measures, and these can be referred to as reflective indicators. When the indicators shape an underlying construct, they are causal or formative indicators [43]. Based on the aforementioned definitions and the set of decision rules proposed by [44], we classified the nature of each construct as presented in Appendix B.
As the survey was conducted in Portuguese, we adhered to the recommendations of [45] to implement the “back-translation” method to ensure correct translation into Portuguese. A pre-test was also conducted with two researchers for initial conceptual validation of the scales, and no changes were made at this stage. Subsequently, a pilot test was conducted with 30 senior executives from the Information Systems, Operations, and Marketing areas. Items that did not demonstrate reliability in the scales were then excluded. We followed [46] suggestions to assess the measurement model in terms of its internal consistency, convergent validity, and discriminant validity. Outer loadings represent the correlation between an item and the latent variable. According to [47], it is recommended to remove items with outer loadings of below 0.5 to ensure that the latent variable is well represented by its indicators, thereby increasing the construct’s validity and reliability. Retaining low-loading indicators could negatively impact convergent validity, reduce composite reliability, and lower the overall quality of the model. We eliminated three items with low outer loadings (less than 0.5), two from the latent variable Relative Advantage (RA1 and RA5) and one from the latent variable Environmental Pressure (EP5). As these items pertained to reflective constructs, there was no effect on the study outcomes, and the questionnaire retained its conceptual consistency.
The excluded items are labeled as removed in Table A2 (Appendix B).
The measurement model, as well as the structural model, considered the following constructs:
Relative Advantage, a reflexive construct combining the expectation to reduce costs (RA2), the expectation to reduce paperwork (RA3), and the expectation to help quick data capture and analysis (RA4), (Adapted from [14,48,49]).
Compatibility, a reflective construct combining the expectation that using RPA is compatible with your organization’s corporate culture (CT1), existing information infrastructure (CT2), existing applications (CT3), existing procedures (CT4), and users’ experience with similar systems (CT5) (adapted from [14,48,49]).
Complexity, a reflective construct assessing whether the company believes that RPA is complex to use (CX1) and whether RPA development is a complex process (CX2) (adapted from [49,50]).
Technology Competence, a formative construct evaluating the firm’s experience in supporting RPA software (TC1), the firm’s expertise in supporting RPA software (TC2), and the number of IT professionals working in or for the organization (TC3) (adapted from [49,51,52]).
Managerial Obstacles, a reflective construct evaluating the significance of obstacles to the organization’s ability to implement RPA, such as integrating RPA into the overall strategy and business processes (MO1), lack of staff with RPA expertise (MO2), insufficient top-management support (MO3), and an unfriendly RPA operating platform or interface (MO4) (adapted from [26,41,49,53]).
Environmental Pressure, a reflective construct evaluating the degree of agreement regarding whether the company experienced competitive pressure to implement RPA (EP1), whether ICT strongly influences competition in the industry (EP2), whether customers demand it (EP3), and whether it is needed to improve coordination between suppliers and customers (EP4) (adapted from [23,26,48,49]).

3. Data and Data Analysis

The sample was drawn from the Informa D&B company database, which contained organizations (small, medium, and large) operating in Portugal with Information Systems directors. The questionnaire was sent to 2.158 organizations via email (to the Director/Head of Information Systems, Operations, and Marketing departments). Considering the organization as the unit of analysis, it is relevant to obtain responses from the heads of these areas to obtain the most relevant perspectives [50]. Data collection took place between January and October 2023. We received a total of 141 responses, corresponding to 141 organizations, with response rates of approximately 7%.
The assessment of the measurement and structural models was conducted using PLS (Partial Least Squares) as the method for data analysis, given that the model includes both formative and reflective constructs and features complexity, with some constructs utilizing mixed scales [24]. Due to the predictive focus of the research framework, PLS is an appropriate approach [54].

3.1. Measurement Model

This study examines the measurement model through various analyses based on the type of construct (reflective or formative). Following the guidelines of [46,54], we evaluated the reflective measurement model through internal consistency, indicator reliability, convergent validity, and discriminant validity (Table A3 and Table A4 of Appendix C). We assessed internal consistency using Cronbach’s alpha and composite reliability.
All latent variables demonstrated good performance in terms of internal consistency with Cronbach’s alphas ranging from 0.76 to 0.95 and composite reliabilities between 0.75 and 0.96 (Table A3). Overall, the instrument exhibits good indicator reliability.
The convergent validity criterion states that the values of AVE (Average Variance Extracted) should be greater than 0.5. As seen in Table A3, all constructs exhibit AVE values above 0.5 (ranging from 0.58 to 0.83), indicating that the constructs represent a dimension and the same underlying construct. It also suggests that the latent variable can explain more than half of the variance of its indicators [16]. Discriminant validity was tested using two criteria: Fornell–Larcker, which asserts that AVEs should be greater than the squared correlations, and each indicator should have a higher correlation with its designated latent variable than with any other latent variable. Additionally, a cross-loadings analysis was performed. As observed in Table A4 and Table A5 (Appendix C), both criteria are satisfied for all constructs and indicators, indicating that the instrument has good discriminant validity.
For the assessment of the formative measurement model, multicollinearity and the significance and sign of the weights were evaluated, as presented in Table A6 (Appendix C). Multicollinearity was assessed using the Variance Inflation Factor (VIF). In this case, the VIF values were similar for both indicators, slightly above 7. In the literature, there is no strict and universal limit for what is considered acceptable or unacceptable, but VIFs between 5 and 10 may indicate moderate multicollinearity. Regarding the significance and sign of the weights, one indicator, “Technology Competence 1” (TC1), was found to be significant, while the other, “Technology Competence 2” (TC2), was not. However, after analyzing the outer loadings and following [24], it was observed that both TC1 and TC2 had outer loadings above 0.5, and therefore, both were retained in the model.

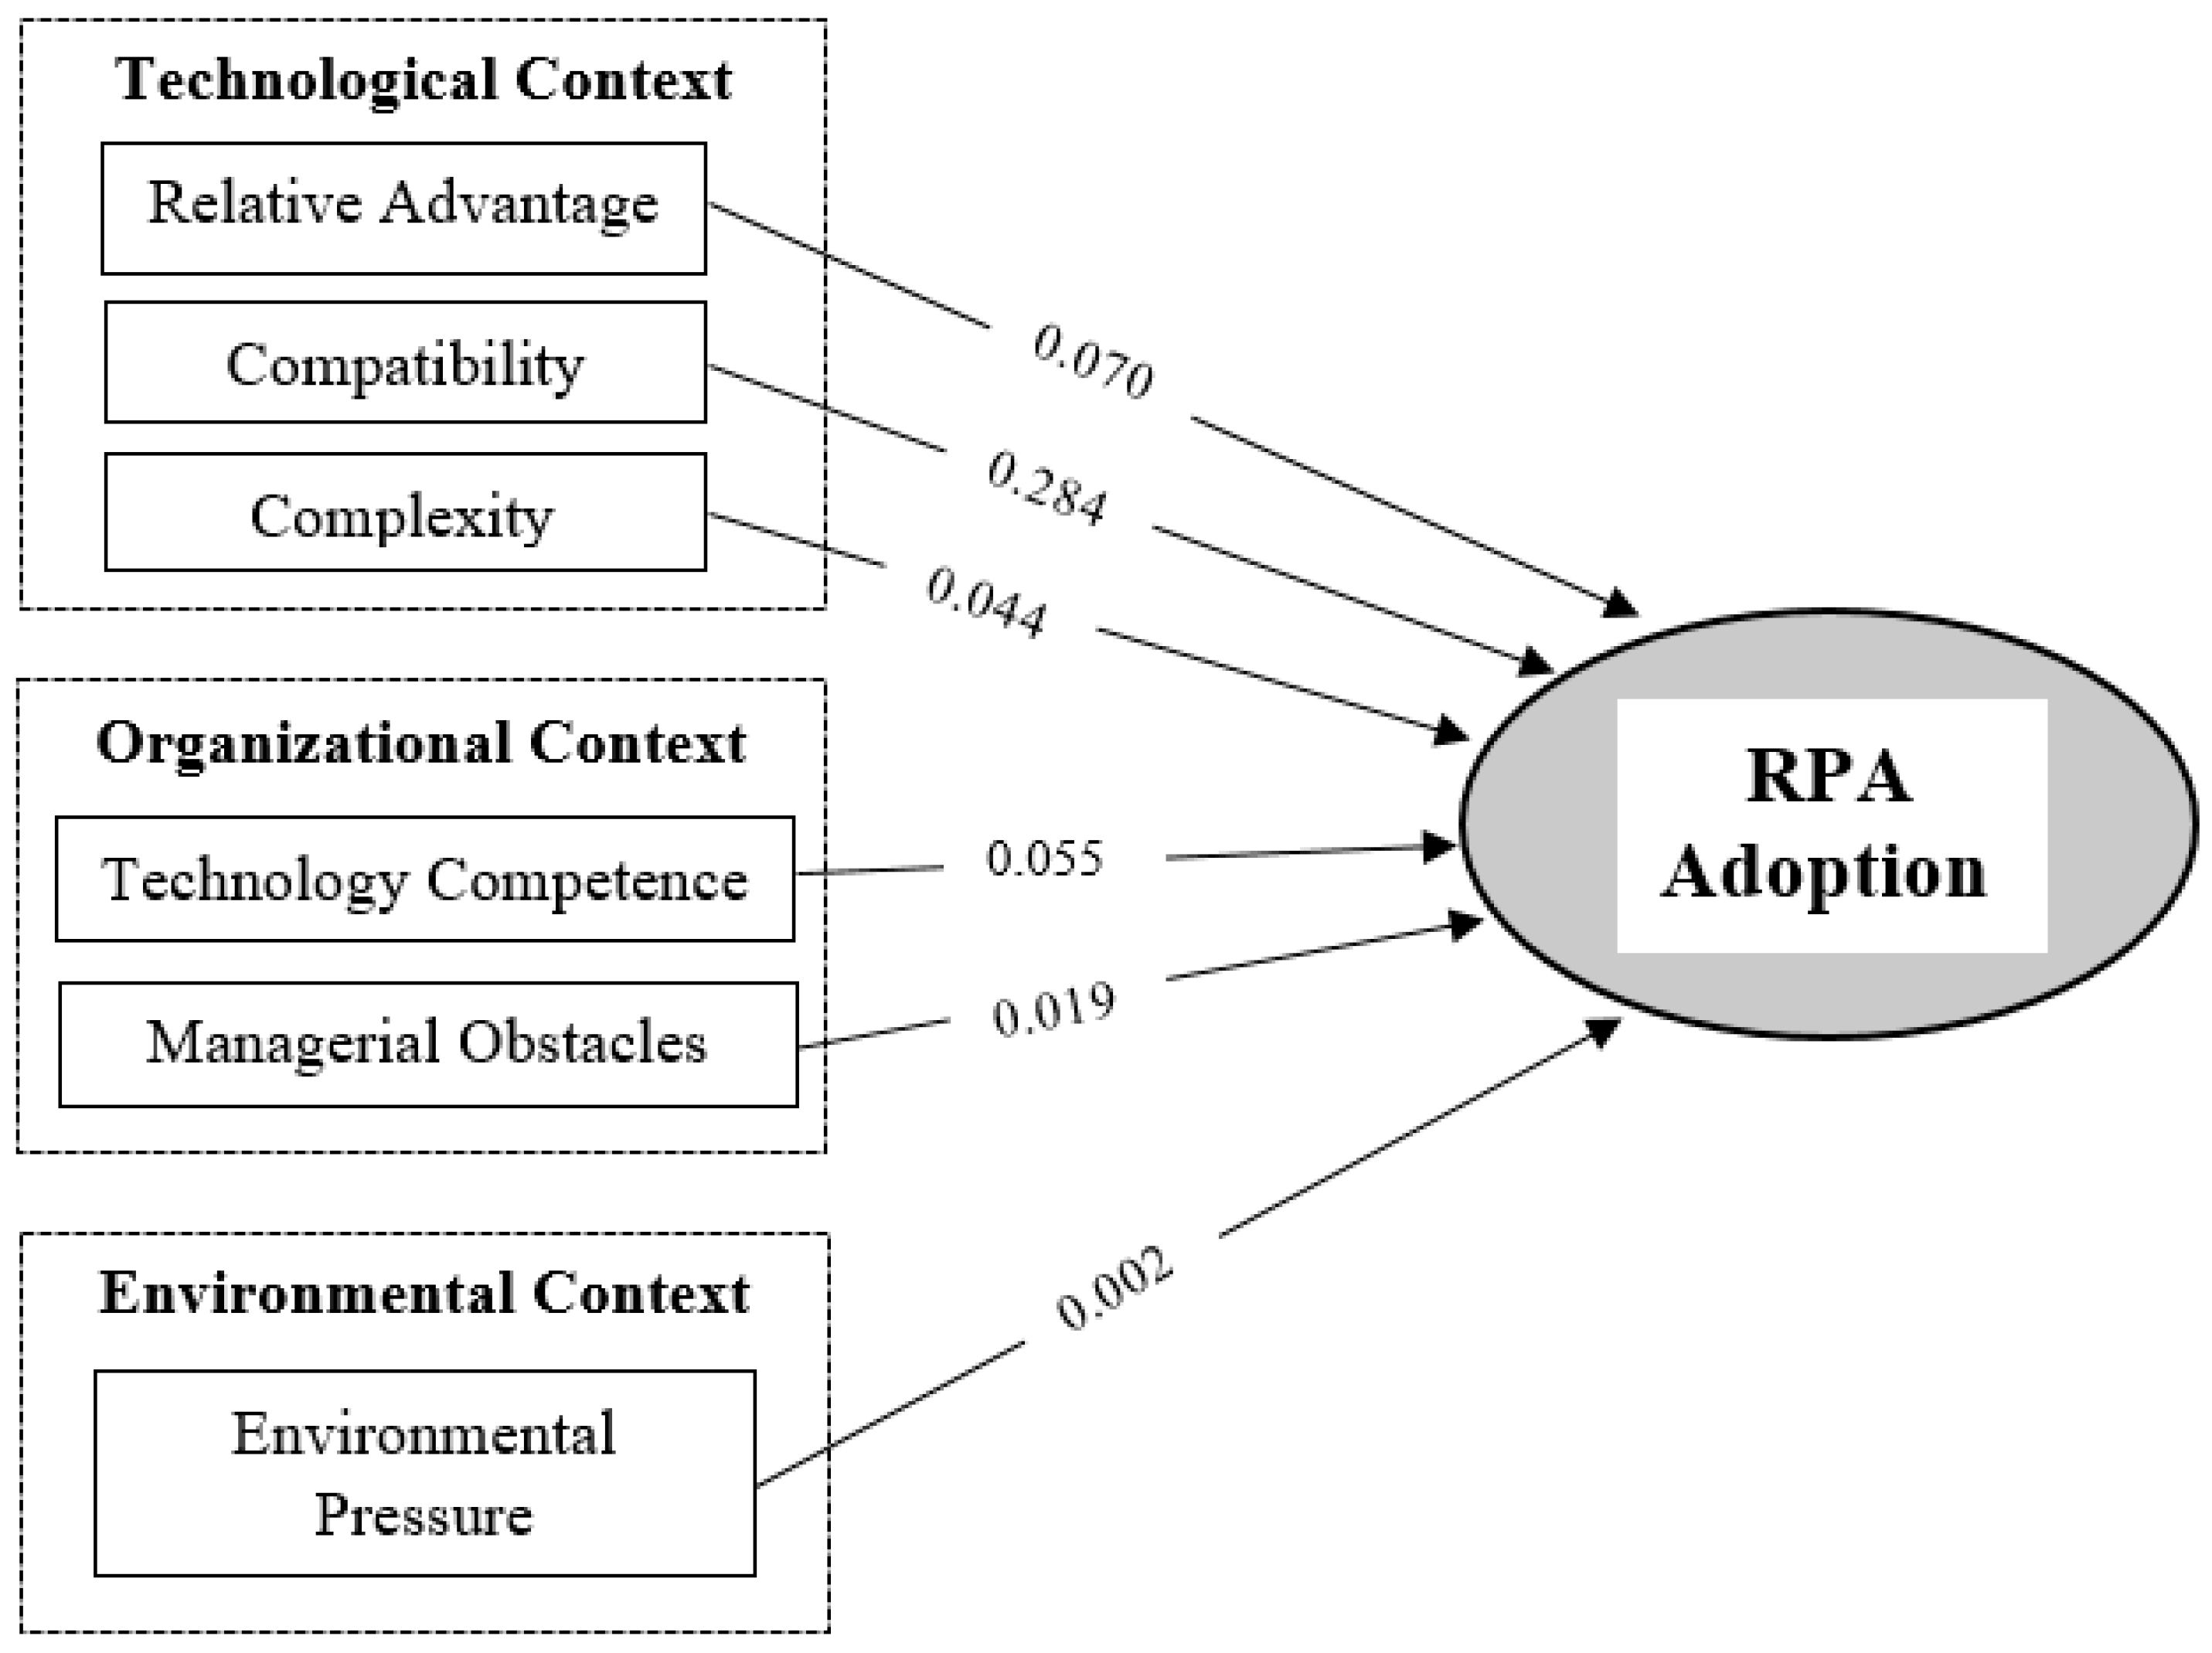
3.2. Structural Model

Once it was confirmed that the measurement model exhibits strong psychometric characteristics, we proceeded to evaluate the structural model. The results, reported in Figure 4 and Table 3, show that the R2, which expresses the proportion of variability in the dependent variable explained by the regression model, has a reasonable value (0.657).
The significance of paths was calculated by means of a bootstrapping procedure generating 5000 random samples (as suggested by [46,55]) of size 141. The path coefficients provide information about the direct relationships between variables in the model. Compatibility showed the most relevant significant path coefficient, similar to Relative Advantage, which, despite lower values, showed signs of statistical significance. On the other hand, Complexity, Technology Competence, Managerial Obstacles, and Environmental Pressure presented non-significant path coefficients. Nevertheless, we consider that there is a moderate fit of the model.

3.3. Control Variable: Industry

In a linear regression model, a control variable is an independent variable whose inclusion allows for controlling or adjusting the effects of other independent variables. Therefore, to obtain more reliable and generalizable results regarding the adoption and use of RPA, we chose to include the industry control variable. The questionnaire respondents’ organizations were distributed into two major categories: the production of goods and the production of services.
The results show a positive coefficient (0.133) for the control variable (CV), suggesting that an increase in the control variable is associated with an increase in the dependent variable (RPA Adoption). In this specific case, we are dealing with a binary control variable (goods production = 0, services production = 1).
Given the information presented previously, Hypothesis 7 is confirmed. In other words, there is a greater propensity for the adoption and use of RPA in the service industry. These results refer exclusively to RPA adoption and can be explained by five main factors: Nature of processes—The service industry is based on administrative, repetitive, and rule-based processes, making it highly suitable for RPA. Ease of implementation—RPA is easier to integrate into software-based and digital systems, which are more common in the service sector. Lower initial investment—RPA adoption in the service industry can be achieved at a lower cost, as it involves automating existing digital tasks rather than requiring significant infrastructure changes. Flexibility—Processes in the service sector can be modified more easily, allowing for smoother adaptation of RPA solutions. Growth of the service sector—With the increasing digitalization of the economy, the service sector demands greater operational efficiency, driving the adoption and use of RPA.

4. Discussion

Due to the existing gap in the theoretical foundation regarding RPA from an organizational perspective, one of the research proposals was to explore the propensity for the adoption and use of RPA from an organizational point of view. The research is based on the combination of the TOE and DOI theories to explain the adoption and use of RPA.
The obtained results confirm that Compatibility is a significant antecedent of the adoption and use of RPA, and Relative Advantage, based on the results obtained in both the pilot test and the full model, also appears to be statistically significant. Both antecedents belong to the category of technological factors. The relevance of the compatibility of the RPA solution with the company’s existing systems is highlighted as a key factor influencing the propensity for adoption. Additionally, the organization’s propensity to adopt RPA depends on the expectation of gaining a competitive advantage, whether through increased sales, cost reduction, decreased paperwork, or the ability of RPA to assist with quick data capture and analysis. Despite the fact that the remaining antecedents did not prove to be statistically significant in this study, the combined use of DOI and TOE as theoretical foundations for the model has proven to be useful, as these antecedents together explain a substantial variation in the adoption and use of RPA (R2 = 0.657). In fact, a significant contribution of this research is the combination of DOI and TOE to explain the propension for RPA adoption.

Technological, Organizational, and Environmental Contexts

In the technological context, Compatibility emerges as the most influential factor affecting the adoption and use of RPA. The higher the degree of compatibility with existing technologies in the organization, the greater the inclination for the adoption and use of RPA. Relative Advantage, although showing lower significance in both the pilot test and the complete model, does exhibit signs of statistical significance in the model.
Low Complexity does not prove to be a significant antecedent of the propensity for the adoption and use of RPA in this study. However, organizations have resources to deal with complexity and align processes if they conclude that the innovation will bring sufficient advantages.
Based on the obtained results, it is suggested that there is a necessity to further examine the DOI theory within an organizational context, where some factors may be less relevant.
In the organizational context, the obtained results suggest that neither Technology Competence nor low Managerial Obstacles emerge as significant antecedents for the adoption, or lack of adoption, of RPA.
The TOE framework allows for the expansion of factors commonly used in traditional technology adoption models as it includes environmental factors. In this particular study, Environmental Pressure was not shown to be statistically significant.
Despite expectations that managerial obstacles and environmental pressure would influence RPA adoption, the data did not confirm this relationship. These results may be related to the fact that adoption is based on technical feasibility (ease of implementation and compatibility) rather than external pressure. The main drivers of adoption are financial and operational factors (cost reduction and increased productivity). Other potential explanations include organizational resistance to change or a lack of awareness or knowledge about RPA in organizations.
Considering the results obtained, we can validate Hypothesis 7, meaning that the service industry shows a greater propensity for the adoption and use of RPA.
This result can be explained by the fact that, in the manufacturing industry, processes are more physical and operational, typically requiring more complex industrial automation, which makes implementation more challenging. Unlike the manufacturing industry, where automation often demands higher investments in hardware, infrastructure, and system integration, service automation primarily focuses on digital processes, making it easier to implement. Additionally, in manufacturing, process automation requires reconfiguring production line machinery, which can further complicate the adoption of RPA.

5. Conclusions, Contributions, Limitations, and Further Research

RPA’s potential for corporate performance improvement, together with the lack of research published exploring the adoption of RPA at the organizational level, encouraged the development of the present research.
The existing literature review was completed by an in-depth exploratory study that together grounded the research hypotheses of this paper, which are evaluated through structured equation modeling, providing an integrated view of the propensity for RPA adoption and use by organizations.
The results indicate that antecedents related to the technological context are relevant for enhancing the adoption and use of RPA. In this context, Hypothesis 2, related to Compatibility, stood out with greater statistical significance. This suggests that RPA’s compatibility with existing information infrastructure, applications, systems, and established procedures fosters its adoption and use. Relative Advantage, associated with Hypothesis 1, although with more moderate significance, indicates that when organizations recognize the potential benefits of RPA, such as increased sales, cost reduction, or decreased reliance on paper-based work, the propensity for adoption and use of the technology increases.
Thus, this partially confirms the assertion by [15] that the most significant and relevant characteristics are Relative Advantage (H1), Compatibility (H2), and Complexity (H3). Regarding the remaining antecedents, such as the organization’s Technological Competence (H4), Management Obstacles (H5), and Environmental Pressure (H6), this study cannot evaluate their influence on the propensity for adoption and use, as they were not statistically significant.

5.1. Contributions

The results of the present study provide theoretical and practical contributions. For scholars, it provides a tested and reliable model of the propensity for the adoption and use of RPA, identifying significant antecedents such as Compatibility or Relative Advantage. Thus, the research confirms the utility of the TOE and DOI frameworks for organizational-level studies. The combination of these frameworks can be valuable for other researchers intending to analyze the use of other technologies within organizations.
Future investigations could consider broadening research to areas beyond the current scope assessment of adoption and usage to explore the impact it has on value creation and company performance.
For researchers, this article serves as an example of conducting research with a mixed methods approach, considering the combination of a qualitative study based on interviews with experts and a quantitative study that collected data through questionnaires. The integration of approaches provides a more comprehensive and reliable development of theoretical knowledge.
To ensure successful RPA implementation, managers should consider factors such as company size, industry sector, and level of digital maturity.
Based on insights from the literature review, the exploratory study, and the confirmatory study, several recommendations were identified: assess the suitability of RPA for the company’s processes, i.e., before adopting automation, internal processes should be mapped; ensure compatibility with existing infrastructure and systems; consider employee impact and address resistance to change; define clear metrics to measure RPA success; start with pilot tests before full-scale automation; address regulatory and data security concerns; and ensure continuous support and ongoing optimization.
RPA adoption should be strategically planned to achieve operational efficiency and maximize automation benefits across different organizational settings.

5.2. Limitations

There are limitations in this research that should be highlighted. The impact measures are subjective as they rely on executives’ perceptions of the impact of RPA on their organization.
The reflective measurement model raises some issues regarding negative and insignificant weights. While this does not pose a threat to the structural model, it complicates the interpretation of the meaning of weights for these reflective variables.
Additionally, the study collected data from organizations in only one country. Portugal has a diversified economy; however, the service industry clearly dominates over the manufacturing industry, accounting for approximately 70% of GDP. This characteristic may have influenced the results obtained regarding the control variable.

5.3. Further Research

The research highlights several avenues for future studies. Initially, the antecedents of RPA use were chosen based on the DOI and TOE theories, with only the most significant antecedents from previous research selected for parsimony. However, it is possible that other antecedents of RPA use may be relevant. Consequently, upcoming studies should investigate other potential antecedents based on the theories used (DOI and TOE) or other frameworks.
The impact of RPA use by industry type can also be studied to analyze different usage patterns within each industry. A multi-level approach, considering the perspective of both employees and organizations would allow for a combination of their viewpoints on the implications of RPA use at both levels of analysis.
Regarding environmental pressure, larger companies may face greater pressure due to regulatory compliance and scrutiny compared to smaller companies. The same may apply to managerial obstacles, which can vary by industry, as more regulated sectors (e.g., finance, healthcare) may experience different challenges.
Lastly, it might be worthwhile to explore the impact of organizational culture on the adoption and use of RPA. Using the questionnaire from this study in countries with different perspectives on automation technologies could provide relevant insights into the influence of culture and the automation environment on the adoption and use of RPA.

Author Contributions

Conceptualization, D.D. and A.P.d.R.; methodology, D.D. and A.P.d.R.; software, D.D.; validation, A.P.d.R.; formal analysis, A.P.d.R.; investigation, D.D.; resources, D.D.; data curation, D.D.; writing—original draft preparation, D.D.; writing—review and editing, A.P.d.R.; visualization, D.D.; supervision, A.P.d.R.; project administration, D.D.; funding acquisition, A.P.d.R. All authors have read and agreed to the published version of the manuscript.

Funding

The authors gratefully acknowledge financial support from the FCT—Fundação para a Ciência e Tecnologia (Portugal) and national funding through research grant UIDB/04521/2020 & UID06522.

Data Availability Statement

The statistical data from this research will be made available upon request.

Conflicts of Interest

The authors state that they have no identified financial conflicts of interest or personal connections that could have influenced the findings presented in this paper.

Appendix A

Appendix A.1. Study 1 Details

Study 1 involved a series of interviews with RPA implementers or experts.
Table A1. Respondent Demographics.
DemographyAcademic EducationProfessional Profile
GenderAgeScientific AreaDegree
Male32Electrical and Computer EngineeringMasterManager
Male55ManagementPhDTeacher
Male25Data Science and Advanced AnalyticsMasterIntelligence Technical Specialist
Male45BiotechnologyGraduationHead of Transformation and Processes—B2C, Retail and Corporate Services
MBA
Male41Information Systems
Information Systems for Enterprises
GraduationBusiness Transformation Leader
Professor and Executive Program Director
Post-Graduation
Male40Science (MSc), Economics, Financial, and MonetaryMasterHead Of Digitalization and Transformation
Male37EconomyMasterAutomation Center Leader
Source: own elaboration.

Appendix A.2. High-Level Protocol Questions (Further Probing Was Undertaken When Appropriate)

  • What is RPA?
  • What is the company’s purpose with regard to RPA?
  • When did the company adopt RPA?
  • Why has RPA started to appear now, or why is RPA used when in practice, what it does is a connection between systems, repetitive tasks? Should it not be a development in the software itself?
  • Are there proper tasks to be automated?
  • What are the main features of RPA?
  • What are the success factors to consider when adopting RPA?
  • Is there a specific type of company that uses RPA?
  • When adopting the RPA, did the company achieve the objectives that supported the decision to adopt?
  • What are the main advantages/disadvantages?
  • What were the impacts felt in the adoption of the RPA?
  • Did the RPA bring beneficial changes to the organization’s dynamics?
  • What was the motivation for investing in RPA?
  • When they moved towards the RPA, had they already decided in which areas they would implement it?
  • Given the project’s success, will the idea be to expand the scope of the RPA to other sectors?
  • What are the impacts felt on sales/marketing (downstream dimension)?
  • What are the impacts felt on internal operations?
  • What are the impacts felt on purchases/procurement (upstream dimension)?
Additional questions pertaining to demographics and characteristics of firms are not included.

Appendix B. Measurement Items

Table A2. Operationalization of constructs. Source: own elaboration.
ConstructIndicator CodeIndicatorsScaleSource
Relative Advantage/R Please rate the degree to which you agree with the following statements (from 1 totally disagree to 5 totally agree):(1~5)
RA1 *My company expects RPA to help increase sales. Adapted from [14,48,49].
RA2My company expects RPA to help reduce costs.
RA3My company expects RPA to reduce paperwork.
RA4My company expects RPA to help quick data capture and analysis.
RA5 *Does the adoption of RPA affect the value of the brand?
H1The relative advantage over competitors increases with the adoption/use of RPA. Results from the exploratory study.
Compatibility/R Please rate the degree to which you agree with the following statements (from 1 totally disagree to 5 totally agree):(1~5)
CT1Using RPA is compatible with your organization corporate culture. Adapted from [14,48,49].
CT2RPA is compatible with existing information infrastructure.
CT3RPA is compatible with existing applications.
CT4RPA is compatible with existing procedures.
CT5RPA is compatible with the users’ experience with similar systems.
H2Compatibility with other technologies increases the propensity to adopt/use RPA. Adapted from [41].
Complexity/R Please rate the degree to which you agree with the following statements (from 1 totally disagree to 5 totally agree):(1~5)
CX1My company believes that RPA is complex to use. Adapted from [49,50].
CX2My company believes that RPA development is a complex process.
H3The low complexity of RPA increases the propensity to adopt/use RPA. Results from the exploratory study.
Technology Competence/F Please rate the level of the following statements (from 1 very low to 5 very high):(1~5)
TC1Experience of the firm in supporting RPA software. Adapted from [51].
TC2Expertise of the firm in supporting RPA software.
TC3Approximately how many IT professionals work in or for your organization? Adapted from [49,52].
H4The organization’s technological competence increases the propensity to adopt/use RPA. Adapted from [40,41].
Managerial Obstacles/R Please rate how significant the following obstacles are to your organization’s ability to conduct RPA (from 1 totally irrelevant to 5 totally relevant):(1~5)
MO1Integrating the RPA into your overall strategy and business process. Adapted from [26,49,53].
MO2Lacking staff with RPA expertise.
MO3Insufficient top-management support.
MO4The RPA’S operating platform or interface feels unfriendly.
H5Management obstacles in an organizational context reduce the propensity for adopting/using RPA. Adapted from [41].
Environmental Pressure/R Please indicate (from 1 totally disagree to 5 totally agree):(1~5)
EP1My company experienced competitive pressure to implement RPA. Adapted from [14,48,49].
EP2ICT strongly influences the competition in your industry.
EP3Customers demand it. Adapted from [23,49].
EP4To improve coordination between suppliers and customers.
EP5 *Suppliers require it.
H6The environmental pressure that arises from the environmental context increases the propensity to adopt/use RPA. Adapted from [40].
Control Variable (Industry)/RCV
H7In the service industry, there is a greater propensity for the adoption and use of RPA. [42]
* are the items marked for deletion (in the pilot test, the outer loading values were below 0.5). Constructs modeled as reflective are marked with (R) and constructs modeled as formative are marked with (F).

Appendix C

In this appendix, we report the results for the reflective and the formative measurement models in Table A3, Table A4, Table A5 and Table A6.
Table A3. Reflective constructs’ reliability criteria, loadings, and t-statistics. Source: own elaboration.
Reflective Multi-Items (Cronbach’s Alpha/Composite Reliability/AVE)Construct CompositeIndicator CodeMeanSDOuter LoadingsConv. Validity (t-Stat)
RARelative Advantage (0.90/0.96/0.83)RA1
RA23.8451.180.91949.174
RA33.5951.2160.88613.768
RA43.7381.1660.92319.208
RA5
CTCompatibility (0.95/0.95/0.82)CT13.6431.1340.88921.055
CT23.6431.1720.92236.669
CT33.61.1140.94653.144
CT43.5861.1270.92134.604
CT53.4141.1270.85417.987
CXComplexity (0.79/0.91/0.82)CX12.8591.0880.9486.94
CX23.2191.1660.8614.168
MOManagerial Obstacles (0.85/0.89/0.68)MO13.3620.9950.8343.244
MO23.7411.0760.7683.284
MO33.4661.2350.8974.144
MO43.0171.0580.7883.626
EPEnvironmental Pressure (0.76/0.75/0.58)EP12.8791.1310.7084.979
EP23.7591.0560.684.927
EP32.4311.3150.8556.84
EP43.0171.1960.7855.488
EP5
Note: The shaded rows correspond to the items marked for deletion (in the pilot test, the outer loading values were below 0.5).
Table A4. AVE and latent variables correlations. Source: own elaboration.
CompatibilityComplexityEnvironmental PressureManagerial ObstaclesRelative Advantage
Compatibility0.907
Complexity−0.4040.905
Environmental Pressure0.421−0.0670.76
Managerial Obstacles0.1610.1020.2030.824
Relative Advantage0.739−0.2360.3720.1990.91
Note: The diagonal is the values of AVE squared root and the off-diagonal represents the correlations.
Table A5. Cross loadings. Source: own elaboration.
CompatibilityComplexityEnvironmental PressureManagerial ObstaclesRelative AdvantageTechnology Competence
CT10.889−0.3510.340.0910.680.685
CT20.922−0.4560.3570.160.6970.674
CT30.946−0.3940.4090.1890.6990.727
CT40.921−0.2830.3960.130.6520.68
CT50.854−0.3390.4140.1610.6210.764
CX1−0.4230.948−0.0640.133−0.309−0.436
CX2−0.2830.861−0.0570.029−0.066−0.341
EP10.3620.040.7080.1850.320.348
EP20.289−0.0470.680.2160.1810.305
EP30.283−0.0540.8550.0870.2450.43
EP40.332−0.1310.7850.0960.3880.454
MO10.18−0.0510.1120.8340.2330.177
MO2−0.0060.2190.1680.7680.0910.02
MO30.1670.0390.170.8970.1440.111
MO40.1430.250.2610.7880.1690.148
RA20.78−0.3190.3740.2080.9190.584
RA30.562−0.0610.3460.1450.8860.373
RA40.618−0.2040.2790.1760.9230.443
TC10.755−0.4120.50.1620.5060.996
TC20.762−0.4470.4920.1220.540.958
Note: Bold numbers indicate item loadings on the assigned constructs.
Table A6. Formative measurement model evaluation criteria. Source: own elaboration.
Formative ConstructIndicator CodeMeanSDWeightsVIF
TCTechnology CompetenceTC13.0471.3510.026 *7.211
TC231.3580.493 *7.211
* Note: Significance level 0.05.

References

  1. Syed, R.; Suriadi, S.; Adams, M.; Bandara, W.; Leemans, S.J.; Ouyang, C.; ter Hofstede, A.H.M.; van de Weerd, I.; Wynn, M.T.; Reijers, H.A. Robotic process automation: Contemporary themes and challenges. Comput. Ind. 2020, 115, 103162. [Google Scholar] [CrossRef]
  2. Penttinen, E.; Kasslin, H.; Asatiani, A. How to choose between robotic process automation and back-end system automation? In Proceedings of the 26th European Conference on Information Systems (ECIS), Portsmouth, UK, 23–28 June 2018. [Google Scholar]
  3. Bygstad, B. The Coming of Lightweight IT. In ECIS 2015 Completed Research Papers; Paper 22; AIS eLibrary: Atlanta, GR, USA, 2015; ISBN 978-3-00-050284-2. [Google Scholar]
  4. Lacity, M.; Willcocks, L.P. Innovating in Service: The Role and Management of Automation. In Dynamic Innovation in Outsourcing; Palgrave Macmillan: Cham, Switzerland, 2018; pp. 269–325. [Google Scholar]
  5. Hallikainen, P.; Bekkhus, R.; Pan, S.L. How OpusCapita Used Internal RPA Capabilities to Offer Services to Clients. MIS Q. Exec. 2018, 17, 41. [Google Scholar]
  6. Willcocks, L.; Lacity, M.; Craig, A. Robotic process automation at Telefonica O2. MIS Q. Exec. 2016, 15, 21–35. [Google Scholar]
  7. Madakam, S.; Holmukhe, R.M.; Jaiswal, D.K. The future digital work force: Robotic process automation (RPA). JISTEM-J. Inf. Syst. Technol. Manag. 2019, 16, e201916001. [Google Scholar] [CrossRef]
  8. Osman, C.C. Robotic Process Automation: Lessons Learned from Case Studies. Inform. Econ. 2019, 23, 66–75. [Google Scholar] [CrossRef]
  9. Seasongood, S. Not for the Assembly Line: A Case for Robotics in Accounting and Finance; Financial Executive: Morristown, NJ, USA, 2016; Volume 32, ISSN 0895-4186. [Google Scholar]
  10. Menon, V.; Aslekar, A. A Study to Identify the Possibilities of Implementing Robotic Process Automation for the Processing of Loans in Banks. Cardiometry 2022, 24, 635–642. [Google Scholar] [CrossRef]
  11. Potturu, S.M. Revolutionizing Field Data Collection and Management: The Role of PowerApps and RPA in Improving Service Quality, Enhancing Customer Experience, and Reducing Manual Effort. 2023. Available online: https://www.researchsquare.com/article/rs-3036123/v1 (accessed on 10 September 2023).
  12. Gupta, A.; Prabhat, P.; Sawhney, S.; Gupta, R.; Tanwar, S.; Kumar, N.; Shabaz, M. Retracted: Robotic Process Automation use cases in academia and early implementation experiences. IET Softw. 2023, 17, 600–609. [Google Scholar] [CrossRef]
  13. Gangwar, H.; Date, H.; Raoot, A.D. Review on IT adoption: Insights from recent technologies. J. Enterp. Inf. Manag. 2014, 27, 488–502. [Google Scholar] [CrossRef]
  14. Zhu, K.; Dong, S.; Xu, S.X.; Kraemer, K.L. Innovation diffusion in global contexts: Determinants of post-adoption digital transformation of European companies. Eur. J. Inf. Syst. 2006, 15, 601–616. [Google Scholar] [CrossRef]
  15. Tornatzky, L.G.; Klein, K.J. Innovation characteristics and innovation adoption-implementation: A meta-analysis of findings. IEEE Trans. Eng. Manag. 1982, EM-29, 28–45. [Google Scholar] [CrossRef]
  16. Tornatzky, L.G.; Fleischer, M.; Chakrabarti, A.K. Processes of Technological Innovation; Lexington Books: Lanham, MD, USA, 1990. [Google Scholar]
  17. Melville, N.; Kraemer, K.; Gurbaxani, V. Information technology and organizational performance: An integrative model of IT business value. MIS Q. 2004, 28, 283–322. [Google Scholar] [CrossRef]
  18. Cappiello, A. Technology and the Insurance Industry: Re-Configuring the Competitive Landscape; Springer: Berlin/Heidelberg, Germany, 2018. [Google Scholar]
  19. Lacity, M.C.; Willcocks, L.P. A new approach to automating services. MIT Sloan Manag. Rev. 2016, 58, 41–49. [Google Scholar]
  20. Asatiani, A.; Penttinen, E. Turning robotic process automation into commercial success–Case OpusCapita. J. Inf. Technol. Teach. Cases 2016, 6, 67–74. [Google Scholar] [CrossRef]
  21. Chakraborty, A.; Bhattacharyya, S.; De, D.; Sarigiannidis, P.; Banerjee, J.S. Confluence of Artificial Intelligence and Robotic Process Automation: Concluding Remarks. In Confluence of Artificial Intelligence and Robotic Process Automation; Springer Nature: Singapore, 2023; pp. 389–399. [Google Scholar]
  22. Vitharanage, I.M.D.; Bandara, W.; Syed, R.; Toman, D. An Empirically Supported conceptualisation of robotic Process Automation (RPA) Benefits. In Proceedings of the 28th European Conference on Information Systems (ECIS2020), Marrakech, Morocco, 15–17 June 2020. [Google Scholar]
  23. Hsu, P.F.; Kraemer, K.L.; Dunkle, D. Determinants of e-business use in US firms. Int. J. Electron. Commer. 2006, 10, 9–45. [Google Scholar] [CrossRef]
  24. Sarstedt, M.; Hair, J.F., Jr.; Cheah, J.H.; Becker, J.M.; Ringle, C.M. How to specify, estimate, and validate higher-order constructs in PLS-SEM. Australas. Mark. J. 2019, 27, 197–211. [Google Scholar] [CrossRef]
  25. Mishra, A.N.; Konana, P.; Barua, A. Antecedents and consequences of internet use in procurement: An empirical investigation of US manufacturing firms. Inf. Syst. Res. 2007, 18, 103–120. [Google Scholar] [CrossRef]
  26. Zhu, K.; Kraemer, K.L.; Xu, S. The process of innovation assimilation by firms in different countries: A technology diffusion perspective on e-business. Manag. Sci. 2006, 52, 1557–1576. [Google Scholar] [CrossRef]
  27. Lee, C.P.; Shim, J.P. An empirical study on user satisfaction with mobile business applications use and hedonism. J. Inf. Technol. Theory Appl. (JITTA) 2006, 8, 6. [Google Scholar]
  28. Mingers, J. Combining IS research methods: Towards a pluralist methodology. Inf. Syst. Res. 2001, 12, 240–259. [Google Scholar] [CrossRef]
  29. Venkatesh, V.; Brown, S.A.; Bala, H. Bridging the qualitative-quantitative divide: Guidelines for conducting mixed methods research in information systems. MIS Q. 2013, 37, 21–54. [Google Scholar] [CrossRef]
  30. Tashakkori, A.; Teddlie, C. (Eds.) Sage Handbook of Mixed Methods in Social & Behavioral Research; Sage: Thousand Oaks, CA, USA, 2010. [Google Scholar]
  31. Myers, M.D.; Avison, D. Qualitative Research in Information Systems: A Reader; Sage: Thousand Oaks, CA, USA, 2002. [Google Scholar]
  32. Yin, R.K. Case Study Research Methods: Design and Methods; Sage: Thousand Oaks, CA, USA, 2003. [Google Scholar]
  33. Lacity, M.; Willcocks, L.P.; Craig, A. Robotizing Global Financial Shared Services at Royal DSM; The Outsourcing Unit Working Research Paper Series; Department of Management at the London School of Economics and Political Science (LSE): London, UK, 2016. [Google Scholar]
  34. Money, W.H.; Mew, L.Q. Combining Project Based Learning and Lean Six Sigma Methodologies to Teach Robotic Process Automation Analysis and Design. In Proceedings of the EDSIG Conference, Clearwater, FL, USA, 2–5 November 2022; Volume 2473, p. 4901. [Google Scholar]
  35. Lyytinen, K.; Rose, G.M. The disruptive nature of information technology innovations: The case of internet computing in systems development organizations. MIS Q. 2003, 27, 557–596. [Google Scholar] [CrossRef]
  36. Coimbra, G. Investimento em Tecnologia Cresce 4.7% em 2023. 45% das Empresas Portuguesas Admitem Aumentar Orçamentos Acima de 10%. TekSapo. 2023. Available online: https://tek.sapo.pt/noticias/negocios/artigos/investimento-em-tecnologia-cresce-47-em-2023-45-das-empresas-portuguesas-admitem-aumentar-orcamentos-acima-de-10 (accessed on 20 February 2023).
  37. Saunders, M.N.K. Choosing research participants. In The Practice of Qualitative Organizational Research: Core Methods and Current Challenges; Symons, G., Cassell, C., Eds.; Sage: London, UK, 2012; pp. 37–55. [Google Scholar]
  38. Ivančić, L.; Suša Vugec, D.; Bosilj Vukšić, V. Robotic process automation: Systematic literature review. In Business Process Management: Blockchain and Central and Eastern Europe Forum. BPM 2019; Springer International Publishing: Berlin/Heidelberg, Germany, 2019; pp. 280–295. [Google Scholar]
  39. Martínez-Rojas, A.; López-Carnicer, J.M.; González-Enríquez, J.; Jiménez-Ramírez, A.; Sánchez-Oliva, J.M. Intelligent Document Processing in End-to-End RPA Contexts: A Systematic Literature Review. In Confluence of Artificial Intelligence and Robotic Process Automation; Springer: Berlin/Heidelberg, Germany, 2023; pp. 95–131. [Google Scholar]
  40. Soares-Aguiar, A.; Palma-dos-Reis, A. Why do firms adopt e-procurement systems? Using logistic regression to empirically test a conceptual model. IEEE Trans. Eng. Manag. 2008, 55, 120–133. [Google Scholar] [CrossRef]
  41. Rawashdeh, A.; Shehadeh, E.; Rababah, A.; Al-Okdeh, S.K. Adoption of robotic process automation (RPA) and its effect on business value: An internal auditors perspective. J. Posit. Sch. Psychol. 2022, 6, 9832–9847. [Google Scholar]
  42. Sharma, C.; Bharadwaj, S.S.; Gupta, N.; Jain, H. Robotic process automation adoption: Contextual factors from service sectors in an emerging economy. J. Enterp. Inf. Manag. 2023, 36, 252–274. [Google Scholar] [CrossRef]
  43. Petter, S.; Straub, D.; Rai, A. Specifying formative constructs in information systems research. MIS Q. 2007, 31, 623–656. [Google Scholar] [CrossRef]
  44. Jarvis, C.B.; MacKenzie, S.B.; Podsakoff, P.M. A critical review of construct indicators and measurement model misspecification in marketing and consumer research. J. Consum. Res. 2003, 30, 199–218. [Google Scholar] [CrossRef]
  45. Sekaran, U.; Bougie, R. Research Methods for Business: A Skill Building Approach; John Wiley & Sons: Hoboken, NJ, USA, 2016. [Google Scholar]
  46. Henseler, J.; Ringle, C.M.; Sinkovics, R.R. The use of partial least squares path modeling in international marketing. In New Challenges to International Marketing; Emerald Group Publishing Limited: Bingley, UK, 2009. [Google Scholar]
  47. Fornell, C.; Larcker, D.F. Structural equation models with unobservable variables and measurement error: Algebra and statistics. J. Mark. Res. 1981, 18, 382–388. [Google Scholar] [CrossRef]
  48. Wang, Y.M.; Wang, Y.S.; Yang, Y.F. Understanding the determinants of RFID adoption in the manufacturing industry. Technol. Forecast. Soc. Change 2010, 77, 803–815. [Google Scholar] [CrossRef]
  49. Picoto, W.N.; Bélanger, F.; Palma-dos-Reis, A. An organizational perspective on m-business: Usage factors and value determination. Eur. J. Inf. Syst. 2014, 23, 571–592. [Google Scholar] [CrossRef]
  50. Grover, V.; Goslar, M.D. The initiation, adoption, and implementation of telecommunications technologies in US organizations. J. Manag. Inf. Syst. 1993, 10, 141–164. [Google Scholar] [CrossRef]
  51. Kuan, K.K.; Chau, P.Y. A perception-based model for EDI adoption in small businesses using a technology–organization–environment framework. Inf. Manag. 2001, 38, 507–521. [Google Scholar] [CrossRef]
  52. Zhu, K.; Kraemer, K.L. Post-adoption variations in usage and value of e-business by organizations: Cross-country evidence from the retail industry. Inf. Syst. Res. 2005, 16, 61–84. [Google Scholar] [CrossRef]
  53. Pan, M.J.; Jang, W.Y. Determinants of the adoption of enterprise resource planning within the technology-organization-environment framework: Taiwan’s communications industry. J. Comput. Inf. Syst. 2008, 48, 94–102. [Google Scholar]
  54. Gefen, D.; Rigdon, E.E.; Straub, D. Editor’s comments: An update and extension to SEM guidelines for administrative and social science research. MIS Q. 2011, 35, iii–xiv. [Google Scholar] [CrossRef]
  55. Hair, J.F.; Ringle, C.M.; Sarstedt, M. PLS-SEM: Indeed a silver bullet. J. Mark. Theory Pract. 2011, 19, 139–152. [Google Scholar] [CrossRef]
Figure 1. RPA Potential Contributions. Source: [1,3,10,11,12,13,14,15,16,17,18,19,20,21,22].
Asi 08 00033 g001
Figure 2. Research outline. Source: own elaboration.
Asi 08 00033 g002
Figure 3. A research model for RPA Adoption. Source: own elaboration.
Asi 08 00033 g003
Figure 4. PLS results. Source: own elaboration.
Asi 08 00033 g004
Table 1. Results of data analysis. Source: own findings.
ComponentsEvidence from Interviews (No. of Respondents)
Adoption determinantsAdoption of RPA (low-code tool) to free up work for the IT department.4
RPA as a short-term tool, with a payback period of less than 6 months.3
Possibility of interaction with other systems/platforms that already exist in the organization.6
Reduction of routine work in the organization.7
Flexibility in robot allocation (workforce).5
A robot works 24/7, 365 days a year.6
Increase in quality/efficiency (of processes).7
Improve process auditability.3
Boost employee motivation.5
Table 3. PLS results. Source: own elaboration.
Dependent VariableIndependent VariablePath Coefficient (Pilot Model)R2 (Pilot Test)Path Coefficient (Full Model)R2 (Full Model)
RPA AdoptionRelative Advantage0.1320.6080.0700.657
Compatibility0.1980.284
Complexity−0.0270.044
Technology Competence−0.0310.055
Managerial Obstacles0.0480.019
Environmental Pressure0.0050.002
Control Variable0.1150.133
Disclaimer/Publisher’s Note: The statements, opinions and data contained in all publications are solely those of the individual author(s) and contributor(s) and not of MDPI and/or the editor(s). MDPI and/or the editor(s) disclaim responsibility for any injury to people or property resulting from any ideas, methods, instructions or products referred to in the content.

