Abstract
Bike-sharing initiatives play a crucial role in sustainable urban transportation, addressing vehicular congestion, air quality issues, and sedentary lifestyles. However, the connection between bike-sharing facilities and the advantages perceived by users remains insufficiently explored particular in post-industrial regions, such as Silesia, Poland. This study develops a multidimensional framework linking infrastructure elements—such as station density, bicycle accessibility, maintenance standards, and technological integration—to perceived benefits. Using a mixed-methods approach, a survey conducted in key Silesian cities combines quantitative analysis (descriptive statistics, factor analysis, and regression modelling) with qualitative insights from user feedback. The results indicate that the most valuable benefits are health improvements (e.g., improved physical fitness and mobility) and environmental sustainability. However, infrastructural deficiencies—disjointed bike path systems, uneven station placements, and irregular maintenance—substantially hinder system efficiency and accessibility. Inadequate bike maintenance adversely affects efficiency, safety, and sustainability, highlighting the necessity for predictive upkeep and optimised services. This research underscores innovation as a crucial factor for enhancing systems, promoting seamless integration across multiple modes, diversification of fleets (including e-bikes and cargo bikes), and the use of sophisticated digital solutions like real-time tracking, contactless payment systems, and IoT-based monitoring. Furthermore, the transformation of post-industrial areas into cycling-supportive environments presents strategic opportunities for sustainable regional revitalisation. These findings extend beyond the context of Silesia, offering actionable insights for policymakers, urban mobility planners, and Smart City stakeholders worldwide, aiming to foster inclusive, efficient, and technology-enabled bike-sharing systems.
1. Introduction
During the past two decades, urban transportation systems have been reshaped by the growing emphasis on sustainability, technological advancements, and the challenges posed by urbanisation and climate change. Among the most notable innovations in urban mobility is the rise in shared mobility services that allow users to rent a vehicle for a short period without the need to own it [1].
Under the umbrella of shared mobility services, bike-sharing systems represent one of the earliest, most environmentally friendly, health-promoting, cost-effective, and widely accessible solutions. These systems offer a viable alternative to traditional modes of transport, particularly in densely populated areas [2]. By reducing dependency on private vehicles and alleviating congestion, bike-sharing has emerged as a transformative force in reimagining urban landscapes.
Since the emergence of bike-sharing programmes in the late twentieth century [3], they have evolved from small-scale, community-driven initiatives into integral components of urban transportation strategies across the globe. Early efforts, such as Copenhagen’s Bycyklen [4], laid the groundwork for the development of more advanced systems that integrate digital technologies and real-time user data.
Contemporary systems are digitally oriented and operate through platform-based models, offering users 24/7 access to bicycles. Bike-sharing services utilising mobile applications for rentals now operate in over 50 countries worldwide [5], encompassing both locally managed initiatives in smaller municipalities and large-scale infrastructures in metropolitan areas, such as Beijing, New York, and Paris [6,7,8]. Collectively, these systems facilitate hundreds of millions of journeys each year, highlighting their significance as a sustainable and accessible mode of transportation.
The widespread adoption of bike-sharing programmes highlights their ability to address important issues that confront contemporary urban areas. These systems aim to reduce greenhouse gas emissions and traffic congestion by promoting a transition away from individual motorisation, while also improving public health through active transportation [9]. Furthermore, shared bicycles constitute a cost-efficient and socially inclusive form of mobility, particularly in areas with limited access to conventional public transit options [10]. However, the success and efficiency of these systems are highly dependent on their foundational infrastructure, which includes physical assets, such as docking stations, bike paths, and maintenance centres, along with digital elements, such as mobile applications and real-time navigation resources [11]. Comprehending the role of infrastructure in shaping the user-perceived benefits of bike-sharing systems is critical for optimising their design and implementation. Although previous research has addressed various dimensions of bike-sharing, including its ecological impact and economic viability, there remains a relative paucity of studies focusing on the nuanced interrelations between infrastructural elements and user perceptions, especially across diverse urban contexts [12,13]. This gap in the literature is particularly salient in regions undergoing socio-economic transformation or urban regeneration, where traditional infrastructure models may prove insufficient or misaligned with evolving urban dynamics.
In this context, Poland, especially the Silesian area, presents an intriguing topic for further investigation. Silesia, as a post-industrial area that undergoes significant urban transformation, combines a high population density with a deep industrial heritage [14], offering unique opportunities and challenges for introducing bike-sharing initiatives.
The region’s history of substantial industry and mining has produced a unique urban landscape, marked by significant land fragmentation, brownfield locations, and zones in need of ecological renewal. These post-industrial areas have distinct difficulties in incorporating contemporary urban mobility options. Bike-sharing programmes called Gleichzeitig provide a chance to transform neglected spaces, such as old industrial sites and mining facilities, into creative urban environments that emphasise sustainable transport and active living.
Poland, overall, has experienced swift growth in the implementation of bike-sharing systems, with more than 60 cities launching programmes by 2023 [15]. Warsaw’s Veturilo programme, featuring almost 6000 bikes and more than 300 stations, stands out as the most known Polish system [16]. The second largest and most popular bike-sharing programme is the Metropolitan Bicycle System, called Metrorower. It was introduced on 25 February 2024 in the Upper Silesian and Zagbie metropolitanis (GZM) [16]. Metrorower has quickly established itself as the most expansive regional system with over 1000 bicycles available at 150 stations throughout the metropolis. This large-scale system replaced earlier independent bike-sharing networks in cities like Katowice, Gliwice, and Tychy, creating a unified transportation solution across 41 municipalities [16]. The other bike-sharing systems that operate in Wrocaw (Nextbike) and Pozna (Pozna City Bike) have also played a role in enhancing the cycling culture of the country [17].
Nonetheless, the quality of bike-sharing facilities varies significantly across regions, as some areas experience shortcomings in the integration of cycling infrastructure with public transit and suffer from limited bike path networks, particularly in suburban and rural settings.
The Silesian Voivodeship, home to over 4.5 million inhabitants, reflects national trends on a smaller scale while simultaneously exhibiting distinct regional characteristics [18]. As one of the most urbanised and industrialised regions in Poland, Silesia encompasses densely populated cities, such as Katowice, Gliwice, and Bytom, alongside extensive former industrial zones [18]. Municipalities in the region continue to grapple with persistent challenges related to air pollution, traffic congestion, and infrastructure that—while effective in certain areas—remain inconsistent or insufficiently integrated in others. Although bike-sharing has become a widely adopted service in Poland, research examining the influence of regional infrastructure on user perceptions and system outcomes remains limited. This study seeks to address this gap by investing the relationship between bike-sharing services and perceived benefits within the Silesian region, offering insights that are both locally grounded and globally applicable.
The originality of this study is rooted in its comprehensive framework, which systematically links infrastructure characteristics to the perceived advantages of bike-sharing systems, especially within post-industrial urban contexts, such as Poland’s Silesian region. While prior research typically explores bike-sharing primarily through general environmental or economic lenses, this investigation offers a deeper examination into the influence of specific infrastructure factors—including station density, maintenance standards, and technological advancements—on user experience and the overall efficiency of the system. Additionally, this study employs a mixed-methods strategy, integrating quantitative methods like factor analysis and regression modelling with qualitative user feedback. This methodological combination ensures a richer understanding of both quantifiable outcomes and subjective user experiences.
Another unique contribution is this study’s emphasis on post-industrial regions, where implementing sustainable mobility solutions presents additional complexity due to historical urban structures, fragmented land-use patterns, and legacy infrastructure. This research not only pinpoints these particular challenges but also provides policy-oriented recommendations aimed at improving bike-sharing network performance in these challenging contexts.
This research offers an innovative perspective on the integration of Smart City concepts by examining how real-time monitoring, contactless payment systems, and IoT-driven technologies can substantially enhance the operational efficiency of bike-sharing services. As a result, the findings provide practical guidance and strategic insights that are valuable for urban planners, policymakers, and other stakeholders involved in the development of sustainable urban mobility solutions.
The findings emphasise that regions, such as Silesia, that face the dual challenge of urban transformation and environmental remediation, have the potential to lead in adopting innovative mobility solutions that address local and global priorities. Using its industrial heritage and dense urban environment, Silesia can emerge as a model for integrating bike-sharing systems into post-industrial landscapes, creating sustainable and user-centred cities that align with the broader objectives of Poland’s green transition. Such emerging technological innovations and modern applications, including integration into public transportation, increasingly play a decisive role in bike-sharing systems but have remained partially unexamined in the prior literature on smart cities [19,20,21,22,23,24,25,26,27,28]. This study identifies a gap within research on the level of influence created through infrastructure towards the so-called health benefits, environmental benefits, and social benefits, complementing those related to mere comfort and low expense. Since it adopts a multidimensional regression model. Long-term infrastructure changes, the role of user demographics in shaping their perceptions, and policy interventions are just some of the areas calling for further investigation. These unexplored areas open up new paths that could form the basis for possible research to further refine and expand knowledge regarding bike-sharing systems in smart cities.
This article addresses the following research questions:
- Q1—What are the main benefits of bike-sharing within Smart Cities, particularly in the Silesian region of Poland?
- Q2—What is the assessment of an infrastructure offering by bike-sharing systems?
- Q3—What are the key relationships between bike-sharing infrastructure elements and the perceived benefits of bike-sharing systems?
- Q4—How well do multidimensional regression models explain the variance in perceived benefits based on infrastructure attributes?
The results of this research have important implications for the advancement of modern smart cities. This research explores the intricate connections between bike-sharing systems and the advantages perceived by users, offering practical insights to assist urban planners, policymakers, and mobility service providers in creating sustainable and user-focused transportation options. As smart cities focus more on data-driven strategies to enhance urban mobility, it is essential to comprehend how infrastructure components affect user experiences and the acceptance of systems. Additionally, the multidimensional framework used in this research presents a reproducible methodological strategy that can be tailored to different urban environments, facilitating a more efficient incorporation of bike-sharing systems into larger smart city projects. This article enhances the ongoing conversation about sustainable urban development and the impact of innovative transportation systems on creating resilient, fair, and ecologically sound cities by filling gaps in the literature and offering specific contextual recommendations.
This paper is organised into six sections for a thorough examination of the subject. The introduction establishes the background by highlighting the importance of bike-sharing systems and their contribution to urban transportation. The second part provides a comprehensive analysis of the current literature, concentrating on smart cities and the incorporation of bike-sharing into their systems. The third section details the methodology, explaining the research design, data gathering, and analytical methods used. The fourth section presents the results, offering empirical insights into the connections between infrastructure elements and user-perceived advantages. In the fifth section, the discussion analyses these results within the larger academic and practical framework, emphasising their significance for smart city development. Ultimately, the sixth section concludes this research by highlighting major findings, discussing limitations, and providing practical suggestions for future investigations and policy formulation.
2. Theoretical Background of Bike-Sharing Systems
2.1. Bike-Sharing—History
Bike-sharing, commonly referred to as public bicycle systems (PBS), has become an essential component of sustainable urban transportation strategies. Historically, the evolution of bike-sharing presents a fascinating path from grassroots initiatives to sophisticated technological frameworks, reflecting the broader trend of urban mobility progress. This progression can be divided into four unique generations, each marked by technological advancements and operational improvements that have gradually influenced the contemporary systems we observe today.
The idea of bike-sharing began in the 1960s with the White Bicycle Plan in Amsterdam, the initial system that offered bicycles for public and communal access [29]. This innovative project sought to promote sustainable transportation and decrease dependence on automobiles in the city. However, the lack of systems to monitor or control bicycle usage caused significant problems, including widespread theft, misuse, and operational failures. Although the programme eventually did not succeed, it established the conceptual groundwork for future advancements by presenting the notion of shared urban mobility [3,29].
The second wave of bike-sharing systems appeared in the 1990s, featuring notable enhancements to overcome the shortcomings of earlier versions. Copenhagen’s Bycyklen initiative, introduced in 1995, served as a remarkable case. This system implemented coin-operated docking stations and specially designed bicycles to reduce theft and improve operational efficiency. The systematic, station-oriented model of Bycyklen represented a significant progress by offering a dependable and orderly means of access. Although these systems were devoid of digital technology and user tracking, they demonstrated the viability of bike sharing as a scalable service and laid the groundwork for future, more sophisticated systems [7].
A significant shift took place with the launch of the third generation of bike-sharing programmes in the late 1990s and early 2000s, fuelled by advancements in information and communication technologies (ICT). These systems incorporated innovations, such as GPS tracking, mobile apps, and electronic payment methods, turning bike sharing into a completely digital and user-friendly solution. Notable instances are Lyon’s Vélo’v system and Paris’s Vélib’, both initiated in 2007. Vélib’ emerged as one of the initial large-scale systems to integrate real-time information on bike availability, available kiosks, and effortless payment methods. These characteristics not only enhanced the user experience but also allowed cities to track system performance and refine operations using data-informed decision making. The success of Vélib’ showcased the possibility for bike-sharing to grow quickly and function effectively in crowded urban environments, facilitating its worldwide acceptance [30].
The fourth wave of bike-sharing systems appeared in the mid-2010s, featuring dockless designs and cutting-edge technologies like electric-assist bicycles (e-bikes) and AI-enabled fleet management. Dockless systems removed the necessity for fixed docking stations, utilising GPS-enabled smart locks and mobile apps for users to find and unlock bikes. In China, companies, such as Mobike and Ofo, popularised this model, providing unparalleled flexibility and considerably reducing infrastructure costs for urban regions. Users were able to collect and leave bicycles almost anywhere inside a specified service zone. Nonetheless, the swift expansion of dockless systems has also brought about new difficulties, such as improper parking, urban congestion, and excessive fleet presence in specific metropolitan areas [31,32].
To address these challenges, hybrid systems have developed as a progression of fourth-generation models, merging the adaptability of dockless systems with the organisation of station-based models. Hybrid systems frequently employ geofencing technology to establish virtual docking zones, directing users to park bikes in assigned locations while maintaining the advantages of dockless models. The addition of e-bikes has broadened the range of fourth-generation systems, enabling bike-sharing to reach a larger audience, including individuals with reduced physical abilities and those commuting over greater distances. These developments have established fourth-generation systems as flexible and responsive options in urban transport networks [33,34].
In the US, bike-sharing programmes like Citi Bike in New York City and Divvy in Chicago have shown that these systems can succeed even in cities focused on cars. Backed by public–private partnerships, these initiatives merge top-notch service with data-driven decision making to improve operational effectiveness and boost user satisfaction. In China, key cities like Beijing and Shanghai continue to lead bike sharing, featuring some of the world’s largest fleets.
Worldwide, bike-sharing has evolved into a crucial component of urban transportation networks, featuring more than 2000 systems across six continents and a combined fleet exceeding 20 million bicycles [35]. European cities like Amsterdam, Copenhagen, and Paris have established standards for sustainable and unified bike-sharing systems, frequently backed by strong infrastructure, such as dedicated bike paths and smooth integration with public transport.
The future of bike-sharing systems is anticipated to be influenced by additional technological progress, such as artificial intelligence (AI) and digital development [36] for forecasting demand and managing fleets dynamically, blockchain technology for secure and transparent transactions, and autonomous mobility solutions for reallocating bicycles. Moreover, city regions are progressively investigating the combination of bike-sharing with environmentally friendly infrastructure, including solar-powered docking stations and sustainable urban planning, to enhance their ecological advantages. These trends indicate an upcoming generation of bike-sharing systems that will remain crucial in tackling urban mobility issues and aiding the shift towards smarter, more sustainable cities [37,38,39,40].
2.2. Definition and Classification of Bike-Sharing Systems
Bike-sharing systems can be categorised based on their operational models, which determine how bicycles are accessed, utilised, and returned. This categorization represents the variety of design methods and the flexibility of bike-sharing in different urban context. The primary models include station-based systems, dockless systems, and hybrid systems.
Station-based systems, often referred to as docking station systems, operate through fixed infrastructure where bicycles are both rented and returned. require users to collect and return bicycles at designated docking stations, strategically located in high-demand areas, such as transit hubs, commercial districts, and residential neighbourhoods. The permanent docking infrastructure ensures secure bicycle storage when not in use, thereby reducing the risk of theft and vandalism. This structure also facilitates efficient fleet management, as centralised docking points allow operators to monitor and reallocate bicycles effectively. While station-based systems offer reliability and operational control, they are less flexible, as users must find a docking station neat their point od departure or destination. Additionally, the installation and maintenance of docking stations can be financially demanding particularly in large metropolitan areas or cities with constrained public resources [3].
In contrast, dockless systems eliminate the need for fixed docking stations, relying on GPS-enabled smart locks and mobile applications. These systems allow users to locate and access bicycles via smartphone apps and to park them anywhere within a designated service area. The flexibility of dockless systems enhances user convenience, enabling bicycles to be picked up near the point of origin and dropped off close to the final destination. Additionally, dockless systems significantly reduce infrastructure costs, as they do not require the construction and maintenance of physical docking stations. However, this flexibility introduces several challenges, including improper parking, which can contribute to urban clutter, as well as increased risks of theft and vandalism due to the dispersed nature of the fleet. Operational inefficiencies may also arise when bicycles become concentrated in specific locations, necessitating active redistribution efforts by system operators [41].
Hybrid systems combine elements of both station-based and dockless models, offering a balance between operational structure and user flexibility. These systems typically employ geofencing technology to create virtual parking zones, guiding users to park bicycles in predefined locations without the need for physical docking infrastructure. Hybrid models address certain limitations inherent in the other two systems by integrating the of predictability and order of station-based frameworks with the convenience and accessibility of dockless operations. They help reduce urban clutter by encouraging users to park in designated areas, while still allowing for pick-ups and drop-offs closer to users’ desired locations. However, the implementing of virtual parking zones can be challenging, often requiring advanced technological solutions as well as effective strategies to ensure user compliance [2,42].
2.3. Bike-Sharing System in the Light of Scientific Research
Bike-sharing schemes have been the focus of extensive scholarly research, reflecting their growing importance within urban transportation systems. Researchers have explored a wide range of topics, including economic impacts, environmental contributions, social dimensions, technological innovations, and health-related outcomes. These diverse perspectives highlight the multifaceted nature of bike-sharing systems and point to areas requiring further investigation—particularly the role of infrastructure and its influence on user perceptions and system performance.
From the economic perspective bike-sharing systems have been extensively analysed, with research highlighting their potential to generate cost savings for users, stimulate local economies, and address challenges related to financial sustainability. Scholars have examined various aspects, including cost structures, funding models, and the broader economic impacts of bike-sharing on urban mobility and development.
A significant area of research concerns the financial viability of bike-sharing systems, which often depend on combination of user fees, public funding, and private sponsorship. Fishman emphasised the importance of public–private partnerships (PPPs) in ensuring the long-term sustainability of these initiatives, noting that municipal subsidies or corporate sponsorships are frequently required to offset high operational costs. For instance, New York City’s Citi Bike programme is supported by a sponsorship from Citibank, which covering maintenance and expansion expenses [43]. Similarly, research by Shaheen et al. highlighted that many bike-sharing programmes are unable to rely solely on user-generated revenue, particularly during the initial years of operation [44].
Adaptive pricing strategies have also been examined as a means of balancing affordability with profitability. Dong et al. found that platforms offering a combination of subscription models and pay-per-use charges tend to attract a more diverse user base [45,46]. Striking the right pricing balance is inherently challenging: excessively high fees may deter potential users, while heavily subsidised schemes can lead to financial instability. Jin and Sui noted that, although subsidies can improve system accessibility and equity, they may unintentionally foster dependency, thereby reducing operators’ incentives to innovate or lower operational costs [47].
Beyond their financial frameworks, bike-sharing systems have demonstrated notable economic benefits for users. They provide a cost-effective solution for short-distance travel and last-mile connectivity, helping to reduce transport expenses—particularly in urban areas characterised by high living costs or limited access to public transport. Wieliński et al. highlighted that bike-sharing is particularly advantageous for individuals who rely on multimodal transport, offering a flexible and affordable means to address urban mobility gaps [48].
Bike-sharing programmes also contribute to broader urban economic activity. Hosford et al. found that bike-sharing systems in Canadian cities improved access to local businesses, especially those located in commercial areas near docking stations [49]. Similarly, Chen et al. observed that bike-sharing fosters tourism by offering an economical and convenient way to navigate urban spaces, thereby increasing revenue for restaurants, shops, and cultural institutions [50]. Moreover, these systems stimulate job creation in areas such as fleet maintenance, software development, and customer support, thereby amplifying their economic impact. Qian and Niemeier demonstrated that investments in bike-sharing frequently generate a multiplier effect, supporting growth in related sectors while enhancing overall urban liveability [51].
From an ecological standpoint, bike-sharing programmes are widely recognised for their environmental benefits, positioning them as a key component of sustainable urban mobility strategies. Numerous studies have demonstrated their capacity to reduce greenhouse gas emissions, improve air quality, and alleviate traffic congestion by encouraging a modal shift from private motor vehicles to bicycles. This transition supports broader urban sustainability goals and contributes to the development of cleaner, more liveable cities.
Zhang et al. conducted an in-depth study of bike-sharing systems in Chinese cities, quantifying their effects on CO2 emission reduction. Their research revealed that bike-sharing not only replaced short car trips but also reduced dependence on motorised transport for last-mile connectivity, substantially contributing to urban air pollution mitigation [52]. Likewise, Ma et al. examined the impact of bike-sharing on modal shift in various global cities, highlighting that a considerable share of bike-sharing trips substituted car travel [53]. This shift was especially pronounced in areas where bike-sharing systems were effectively integrated with public transportation, offering users a seamless and environmentally friendly multimodal travel option.
In addition to replacing car journeys, bike-sharing has been shown to reduce urban traffic congestion. Li et al. found that these systems provide a low-impact alternative to private vehicle use, particularly during peak hours [54]. This reduction in congestion yields further environmental benefits, including lower emissions from idling vehicles and improved fuel efficiency for other road users.
The social dimensions of bike-sharing initiatives have been extensively studied, with particular emphasis on issues of equity, accessibility, and inclusiveness. These systems presents unique opportunities to address mobility challenges for underrepresented populations by providing affordable transportation options in areas where public transit may be limited or unreliable. However, despite their potential social benefits, significant barriers to equitable access still exist, raising critical questions about how bike-sharing programmes can be designed and implemented to maximise their social impact.
A notable advantage of bike-sharing initiatives is their potential to enhance transportation access for low-income and marginalised communities. Tuli and Mitra examined equity-focused policies in bike-sharing programmes across the United States, finding that subsidies and targeted outreach efforts can significantly increase participation among low-income and minority groups [55].
In addition to improving mobility, bike-sharing programmes can foster community engagement and social cohesion. Research conducted by Cheng et al. found that bike-sharing enhances the liveliness of urban communities by promoting interaction among residents and diminishing social isolation [56]. Moreover, encouraging active living through cycling has been recognised as an important social advantage, with studies showing that frequent use of bike-sharing can improve both physical and mental health. These advantages are particularly important in urban environments, where sedentary lifestyles and long-term health conditions are increasingly prevalent.
Technological and operational innovations have played a pivotal role in transforming bike-sharing systems from basic community services into sophisticated urban mobility solutions. The integration of digital tools and innovative operational models has significantly enhanced user experience, increased operational efficiency, and enabled scalability, while also facilitating integration into broader urban transportation ecosystems.
A key technological advancement in the evolution of bike-sharing systems has been the adoption of information and communication technologies (ICT). These include GPS tracking, mobile applications, and digital payment systems, all of which have reshaped how users interact with bike-sharing services. ICT innovations support real-time bicycle availability tracking, seamless payment processing, and route optimisation [57,58].
Mobile applications have become the primary interface for users, offering comprehensive platforms for registration, bicycle location, trip monitoring, and payment. Many apps now include user-friendly features, such as gamification, loyalty incentives, and integration with navigation tools. GPS technology, in particular, has been instrumental in improving operational efficiency—especially within dockless and hybrid systems. GPS-enabled smart locks allow operators to manage fleets in real time, ensuring bike availability in high-demand areas and enabling the retrieval of lost or improperly parked bicycles. Li et al. underscored the importance of GPS in improving fleet distribution and reducing theft, a persistent issue in earlier generations of bike-sharing systems [59,60,61].
The integration of bike-sharing into Smart City frameworks has further amplified system efficiency and reach. By linking bike-sharing data with broader urban transport systems, municipalities can leverage real-time analytics to improve traffic flow, reduce congestion, and strengthen multimodal connectivity. Mobility-as-a-Service (MaaS) platforms increasingly incorporate bike-sharing as a core component, allowing users to plan and pay for multimodal journeys through a single digital interface.
Bike-sharing programmes have emerged as a key tool for promoting public health by encouraging physical activity through active transportation. By facilitating short cycling trips, they offer a convenient and affordable way for individuals to integrate exercise into daily routines, addressing health risks linked to sedentary lifestyles. Numerous studies confirm the health benefits of bike-sharing use, including reduced risks of cardiovascular disease, obesity, and other inactivity-related conditions [62]. Cycling has also been associated with improved mental well-being, offering stress relief, outdoor exposure, and enhanced social interaction. Ricci found that bike-sharing schemes in European cities improved users’ health while also contributing to better air quality and urban liability [63]. However, the long-term, population-level public health effects of bike-sharing remain underexplored. While individual benefits are well-documented, few studies have assessed how large-scale adoption impacts broader health indicators, such as healthcare costs or rates of lifestyle-related illnesses. Further research is needed to evaluate these long-term outcomes and assess the economic value of associated health gains. Despite advances in exploring economic, environmental, social, health, and technological aspects of bike-sharing, infrastructure remains comparatively underexamined. In much of the literature, infrastructure is treated as a secondary factor, resulting in limited understanding of its influence on user perceptions, adoption rates, and system performance. Yet, infrastructure is fundamental to operational efficiency and user satisfaction. Key infrastructure components include docking stations, virtual parking zones, bike lane networks, and cyclist-friendly crossings. While some studies (e.g., [64,65,66,67]) stress the importance of locating docking stations in high-demand areas, research has often focused on operational logistics, overlooking how infrastructure quality shapes user experience.
The presence and quality of bike lanes are widely acknowledged as essential for safety and accessibility, yet their effects remain insufficiently assessed. For instance, Knight and Charlton found that separated lanes reduce accidents and encourage cycling, especially among novice users, while Ye demonstrated a positive relationship between cycling infrastructure and bike-sharing adoption globally [68]. However, little is known about how specific components—such as connectivity between bike lanes and docking stations or integration with public transit—affect perceived benefits and user satisfaction.
Dockless and hybrid systems introduce further challenges, relying on virtual parking and geofencing rather than fixed infrastructure. While praised for flexibility and lower investment costs, they often contribute to urban clutter and parking issues. Ferrari et al. [69] documented such problems in Chinese cities, where a lack of designated parking led to oversupply and disorganisation. Although solutions like geofencing and designated virtual parking areas exist, evidence of their effectiveness remains limited. Moreover, the impact of infrastructure design and accessibility on user behaviour and parking compliance is still poorly understood.
Equity in infrastructure distribution is another critical but underexplored issue. Investments often favour affluent central areas, leaving marginalised neighbourhoods underserved. Research by Cunha and Silva [70] shows that such disparities deepen existing mobility inequalities, particularly for low-income and minority groups who depend on bike-sharing as an affordable transport option. While targeted investments—such as extending bike lanes to underserved areas or installing docking stations in disadvantaged neighbourhoods—have been attempted, they are often insufficient or poorly executed.
In parallel, technological infrastructure is gaining importance, especially with the rise in e-bikes. Studies [37] highlight their growing popularity in urban settings, while pointing to ongoing challenges related to charging infrastructure and the integration of renewable energy sources.
Poland, particularly the Silesian region, presents a compelling case for further investigation. As a densely populated area with a strong industrial legacy, Silesia offers both unique opportunities and challenges for the implementation of urban bike-sharing systems. The region’s ongoing urban transportation, combined with its distinctive historical context, underscores the importance in shaping the effectiveness of and public attitudes towards bike-sharing programmes. Despite the growing popularity of bike-sharing in Poland, there remains a lack of comprehensive research on how the presence and quality of infrastructural elements—such as bike lanes, docking stations, parking zones, and intermodal connections—influence user behaviour and perceived benefits. Moreover, little is known about how infrastructure interacts with other factors, including user demographics or policy interventions, to affect the long-term sustainability of bike-sharing systems. Accordingly, this paper aims to address the unexplored issue, contributing to a better understanding of the role of infrastructure in Poland and in post-industrial urban contexts more broadly.
3. Materials and Methods
This study employed a structured survey method to collect detailed information regarding the perceived benefits of bike-sharing services and the evaluation of their supporting infrastructure. The approach was designed to provide insight into users’ perceptions of bike-sharing systems, as well as the physical and technological components of the infrastructure that enables their operation. Figure 1. presents an overview of the research process, spanning from the data collection to the analysis phase. Accordingly, the survey was structured into two main sections. The first, it attempted to identify and understand the advantages which the users perceived in using the bike-sharing systems: from very practical advantages, like saving time or being cost-effective, to more subjective ones, like health promotion and environmental protection. The second section addressed infrastructure-related elements considered to the bike-sharing systems, including bike condition, station density, information availability, and integration with other modes of transportation.
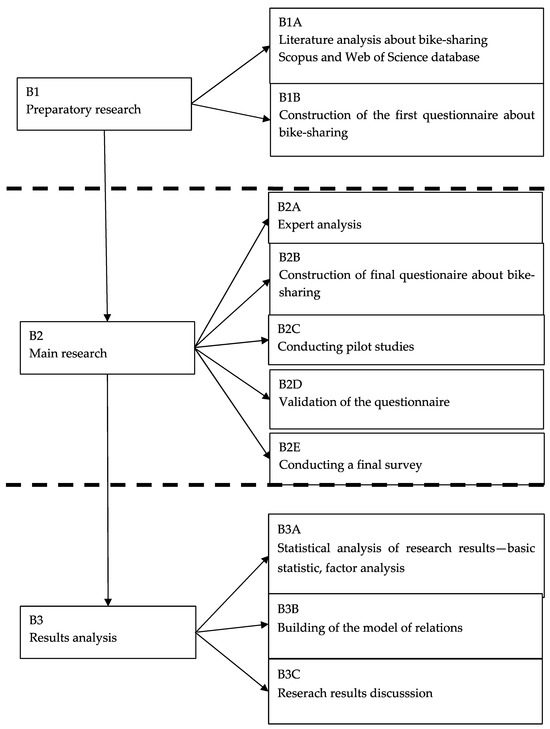
Figure 1.
Stages of the research procedure.
Following the initial research, a pilot study was carried out, designed to closely mirror the eventual full-scale survey. The main aim of the pilot phase was to identify and rectify potential issues with the questionnaire. These problems primarily concerned whether respondents clearly understood the questions and found them straightforward to answer. Valuable feedback from this stage led to revisions, notably in rephrasing questions to improve clarity and comprehension.
Furthermore, the pilot study offered a chance to evaluate the overall structure and logical progression of the questionnaire. Particular attention was given to the sequence of questions and determining the appropriate length for respondents. This stage also identified redundancies within the questions and indicated areas that required additional items to better address key dimensions of e-learning quality.
Cronbach’s Alpha (α) was employed in this research as a measure of the questionnaire’s reliability. The results—Cronbach’s alpha values of 0.902 for the first part and 0.879 for the second—showed a high correlation among questionnaire items. These findings suggest that the questions effectively measure the same underlying concept, specifically the perceived quality of e-learning. Typically, reliability coefficients ranging from 0.8 to 0.9 indicate strong reliability, highlighting a suitable balance between consistency and diversity, thus enabling precise differentiation among responses.
To determine the sample size, the following formula was used:
where
Nmin—the smallest acceptable sample size
NP—total size of the population from which the sample is selected
α—significance level, represented by Z-value derived from the normal distribution corresponding to the desired confidence,
f—fraction or proportion size
e—permissible maximum error margin,
For this research, the parameters below were selected:
α—significance level set at 0.05
NP—population size unknown
f—0.5
e—0.1.
The formula allowed for the estimation of the minimum sample size required to ensure that the findings would be representative and applicable to a wider population, despite the total number of bike-sharing users being unknown in the Silesian region. With a confidence level set at 95%, the researcher aimed to achieve a high degree of representation and precision in the findings regarding the user population. As a result, the final sample size reached 196 completed responses through online questionnaires, which were distributed through social media platforms targeting residents and potential bike-sharing users. This sample size exceeds the minimum calculated by the formula, thereby enhancing the reliability of this research. Additionally, through response filtering criteria, only feedback from active bike-sharing users was considered, ensuring that the collected data reflected direct experiences with these systems.
It has been based on a questionnaire administered to users of bike-sharing services in urban areas of the Silesian region. This online survey has targeted an audience that was familiar with and likely to use the local bike-sharing services that are offered through the Facebook platforms of various Silesian cities. This form of distribution, in fact, allowed for an effective collection of as many as 196 filled-out questionnaires. The questionnaire contained one question describing the extent of the user’s use of bike-sharing services. Consequently, it filtered out responses from those participants who had to identify themselves as active users of the bike-sharing [71,72].
A survey about bike-sharing obstacles was divided into two parts.
The first part concerned the main benefits to moving around by bike from bike-sharing systems. In this case, the following variables were considered:
- B1—Eco-friendly;
- B2—Avoids traffic jams;
- B3—Economical–low usage cost;
- B4—Speed–timesaving;
- B5—Opportunity for physical exercise;
- B6—Promotes health;
- B7—Improves physical fitness;
- B8—Personal image enhancement;
- B9—High availability;
- B10—No need to own a personal bicycle;
- B11—Possibility to combine with other public transport modes;
- B12—No worry about bicycle theft;
- B13—Possibility to transport shopping items.
The second part concentrate on the assessment of bike infrastructure to using bikes from bike-sharing systems. We have differentiated the following variables:
- I1—Application–ease of use;
- I2—Application–no errors hindering the rental process;
- I3—Application–no errors hindering payment for the ride;
- I4—Application–ability to check available bikes at stations;
- I5—Availability of bikes at stations;
- I6—Network of bike paths;
- I7—Density of bike rental locations;
- I8—Quality of bike path surfaces;
- I9—Technical condition of city bikes;
- I10—Visual condition of bikes;
- I11—Integration of bike transport with public transport;
- I12—Cost of using city bikes;
- I13—Bike racks;
- I14—Baskets for carrying shopping items;
- I15—Different types of bikes available for rent.
4. The Results
4.1. The Benefits of Bike-Sharing Systems
Table 1 presents a preliminary overview of the basic statistical characteristics of the main obstacles to using bike-sharing systems. In fact, the measures of central tendency, dispersion, and distribution shape referring to each variable give an outline that represents important insights into user perceptions and experiences.

Table 1.
Basic statistics for benefits to moving abound by bike from bike-sharing system.
Improvement in physical fitness has a mean score of 3.86, while promotion of health shows a mean of 3.84. This indicates that bike-sharing systems bear very strong value for keeping people fit and healthy. Opportunities for physical exercise receive the score of 3.80 and feature the idea of being able to fit a cycle ride into the daily schedule. Finally, eco-friendliness also scores among the highest results, 3.82, which really means that there are strong environmental benefits perceived; it could signal that indeed, sustainability has become one of the major attitudinal factors that speak about bike-sharing systems. Practical problems-for instance not being jammed in the queue ranked high at 3.74, reduction in problems linked with bicycle theft at 3.75 probably point to timesaving and security provided with those systems. The low usage cost was evaluated at moderate plus class-3.53, and therefore the overall recognition of the economic feasibility of bike-sharing systems was reflected.
The mean scores indicate that health, environmental, and practical implications are the major uses for bike-sharing systems. On the other hand, results from some instances in which it has shortcomings are noted to lie at personal image enhancement and the capacity-carrying ability of users as it lacks; an improvement of which one can undertake in future times.
Most of the median values are at consistently middle values; this is considering most benefits standing at 4.00 scores. This would also imply that about most aspects in bike sharing, the typical user’s median will stand very close to a positive perception.
The least value of standard deviation characterises this small dispersion, which equals 0.99 and can indicate high consent among the users in this respect. The option ‘avoiding traffic jams’ is characterised by relatively small dispersion, too; 1.03 testifies to this benefit being constantly perceived by most respondents. Results allow supposing that one aspect of the hypothesis is maintained, namely, a shared perception for users in terms of practicality and convenience given by bike-sharing systems not to feel congested and be assured that there would be bikes available.
Health-related features: promoting health 1.19 and improving physical fitness 1.16, received medium dispersion. These features, in general, received quite positive ratings; however, dispersion does allow for a thought that perceptions might vary depending on health goals or preferences of the individual.
The standard deviation values indicate that users show greater consensus regarding the system’s practical and time-saving benefits, while responses concerning aspects such as image enhancement and the ability to carry shopping items exhibit higher variability. These differences suggest areas where user needs and expectations are more heterogeneous, highlighting opportunities for service customisation and targeted improvements.
Most variables display a negative skew, suggesting a slight overall tendency for responses to cluster toward the higher end of the rating scale. Additionally, the kurtosis values for most variables are negative, indicating relatively flat and dispersed distributions compared to a normal distribution.
From an innovativeness perspective, the benefits of bike-sharing systems reflect how well the system meets the evolution of transportation needs, introduces novelty in solutions, and corresponds to general trends in sustainability, health, and convenience. It will be appropriate to break down this analysis of the results from the perspective of several important factors: (i) health and physical fitness-related, or improvement in physical fitness 3.86; health promotion, 3.84; physical exercising 3.80—all these signs answer the call for growing societal concern about sedentary lifestyles and health-related problems. These aspects reflect the fact that bike-sharing systems take advantage of growing demands for active transportation, amalgamating convenience with physical activity. The high median scores—4.00 and mean scores—3.80, 3.84, and 3.86 suggest that users of this system really look at these systems as an innovative way to help bring about an improvement in public health in keeping with global changes toward more sustainable and health-conscious urban lifestyles.
The emphasis on eco-friendliness, with a rating of 3.82, reflects the innovation of bike-sharing systems in promoting environmental sustainability. As people become more aware of climate change and urban pollution, bike-sharing provides a practical, low-carbon alternative to car usage. With a mean score of 3.82 and a consistent median of 4.00, both scores are moderately high, which shows strong appreciation for the environmental benefits of bike-sharing, with users valuing it as part of the transition toward greener and more sustainable transportation solutions. This positions bike-sharing, from an innovation perspective, as an effective tool within the greater movement of environmental responsibility and climate action. Bike-sharing systems also represent an innovative solution to the urban mobility problem. The reasons that prove how these systems could reduce some of the long-standing pains in traditional urban transportation include avoiding traffic jams, high availability, and no concern about bicycle theft, represented, respectively, by the factors 3.74, 3.25, and 3.75. For instance, the motivation of not getting stuck in traffic jams addresses a growing demand for more time- and stress-efficient ways of moving around in crowded cities. Although not rated highest, with a median of 3.00 for high availability, pragmatic innovations ensure clear, concrete added benefits in terms of convenience and accessibility of the system.
The innovation lies in offering an alternative mode of transportation that is both flexible and aligned with the needs of urban commuters Bike-sharing systems were perceived as a novel solution to the financial and logistical challenges associated with private bicycle ownership—namely, a convenient and low-cost alternative to owning a personal bike. This perception is reflected in a median rating of 3.00 and a mean score of 3.37, indicating a general recognition of the appeal of on-demand access to bicycles without the need for ownership. This also aligns with the rising sharing economies and user-centred innovations where people access products and services on an as-needed basis rather than owning them outright. This model reflects a shift toward more flexible, cost-effective transportation options in urban settings. Innovations for enhancing personal image ranked lower at 2.73, while the ability to transport shopping items ranked 3.15, indicating that though novel concepts have been introduced by bike-sharing systems, there is less emphasis on either image-driven or logistical innovations. The personal image enhancement means are lower, suggesting that users do not perceive bike-sharing as a significant tool to gain social status, and the score about the transport of shopping items is relatively modest, showing this functionality is not perceived as a big novelty. These results indicate that, while bike-sharing is indeed an innovative transportation solution, its impact on more niche, lifestyle-driven or practical features is less pronounced.
Thus, the application of factor analysis to assess the benefits derived from using bicycles within bike-sharing systems serves as an advanced statistical approach to uncover underlying dimensions shaping user experiences. Rotational methods, specifically normalised Varimax rotation, facilitate the interpretation of these dimensions by maintaining orthogonality—ensuring each factor distinctly captures a specific aspect of influence.
Factor analysis was conducted primarily to reduce the number of variables into meaningful factors, employing normalised Varimax rotation for clarity. The Kaiser-Meyer-Olkin (KMO) measure of sampling adequacy was calculated at 0.81, indicating that the correlation matrix is suitable and strongly supports the appropriateness of factor analysis in this context. According to Kaiser’s criterion, two factors should be retained as their eigenvalues exceed the threshold value of 1. Conversely, applying Cattell’s scree plot criterion suggests retaining three factors.
The results of the factor analysis revealed that the benefits of bike-sharing usage clearly cluster into three distinct factors, which collectively explain 64% of the total variance. Each factor represents a unique dimension of bike-sharing benefits, illustrated by the respective factor loadings summarised in Table 2. The Varimax rotation employed in this analysis maximises the variance explained by each factor individually while ensuring the factors remain orthogonal, meaning they are not correlated with each other.
Table 2.
The loadings of factors—benefits of bike-sharing.
The first factor represents the health and fitness benefits that bike-sharing systems offer (Figure 2). It encompasses aspects related to physical exercise, health promotion, and overall physical fitness. Users who associate bike-sharing with this factor view it primarily as a means of improving their physical well-being and maintaining an active lifestyle. These benefits are perceived as central to the appeal of bike-sharing, reflecting a growing trend in urban mobility that emphasises health-conscious choices.
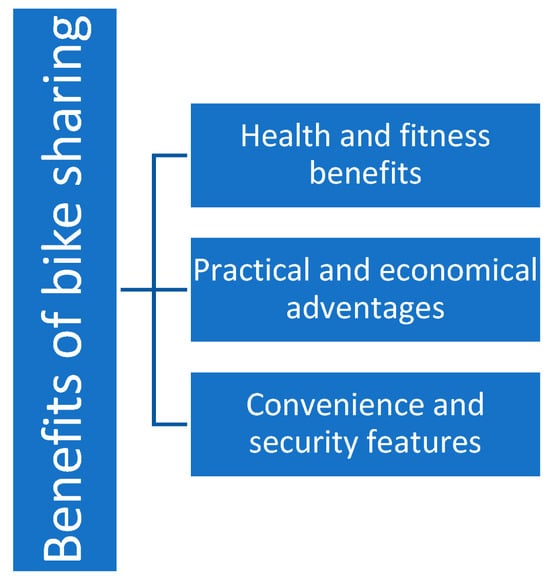
Figure 2.
Identified factors of benefits of bike sharing.
The second factor focuses on the practical and economic advantages of bike-sharing. This includes benefits such as avoiding traffic jams, saving time, reducing costs, and ensuring high availability of bikes. Users who are drawn to these aspects value the system’s efficiency and affordability. This factor highlights the practical utility of bike-sharing as a flexible, time-saving, and cost-effective alternative to other modes of transportation, especially in congested urban environments.
The third factor revolves around the convenience and security features of bike-sharing systems. It includes aspects such as eliminating the need for personal bicycle ownership, facilitating multimodal travel through integration with public transport, and alleviating concerns about bicycle theft. This factor highlights the ease and reliability of bike-sharing as a mobility solution that meets users’ transportation needs without the burdens associated with owning and maintaining a personal bicycle.
4.2. Classification of the Infrastructure Assessment of Bike-Sharing System
Table 3: A summary of the challenges encountered by users of bike-sharing systems, analysed through fundamental statistical measures. These challenges are interpreted using indicators, such as the mean, median, minimum, maximum, standard deviation, skewness, and kurtosis, which collectively illustrate users’ perceptions and experiences.
Table 3.
Basic statistics for infrastructure to using bikes from bike-sharing systems.
The analysis of infrastructural variables reveals generally neutral perceptions among users, with most mean scores clustering around 3.0. Features such as Application—Ease of Use (M = 3.31), No Errors in Rental/Payment Process (M = 3.05 and 3.18), and Ability to Check Available Bikes (M = 3.35), are functional but not perceived as particularly innovative. Skewness and kurtosis values are generally low and slightly negative, suggesting a moderate spread in opinions and a lack of strongly polarised views.
Standard deviations for these variables (approx. 1.0–1.08) indicate moderate variability, with some users reporting issues—particularly in rental and payment processes—while others experienced smooth functionality. These findings suggest the system is reliable but lacks features that would distinguish it as technologically advanced.
Physical infrastructure, including Bike Path Networks (M = 3.00), Docking Station Density (M = 2.99), and Bike Path Surface Quality (M = 3.11), was similarly rated as adequate but uninspiring. Skewness near zero reflects balanced perceptions, while slight leftward skew in variables, such as Bike Condition and Surface Quality, indicates that some users face notable but non-critical issues. The system performs its core functions but does not exceed expectations in design, quality, or integration.
The Visual Condition of Bikes (M = 3.02) and Integration with Public Transport (M = 3.07) were also rated neutrally, suggesting that users find these aspects acceptable but lacking in novelty or design sophistication. Cost of Using City Bikes (M = 3.23) was considered fair, though not competitively distinctive. Variability in responses points to differing price sensitivity, but overall, the pricing model is seen as conventional.
Additional features, such as Bike Racks (M = 3.15), Baskets (M = 3.14), and Bike Type Variety (M = 3.01; SD = 1.25), are valued as functional, yet not innovative. High standard deviations here reflect diverging user needs and expectations, particularly regarding variety and practicality.
Overall, the findings suggest that while the system is perceived as functional and reasonably well-performing, it does not stand out in terms of innovation. The lack of standout features in areas, such as app design, bike availability, multimodal integration, or infrastructure quality, points to significant room for improvement. Enhancements in technological integration, creative infrastructure solutions, and differentiated bike fleets could elevate the system beyond basic utility and position it as a leading example of innovative urban mobility. Factor analysis was conducted to consolidate factors into variables, subsequently applying normalised Varimax rotation. The Kaiser-Meyer-Olkin (KMO) measure for sampling adequacy reached 0.81, indicating the correlation matrix is suitable and supports the use of factor analysis in this particular study. According to Kaiser’s criterion, two factors with eigenvalues exceeding 1 should be retained. Similarly, Cattell’s scree plot criterion also recommended retaining two factors. The factor analysis examining the assessment of bike-sharing systems resulted in two distinct factors, collectively accounting for 48% of the total variance in the dataset. Each factor corresponds to a unique dimension related to infrastructure evaluation, as confirmed by the factor loadings presented in Table 4. By employing normalised Varimax rotation, the analysis extracted factors that individually maximise explained variance while preserving orthogonality—meaning the factors remain statistically independent of each other.
Table 4.
The loadings of factors—infrastructure assessment.
The first factor, which can be identified as the “Technical and Operational Quality of the System”, encompasses variables that relate to the functionality and condition of the system (Figure 3). This factor includes items like the technical condition of city bikes, visual condition of bikes, and application ease of use. It also captures aspects related to the network of bike paths, availability of bikes at stations, and bike racks. The significant loadings for these variables suggest that users primarily associate the quality and condition of the bikes, infrastructure maintenance, and the overall technical performance of the system as key factors influencing their satisfaction. This factor represents the physical and operational reliability of the bike-sharing system, indicating how well the bikes’ function and how effectively the system is maintained.
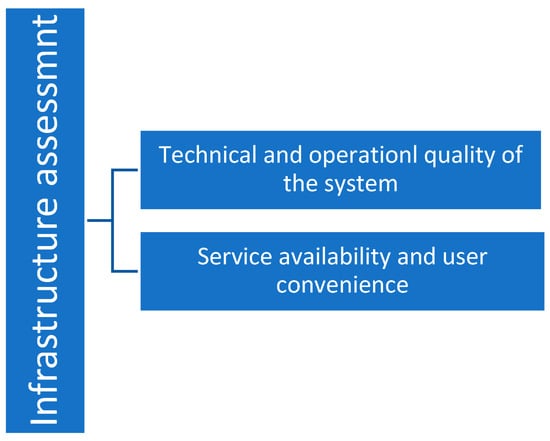
Figure 3.
Identified factors of infrastructure assessment.
The second factor, which can be identified as the “Service Availability and User Convenience”, focuses more on the accessibility and user-friendliness of the bike-sharing system. Variables, such as application error-free rental process, availability of bikes at stations, integration of bike transport with public transport, and cost of using city bikes, weigh heavily on this factor. It reflects the users’ perception of how convenient and accessible the system is in terms of finding bikes, navigating the rental process, and integrating with other modes of transport. This factor emphasises the ease of use, cost efficiency, and the broader accessibility of the system, indicating how well the system is designed to meet users’ everyday transportation needs.
4.3. The Multidimensional Model of Relationships Between Benefits of Bike-Sharing and Infrastructure Assessment
In the subsequent analytical phase, multiple regression analysis was applied to the available variables. It is crucial for regression models to incorporate variables that exhibit strong correlations with the dependent variable while maintaining minimal or insignificant correlations among the independent variables themselves. To develop these regression models, the backward stepwise multiple regression approach was utilised. This method facilitates the examination of how one dependent variable relies simultaneously on several explanatory (independent) variables. Consequently, multiple regression enables predicting values of the dependent variable based on information derived from independent variables.
Table 5 illustrates a Multidimensional Model of Relationships Between Infrastructure and Benefits in the context of bike-sharing systems. It integrates statistical relationships between the infrastructure elements (I1 to I15) and perceived benefits (B1 to B13) using regression coefficients, model fit statistics, and related metrics.
Table 5.
The multidimensional model of relationships.
4.3.1. Key Positive Relationships
One of the most notable findings is the positive spillover effect of application ease-of-use (I1) on several perceived benefits. Efficient app usability significantly correlates with time savings (B4 = 0.185), physical activity (B5 = 0.166), health promotion (B6 = 0.206), and availability of bicycles (B9 = 0.237). These results highlight the critical role of a user-friendly mobile application—not only in facilitating rentals, but also in integrating bike-sharing into users’ daily routines for health and mobility.
Similarly, the absence of technical errors during the rental process (I2) is strongly linked to perceptions of economic efficiency (B3 = 0.264) and bicycle availability (B9 = 0.346). These relationships underscore the importance of seamless digital processes in reducing user frustration, enhancing trust, and promoting the view of bike-sharing as an accessible, affordable public transport alternative.
Another key variable, access to real-time information on bike availability (I4), is positively associated with a range of benefits: avoiding traffic congestion (B2 = 0.279), low usage costs (B3 = 0.226), time savings (B4 = 0.255), health promotion (B6 = 0.173), and multimodal integration (B11 = 0.218). These results suggest that reliable, real-time data enhances system efficiency and user confidence, encouraging regular use and positioning bike-sharing as a dependable component of daily mobility.
Integration with public transportation (I11) also demonstrates strong associations with intermodal connectivity (B11 = 0.284) and reduced concerns about theft (B12 = 0.391). These findings reflect the added value of a well-connected transport network, which offers safer, more convenient transitions between cycling and other modes of transit.
Finally, the availability of diverse bike types (I15) is significantly related to health promotion (B6 = 0.660) and the practical ability to carry shopping items (B13 = 0.251). This diversity—from cargo bikes to e-bikes—broadens the appeal and functional scope of the system, supporting both fitness-related and utilitarian use cases.
4.3.2. Key Negative Relationships
While most infrastructure elements are positively associated with perceived benefits, some show negative correlations, indicating areas of user dissatisfaction. The technical condition of city bikes (I9) is negatively related to perceived eco-friendliness (B1 = −0.179), traffic avoidance (B2 = −0.266), and affordability (B3 = −0.297). Poor maintenance undermines perceptions of reliability, cost-efficiency, and environmental value, emphasising the need for consistent upkeep.
Similarly, the visual condition of bikes (I10) negatively correlates with time savings (B4 = −0.191) and integration with public transport (B11 = −0.185), suggesting that unappealing or poorly maintained bicycles discourage use, particularly in multimodal or time-sensitive contexts.
The density of rental stations (I7) is also inversely associated with multimodal integration (B11 = −0.201) and theft concerns (B12 = −0.153). While high station density may seem beneficial, excessive clustering without spatial optimisation can reduce efficiency and compromise security. Strategic placement is therefore essential to improving system performance and user trust.
4.3.3. Model Fit and Reliability
Model fit statistics confirm moderate to strong relationships between infrastructure and perceived benefits. Correlation coefficients (R) range from 0.380 to 0.588, with R2 values between 0.144 and 0.346—indicating that up to 34.6% of the variance in perceived benefits can be explained by infrastructure-related variables. Adjusted R2 values remain high for economic benefits (B3 = 0.261) and integration with public transport (B11 = 0.209), affirming the robustness of the model. Standard errors (0.866–1.356) reflect moderate variability, leaving room for improvement while supporting the model’s reliability in guiding infrastructure enhancements.
The findings underscore infrastructure’s pivotal role in shaping perceptions of bike-sharing. Technological aspects—such as mobile app usability and real-time information—strongly influence user views on affordability, efficiency, and integration. Conversely, weak points in bike maintenance and appearance highlight areas for improvement. Diverse bike types and seamless integration with public transport emerge as critical levers for increasing system flexibility and adoption.
From an innovation perspective, the results emphasise the transformative impact of system design, digital integration, and infrastructure improvements on user satisfaction. Reliable, intuitive applications—free of errors—are key to presenting bike-sharing as a modern, user-friendly transport solution. For the first time, full integration with public transport positions bike-sharing as part of a comprehensive, multimodal transit network, offering seamless first- and last-mile connectivity.
Opportunities for further innovation include predictive maintenance through IoT-enabled sensors, improved frame design (e.g., ergonomic, lightweight, or customizable bikes), and flexible docking strategies such as geofenced zones or virtual stations. These enhancements would improve convenience, reduce clutter, and adapt better to urban conditions.
Cost-related innovations could involve dynamic pricing, subscriptions, or incentive-based models that promote regular use while increasing system equity—particularly among low-income users. Environmentally focused developments, such as renewable-powered charging stations and recycled bike materials, could strengthen the sustainability narrative.
Finally, integrating health-oriented features into mobile apps—such as fitness tracking or gamification—could attract wellness-conscious users and reinforce cycling as a long-term lifestyle habit. Together, these innovations would not only address current limitations but also position bike-sharing systems as adaptive, inclusive, and future-ready urban mobility solutions. Figure 4 presents the Hierarchical Model of the Bike-Sharing System in Poland, illustrating the interdependencies between various infrastructural and operational components affecting the effectiveness and efficiency of bike-sharing networks. The model highlights significant factors like physical infrastructure, technological integration, and policy support, all of which play critical roles in defining the usability and user experience of bike-sharing services. Specifically, the diagram represents the interface between docking stations, bike lanes, and multimodal transport integration, emphasising the need for total connectivity among them. Based on the analysis of the hierarchical structure, the model helps to determine the loopholes in the existing system and provides a template for improvements to be implemented in the future, which could potentially enhance accessibility, sustainability, and general users’ experience.

Figure 4.
Hierarchical model of bike-sharing system in Poland.
One of the significant focuses of the hierarchical model is on the relevance of infrastructure quality in promoting the success of bike-sharing schemes, particularly in post-industrial zones, such as Silesia in Poland. Proper maintenance of cycle lanes, selective positioning of docking stations, and technological advancements, such as real-time tracking and IoT-based monitoring, are the focuses identified by the model. In addition, it specifies policy interventions that affect adoption of bike-sharing, including urban planning initiatives, cycling infrastructure investment and social equity values. Incorporation of these aspects in the hierarchical model provides useful insights to planners and policymakers seeking to establish an inclusive and more effective bike-sharing system. By alleviating infrastructural deficits and leveraging technological progress, the model serves as a harbinger for optimising bike-sharing services in Poland and similar cityscapes worldwide.
5. Discussion
5.1. Key Benefit of Bike-Sharing System
The findings of this study provide valuable insights into the relationship between bike-sharing services and the perceived benefits for users in the Silesian region of Poland. They contribute to the expanding body of research on smart cities and shared mobility, aligning with ongoing discourse on sustainable urban development and the application of technology in transport systems [31,32,33,34,35,36,37,38]. This research presents a comprehensive, multifaceted analysis of bike-sharing systems in Silesia, employing descriptive statistics, factor analyses, and regression models to examine both user-perceived benefits and infrastructural-related challenges. The results provide a detailed understanding of how technological performance, operational reliability, and service integration collectively influence user satisfaction and broader urban mobility outcomes. By situating these findings within the context of active transportation studies [44,63] and sustainable urban development, this study underscores the transformative potential of bike-sharing systems when supported advanced technological and infrastructural solutions.
This study shows that health-related benefits are among the most valued features of bike-sharing systems. Users report notable improvements in physical fitness (mean = 3.86) and overall health promotion (mean = 3.84), supporting the view that active transportation helps mitigate the negative effects of sedentary lifestyles—an area of growing concern in public health research [63]. Eco-friendliness stands out as an important advantage, with an average score of 3.82, showing that users acknowledge bike-sharing’s role in decreasing urban carbon emissions and easing traffic congestion. These findings are consistent with previous studies on the environmental benefits of shared mobility [52,73] and highlight the contribution of bike-sharing systems to broader climate action goals.
Simultaneously, the assessment of infrastructural aspects shows that numerous essential elements—spanning from the usability of mobile applications (mean = 3.31) to the bicycles’ technical and visual states (both approximately averaging 3.00)—are evaluated at moderate levels. While these ratings indicate that the bike-sharing system fulfils basic functional needs, they also reveal significant potential for innovation. For instance, although the performance of elements like bike availability and bike path networks is satisfactory (averages close to 3.00), the considerable variability in responses (indicated by standard deviations frequently over 1.00) implies that user experiences differ significantly. This diversity could be linked to variations in user demographics, the geographic spread of services, or differing anticipations about the quality and dependability of shared mobility services.
5.2. Infrastructure Assessment and User Experience
The factor analysis of the infrastructure evaluation enhances our comprehension by pinpointing two main dimensions. The primary dimension, referred to as “Technical and Operational Quality”, includes factors concerning the state and upkeep of bicycles, the quality of bike lane surfaces, and the overall reliability of the system. The second dimension, “Service Availability and User Convenience”, encompasses factors related to the usability of mobile apps, immediate data on bike availability, affordability, and the connection of bike-sharing with larger public transport systems. These dimensions reflect the current performance of the service and highlight possible areas for enhancement. Consistent with the insights of Papadakis et al. [74] and Sun et al. [75], improving these infrastructural components may greatly increase the perceived advantages and total usefulness of bike-sharing systems.
The regression analyses provide a detailed assessment of the relationships between infrastructural features and perceived benefits. Notably, the usability of the mobile application (I1) shows positive associations with key outcomes, such as time savings (B4, coefficient = 0.185) and increased physical activity (B5, coefficient = 0.166), underscoring the role of user-friendly digital interfaces in enhancing service efficiency. Similarly, access to real-time information on bike availability (I4) correlates positively with practical benefits, including reduced traffic congestion (B2, coefficient = 0.279) and improved cost-effectiveness (B3, coefficient = 0.226). These findings align with current smart mobility research, which emphasises the value of real-time data and accessible technologies in overcoming operational barriers [76,77]. On the other hand, adverse connections are noted for specific infrastructural shortcomings. The technical state of the bicycles (I9) exhibits an inverse relationship with advantages tied to environmental friendliness, traffic evasion, and cost-effectiveness, whereas the visual state of the bicycles (I10) negatively impacts views on time efficiency and compatibility with public transportation. These findings indicate that neglecting maintenance not only diminishes the visual attractiveness of the bikes but also detracts from their functionality, potentially diminishing user confidence—a conclusion aligned with previous research emphasising the vital role of maintenance and operational dependability in shared mobility systems [78,79].
5.3. Integration with Public Transport and Multimodal Mobility
The regression models highlight the significance of integrating multiple modalities. Enhanced integration with public transport (I11) is strongly linked to better multimodal connectivity (B11) and decreased worries about bicycle theft (B12). The integration of bike-sharing with public transit is crucial for promoting a shift away from private car dependence—an objective widely supported in the literature on sustainable urban mobility [80,81].Furthermore, the variety of bike types on offer (I15) demonstrates strong positive links to advantages associated with health promotion and practical applications, like carrying shopping goods (B13), indicating that the incorporation of specialised bike categories—such as e-bikes and cargo bikes—may enhance the attractiveness of bike-sharing systems and address a broader spectrum of urban mobility requirements [82,83].
5.4. Innovation and Future Directions
A notably original aspect of this research is its thorough analysis of innovative practises and their effects on infrastructure performance. Recent innovations in digital technology—like AI-based demand forecasting and IoT-supported predictive maintenance—exemplify modern strategies that can be incorporated into bike-sharing systems to improve performance and increase user satisfaction. For example, the use of smart sensors for real-time monitoring of bike conditions enables a proactive maintenance approach, significantly reducing downtime and improving the technical reliability of the fleet [84,85]. Additionally, mobile applications that provide dynamic updates and seamless real-time communication enhance both operational efficiency and user experience by reducing confusion and frustration caused by system errors. These advancements, leading in today’s technological progress, showcase the promise for bike-sharing systems to transform into comprehensive, intelligent mobility solutions.
An additional innovative aspect identified in this research is the potential for dynamic pricing and incentive-driven initiatives. The data indicates that economic advantages—like reduced usage costs (B3) and cost-effectiveness—can be improved by utilising adaptive pricing models that react in real-time to changes in demand. These models can enhance resource use while maintaining affordability for various users, thus facilitating fair access to shared mobility services. Furthermore, integrating gamification features into the user interface could serve as an innovative strategy to engage users and encourage healthier, more active lifestyles, thereby amplifying the health promotion benefits highlighted in our research.
5.5. Policy Implications and Recommendations
From a policy and strategic innovation perspective, these findings offer clear guidance for future development. Enhancing digital platforms through advanced analytics and user-centred design is crucial for optimising system performance and improving user satisfaction. Enhancing the spatial arrangement of bike stations through geo-spatial analytics and investigating innovative docking solutions like virtual docking or dockless systems, may tackle inconsistencies in station accessibility and boost overall system efficiency. Additionally, dynamic pricing strategies and incentive initiatives, aimed at responding to real-time demand and encouraging regular usage, could further improve the economic viability and accessibility of bike-sharing services, particularly within underserved communities.
5.6. Conclusions and Future Research
In conclusion, while the bike-sharing system in the Silesian region provides notable health, environmental, and practical benefits, there remains significant potential for innovation in both technological and infrastructural domains. Addressing issues, such as maintenance and multimodal integration, alongside adopting advanced digital solutions, can substantially enhance system efficiency. These improvements will help solidify bike-sharing’s role in sustainable urban mobility—promoting public health, environmental outcomes, and integrated transport networks. Future research should employ longitudinal and qualitative approaches to better understand evolving user expectations and the impact of technological advancements on satisfaction in an increasingly dynamic urban context.
5.7. Key Findings
To provide a clearer overview of the key findings, Table 6 presents a structured summary of the results of this study.
Table 6.
Summary of Main Findings.
6. Conclusions
This study examined the relationship between bike-sharing infrastructure and user-perceived benefits in the context of Smart Cities, focusing on the Silesian region of Poland. Through a combination of statistical and regression analyses, this research provides evidence for how infrastructure influences system effectiveness, user satisfaction, and sustainable mobility outcomes.
Addressing Q1, the most valued benefits identified by users were health-related improvements (e.g., physical fitness) and environmental advantages, such as reduced emissions and congestion. These findings align with broader urban sustainability goals [44,63]. In response to Q2, users highlighted infrastructure shortcomings, including fragmented cycling networks, uneven station distribution, and inconsistent bike maintenance. These issues were particularly limiting in peripheral areas, reducing access and frequency of use. Regarding Q3, the analysis confirmed that infrastructure quality directly affects user satisfaction. Key factors include bike condition, station density, and integration with public transport. Features like real-time availability, booking via mobile apps, and cashless payments significantly enhance user experience and operational appeal [31,32,33,34,35,36,37,38,74,75]. For Q4, the regression models demonstrated moderate to high explanatory power, especially for benefits linked to maintenance, station placement, and multimodal integration. However, external factors, such as weather, seasonal variation, and individual preferences, may also influence outcomes and warrant further study.
Policy implications include expanding bike lane networks, optimising station placement, integrating bike-sharing with public transit through unified payment systems, and leveraging technologies like real-time tracking and AI-based fleet management. While this study provides robust insights, its regional focus limits its generalisability. Future research should include comparative analyses across diverse urban settings and examine behavioural and cultural factors shaping system adoption.
In summary, the findings reinforce the critical role of infrastructure quality in maximising the benefits of bike-sharing systems. They offer valuable guidance for policymakers and urban planners seeking to modernise mobility systems and promote sustainable urban development—especially in post-industrial contexts.
Author Contributions
Conceptualization, K.T. and R.W.; literature review: K.T. and R.W.; methodology, K.T. and R.W.; validation, K.T. and R.W.; formal analysis, K.T. and R.W.; investigation, K.T. and R.W.; writing—original draft preparation, K.T. and R.W. writing—review and editing, R.W.; funding acquisition, R.W. All authors have read and agreed to the published version of the manuscript.
Funding
This research received no external funding.
Data Availability Statement
The original contributions presented in this study are included in the article. Further inquiries can be directed to the corresponding authors.
Conflicts of Interest
The authors declare no conflicts of interest.
References
- Bösehans, G.; Bell, M.C.; Dissanayake, D. Shared Mobility—Novel Insights on Mode Substitution Patterns, Trip and User Characteristics. J. Cycl. Micromobil. Res. 2024, 2, 100029. [Google Scholar] [CrossRef]
- Ma, X.; Zhang, S.; Wu, T.; Yang, Y.; Yu, J. Can Dockless and Docked Bike-Sharing Substitute Each Other? Evidence from Nanjing, China. Renew. Sustain. Energy Rev. 2023, 188, 113780. [Google Scholar] [CrossRef]
- DeMaio, P. Bike-Sharing: History, Impacts, Models of Provision, and Future. J. Public Transp. 2009, 12, 41–56. [Google Scholar] [CrossRef]
- Gössling, S. Urban Transport Transitions: Copenhagen, City of Cyclists. J. Transp. Geogr. 2013, 33, 196–206. [Google Scholar] [CrossRef]
- Todd, J.; O’Brien, O.; Cheshire, J. A Global Comparison of Bicycle Sharing Systems. J. Transp. Geogr. 2021, 94, 103119. [Google Scholar] [CrossRef]
- Fan, Y.; Zheng, S. Dockless Bike Sharing Alleviates Road Congestion by Complementing Subway Travel: Evidence from Beijing. Cities 2020, 107, 102895. [Google Scholar] [CrossRef]
- Shaheen, S.A.; Guzman, S.; Zhang, H. Bikesharing in Europe, the Americas, and Asia: Past, Present, and Future. Transp. Res. Rec. J. Transp. Res. Board 2010, 2143, 159–167. [Google Scholar] [CrossRef]
- Chen, Y.; Zhang, Y.; Coffman, D.; Mi, Z. An Environmental Benefit Analysis of Bike Sharing in New York City. Cities 2022, 121, 103475. [Google Scholar] [CrossRef]
- Oyeyemi Olayode, I.; Jamei, E.; Justice Alex, F. Integration of E-Bikes in Public Transportation Based on Their Impact, Importance, and Challenges: A Systematic Review. Multimodal Transp. 2025, 4, 100182. [Google Scholar] [CrossRef]
- Mahajan, S.; Argota Sánchez-Vaquerizo, J. Global Comparison of Urban Bike-Sharing Accessibility across 40 Cities. Sci. Rep. 2024, 14, 20493. [Google Scholar] [CrossRef]
- Steinacker, C.; Storch, D.-M.; Timme, M.; Schröder, M. Demand-Driven Design of Bicycle Infrastructure Networks for Improved Urban Bikeability. arXiv 2022, arXiv:2206.06708. [Google Scholar] [CrossRef] [PubMed]
- Torrisi, V.; Ignaccolo, M.; Inturri, G.; Tesoriere, G.; Campisi, T. Exploring the Factors Affecting Bike-Sharing Demand: Evidence from Student Perceptions, Usage Patterns and Adoption Barriers. Transp. Res. Procedia 2021, 52, 573–580. [Google Scholar] [CrossRef]
- Piatkowski, D.; Bopp, M. Increasing Bicycling for Transportation: A Systematic Review of the Literature. J. Urban Plann. Dev. 2021, 147, 04021019. [Google Scholar] [CrossRef]
- Wellcome Home Portal. Silesia. The Most Promising Region in Poland. Available online: https://wellcome-home.com/blog/silesia-the-most-promising-region-in-poland/ (accessed on 22 January 2025).
- Bieliński, T.; Ważna, A.B.; Antonowicz, P. Shared Micro-Mobility Market Disturbances: The Polish Bike Sharing Market in Light of Z-Score Analysis. Schmalenbach J. Bus. Res. 2024, 76, 463–481. [Google Scholar] [CrossRef]
- Warsaw Veturilo. Available online: https://veturilo.waw.pl/en/news/ (accessed on 24 January 2025).
- GZM Metropolis. Available online: https://metropoliagzm.pl/2024/02/26/metrorower-wystartowal-najwiekszy-w-polsce-i-trzeci-w-europie-system-wypozyczalni-miejskich-rowerow-juz-dostepny/pny/ (accessed on 24 January 2025).
- Nextbike. Available online: https://nextbike.pl (accessed on 24 January 2025).
- International Urban and Regional Cooperation Portal. Silesian Voivodeship. Available online: https://www.iurc.eu/regions/silesian-voivodeship/ (accessed on 27 January 2025).
- Müller-Eie, D.; Kosmidis, I. Sustainable Mobility in Smart Cities: A Document Study of Mobility Initiatives of Mid-Sized Nordic Smart Cities. Eur. Transp. Res. Rev. 2023, 15, 36. [Google Scholar] [CrossRef]
- Kubik, A.; Turoń, K.; Folęga, P.; Chen, F. CO2 Emissions—Evidence from Internal Combustion and Electric Engine Vehicles from Car-Sharing Systems. Energies 2023, 16, 2185. [Google Scholar] [CrossRef]
- Jonek-Kowalska, I.; Wolniak, R. Smart Cities in Poland: Towards Sustainability and a Better Quality of Life? Taylor & Francis: Abingdon, UK, 2023; ISBN 1000935396. [Google Scholar]
- Jonek-Kowalska, I.; Wolniak, R. Sharing Economies’ Initiatives in Municipal Authorities’ Perspective: Research Evidence from Poland in the Context of Smart Cities’ Development. Sustainability 2022, 14, 2064. [Google Scholar] [CrossRef]
- Wolniak, R. European Union Smart Mobility–Aspects Connected with Bike Road System’s Extension and Dissemination. Smart Cities 2023, 6, 1009–1042. [Google Scholar] [CrossRef]
- Wolniak, R. Analysis of the Bicycle Roads System as an Element of a Smart Mobility on the Example of Poland Provinces. Smart Cities 2023, 6, 368–391. [Google Scholar] [CrossRef]
- Stecuła, K.; Wolniak, R.; Grebski, W.W. AI-Driven Urban Energy Solutions—From Individuals to Society: A Review. Energies 2023, 16, 7988. [Google Scholar] [CrossRef]
- Skubis, I.; Wolniak, R.; Grebski, W.W. AI and Human-Centric Approach in Smart Cities Management: Case Studies from Silesian and Lesser Poland Voivodships. Sustainability 2024, 16, 8279. [Google Scholar] [CrossRef]
- Wolniak, R.; Stecuła, K. Artificial Intelligence in Smart Cities—Applications, Barriers, and Future Directions: A Review. Smart Cities 2024, 7, 1346–1389. [Google Scholar] [CrossRef]
- Guo, Y.; Yang, L.; Chen, Y. Bike Share Usage and the Built Environment: A Review. Front. Public Health 2022, 10, 848169. [Google Scholar] [CrossRef]
- Fuller, D.; Gauvin, L.; Kestens, Y.; Daniel, M.; Fournier, M.; Morency, P.; Drouin, L. Use of a New Public Bicycle Share Program in Montreal, Canada. Am. J. Prev. Med. 2011, 41, 80–83. [Google Scholar] [CrossRef] [PubMed]
- Ma, X.; Ji, Y.; Yuan, Y.; Van Oort, N.; Jin, Y.; Hoogendoorn, S. A Comparison in Travel Patterns and Determinants of User Demand between Docked and Dockless Bike-Sharing Systems Using Multi-Sourced Data. Transp. Res. Part A Policy Pract. 2020, 139, 148–173. [Google Scholar] [CrossRef]
- Zhang, C.; Du, B.; Zheng, Z.; Shen, J. Space Sharing between Pedestrians and Micro-Mobility Vehicles: A Systematic Review. Transp. Res. Part D Transp. Environ. 2023, 116, 103629. [Google Scholar] [CrossRef]
- Macioszek, E.; Świerk, P.; Kurek, A. The Bike-Sharing System as an Element of Enhancing Sustainable Mobility—A Case Study Based on a City in Poland. Sustainability 2020, 12, 3285. [Google Scholar] [CrossRef]
- Guido, C.; Rafal, K.; Constantinos, A. A Low Dimensional Model for Bike Sharing Demand Forecasting. In Proceedings of the 2019 6th International Conference on Models and Technologies for Intelligent Transportation Systems (MT-ITS), Cracow, Poland, 5–7 June 2019; pp. 1–7. [Google Scholar] [CrossRef]
- Fishman, E. Bikeshare: A Review of Recent Literature. Transp. Rev. 2016, 36, 92–113. [Google Scholar] [CrossRef]
- Bogers, M.L.A.M.; Garud, R.; Thomas, L.D.W.; Tuertscher, P.; Yoo, Y. Digital Innovation: Transforming Research and Practice. Innovation 2022, 24, 4–12. [Google Scholar] [CrossRef]
- Czech, P.; Turoń, K.; Urbańczyk, R. Bike-Sharing as an Element of Integrated Urban Transport System. In Advanced Solutions of Transport Systems for Growing Mobility. TSTP 2017; Sierpiński, G., Ed.; Advances in Intelligent Systems and Computing; Springer: Cham, Switzerland, 2018; Volume 631. [Google Scholar] [CrossRef]
- Bruzzone, F.; Scorrano, M.; Nocera, S. The Combination of E-Bike-Sharing and Demand-Responsive Transport Systems in Rural Areas: A Case Study of Velenje. Res. Transp. Bus. Manag. 2021, 40, 100570. [Google Scholar] [CrossRef]
- Burger, B.; Kanbach, D.K.; Kraus, S.; Breier, M.; Corvello, V. On the Use of AI-Based Tools like ChatGPT to Support Management Research. Eur. J. Innov. Manag. 2023, 26, 233–241. [Google Scholar] [CrossRef]
- Perri, C.; Giglio, C.; Corvello, V. Smart Users for Smart Technologies: Investigating the Intention to Adopt Smart Energy Consumption Behaviors. Technol. Forecast. Soc. Change 2020, 155, 119991. [Google Scholar] [CrossRef]
- Chen, Z.; Van Lierop, D.; Ettema, D. Dockless Bike-Sharing Systems: What Are the Implications? Transp. Rev. 2020, 40, 333–353. [Google Scholar] [CrossRef]
- Albiński, S.; Fontaine, P.; Minner, S. Performance Analysis of a Hybrid Bike Sharing System: A Service-Level-Based Approach under Censored Demand Observations. Transp. Res. Part E Logist. Transp. Rev. 2018, 116, 59–69. [Google Scholar] [CrossRef]
- Turoń, K. Multi-Criteria Decision Analysis during Selection of Vehicles for Car-Sharing Services—Regular Users’ Expectations. Energies 2022, 15, 7277. [Google Scholar] [CrossRef]
- Shaheen, S.; Cohen, A.; Chan, N.; Bansal, A. Sharing Strategies: Carsharing, Shared Micromobility (Bikesharing and Scooter Sharing), Transportation Network Companies, Microtransit, and Other Innovative Mobility Modes. In Transportation, Land Use, and Environmental Planning; Elsevier: Amsterdam, The Netherlands, 2020; pp. 237–262. [Google Scholar] [CrossRef]
- Iyengar, R.; Park, Y.-H.; Yu, Q. The Impact of Subscription Programs on Customer Purchases. J. Mark. Res. 2022, 59, 1101–1119. [Google Scholar] [CrossRef]
- Dong, Z.; Fan, Z.-P.; Wang, N. An Analysis of Pricing Strategy for Bike-Sharing Services: The Role of the Inconvenience Cost. Transp. Res. Part E Logist. Transp. Rev. 2023, 175, 103146. [Google Scholar] [CrossRef]
- Jin, S.T.; Sui, D.Z. Bikesharing and Equity: A Nationwide Study of Bikesharing Accessibility in the U.S. Transp. Res. Part A Policy Pract. 2024, 181, 103983. [Google Scholar] [CrossRef]
- Wielinski, G.; Trépanier, M.; Morency, C. Carsharing Versus Bikesharing: Comparing Mobility Behaviors. Transp. Res. Rec. J. Transp. Res. Board 2017, 2650, 112–122. [Google Scholar] [CrossRef]
- Hosford, K.; Winters, M. Who Are Public Bicycle Share Programs Serving? An Evaluation of the Equity of Spatial Access to Bicycle Share Service Areas in Canadian Cities. Transp. Res. Rec. J. Transp. Res. Board 2018, 2672, 42–50. [Google Scholar] [CrossRef]
- Chen, C.-F.; Huang, C.-Y. Investigating the Effects of a Shared Bike for Tourism Use on the Tourist Experience and Its Consequences. Curr. Issues Tour. 2021, 24, 134–148. [Google Scholar] [CrossRef]
- Qian, X.; Niemeier, D. High Impact Prioritization of Bikeshare Program Investment to Improve Disadvantaged Communities’ Access to Jobs and Essential Services. J. Transp. Geogr. 2019, 76, 52–70. [Google Scholar] [CrossRef]
- Zhang, L.; Zhang, J.; Duan, Z.; Bryde, D. Sustainable Bike-Sharing Systems: Characteristics and Commonalities across Cases in Urban China. J. Clean. Prod. 2015, 97, 124–133. [Google Scholar] [CrossRef]
- Ma, X.; Yuan, Y.; Van Oort, N.; Hoogendoorn, S. Bike-Sharing Systems’ Impact on Modal Shift: A Case Study in Delft, the Netherlands. J. Clean. Prod. 2020, 259, 120846. [Google Scholar] [CrossRef]
- Li, X.; Cottam, A.; Wu, Y.-J.; Khani, A. Can a Bikesharing System Reduce Fuel Consumption? Case Study in Tucson, Arizona. Transp. Res. Part D Transp. Environ. 2020, 89, 102604. [Google Scholar] [CrossRef]
- Tuli, F.M.; Mitra, S.K. Roadblocks to Ride: Unraveling Barriers to Access Shared Micromobility Systems in the United States. J. Cycl. Micromobility Res. 2025, 3, 100055. [Google Scholar] [CrossRef]
- Cheng, L.; Mi, Z.; Coffman, D.; Meng, J.; Liu, D.; Chang, D. The Role of Bike Sharing in Promoting Transport Resilience. Netw. Spat. Econ. 2022, 22, 567–585. [Google Scholar] [CrossRef]
- Ababneh, A. Smart Mobility Solutions through Bike Sharing System Design: A Case Study of Jerash Archaeological Site. Int. J. Autom. Digit. Transform. 2023, 2, 28–42. [Google Scholar] [CrossRef]
- Abdellaoui Alaoui, E.A.; Koumetio Tekouabou, S.C. Intelligent Management of Bike Sharing in Smart Cities Using Machine Learning and Internet of Things. Sustain. Cities Soc. 2021, 67, 102702. [Google Scholar] [CrossRef]
- Li, Y.; Zheng, Y.; Zhang, H.; Chen, L. Traffic Prediction in a Bike-Sharing System. In Proceedings of the 23rd SIGSPATIAL International Conference on Advances in Geographic Information Systems, Seattle, DC, USA, 3–6 November 2015; ACM: New York, NY, USA, 2015; pp. 1–10. [Google Scholar] [CrossRef]
- Ho, C.Q.; Tirachini, A. Mobility-as-a-Service and the Role of Multimodality in the Sustainability of Urban Mobility in Developing and Developed Countries. Transp. Policy 2024, 145, 161–176. [Google Scholar] [CrossRef]
- Narayanan, S.; Antoniou, C. Shared Mobility Services towards Mobility as a Service (MaaS): What, Who and When? Transp. Res. Part A Policy Pract. 2023, 168, 103581. [Google Scholar] [CrossRef]
- Chen, Y.; He, K.; Deveci, M.; Coffman, D. Health Impacts of Bike Sharing System—A Case Study of Shanghai. J. Transp. Health 2023, 30, 101611. [Google Scholar] [CrossRef]
- Ricci, M. Bike Sharing: A Review of Evidence on Impacts and Processes of Implementation and Operation. Res. Transp. Bus. Manag. 2015, 15, 28–38. [Google Scholar] [CrossRef]
- Ntamwiza, J.M.V.; Bwire, H. Factors Influencing Docked Bike-Sharing Usage in the City of Kigali, Rwanda. Transp. Econ. Manag. 2025, 3, 35–45. [Google Scholar] [CrossRef]
- Lin, Y.-C. A Demand-Centric Repositioning Strategy for Bike-Sharing Systems. Sensors 2022, 22, 5580. [Google Scholar] [CrossRef]
- Lin, J.-R.; Yang, T.-H. Strategic Design of Public Bicycle Sharing Systems with Service Level Constraints. Transp. Res. Part E Logist. Transp. Rev. 2011, 47, 284–294. [Google Scholar] [CrossRef]
- Knight, A.; Charlton, S.G. Protected and Unprotected Cycle Lanes’ Effects on Cyclists’ Behaviour. Accid. Anal. Prev. 2022, 171, 106668. [Google Scholar] [CrossRef]
- Ye, X. Bike-Sharing Adoption in Cross-National Contexts: An Empirical Research on the Factors Affecting Users’ Intentions. Sustainability 2022, 14, 3208. [Google Scholar] [CrossRef]
- Ferrari, G.; Tan, Y.; Diana, P.; Palazzo, M. The Platformisation of Cycling—The Development of Bicycle-Sharing Systems in China: Innovation, Urban and Social Regeneration and Sustainability. Sustainability 2024, 16, 5011. [Google Scholar] [CrossRef]
- Cunha, I.; Silva, C. Assessing the Equity Impact of Cycling Infrastructure Allocation: Implications for Planning Practice. Transp. Policy 2023, 133, 15–26. [Google Scholar] [CrossRef]
- Spieghlhlter, D. How to Learn from Data; Pelican Book Publisher: New Orleans, LA, USA, 2019; EAN: 9780241258767. [Google Scholar]
- Freedman, D. Statistics; Viva Book: Busselton, WA, USA, 2011; ISBN -13978-8130915876. [Google Scholar]
- Buehler, R.; Pucher, J. Cycling to a More Sustainable Transport Future. In Cycling for Sustainable Cities; Buehler, R., Pucher, J., Eds.; The MIT Press: Cambridge, MA, USA, 2021; pp. 425–440. [Google Scholar] [CrossRef]
- Papadakis, D.M.; Savvides, A.; Michael, A.; Michopoulos, A. Advancing Sustainable Urban Mobility: Insights from Best Practices and Case Studies. Fuel Commun. 2024, 20, 100125. [Google Scholar] [CrossRef]
- Sun, S.; Ertz, M. Contribution of Bike-Sharing to Urban Resource Conservation: The Case of Free-Floating Bike-Sharing. J. Clean. Prod. 2021, 280, 124416. [Google Scholar] [CrossRef]
- D’Alberto, R.; Giudici, H. A Sustainable Smart Mobility? Opportunities and Challenges from a Big Data Use Perspective. Sustain. Futures 2023, 6, 100118. [Google Scholar] [CrossRef]
- Paiva, S.; Ahad, M.; Tripathi, G.; Feroz, N.; Casalino, G. Enabling Technologies for Urban Smart Mobility: Recent Trends, Opportunities and Challenges. Sensors 2021, 21, 2143. [Google Scholar] [CrossRef]
- Fuady, S.N.; Pfaffenbichler, P.C.; Susilo, Y.O. Bridging the Gap: Toward a Holistic Understanding of Shared Micromobility Fleet Development Dynamics. Commun. Transp. Res. 2024, 4, 100149. [Google Scholar] [CrossRef]
- Machado, C.A.S.; De Salles Hue, N.P.M.; Berssaneti, F.T.; Quintanilha, J.A. An Overview of Shared Mobility. Sustainability 2018, 10, 4342. [Google Scholar] [CrossRef]
- Mahajan, S.; Argota Sanchez-Vaquerizo, J. Evaluating Urban Bike-Sharing Accessibility: A Comparative Study of 40 Cities Worldwide. 2024. Available online: https://papers.ssrn.com/sol3/papers.cfm?abstract_id=4853905 (accessed on 20 January 2025).
- Jelti, F.; Allouhi, A.; Tabet Aoul, K.A. Transition Paths towards a Sustainable Transportation System: A Literature Review. Sustainability 2023, 15, 15457. [Google Scholar] [CrossRef]
- Carracedo, D.; Mostofi, H. Electric Cargo Bikes in Urban Areas: A New Mobility Option for Private Transportation. Transp. Res. Interdiscip. Perspect. 2022, 16, 100705. [Google Scholar] [CrossRef]
- Rose, G. E-Bikes and Urban Transportation: Emerging Issues and Unresolved Questions. Transportation 2012, 39, 81–96. [Google Scholar] [CrossRef]
- Kansal, L.; Ediga, P. IoT-Enabled Predictive Maintenance for Sustainable Transportation Fleets. MATEC Web Conf. 2024, 392, 01189. [Google Scholar] [CrossRef]
- Bean, R.; Pojani, D.; Corcoran, J. How Does Weather Affect Bikeshare Use? A Comparative Analysis of Forty Cities across Climate Zones. J. Transp. Geogr. 2021, 95, 103155. [Google Scholar] [CrossRef]
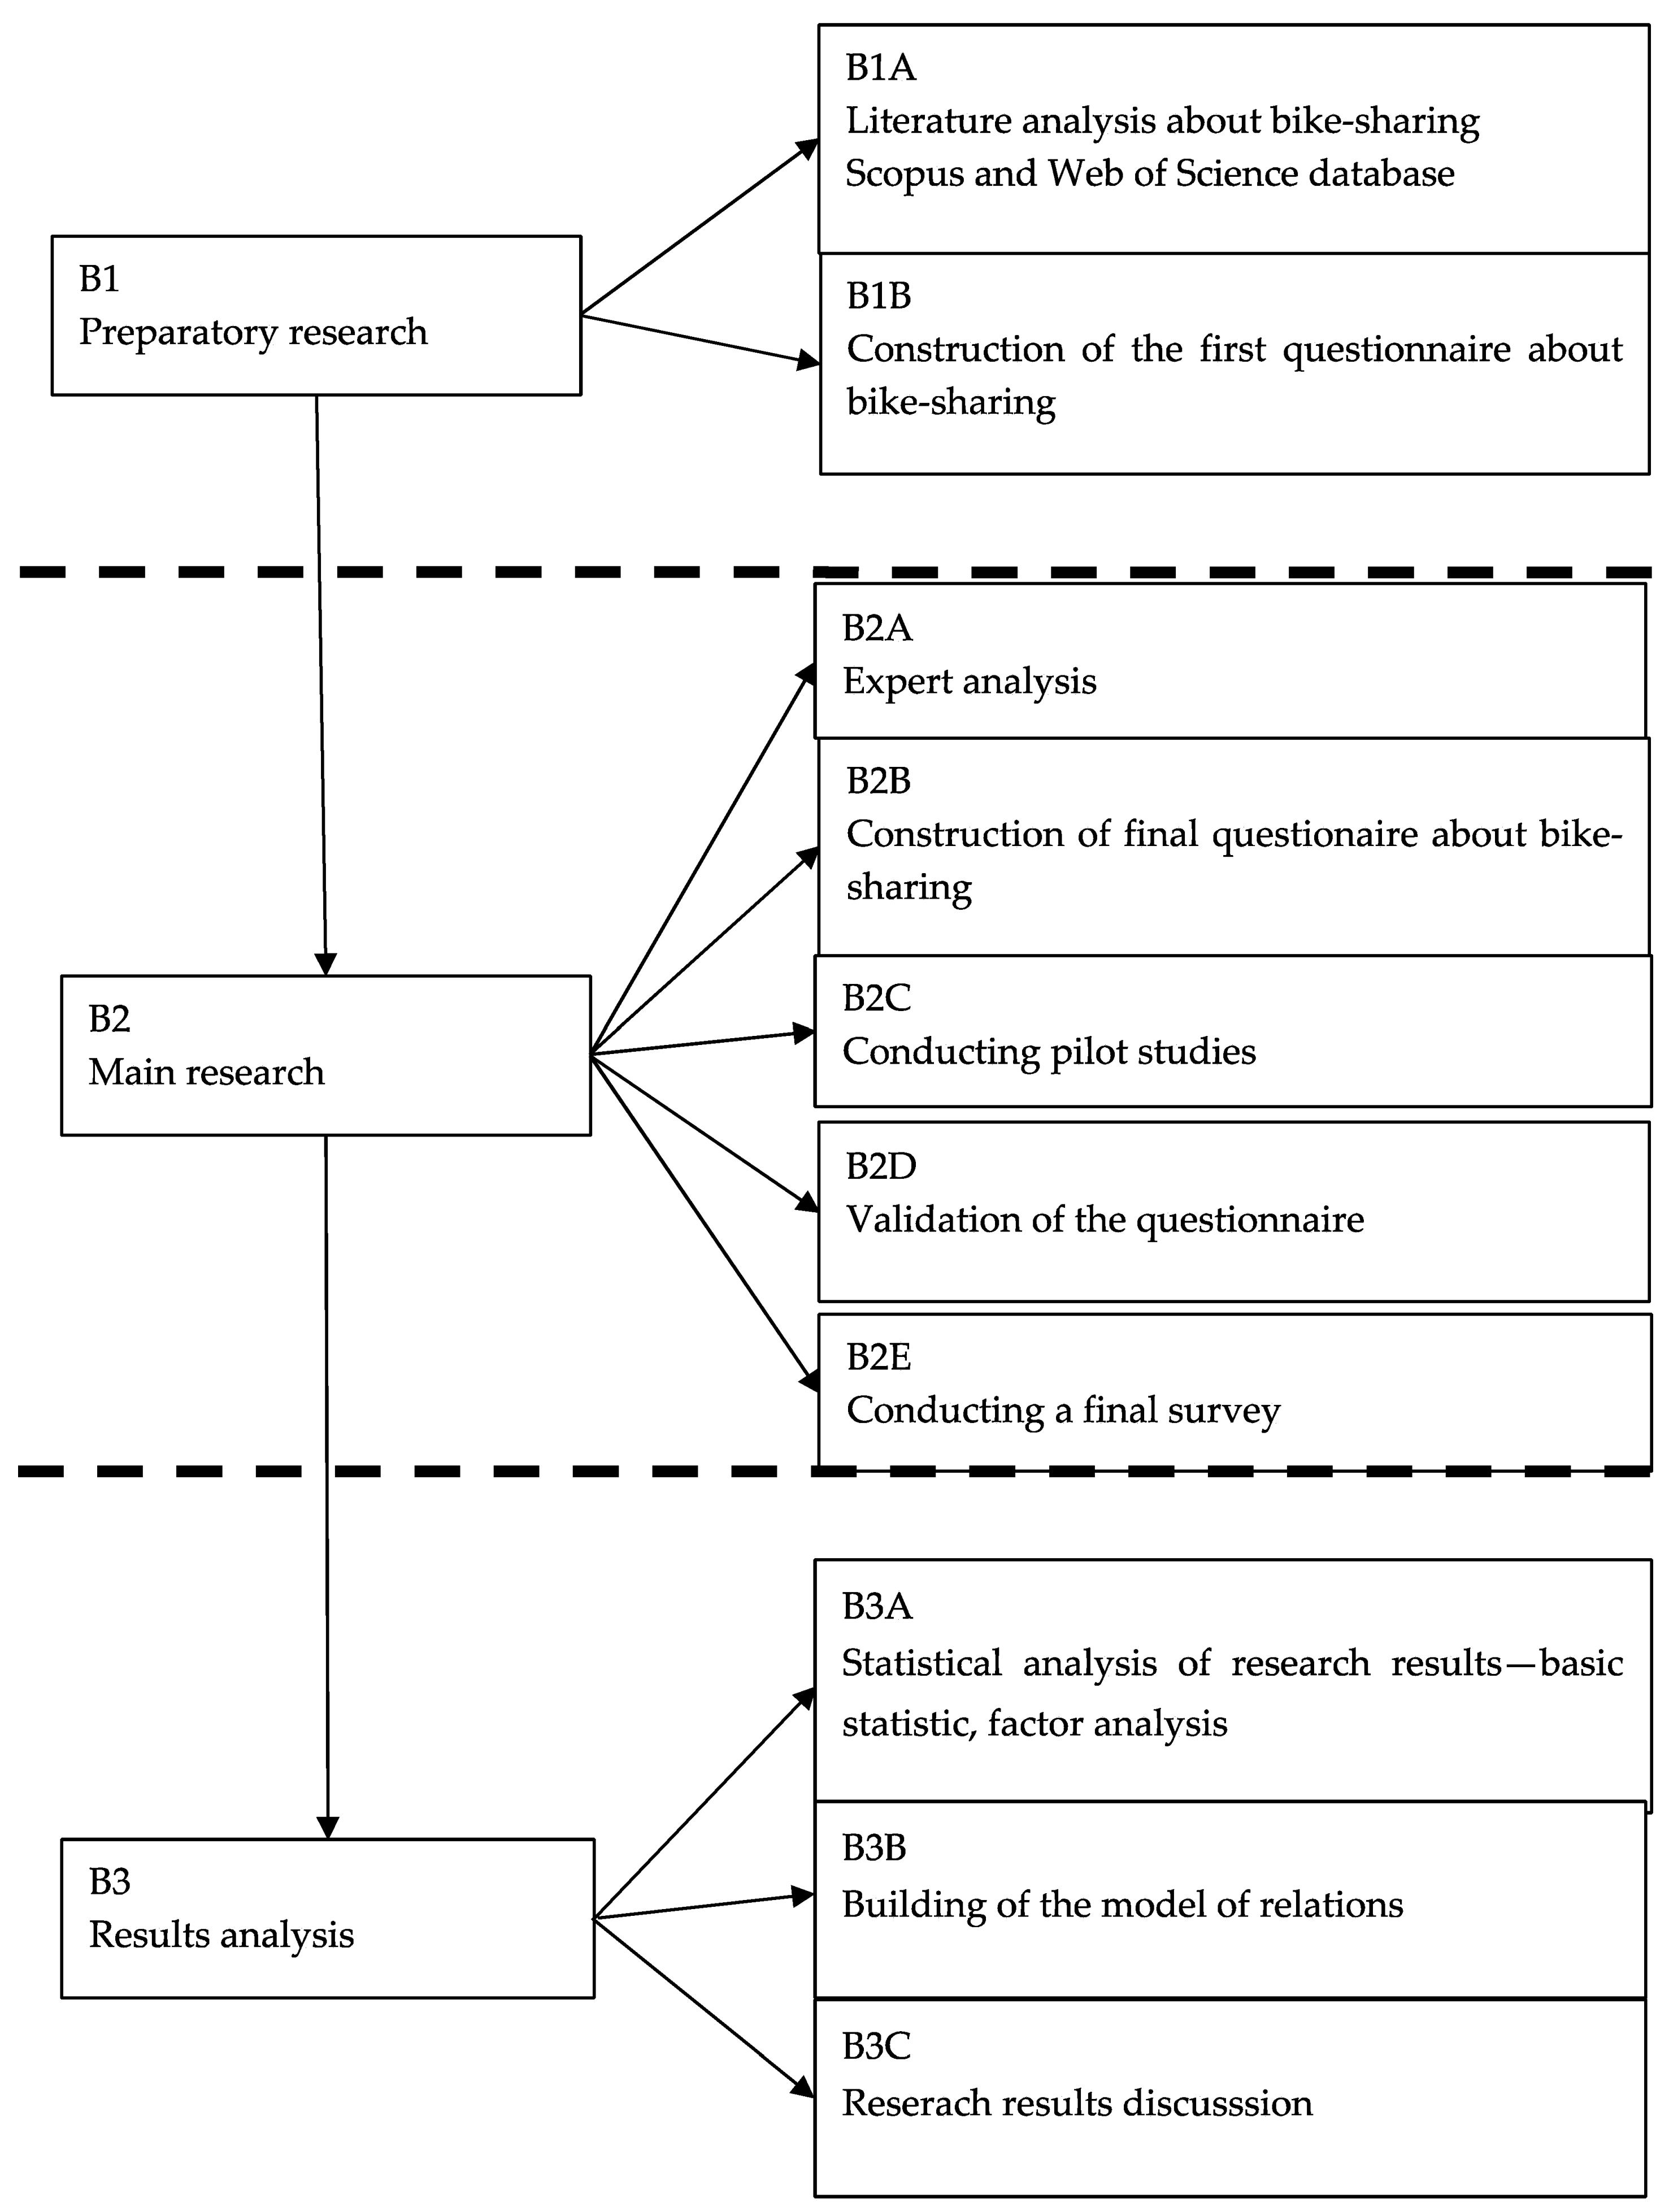
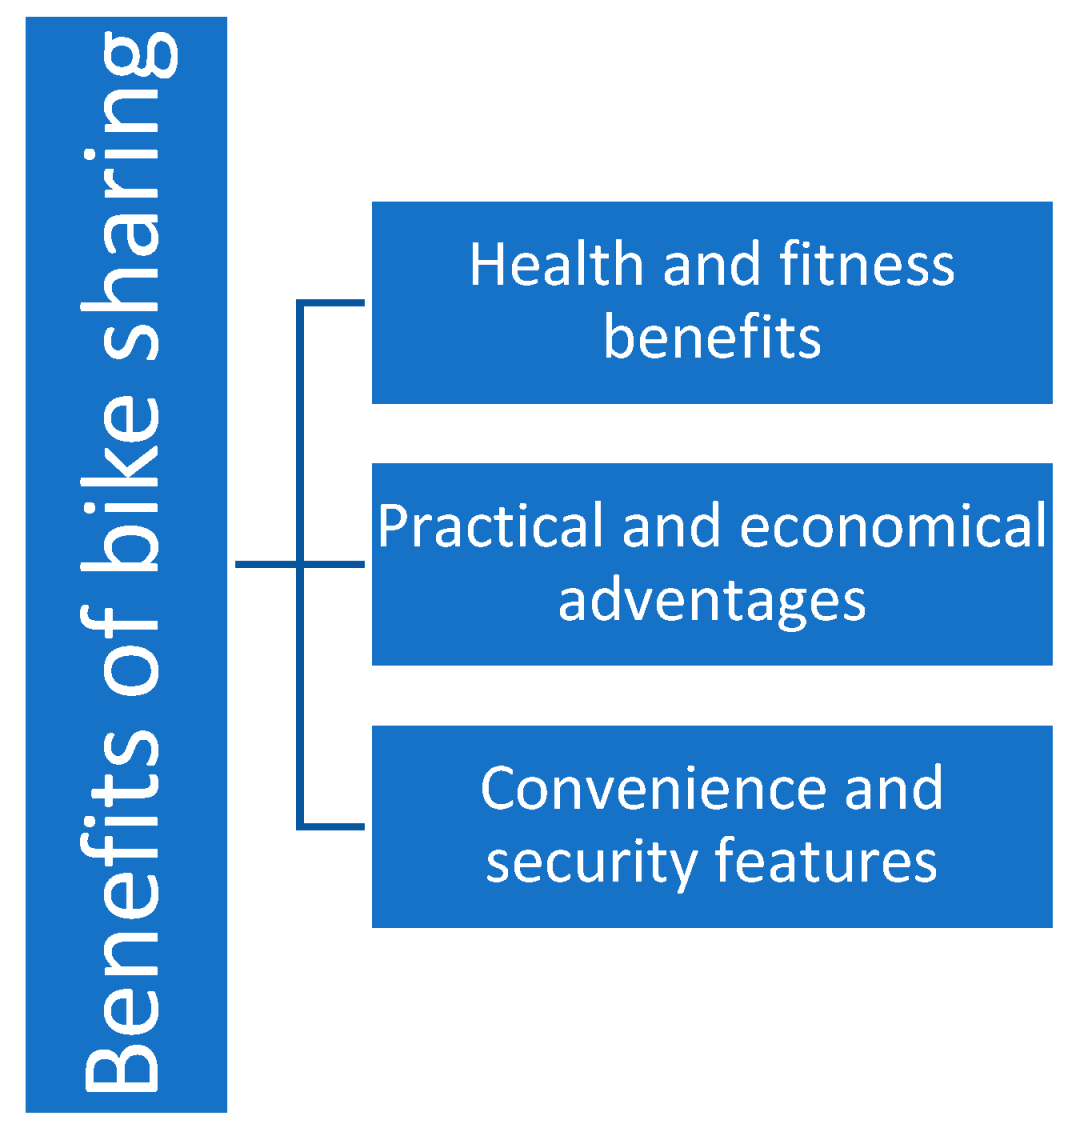

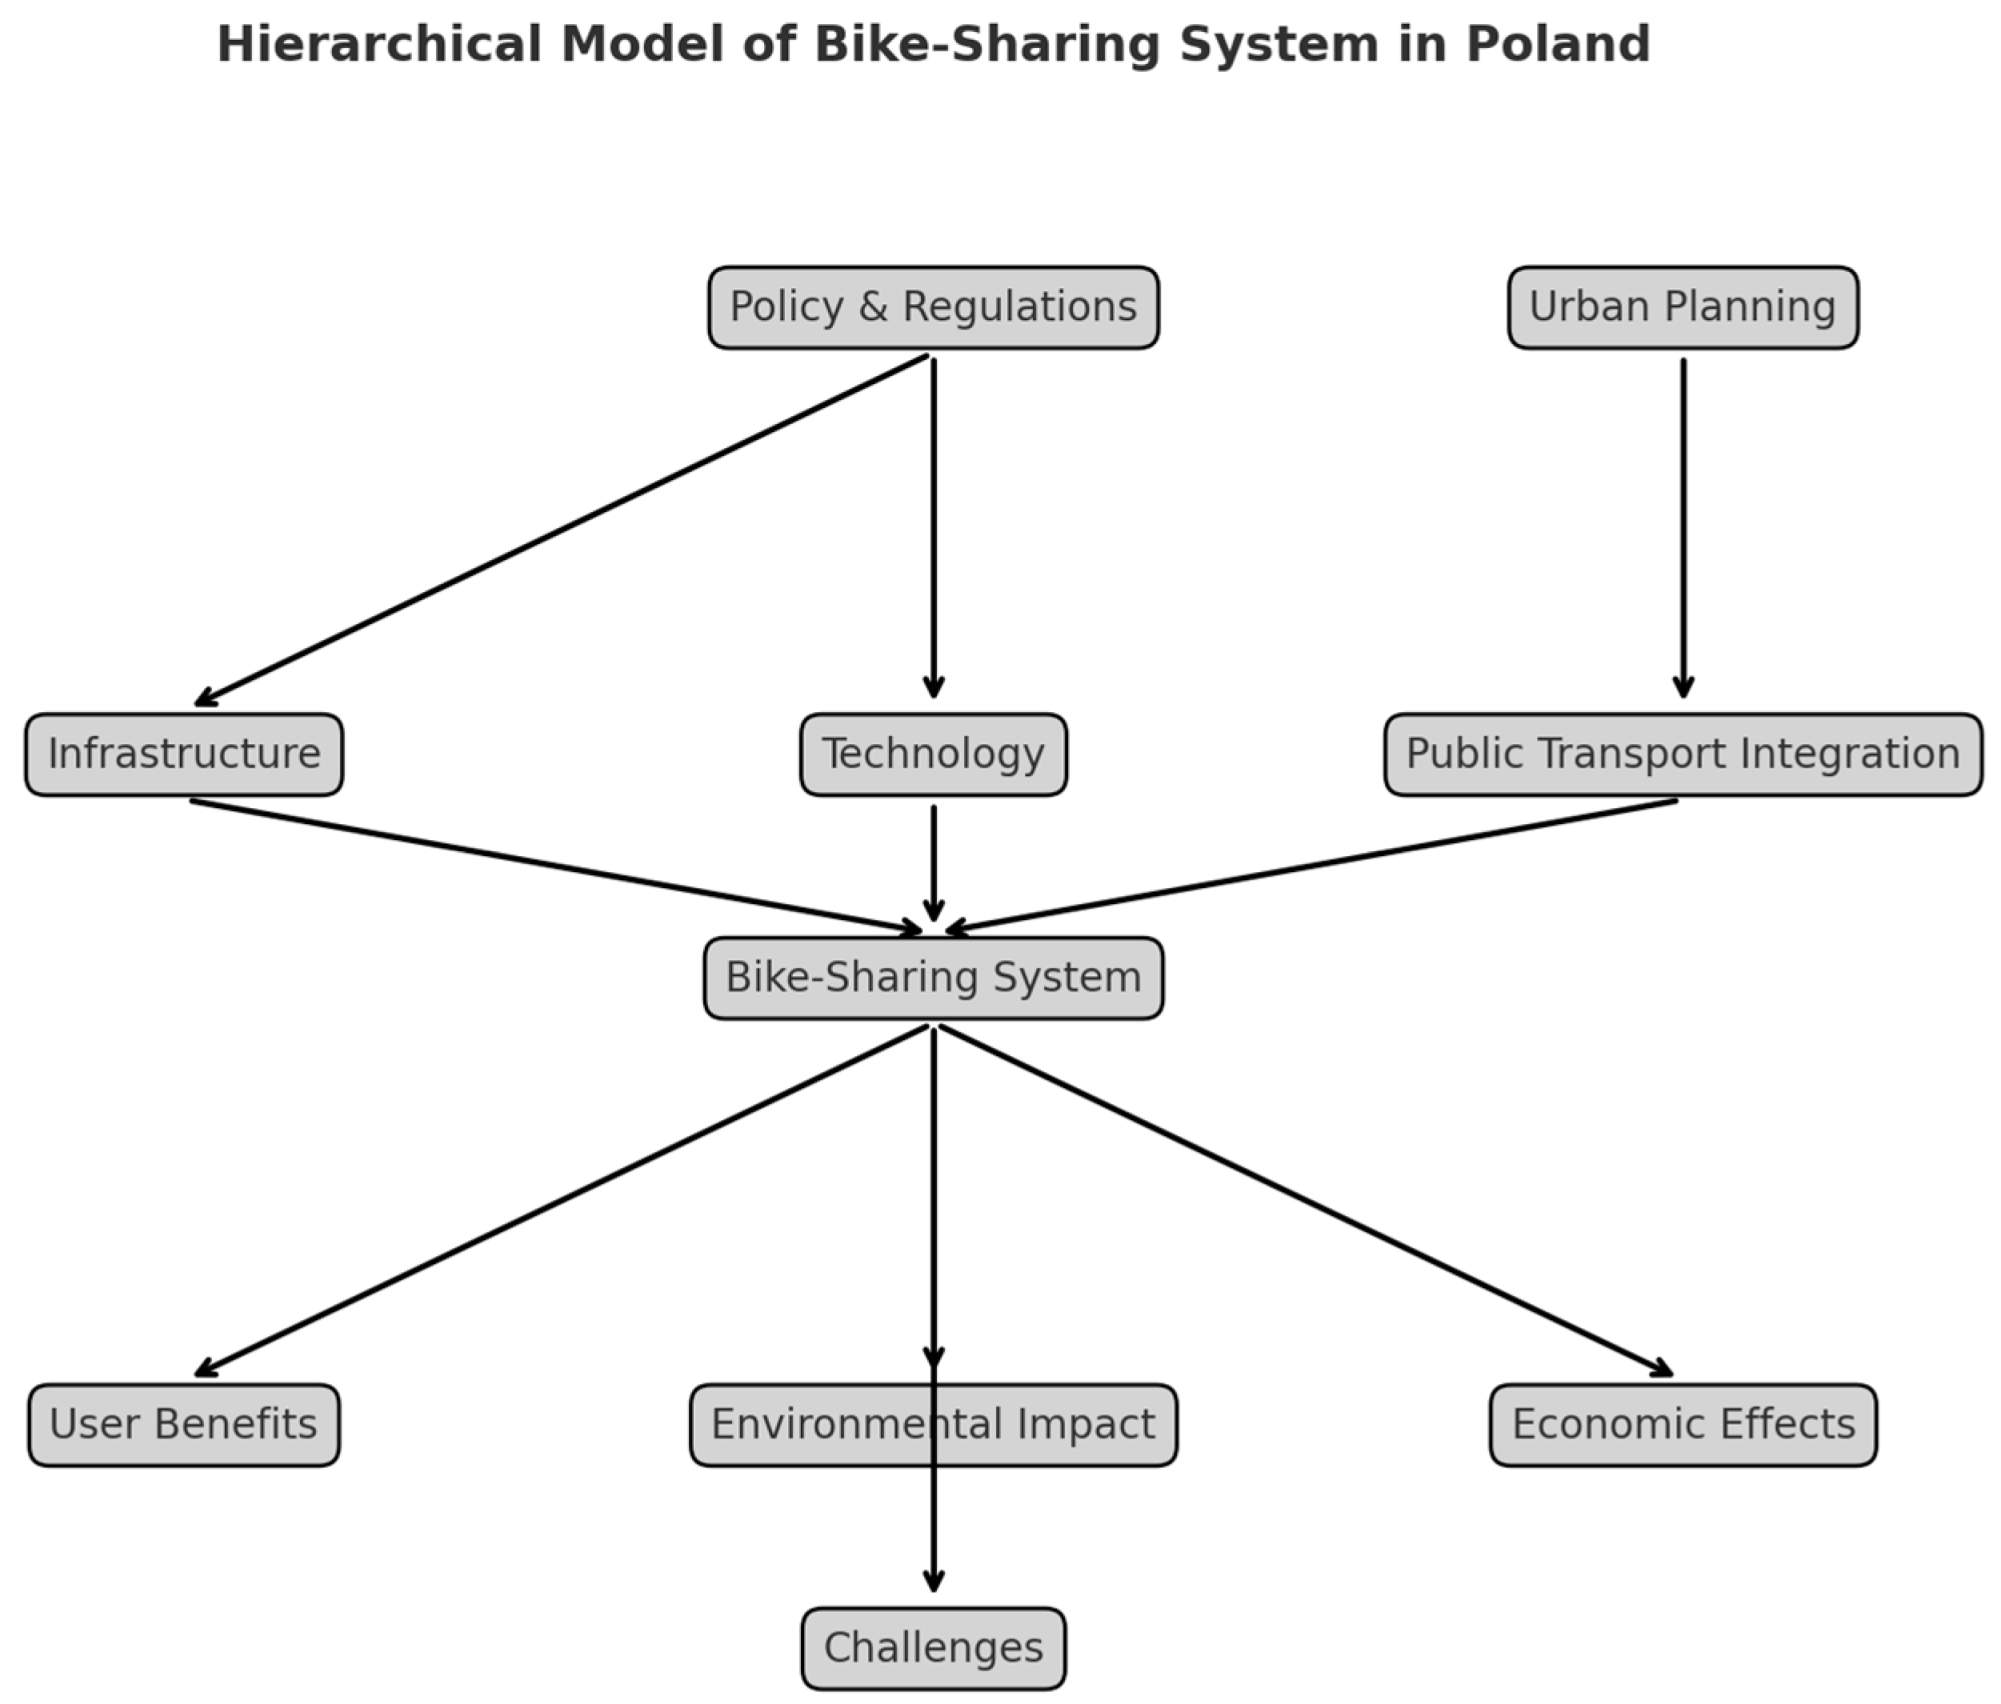
Disclaimer/Publisher’s Note: The statements, opinions and data contained in all publications are solely those of the individual author(s) and contributor(s) and not of MDPI and/or the editor(s). MDPI and/or the editor(s) disclaim responsibility for any injury to people or property resulting from any ideas, methods, instructions or products referred to in the content. |
© 2025 by the authors. Published by MDPI on behalf of the International Institute of Knowledge Innovation and Invention. Licensee MDPI, Basel, Switzerland. This article is an open access article distributed under the terms and conditions of the Creative Commons Attribution (CC BY) license (https://creativecommons.org/licenses/by/4.0/).