Article

EUV/VUV Spectroscopy for the Study of Carbon Impurity Transport in Hydrogen and Deuterium Plasmas in the Edge Stochastic Magnetic Field Layer of Large Helical Device

1
Department of Quantum Science and Energy Engineering, Tohoku University, 6-6-01-2 Aobayama, Sendai 980-8579, Japan
2
National Institute for Fusion Science, National Institutes of Natural Sciences, 322-6 Oroshi-cho, Toki 509-5292, Japan
3
Department of Fusion Science, The Graduate University for Advanced Studies, SOKENDAI, 322-6 Oroshi-cho, Toki 509-5292, Japan
*
Author to whom correspondence should be addressed.
Plasma 2023, 6(2), 308-321; https://doi.org/10.3390/plasma6020021
Submission received: 15 March 2023 / Revised: 10 May 2023 / Accepted: 11 May 2023 / Published: 12 May 2023
(This article belongs to the Special Issue Feature Papers in Plasma Sciences 2023)

Abstract

:
The ergodic layer in the Large Helical Device (LHD) consists of stochastic magnetic fields exhibiting a three-dimensional structure that is intrinsically formed by helical coils. Spectroscopic diagnostics was employed in the extreme ultraviolet (EUV) and vacuum ultraviolet (VUV) wavelength ranges to investigate emission lines of carbon impurities in both hydrogen (H) and deuterium (D) plasmas, aiming to elucidate the impact of distinct bulk ions on impurity generation and transport in the edge plasmas of the LHD. The emission intensity of carbon CIII, CIV, CV, and CVI lines is significantly higher in the D plasma compared to the H plasma, indicating a greater sputtering rate of carbon materials in the D plasma, resulting in a higher quantity of carbon impurities originating from the divertor plates. A Doppler profile measurement of the second order of CIV line emission (1548.20 × 2 Å) was attempted using a 3 m normal-incidence VUV spectrometer in the edge plasma at a horizontally elongated plasma position. The flow velocity reaches its maximum value close to the outermost region of the ergodic layer, and the observed flow direction aligns with the friction force in the parallel momentum balance. The flow velocity increases with the electron density in H plasmas, suggesting that the friction force becomes more dominant in the force balance at higher density regimes. This leads to an increase in the impurity flow, which can contribute to the impurity screening. In contrast, the flow velocity in the D plasma is smaller than that in the H plasma. The difference in flow values between D and H plasmas, when the friction force term dominates in the momentum balance, could be attributed to the mass dependence of the thermal velocity of the bulk ions.

1. Introduction

In the domain of magnetically confined fusion plasmas, the term “edge plasma” denotes a region characterized by open magnetic field lines enveloping the core plasmas. Within this region, impurity ions originating from the plasma-facing components can penetrate the plasma, potentially leading to plasma contamination and cooling. Consequently, controlling the processes associated with impurity generation and transport is a pivotal factor for achieving steady-state operation and high performance in fusion reactors. To gain insight into impurity behavior in the edge plasmas, numerous endeavors have been made to investigate the effects of edge magnetic field stochastization on plasma detachment and impurity transport [1,2,3]. In the Large Helical Device (LHD), magnetic flux surfaces are well-defined up to the last closed flux surface (LCFS). However, at the edge, a thick region of stochastic magnetic field with a three-dimensional structure, referred to as the “ergodic layer”, is intrinsically formed by the helical coils [4]. Therefore, examining impurity behavior and transport within the ergodic layer and comparing it to the behavior in the tokamak scrape-off layer provides valuable insights into impurity control in the edge plasmas. Carbon serves as the most abundant impurity within the edge plasma of LHD, originating from the carbon divertor plates. It has been discovered that the presence of the ergodic layer results in the screening of carbon impurities [5], with even more effective screening of iron impurities. Consequently, the iron density in LHD core plasmas remains remarkably low, despite the vacuum vessel being constructed from stainless steel [6]. The phenomenon of “impurity screening” has also been compared between the scrape-off layer of a tokamak and the ergodic layer of a helical device [7].
Accurate characterization of impurity behavior is of utmost significance in comprehending impurity transport within the edge ergodic layer. A transport model has been proposed to elucidate impurity behavior in the ergodic layer, predicated on parallel momentum balance experienced by impurity ions along a magnetic field line that connects the core plasma and the divertor plate. This balance is described by the following equation:
m Z V Z / / t   =   1 n Z T Z n Z s   +   Z e E / /   +   m Z V i / / V Z / / i m p τ s   +   0.71 Z 2 T e s   +   2.6 Z 2 T i s
where s denotes the coordinate along the magnetic field. The terms on the right-hand side represent contributions of impurity ion pressure gradient, parallel electric field, friction force between bulk ions and impurity ions, electron thermal force, and ion thermal force, respectively, in that particular order [8]. Among these terms, the dominant ones are the friction force and the ion thermal force. An augmentation in the ion density gradient leads to an escalation in friction force, consequently directing the impurity flow towards the divertor plates and resulting in impurity screening. Conversely, an increase in the ion temperature gradient leads to a rise in the ion thermal force, thereby directing the impurity flow towards the core plasmas and causing impurity penetration. Precise measurements of impurity flow profiles hold vital importance in examining the validity of theoretical models concerning impurity transport within stochastic magnetic field layers. Recently, carbon flow within the ergodic layer was measured in hydrogen (H) plasmas using vacuum ultraviolet (VUV) spectroscopy. Significantly, the relationship between impurity flow and impurity screening was experimentally confirmed for the first time through a comparative analysis of spectroscopic observations with impurity transport simulations based on three-dimensional simulation code known as EMC3-EIRENE [9,10,11].
One of the subsequent critical steps involves elucidating the impact of isotope effects of bulk ions on impurity transport, with the aim of anticipating impurity behavior in deuterium (D)–tritium (T) mixture plasmas in forthcoming fusion devices. In accordance with the aforementioned theoretical model, the frictional force responsible for impurity screening arises from collisions between bulk ions and impurity ions. Therefore, variations in the mass of bulk ions may also influence the screening effect. Consequently, the present study employed spectroscopic diagnostics for carbon impurities in both hydrogen and deuterium plasmas, aiming to clarify the influence of bulk ion mass on impurity transport within the ergodic layer.

2. Spectroscopic Diagnostics for Impurity Ions in the Edge Plasmas of LHD

The LHD is a superconducting device designed to confine plasma utilizing a heliotron magnetic configuration [12]. In its standard configuration, the plasma possesses major and minor radii of 3.6 m and 0.64 m, respectively. The coil system consists of 2 continuous superconducting helical coils with a poloidal pitch number of 2 and a toroidal pitch number of 10, along with 3 pairs of superconducting poloidal coils. From March 2017 to December 2022, plasma experiments employing deuterium as the operating gas were conducted at the LHD, with extensive comparisons to experiments utilizing hydrogen plasma [13]. Figure 1 illustrates schematic drawings of toroidal plasma with helical coils, as well as a horizontally elongated poloidal cross-section of the LHD. In the torus coordinate system, the coordinates R and z represent the major radial coordinate and the vertical coordinate, respectively. Poincaré plots of the stochastic magnetic fields within the ergodic layer under vacuum conditions are displayed for the poloidal cross-section corresponding to the position of the magnetic axis, Rax, of 3.6 m. The stochastic magnetic fields within the edge ergodic layer are depicted with a color scale indicating the magnetic field connection length, along with the magnetic surfaces. The ergodic layer primarily consists of stochastic magnetic field lines with connection lengths ranging from 10 to 2000 m, corresponding to 0.5–100 toroidal turns in the LHD. The radial thickness of the ergodic layer exhibits variations in both toroidal and poloidal directions. When the magnetic axis is shifted outward, the ergodic layer becomes wider, resulting in a smaller plasma size within the LCFS.
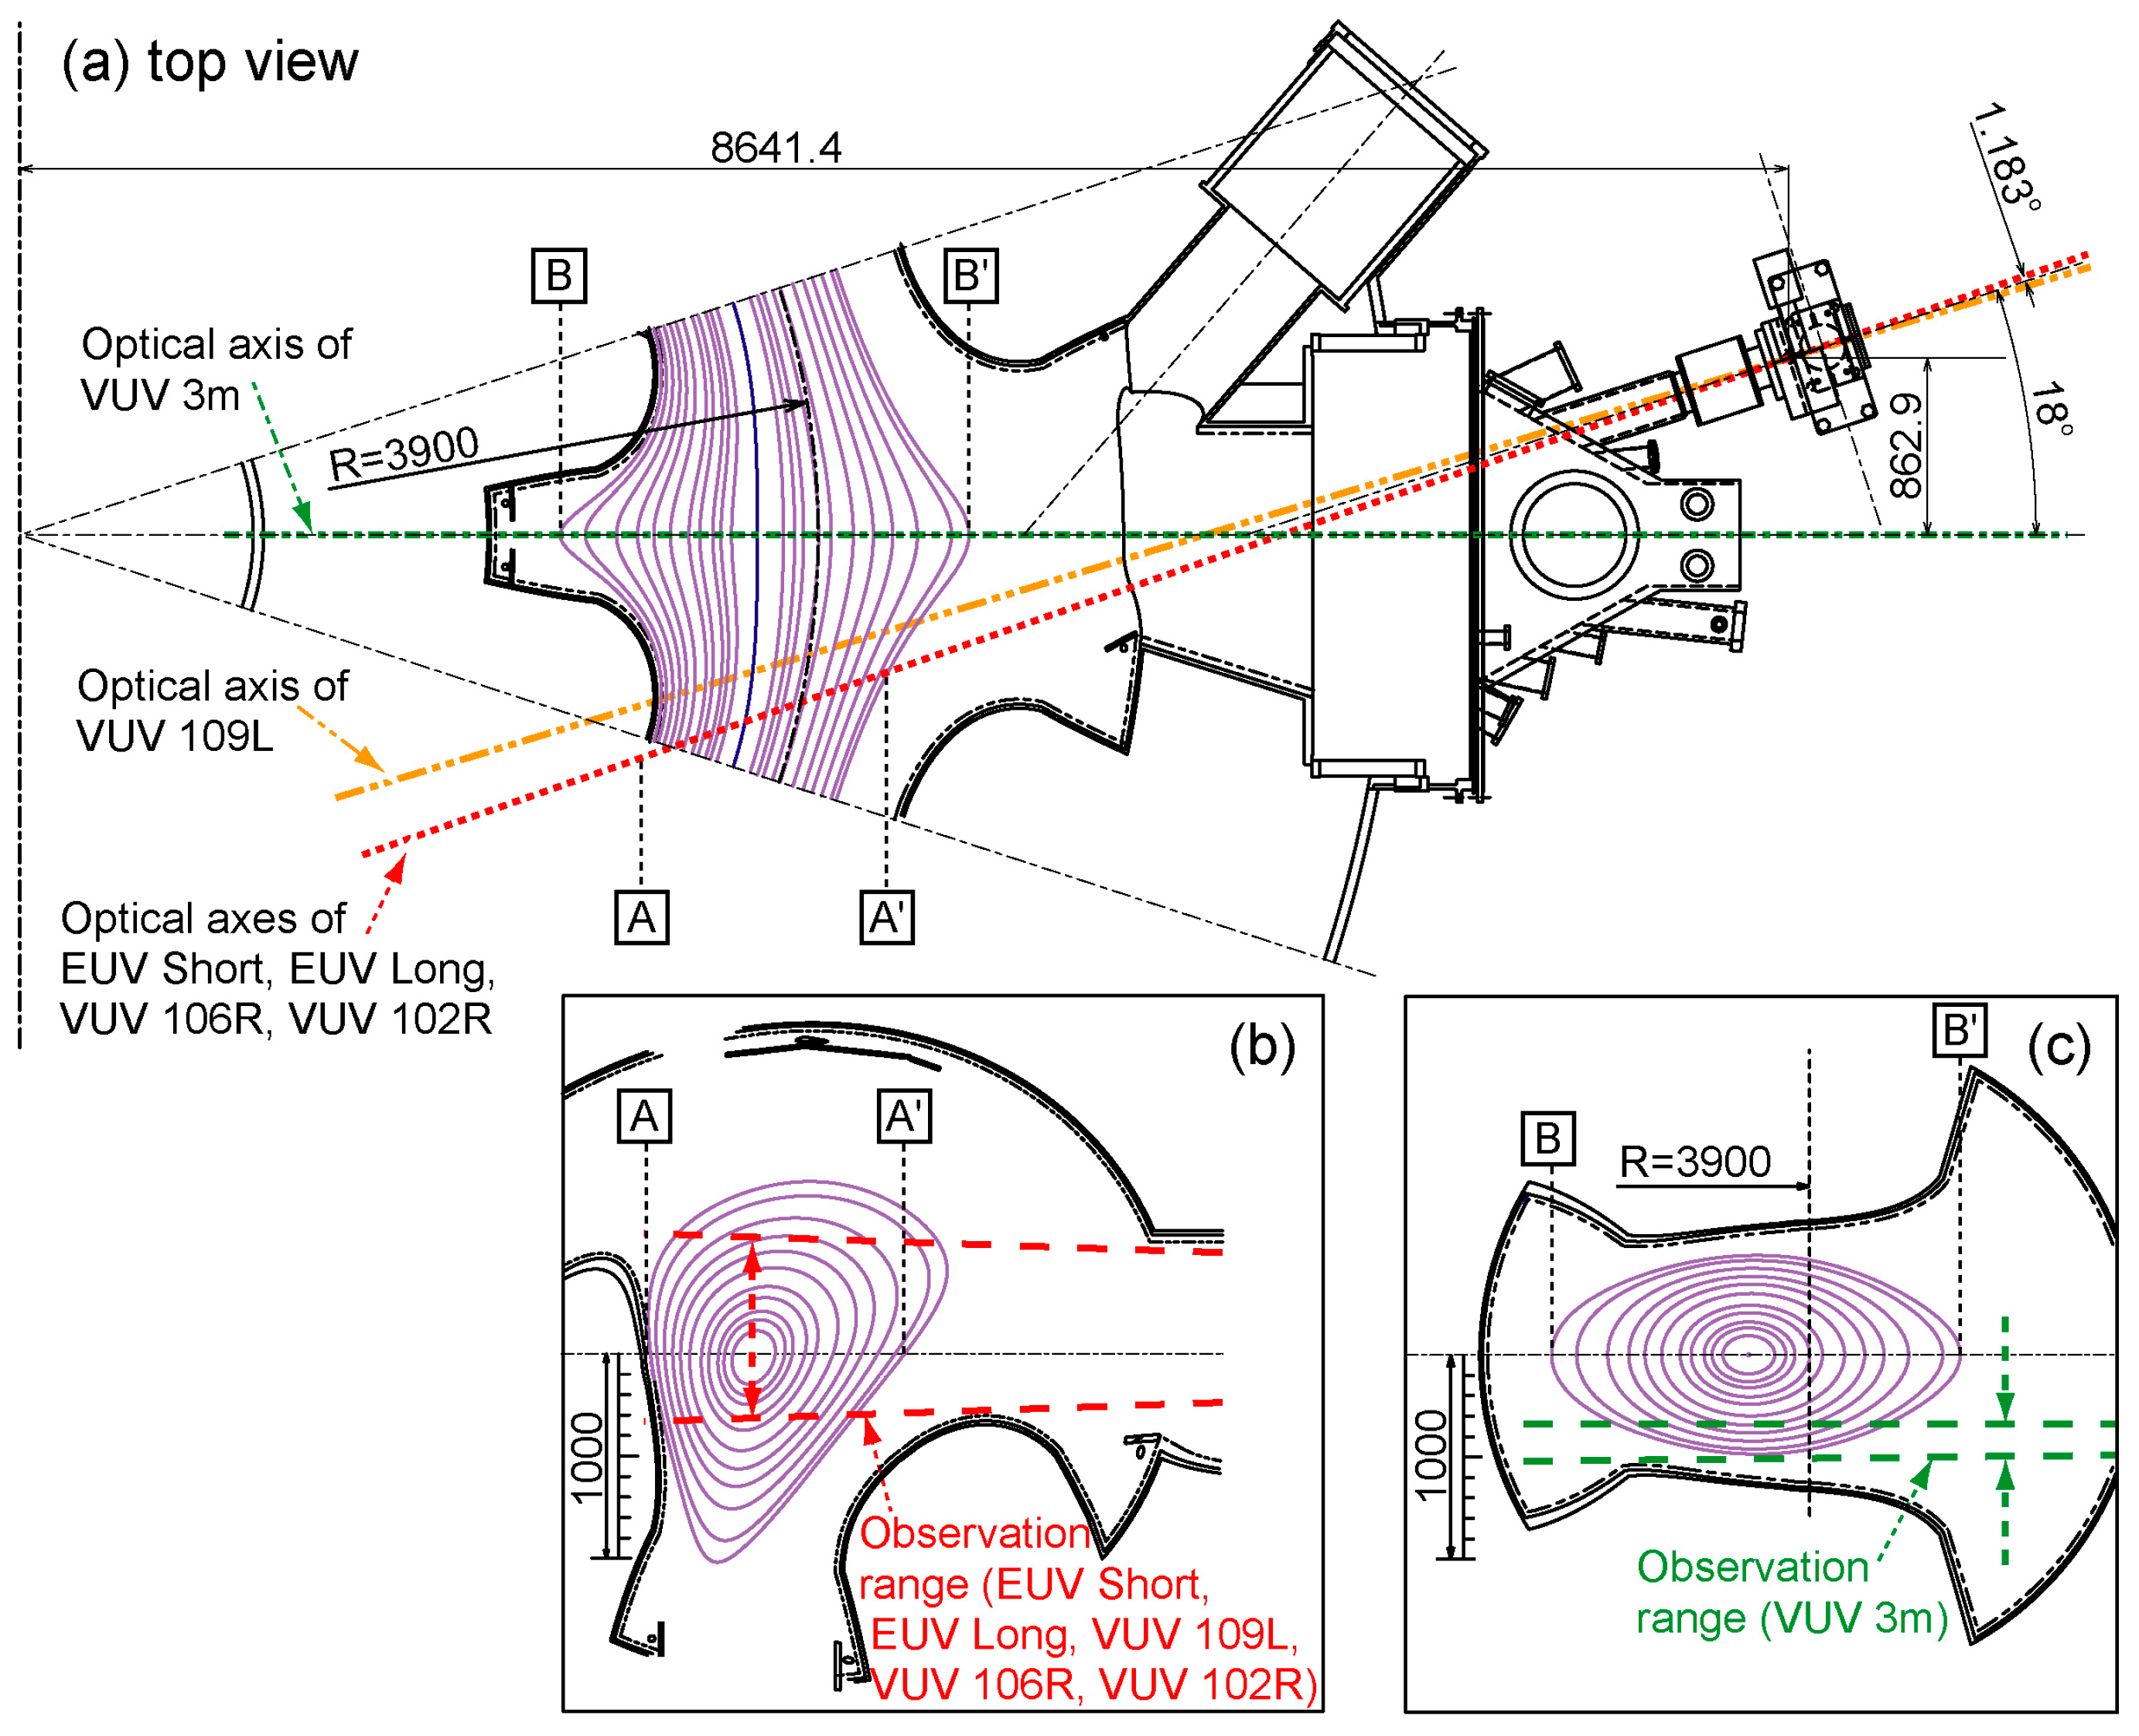
The spectroscopic diagnostics in the LHD involves the utilization of several specialized instruments, including two flat-field grazing incidence EUV spectrometers referred to as “EUV Short” [14] and “EUV Long” [15], three 20 cm normal-incidence VUV spectrometers named “VUV 109L”, “VUV 106R”, and “VUV 102R” [16], and a 3 m normal-incidence VUV spectrometer known as “VUV 3m” [17]. Figure 2 provides an illustration, with Figure 2a offering a top view of the optical axes of the spectrometers and the vacuum magnetic surfaces corresponding to Rax of 3.6 m. These specialized diagnostic instruments are positioned at an outer port of the LHD, referred to as “10-O”. Two types of spectroscopic measurements are conducted, as described below.
(1)
High-time-resolution EUV and VUV wavelength spectral measurements: The spectrometers EUV Short, EUV Long, VUV 109L, VUV 106R, and VUV 102 cover specific wavelength ranges of 5–60 Å, 75–260 Å, 300–1050 Å, 970–1870 Å, and 1510–2400 Å, respectively. Figure 2b illustrates the vertical observation range on a plasma cross-section, including the optical axes of these spectrometers. CCD detectors (1024 × 256 pixels, pixel size 26 μm × 26 μm, Andor DO420-BN) are positioned at the exit slits of the spectrometers. In this experiment, a CCD data acquisition mode called “full-binning” mode is utilized. In this mode, all CCD pixels aligned vertically are combined into a single channel, eliminating the vertical spatial resolution. The spectral measurements have a time resolution of 5 ms with the full-binning data acquisition mode. This measurement technique enables simultaneous coverage of a wide wavelength range from EUV to VUV. It has been applied to survey the emission spectra of various impurities, including neon injected by gas puffing [18], boron and nitrogen injected by powder dropping [19], and tungsten injected as pellets [20].
(2)
Profile measurements for emission intensity, ion temperature, and flow velocity with high-spectral-resolution VUV spectroscopy: A 3 m normal-incidence VUV spectrometer has been developed to measure the radial distribution of VUV lines within the wavelength range of 300–3200 Å in the edge plasmas of LHD. The spectrometer is equipped with a CCD detector (1024 × 1024 pixels, pixel size 13 μm × 13 μm, Andor DO934P-BN) positioned at the exit slits. The spectroscopic system has a high spectral resolution with a wavelength dispersion of 0.037 Å/CCD-pixel, enabling precise measurement of the Doppler profiles of impurity line spectra. The vertical observation range of this spectrometer is adjusted to cover the ergodic layer at the bottom edge of the LHD plasma, as depicted in Figure 2c. The observed region corresponds to the horizontally elongated poloidal cross-section. In the measurement, a “Multi-track” data acquisition mode is employed, where multiple pixels are binned together (known as “binning”) to reduce the signal read time. Specifically, the CCD signals are summed up every 10 vertical pixels, resulting in a single vertical channel. This allows the division of the observable region into 102 observation chords. Each profile image can be captured with a time interval of 200 ms, comprising an exposure time of 138.66 ms and a readout time of 61.34 ms. The high wavelength dispersion of the spectrometer enables detailed wavelength identification of impurity emission lines. This measurement technique has been applied to study carbon, neon, argon [21], and tungsten impurities [22], providing valuable information on their emission profiles and behavior in the plasma.

3. Spectroscopic Observation of Carbon Impurity

Figure 3 provides a typical waveform of a discharge, with a magnetic configuration characterized by Rax = 3.6 m and a toroidal magnetic field, Bt, of 2.75 T, oriented in a counter-clockwise direction from a top-down perspective. The figure shows the time evolution of various parameters as follows: (a) the injection power of the electron cyclotron heating (ECH) and the neutral beam injection sourced from negative ion sources (n-NBI); (b) the central electron temperature, Te0; (c) the line-averaged electron density, ne, with a gas-puffing duration of D2; (d) the plasma stored energy, Wp; and (e) the emission intensity of Dα, Hα, and the neutral particle ratio of D/(H + D).
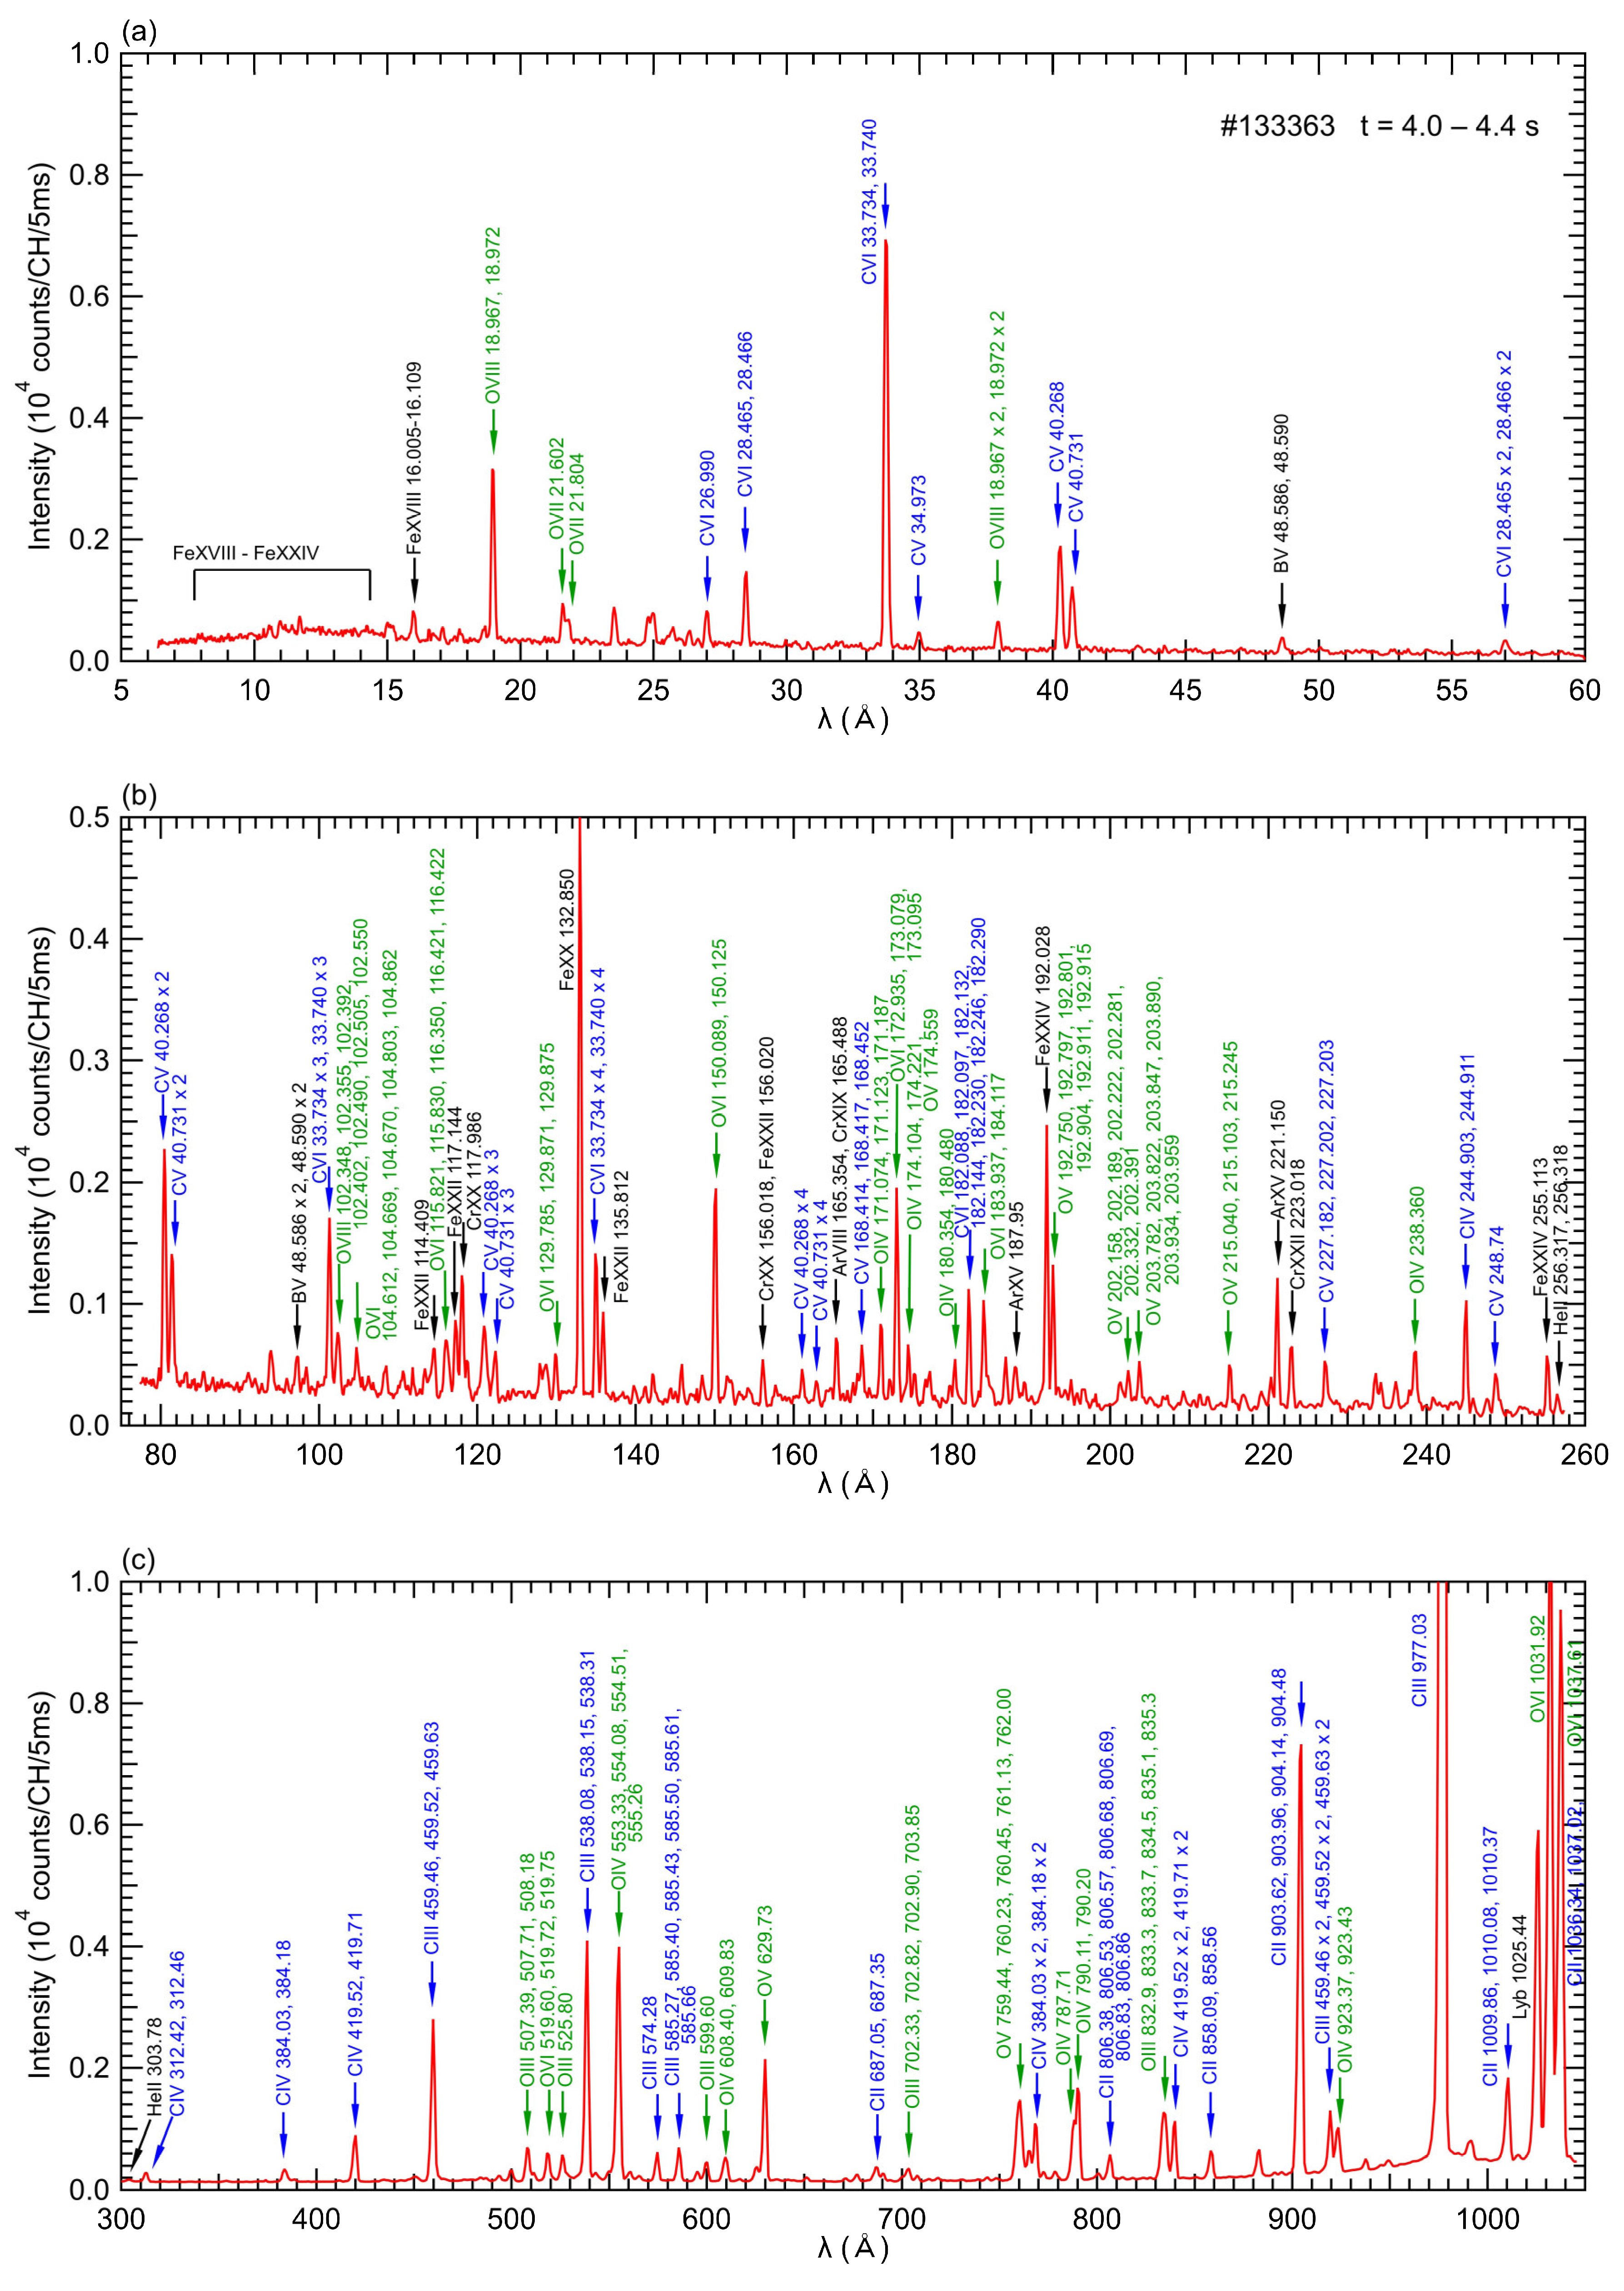
The discharge is initiated by ECH and further heated by three n-NBI beams with a total port-through power of 14 MW. Despite using deuterium as the operating gas and hydrogen as the neutral beam particle, the ratio of neutral deuterium particles reaches up to 90 percent, as shown in Figure 3e, hence the plasma is referred to as “D plasma” in this paper. Figure 3f displays the spatial profiles of electron temperature, Te, and electron density, ne, obtained through Thomson scattering. These profiles are acquired during the discharge indicated in Figure 3a–e at a timing of 4.2 s, corresponding to the flat-top phase. The electron temperature reaches its maximum value at the plasma center, while the electron density exhibits a hollow profile. These characteristic Te and ne profiles are commonly observed in the LHD. Figure 4 showcases the EUV/VUV spectra comprising intrinsic impurity line emissions. The spectral data were acquired through averaging over the interval of 4.0–4.4 s in a D plasma, as depicted in Figure 3. In the spectra, the signal data were recorded for each CCD pixel aligned in the wavelength direction; thus, the units of the vertical axes indicate that it is the emission intensity per measurement channel.
The spectral identifications in this paper rely on the NIST database [23]. Carbon is the predominant impurity species in LHD due to the utilization of carbon materials in the divertor plates. Additionally, iron from the first wall material and oxygen adhering to the inner surface of the vacuum vessel also contribute significantly to the impurity contents. It is worth noting that there are also faint lines observed from boron and argon. In LHD, boronization, a process of coating the inner walls of the vacuum vessel with boron, is performed to suppress the release of oxygen [24]. The coated boron acts as a source of boron ions, which manifest as a line spectrum. Ion temperature at the plasma center is determined using X-ray crystal spectroscopy by analyzing the Doppler broadening of the argon ion line spectrum [25]. Even in discharges without introduced argon gas, the line spectrum of argon ions can be observed due to the presence of residual gas inside the vacuum vessel. In this study, we aimed to assess impurity screening by utilizing the resonance lines of carbon impurity ions, specifically CIII (977.03 Å, 2s2-2s2p), CIV (1548.02 Å, 2s-2p), CV (40.27 Å, 1s2-1s2p), and CVI (33.73 Å, 1s-2p), as indicators of impurity emission, and by comparing the emissions at different charge states. The ionization potentials, Ei, of C2+, C3+, C4+, and C5+ are 48 eV, 65 eV, 392 eV, and 490 eV, respectively. Therefore, CIII and CIV radiation primarily originates from carbon ions with low Ei, located in the outer region of the ergodic layer, while CV and CVI radiation is emitted by carbon ions with high Ei, situated in the inner region of the ergodic layer.
Figure 5 exhibits the dependence of line intensity on the line-averaged electron density for different charge states: (a) CIII, (b) CIV, (c) CV, and (d) CVI, normalized by the line-averaged electron density. The results clearly demonstrate that the emission intensity of carbon ions in all charge states increases in deuterium discharges. This enhancement can be attributed to the higher sputtering rate of carbon materials by deuterium plasma compared to hydrogen plasma, resulting in an increased generation of carbon impurities from the divertor plates [26]. Figure 5e presents a line ratio of CV/CIV as an indicator of the impurity screening effect, where smaller values indicate a stronger impurity screening effect. As the line-averaged electron density increases, the line ratio decreases due to the increased contribution of carbon lines emitted from the outer region of the ergodic layer (CIII, CIV), while those from the inner region (CV, CVI) decrease. This decrease signifies an enhancement of the impurity screening effect in the high-density regime. A comparison between deuterium and hydrogen plasmas in Figure 5e reveals that the impurity screening effect is more pronounced in deuterium plasmas. One possible explanation for this enhanced impurity screening is the increased friction force in deuterium plasmas. However, the interpretation of the data in Figure 5e requires further discussion, since the CV/CIV ratio appears to be similar for the deuterium and hydrogen discharges in the high-density region around ne = 6 × 1013 cm−3, suggesting a comparable shielding effect in that regime. The analysis and discussion of the impurity shielding effect in the high-density region have not yet been conducted and will be addressed carefully in future investigations. Increasing the number of data points in the high-density region is necessary to explore the density dependence of the shielding effect and to perform a more comprehensive deuterium-hydrogen comparison.
During the flat-top phase of the discharges, a space-resolved VUV spectroscopy was conducted using a 3 m normal-incidence VUV spectrometer. The measurement was specifically performed from 4.0 to 4.4 s in the discharge shown in Figure 3. The VUV spectroscopy employed the viewing angle of the edge profile measurement to achieve high spatial resolution. The Doppler shift of the second order of CIV line emission (1548.20 × 2 Å) was utilized to investigate the spatial profiles of emission intensity, ion temperature, and flow velocity of C3+ ions. The measurements were focused on a horizontally elongated plasma position in LHD. Figure 6 presents the wavelength spectrum covering the entire wavelength range observed in a single discharge, including CIV lines with wavelengths of 1548.20 × 2 and 1550.77 × 2 Å. Some spike noises attributed to neutrons and γ-rays can be observed in the spectrum obtained for D plasmas [27]. However, the impact of these noises is not significant in the discharges analyzed in this study. Therefore, CIV line intensity, ion temperature, and flow velocity derived from the Doppler profile of the CIV line with a wavelength of 1548.20 × 2 Å can be obtained for both H plasmas and D plasmas.
Figure 7a illustrates the observation range utilized for the edge profile measurement conducted with space-resolved VUV spectroscopy. Figure 7b–d present the vertical profiles at the bottom edge of the ergodic layer for CIV line intensity, ion temperature, and flow velocity, respectively. These profiles were obtained from the CIV line emission measured by VUV spectroscopy in both H plasma and D plasma. In Figure 7b–d, the horizontal axes represent the vertical position of the sightlines at R = 3600 mm. The data points in Figure 7b represent the emission intensity of a single line spectrum determined by the area of the peak at CIV 1548.20 × 2 Å from the spectrum in Figure 6. Therefore, the unit of the vertical axis is different from that in Figure 6. The flow velocity along the sightline, vR, is determined by vR = cλ/λ), where c is the speed of light, Δλ is the Doppler shift, and λ is the wavelength of line emission. The measured flow velocity represents a projection of the flow along the observation chord, which can be approximated as the direction of the major radius of the plasma. Therefore, the variable vR is used to indicate the measured flow value. The positive and negative signs on the horizontal axis of Figure 7d correspond to the outboard and inboard directions along the plasma major radius, respectively. In the figure, it can be observed that the emission intensity is higher in the D plasma compared to in the H plasma, which is attributed to the increased sputtering rate of carbon atoms from the divertor plates in the D plasma. The ion temperature is approximately 20–30 eV and appears to be slightly higher in the H plasma. It is worth noting that in these discharges, the electron temperature around the LCFS, as measured by Thomson scattering, is about 200 eV. The neutral hydrogen beam used for plasma heating in these discharges has an energy of 180 keV, and electron heating dominates in this energy range. Therefore, the electron temperature exceeds the ion temperature in all regions, not just at the plasma edge. The flow velocity toward the outboard direction is clearly developed, reaching its maximum value at z = −480 mm, which is close to the outermost region of the ergodic layer in the H plasma. This direction aligns with the friction force, in the parallel momentum balance for Rax = 3.6 m, as calculated using three-dimensional simulation code, EMC3-EIRENE [9]. On the other hand, the maximum flow velocity in the D plasma is considerably smaller than that in the H plasma. For further discussion, it is important to note that the flow velocities observed in sightlines passing through inside the LCFS appear to have reversed signs between hydrogen and deuterium plasmas. These sightlines pass through inside and outside the torus simultaneously, which complicates the evaluation of the line integral effect. Therefore, the reason why the sign of the flow obtained by the sightlines passing through inside the LCFS is reversed between hydrogen and deuterium plasmas cannot be discussed based on this result alone. The cause may be investigated by line-integrating the results of 3D transport calculations along the sightlines used in the actual experiment to create synthetic profiles and comparing them with the experimental results. In this paper, the discussion is limited to observations outside the LCFS, where the interpretation of the results is straightforward.
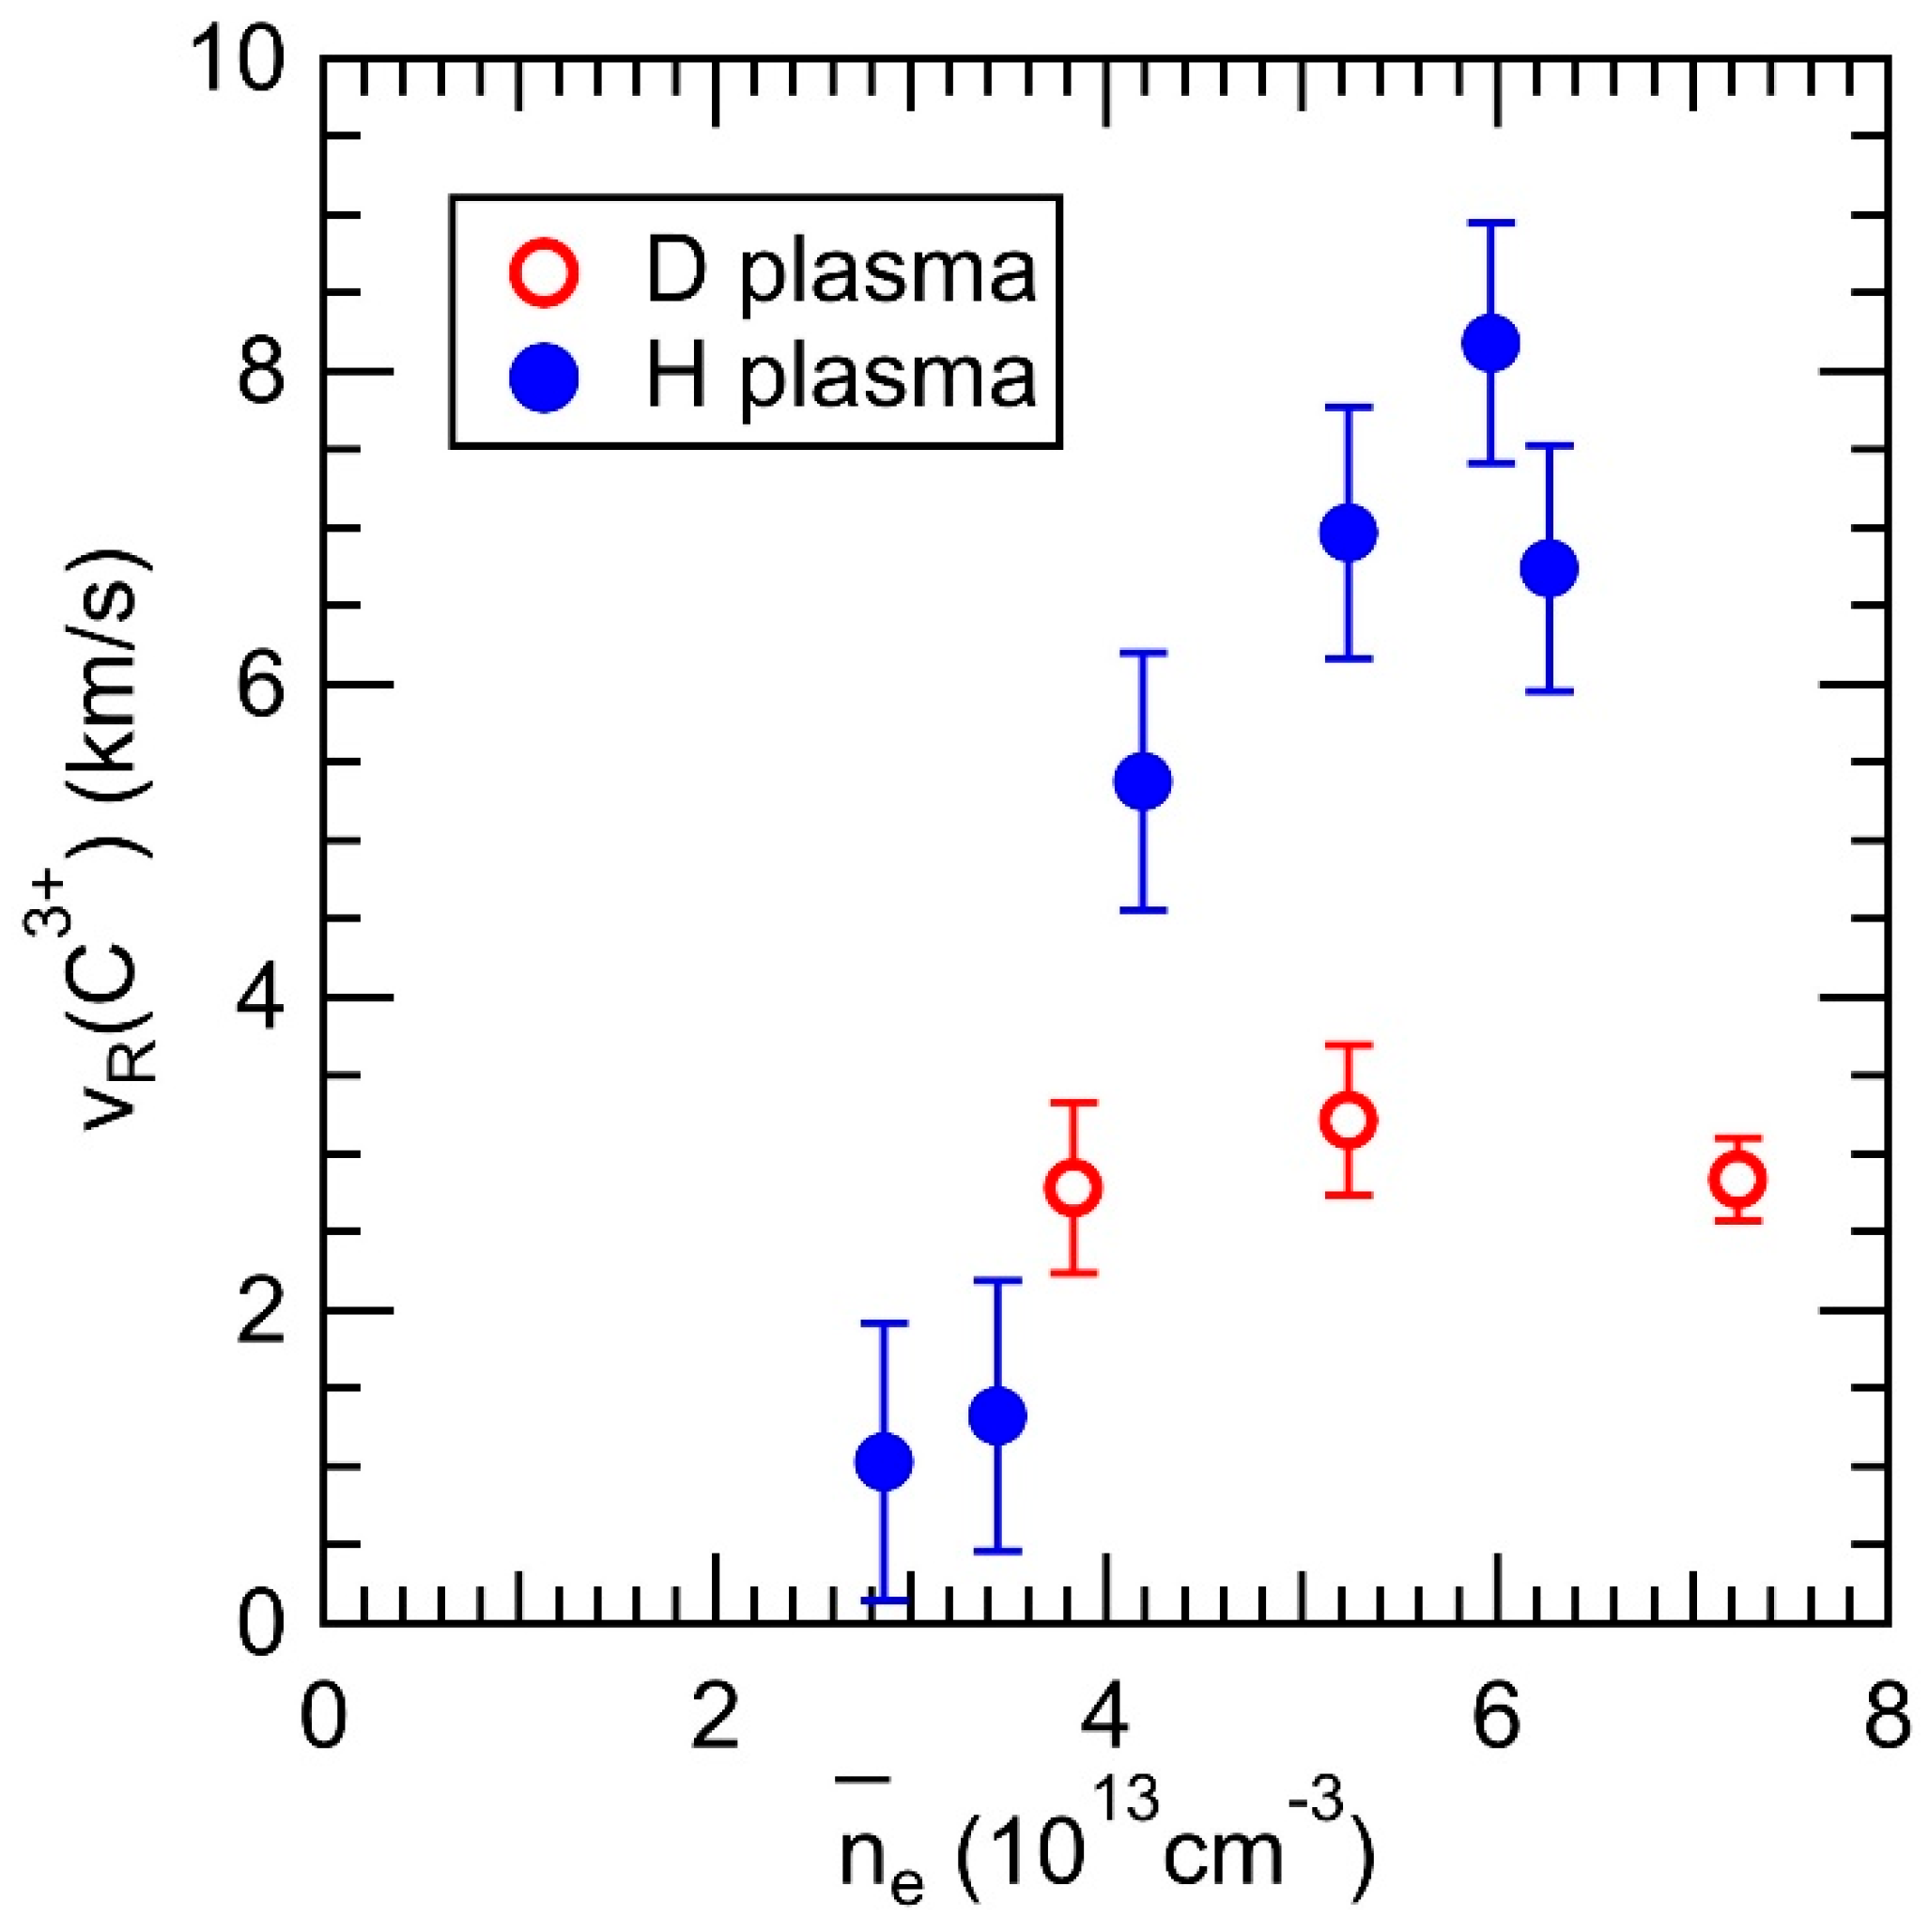
In Figure 8, the peak flow velocity observed at z = −480 mm is plotted against the line-averaged electron density. It can be observed that the flow velocity increases with the electron density in H plasmas, which is consistent with the simulation prediction that the friction force becomes dominant in the force balance at higher density regimes. This leads to an increase in impurity flow, potentially resulting in impurity screening. Conversely, the flow velocity has a smaller value in the case of D plasma. Assuming a steady state and neglecting terms except for the friction force and the ion thermal force in the momentum balance, the observed parallel impurity flow in the experiment, VZ//,obs, can be calculated using the following equation:
V Z / / , o b s   =   ( V i / /   +   2.6 Z 2 τ s m Z T i s )   cos θ
where Vi// is the thermal velocity of the bulk ions, Z is the charge of the impurity ion, τs is the impurity ion collision time, mZ is the mass of the impurity ion, ∂Ti/∂s (<0 in this case) is the ion temperature gradient along the magnetic field toward the divertor plate, and θ is the angle between the magnetic field line and the observation chord of the VUV spectroscopy. As ne increases, τs becomes small, causing the second term on the right-hand side of Equation (2) to become negligible. Consequently, the maximum value of VZ//,obs is limited by Vi//. This could explain why VZ//,obs saturates with increasing ne, as shown in Figure 8.
In high-density operations, i.e., ne ~ 5 × 1013 cm−3 on the horizontal axis in Figure 8, where the friction force is dominant, considering parameters of the plasmas at the outermost region of the ergodic layer and the spectroscopic geometry such as Ti,edge = 20 eV, ni,edge = 2 × 1013 cm−3, and θ = 75° for C+3 ions along the magnetic field line with the connection length of 100 m, the estimated VZ//,obs is 11.3 km/s for H plasmas and 8.0 km/s for D plasmas. The difference between these values for D and H plasmas is due to the mi1/2 dependence of Vi// when the friction force term is dominant in the force balance. Thus, the experimental observation of smaller flow values in the D plasmas, as shown in Figure 8, qualitatively agrees with the mass dependence of Vi//. However, a more detailed comparison of edge plasma parameters between H and D plasmas is required for a quantitative discussion to explain why the carbon flow in H plasmas is approximately twice as large as that in D plasmas in high-density regions.

4. Summary

The spectroscopic diagnostics performed in the EUV and VUV wavelength ranges provided insights into the generation and transport of carbon impurities in the edge plasmas of LHD for both H and D plasmas. The observed emission intensity of carbon CIII, CIV, CV, and CVI lines was significantly higher in the D plasma compared to in the H plasma. This suggests a larger sputtering rate of carbon materials in the D plasma, resulting in a higher quantity of carbon impurities originating from the divertor plates. To investigate the transport of carbon impurities in the ergodic layer at the edge of LHD plasma, space-resolved VUV spectroscopy was employed. It was determined that the direction of the carbon flows observed in both H and D plasmas aligned with the direction of the friction force in the parallel momentum balance acting on the impurity ions. This friction force serves as a driving force for impurity screening effects. The maximum value of the carbon flow in the D plasma was found to be smaller than that in the H plasma, indicating an isotope effect on the impurity transport. The difference in carbon impurity flow velocities between D and H plasmas can be qualitatively explained by the ion mass dependence of the bulk ion thermal velocity when the frictional force term dominates in the momentum balance.

Author Contributions

Conceptualization, T.O. and S.M. (Shigeru Morita); methodology, T.O. and S.M. (Shigeru Morita); software, T.O.; validation, T.O.; formal analysis, T.O.; investigation, T.O., S.M. (Shigeru Morita), M.K., G.K., Y.K., T.K., S.M. (Suguru Masuzaki), C.S. and M.G.; resources, T.O., S.M. (Shigeru Morita), Y.K., T.K. and M.G.; data curation, T.O., Y.K., T.K. and M.G.; writing—original draft preparation, T.O.; writing—review and editing, Shigeru Morita and M.G.; visualization, T.O.; supervision, S.M. (Shigeru Morita) and M.G.; project administration, S.M. (Shigeru Morita) and M.G.; funding acquisition, T.O., S.M. (Shigeru Morita) and M.G. All authors have read and agreed to the published version of the manuscript.

Funding

This work was partially supported by JSPS KAKENHI Grant Number JP20K03896.

Data Availability Statement

Data are available on request.

Acknowledgments

The authors thank all the members of the LHD team for their cooperation with the LHD operation.

Conflicts of Interest

The authors declare no conflict of interest.

References

  1. Stangeby, P.C.; McCracken, G.M. Plasma boundary phenomena in tokamaks. Nucl. Fusion 1990, 30, 1225–1379. [Google Scholar] [CrossRef]
  2. Evans, T.E.; Moyer, R.A.; Thomas, P.R.; Watkins, J.G.; Osborne, T.H.; Boedo, J.A.; Doyle, E.J.; Fenstermacher, M.E.; Finken, K.H.; Groebner, R.J.; et al. Suppression of Large Edge-Localized Modes in High-Confinement DIII-D Plasmas with a Stochastic Magnetic Boundary. Phys. Rev. Lett. 2004, 92, 235003. [Google Scholar] [CrossRef] [PubMed]
  3. Kobayashi, M.; Masuzaki, S.; Yamada, I.; Tamura, N.; Feng, Y.; Sato, K.; Goto, M.; Narushima, Y.; Akiyama, T.; Miyazawa, J.; et al. Detachment stabilization with n/m = 1/1 resonant magnetic perturbation field applied to the stochastic magnetic boundary of the Large Helical Device. Phys. Plasmas 2010, 17, 056111. [Google Scholar] [CrossRef]
  4. Morisaki, T.; Narihara, K.; Masuzaki, S.; Morita, S.; Goto, M.; Komori, A.; Ohyabu, N.; Motojima, O.; Matsuoka, K. Ergodic edge region of large helical device. J. Nucl. Mater. 2003, 313–316, 548–552. [Google Scholar] [CrossRef]
  5. Chowdhuri, M.B.; Morita, S.; Kobayashi, M.; Goto, M.; Zhou, H.; Masuzaki, S.; Morisaki, T.; Narihara, K.; Yamada, I.; Feng, Y. Experimental study of impurity screening in the edge ergodic layer of the Large Helical Device using carbon emissions of CIII to CVI. Phys. Plasmas 2009, 16, 062502. [Google Scholar] [CrossRef]
  6. Morita, S.; Dong, C.; Kobayashi, M.; Goto, M.; Huang, X.; Murakami, I.; Oishi, T.; Wang, E.; Ashikawa, N.; Fujii, K.; et al. Effective screening of iron impurities in the ergodic layer of the Large Helical Device with a metallic first wall. Nucl. Fusion 2013, 53, 093017. [Google Scholar] [CrossRef]
  7. Kobayashi, M.; Morita, S.; Dong, C.; Cui, Z.; Pan, Y.; Gao, Y.; Zhou, H.; Feng, Y.; Masuzaki, S.; Goto, M.; et al. Edge impurity transport study in the stochastic layer of LHD and the scrape-off layer of HL-2A. Nucl. Fusion 2013, 53, 033011. [Google Scholar] [CrossRef]
  8. Stangeby, P.C. The Plasma Boundary of Magnetic Fusion Devices, 1st ed.; Institute of Physics Publishing: Bristol, UK, 2000; pp. 296–323. [Google Scholar] [CrossRef]
  9. Oishi, T.; Morita, S.; Dai, S.; Kobayashi, M.; Kawamura, G.; Huang, X.; Zhang, H.; Liu, Y.; Goto, M. The LHD Experiment Group Observation of carbon impurity flow in the edge stochastic magnetic field layer of Large Helical Device and its impact on the edge impurity control. Nucl. Fusion 2018, 58, 016040. [Google Scholar] [CrossRef]
  10. Dai, S.; Oishi, T.; Kawamura, G.; Kobayashi, M.; Morita, S.; Feng, Y.; Wang, D. Three-dimensional simulations of edge impurity flow obtained by the vacuum ultraviolet emission diagnostics in the Large Helical Device with EMC3-EIRENE. Nucl. Fusion 2018, 58, 096024. [Google Scholar] [CrossRef]
  11. Dai, S.; Kobayashi, M.; Kawamura, G.; Morita, S.; Zhang, H.; Oishi, T.; Feng, Y.; Wang, D.; Suzuki, Y. EMC3-EIRENE modelling of edge impurity transport in the stochastic layer of the large helical device compared with extreme ultraviolet emission measurements. Nucl. Fusion 2016, 56, 066005. [Google Scholar] [CrossRef]
  12. Takeiri, Y.; Morisaki, T.; Osakabe, M.; Yokoyama, M.; Sakakibara, S.; Takahashi, H.; Nakamura, Y.; Oishi, T.; Motojima, G.; Murakami, S.; et al. Extension of the operational regime of the LHD towards a deuterium experiment. Nucl. Fusion 2017, 57, 102023. [Google Scholar] [CrossRef]
  13. Osakabe, M.; Takahashi, H.; Yamada, H.; Tanaka, K.; Kobayashi, T.; Ida, K.; Ohdachi, S.; Varela, J.; Ogawa, K.; Kobayashi, M.; et al. Recent results from deuterium experiments on the large helical device and their contribution to fusion reactor development. Nucl. Fusion 2022, 62, 042019. [Google Scholar] [CrossRef]
  14. Chowdhuri, M.B.; Morita, S.; Goto, M. Characteristics of an absolutely calibrated flat-field extreme ultraviolet spectrometer in the 10–130 A range for fusion plasma diagnostics. Appl. Opt. 2008, 47, 135–146. [Google Scholar] [CrossRef] [PubMed]
  15. Chowdhuri, M.B.; Morita, S.; Goto, M.; Nishimura, H.; Nagai, K.; Fujioka, S. Spectroscopic comparison between 1200 grooves/mm ruled and holographic gratings of a flat-field spectrometer and its absolute sensitivity calibration using bremsstrahlung continuum. Rev. Sci. Instrum. 2007, 78, 023501. [Google Scholar] [CrossRef]
  16. Oishi, T.; Morita, S.; Huang, X.; Zhang, H.; Goto, M.; LHD Experiment Group. Line Spectrum of Tungsten Ions at Low Ionization Stages in Large Helical Device in Wavelength Range of 300–2400 Å Measured Using 20 cm Normal Incidence VUV Spectrometers. Plasma Fusion Res. 2015, 10, 3402031. [Google Scholar] [CrossRef]
  17. Oishi, T.; Morita, S.; Dong, C.; Wang, E.; Huang, X.; Goto, M.; LHD Experiment Group. Space-resolved 3 m normal incidence spectrometer for edge impurity diagnostics in the large helical device. Appl. Opt. 2014, 53, 6900–6912. [Google Scholar] [CrossRef]
  18. Oishi, T.; Morita, S.; Kobayashi, M.; Mukai, K.; Kawamura, G.; Masuzaki, S.; Hayashi, Y.; Suzuki, C.; Kawamoto, Y.; Goto, M.; et al. EUV and VUV Spectra of NeIII-NeX Line Emissions Observed in the Impurity Gas-Puffing Experiments of the Large Helical Device. Plasma Fusion Res. 2021, 16, 2402006. [Google Scholar] [CrossRef]
  19. Oishi, T.; Ashikawa, N.; Nespoli, F.; Masuzaki, S.; Shoji, M.; Gilson, E.; Lunsford, R.; Morita, S.; Goto, M.; Kawamoto, Y.; et al. Line identification of boron and nitrogen emissions in EUV and VUV wavelength ranges in the impurity powder dropping experiments of LHD and its application to spectroscopic diagnostics. Plasma Sci. Technol. 2021, 23, 084002. [Google Scholar] [CrossRef]
  20. Oishi, T.; Morita, S.; Kato, D.; Murakami, I.; Sakaue, H.A.; Kawamoto, Y.; Kawate, T.; Goto, M. Simultaneous Observation of Tungsten Spectra of W0 to W46+ Ions in Visible, VUV and EUV Wavelength Ranges in the Large Helical Device. Atoms 2021, 9, 69. [Google Scholar] [CrossRef]
  21. Katai, R.; Morita, S.; Goto, M. High-Resolution VUV Spectra of Carbon, Neon and Argon in a Wavelength Range of 250 to 2300 Å for Plasma Diagnostics Observed with a 3 m Normal Incidence Spectrometer in LHD. Plasma Fusion Res. 2007, 2, 14. [Google Scholar] [CrossRef]
  22. Oishi, T.; Morita, S.; Huang, X.; Zhang, H.; Goto, M.; LHD Experiment Group. Observation of W IV–W VII line emissions in wavelength range of 495–1475 Å in the large helical device. Phys. Scr. 2016, 91, 025602. [Google Scholar] [CrossRef]
  23. Kramida, A.; Ralchenko, Y.; Reader, J.; NIST ASD Team. NIST Atomic Spectra Database, (ver. 5.10); National Institute of Standards and Technology: Gaithersburg, MD, USA, 2022. Available online: https://physics.nist.gov/asd (accessed on 15 March 2023).
  24. Nishimura, K.; Ashikawa, N.; Sagara, A.; Noda, N.; Kawahata, K.; Morita, S.; Peterson, B.J.; Sakakibara, S.; Takeiri, Y.; Tanaka, K.; et al. Effects of Boronization in LHD. J. Plasma Fusion Res. 2003, 79, 1216–1217. [Google Scholar] [CrossRef]
  25. Morita, S.; Goto, M. X-ray crystal spectrometer with a charge-coupled-device detector for ion temperature measurements in the Large Helical Device. Rev. Sci. Instrum. 2003, 74, 2375–2387. [Google Scholar] [CrossRef]
  26. Vietzke, E. Isotope Dependence of the Chemical Erosion of Graphite by Hydrogen/Deuterium Implantation. J. Nucl. Sci. Technol. 2002, 39, 363–366. [Google Scholar] [CrossRef]
  27. Liu, Y.; Morita, S.; Oishi, T.; Goto, M. Effect of neutron and γ-ray on charge-coupled device for vacuum/extreme ultraviolet spectroscopy in deuterium discharges of large helical device. Rev. Sci. Instrum. 2018, 89, 10I109. [Google Scholar] [CrossRef] [PubMed]
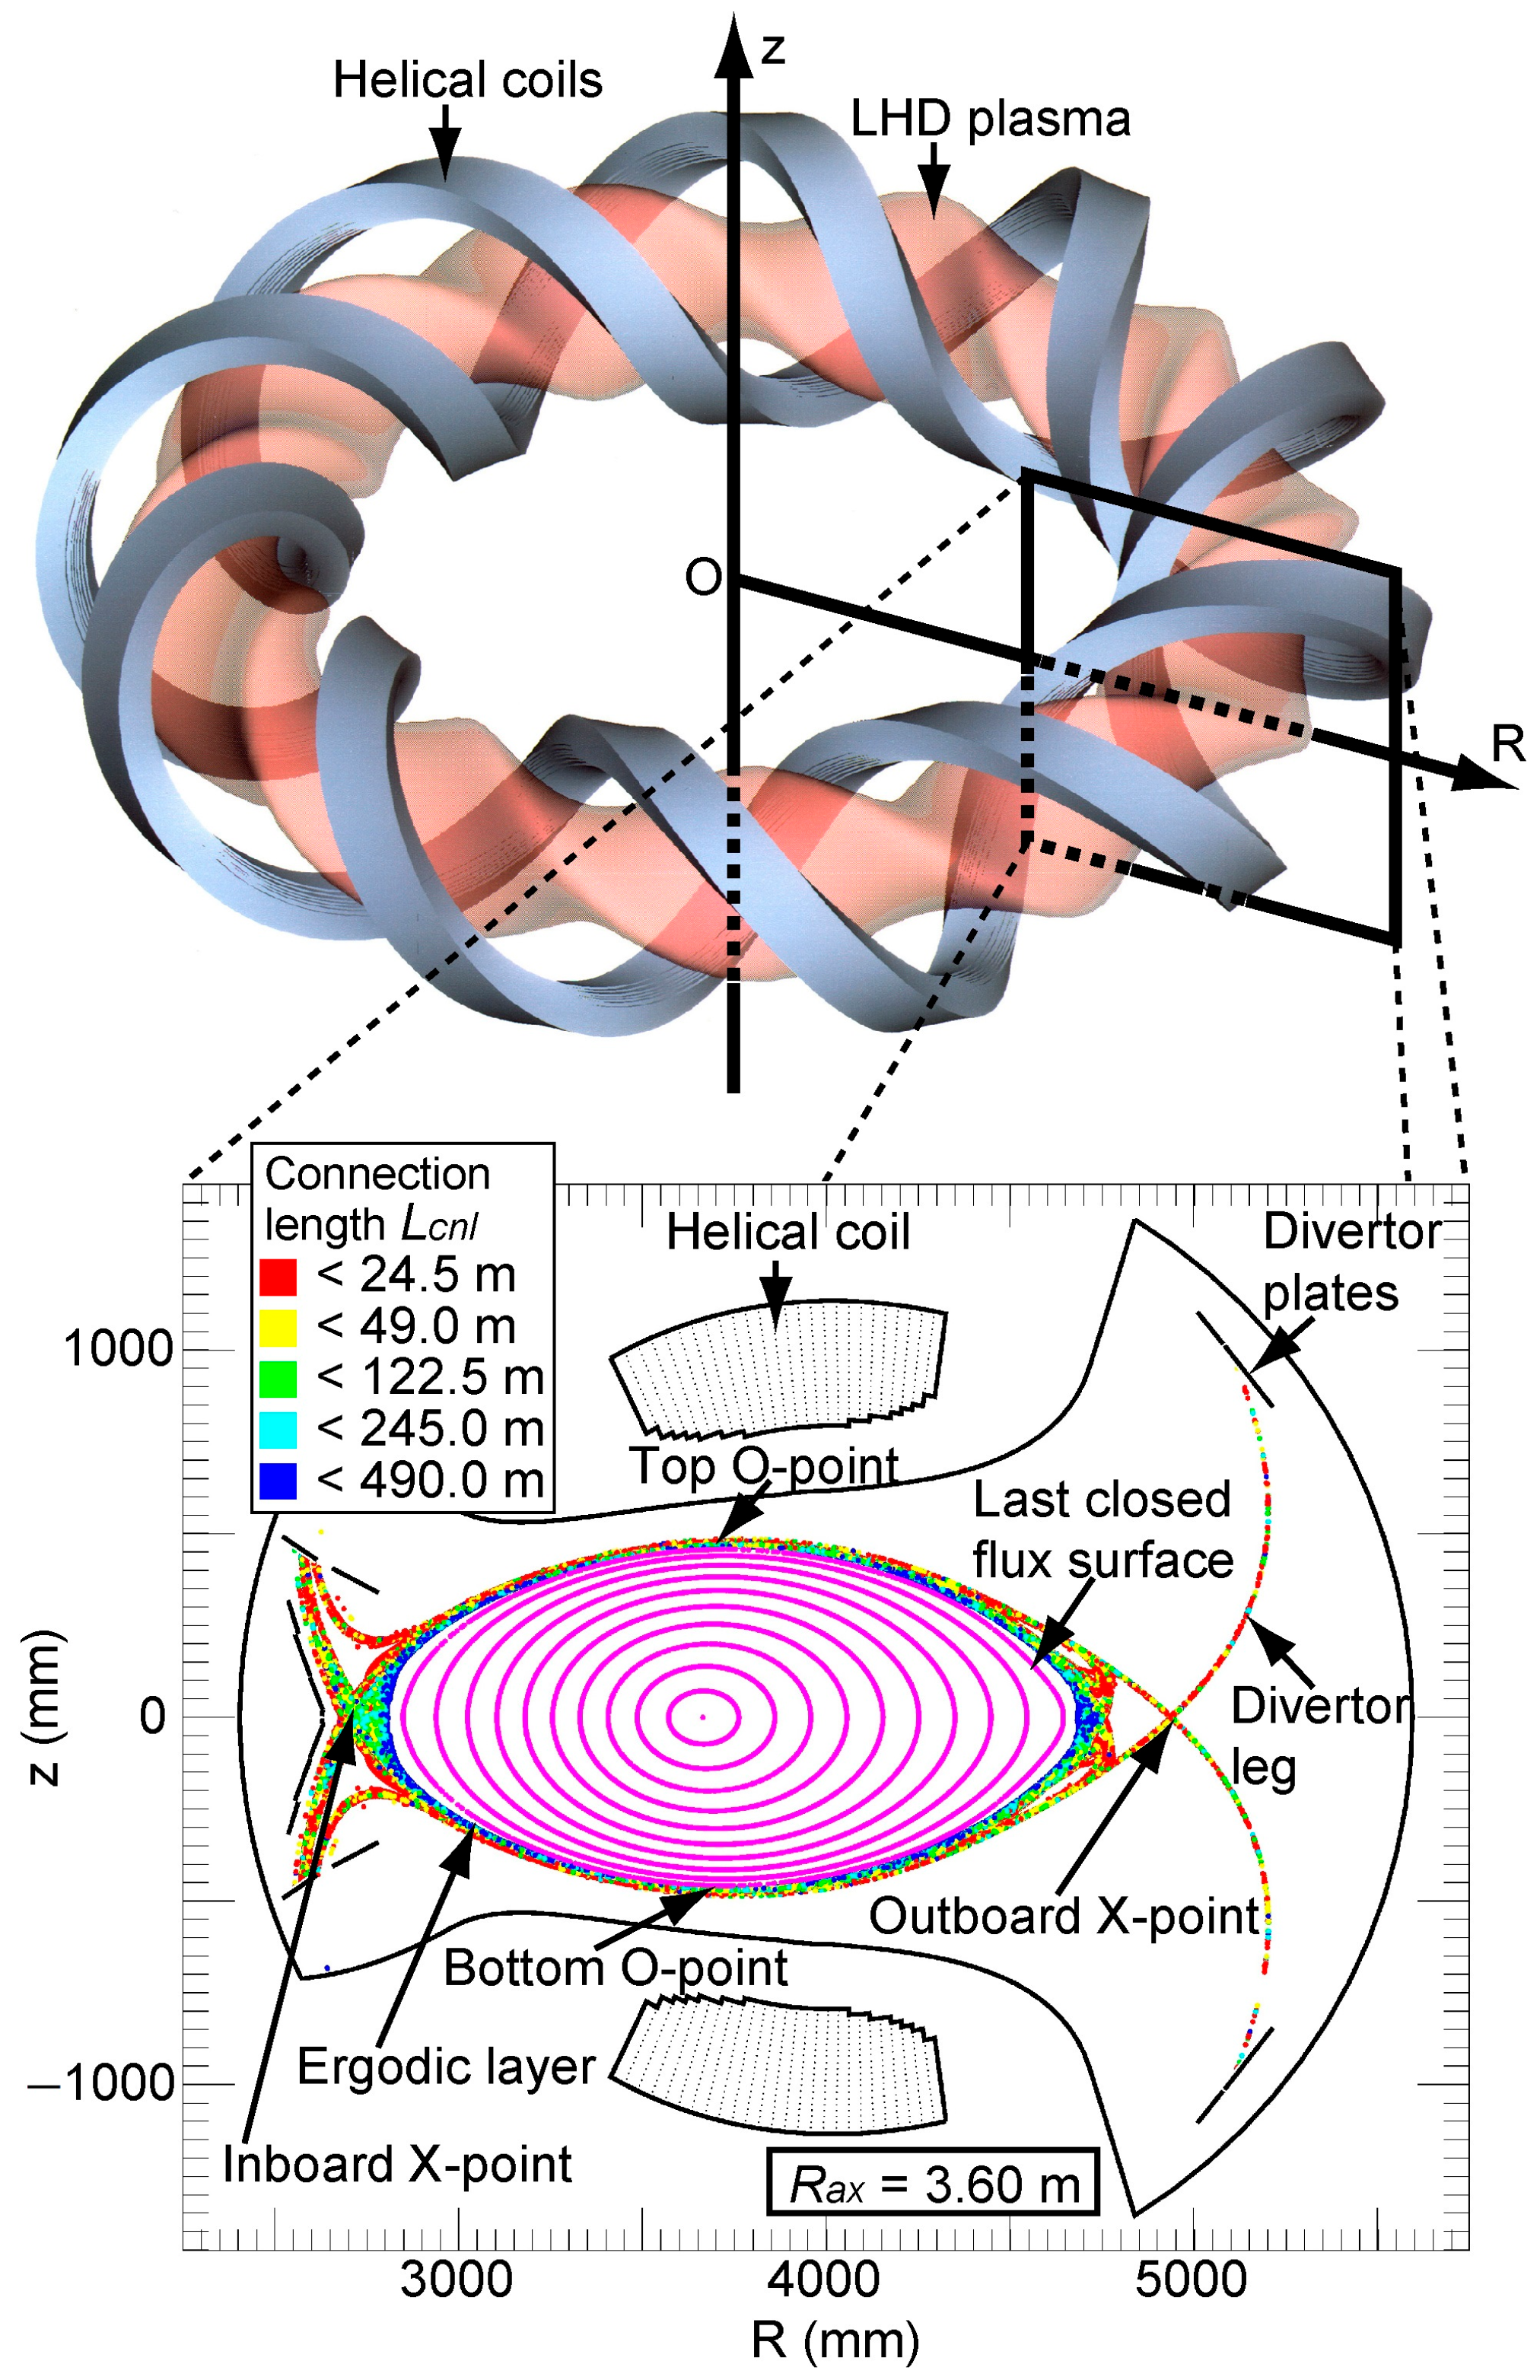
Figure 1. Schematic drawings of toroidal plasma with helical coils, as well as a horizontally elongated poloidal cross-section of the LHD. In the torus coordinate system, the coordinates R and z represent the major radial coordinate and the vertical coordinate, respectively. Poincaré plots of the stochastic magnetic fields within the ergodic layer under vacuum conditions are displayed for the poloidal cross-section corresponding to the position of the magnetic axis, Rax, of 3.6 m.
Plasma 06 00021 g001
Figure 2. Observation geometry of EUV and VUV spectroscopy diagnostics in LHD. (a) Top view of optical axes of two grazing incidence flat-field EUV spectrometers (“EUV Short” and “EUV Long”), three normal-incidence 20 cm VUV spectrometers (“VUV 109L”, “VUV 106R”, and “VUV 102R”), and a space-resolved normal-incidence 3 m VUV spectrometer (“VUV 3m”) depicted together with magnetic surfaces (Rax = 3.6 m). Plasma cross-section including the vertical observation range of (b) EUV Short, EUV Long, VUV 109L, VUV 106R, and VUV 102R and (c) VUV 3m. A, A’, B, and B’ in the subfigures represent the positions of the LCFS on the midplane in each plasma cross-section, respectively.
Plasma 06 00021 g002
Figure 3. Typical waveform of a discharge in which the EUV/VUV spectroscopy is applied. (a) ECH and n-NBI power, (b) central electron temperature, Te0, (c) line-averaged electron density, ne, with a waveform of the working gas puffing, (d) stored energy, (e) emission intensity of Dα, Hα, and the neutral particle ratio of D/(H + D). (f) Profiles of Te and ne at t = 4.2 s.
Plasma 06 00021 g003
Figure 4. Typical EUV/VUV spectra in the wavelength ranges of (a) 5–60 Å measured by “EUV Short” spectrometer, (b) 75–260 Å measured by “EUV Long” spectrometer, (c) 300–1050 Å measured by “VUV 109L” spectrometer, (d) 970–1870 Å measured by “VUV 106R” spectrometer, and (e) 1510–2400 Å measured by “VUV 102R” spectrometer for a D plasma. The spectra were averaged over 4.0–4.4 s.
Plasma 06 00021 g004aPlasma 06 00021 g004b
Figure 5. Line-averaged electron density dependence of line intensity of (a) CIII, (b) CIV, (c) CV, (d) CVI normalized by the electron density and (e) line ratio CV/CIV for deuterium and hydrogen discharges.
Plasma 06 00021 g005
Figure 6. Wavelength spectrum of the CIV lines measured using a 3 m VUV spectrometer for a D plasma. The horizontal axis corresponds to the full wavelength range covered in a single discharge.
Plasma 06 00021 g006
Figure 7. (a) The observation range of the 3 m VUV spectrometer at the bottom edge of the ergodic layer and the vertical profiles of (b) CIV line intensity, (c) ion temperature, and (d) flow velocity derived from the Doppler profile of the second order of CIV line emission (1548.20 × 2 Å) for a magnetic configuration with Rax = 3.6 m. Open and closed circles show the results from D and H plasmas, respectively.
Plasma 06 00021 g007
Figure 8. Observed C3+ flow at the bottom edge of the ergodic layer in the D and H plasmas as a function of line-averaged electron density for Rax = 3.6 m.
Plasma 06 00021 g008
Disclaimer/Publisher’s Note: The statements, opinions and data contained in all publications are solely those of the individual author(s) and contributor(s) and not of MDPI and/or the editor(s). MDPI and/or the editor(s) disclaim responsibility for any injury to people or property resulting from any ideas, methods, instructions or products referred to in the content.