Abstract
This work is an addition to the previously developed two-dimensional model of the shock–plasma interaction, extending it into the third dimension. The model can trace the evolution of the state of the hypersonic flow and the shock front refracted at a thermal discontinuity. The advantages of using the spherical coordinate system for this type of problem include increased transparency in interpreting the solution and a shortened calculation procedure, because all the changes to the front are reduced to one distortion component. Although the vorticity generation triggered at the interface is a consequence of the refraction and tied to the steep changes in the front, it is shown here that this is not because of an instant parameter jump at the interface due to refraction itself.
1. Introduction
The previously developed two-dimensional model [1] describes the state of the shock front and the changes to the hypersonic flow behind it as a result of its interaction with a thermal discontinuity created in a discharge, a flame, or an interstellar environment [2,3]. This work is a short addition to this model, extending it into the third dimension.
The model is mainly focused on modification of the hypersonic flow state as the shock is traveling through a heated volume of gas or plasma, floating in an environment with different state properties. The processes accompanying the interaction include intensive modifications to both the supersonic flow and the structure of the heated spot. In case of a regular refraction, upon the incidence of a shock at that spot, the shock wave splits, with one portion being transmitted through the hot spot, and another one being reflected off the interface. When inside the heated medium, the shock front is accelerated and becomes increasingly curved and locally weakened [4]. Redistribution of the flow parameters following the shock front deformations and the strong local reduction in the gas pressure result in an intensive vortex system setting at the shock front. The positive dynamics of the vortex intensity in the aftershock flow suggest volume effects following the shock refraction at the interface. The sucking effect caused by the pressure redistribution results in distortion and the eventual collapse of the heated region span through a non-linearly intensified vortex system. In case of irregular refraction, additional structures feature a triple point with reflected shocks and a Mach stem formed in front of the interface. Since the model is focused on the flow inside the hot spot, the irregular structures will be assumed to be secondary, being superimposed onto the image of a regular refraction.
In determining the mechanisms of the interaction, the existing research can be conditionally split into two major approaches, falling into the categories of a thermal or non-thermal nature. The first one considers thermal heating as a possible reason for the Mach number decrease due to changes in the speed of sound, and the possibility of mean molecular weight and number density changes caused by molecule dissociation and ionization [5].
The second approach takes into consideration processes such as atomic and molecular transitions, gas kinetics, the electrical properties of plasmas, and non-equilibrium states. The latter may take place as a result of a relative delay between different terms contributing to the energy content of the gas, which occur during the establishment of thermal equilibrium in the past shock flow. Similar effects occur due to the fast-evolving processes in the presence of radiation or fast expansion [2]. A number of other mechanisms have been proven to contribute, such as the appearance of charged particles leading to upstream momentum transfer in the hypersonic flow, the possibility of deflection of the incoming flow due to plasma in front of the shock via electronic momentum transfer collisions, and the release of heat into the shock layer via exothermic reactions enhancing the shock layer temperature and thus reducing the pressure and density behind the shock wave. The references and an analysis of this research can be found in [1].
Although the effects seen in experiments are the consequence of a mix of contributions taking place in different phases of the interaction, it was admitted by the community of researchers that the thermal mechanism is prevalent and is responsible for the most observable features. At the same time, the contribution of the second type, involving atomic, molecular, and electrical processes, could be responsible for the finer structure of the shock front refracted into the plasma medium. For example, under non-equilibrium flow conditions, an extended structure of the shock front forms with the continuous distribution of gas parameters [2]. In the presence of charged particles in the afterglow of a discharge, a double electric layer set up at the shock front during its passage through the medium can affect the shock motion [6].
The problem of shocks propagating through the plasma medium has been under consideration for decades, resulting in a number of models that are used to describe the evolution of the supersonic flow. These include the following: a simplified geometrical shock dynamics model, in which the shock is decomposed into elementary ray tubes, with each portion propagating along rays normal to the front, with a velocity dependent on the local Mach number [7]; a geometrical acoustic model, as an extension of the Huygen’s wave front construction method, applied to the weakly nonlinear wave front [8,9,10]; a kinematic model using the singular surface theory [11,12] and the compatibility conditions derived along a shock ray [13,14]; the geometrical shock dynamics model [15] based on Whitman’s geometrical acoustics theory [16], used for numerical calculations studying the self-focusing of initially curved shock fronts and applied to the shock’s propagation along walls and in channels; the model of interaction of weak shocks with discrete gaseous inhomogeneities, in which wave configurations are determined by the geometrical acoustics, including the effects of refraction, reflection and diffraction [17]; and the three-dimensional, time-dependent, multifluid-Euleriam method used for numerical simulations of weak plane shocks interacting with a heated volume of gas [18], which provides a very detailed description of the interaction picture.
The shock–plasma interaction model presented here is of a mixed type. While based on the thermal mechanism, it can be extended by considering atomic and molecular transitions that contribute to non-equilibrium states, thus affecting the finer structure of the shock and its refraction into the plasma medium. Even though it does not directly account for the electrical properties of plasma, the model is specifically developed for the gas parameter distributions, geometry, and dimensions common for plasmas obtained in discharges.
Both the open and closed interfaces of an arbitrary shape are covered by the existing model, in the plane of symmetry oriented along the shock propagation direction that corresponds to the cylindrical symmetry case. In describing the evolution of the hypersonic flow over time, the model essentially relates the perturbation to the front with the incident shock, plasma medium, and the interface geometrical parameters. Under definite conditions, the dynamics of the perturbation to the front represents an instability that develops in the form of wave-like stretchings into the lower-density medium, followed by the loss of stability in the flow behind it, which eventually evolves into an intense vortex structure. The instability mode in this case is aperiodical and unconditional, and the shock state evolves with either a transition to another stable state or continuous development as a secondary flow [19]. The instability contains a set of interesting features, such as the following: a similarity law in the spatial and temporal evolution of the perturbations with respect to the interface curvature; the instability locus’ independence of the gas density distribution, thus identifying the interface conditions as the sole triggering factor; the specific role of the density gradient in the instability evolution, discriminating between qualitatively different outcomes; the possibility of decay via non-viscous damping mechanisms; the connection between the shock and the interface stability.
Both a sharp and an extended type of interface can be accommodated within the model, resulting in a considerable difference in the refraction effect [20]. If accounting for real gas effects, the model predicts significant deviations in the shock reflection and refraction strengths at the interface with plasma [20,21,22,23,24], and shows that the presence of thermodynamic non-equilibrium in the hypersonic flow can result in a variation in the shock wave structure during the interface crossing and its interaction with plasma medium [2,22,25,26]. Studying the dynamics of the two components of the front distortion, in the longitudinal and transversal directions, revealed another interesting feature of the interaction, showing the possibility of vorticity generation in the hypersonic flow behind the refracted front. This is triggered at the interface due to parameter redistribution in the flow behind the front and continues inside the plasma spot in an intense non-linear dynamics mode [1]. The induced rotation of the shock velocity components tended to occur under definite conditions, and was typically attributed to the front portion which underwent the steepest changes. In this connection, considering the model in 3D would allow one to see whether the presence of a third dimension in the interaction can instantly produce a component of the shock velocity at the interface due to refraction itself, resulting in an additional spinning of the front elements around the longitudinal symmetry axis.
In the following examples, two problems featuring spherical and cylindrical geometries will be solved numerically in 3D, and the results for the front profiles will be matched to those obtained with the 2D model.
2. Refraction Parameters and the Shock Distortion Components in 3D
The aim of this paragraph is to determine the shock refraction parameters and the front distortion in 3D, with time as a function of the interface coordinates. It will be assumed that the plasma medium inside the sphere is heated to temperature T2, and the gas surrounding the sphere is kept at T1 and the same pressure p1 = p2 = patm. A planar shock wave will be incident on a spherical interface in the x-direction with the velocity V1, as shown in Figure 1, i.e.,
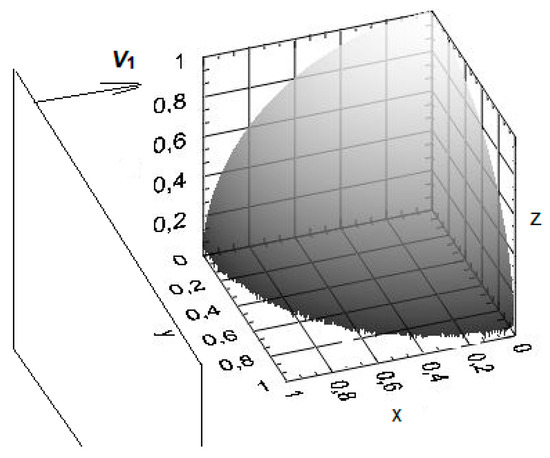
Figure 1.
Schematic diagram of a planar shock wave incident on a spherically shaped heated spot with a velocity V1 along the x-direction.
In the spherical coordinate system, this translates into a three-component vector:
where (x,y,z) and (r,θ,φ) are the corresponding coordinates of the point of interaction (i) on the sphere, θ is the angle between the r- and z-directions, the angle φ is in the x-y plane, the symbol “hat” over a coordinate denotes the unit vector in the corresponding direction, and the angles φ and θ are determined as follows:
The component of the velocity normal to the surface, which its the radial component,
and the tangential component
Then, the incidence angle α, defined as the angle between vector V1 and the normal to the sphere at the point (i), is determined by the relation:
The velocity V2 of the shock wave refracted into the hot sphere is obtained through its normal and tangential components, V2n and V2τ. The normal component of the velocity V2n is determined by the ratio of normal components of the Mach number M2n(M1n). It is obtained from a pair of shock refraction equations and depend on the temperature ratio conditions across the interface [19]:
where and ,
from which
Using the continuity principle for tangential components across the interface,
the shock velocity vector inside the sphere for the front element crossing the point (i) takes the following form:
Then, the refraction angle γ, which is the one between vectors V1 and V2, is determined by the following equation:
In the next step, the shock front distortion can be found by following the path of a small element “s” of the incident shock front through the plasma inside the sphere, as shown in Figure 2.
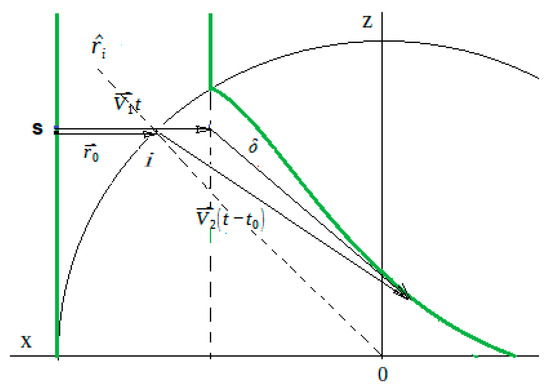
Figure 2.
The initially planar shock front (green vertical line) distorted (green curve) during its refraction into a spherical plasma spot, projected onto the (z,x)-plane.
In the reference frame moving with the velocity V1, the distortion vector is as follows:
where t is the interaction time starting at the moment the initial planar shock arrives at the location x = R, R is the sphere radius, rs is the radial coordinate of the small element “s” that eventually crosses the sphere at the interaction point “i”, is the local displacement for the time t0 when the shock approaches the interface, and the third term in the right-hand side of Equation (12) is introduced to obtain the front coordinates relative to the portion of the front that is undisturbed by the plasma spot.
For the shock front approaching the interface along the x-direction,
Using (3) and (10), Equation (12) transforms into
where angles φ and θ are referred to the point of interaction i.
Since , the and components of the distortion in Equation (14) are equal to zero
and the expression (14) takes the following final form
from which it immediately follows that all the changes in the front occur in the radial direction only. It should be noted that the “radial” direction has a current status as it is dependent on the position of the interaction point “i”, and thus it changes as the interaction point progresses along the interface surface, starting in the (x,y)-plane at {t = 0, x = R} and ending up in the (z,y)-plane (at x = 0). Consequently, referring to Figure 2, the vector δr will always be parallel to the current radial direction ri drawn through the interaction point i.
Going back to the Cartesian coordinate system, to determine the projections of Equation (16) onto the (x, y, z) basis, the factor ε in (7) should first be expressed in the spherical coordinate system. In accordance with the results in [21], the normal component of the Mach number is a function of M1n that is very close to linear
where factors ζ and η are numerical coefficients that are dependent on the Mach number M1, the ratio , and the specific heat ratio constants for the two media.
Then, with
and Equations (4) and (7), we can obtain the following:
from which, and in accordance with Equation (16),
and the three cartesian components of the distortion are as follows:
Equation (20) can be further generalized by presenting it in a dimensionless form if scaling δr with the characteristic length R and time—with τ = R/V1. Then, for the dimensionless time and the coordinates , , it yields the following dimensionless equation for δr:
and its corresponding cartesian components:
where the “bar” over a variable represents its dimensionless equivalent.
3. Numerical Results for Spherical and Cylindrical Geometries
For illustration purposes and to match them with the existing 2D model results (in the two planes of symmetry), a numerical simulation was carried out for a particular case of non-dissociating nitrogen gas heated to temperature T2 = 2000 K with the outside temperature of T1 = 300 K, the incident shock Mach number M1 = 3.5, and p = patm. In the slow–fast scenario present at the entrance of the heated spot, the ratio of normal components of the Mach number in (7) was obtained using the refraction equation that assumes that the reflected wave is a rarefaction wave. For the shock and gas conditions considered here, the function M2n = f (M1n) was determined in [27] and the factors ζ and η in (17) can also be borrowed from there. With those parameters in place, the radial component of the front distortion δr and its projections into the Cartesian basis δx, δy, δx were calculated using Equations (20) and (21). The simulation results in the (z,y)-plane, which is transversal to the shock incidence direction, are presented in Figure 3 and correspond to the dimensionless time nt = 1.0.
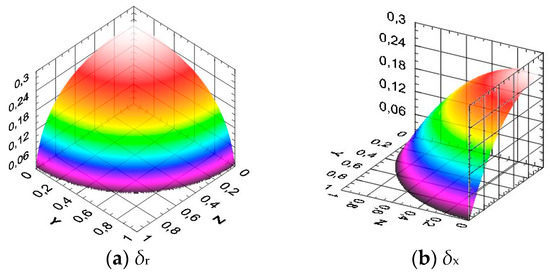
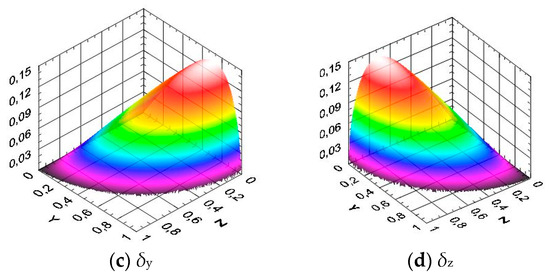
Figure 3.
The distortion components δr, δx, δy, and δz at the moment of time nt = 1.0, plotted in the (z,y)-plane. Diatomic nitrogen gas at T1 = 300 K, T2 = 2000 K, M1 = 3.5, and p = patm.
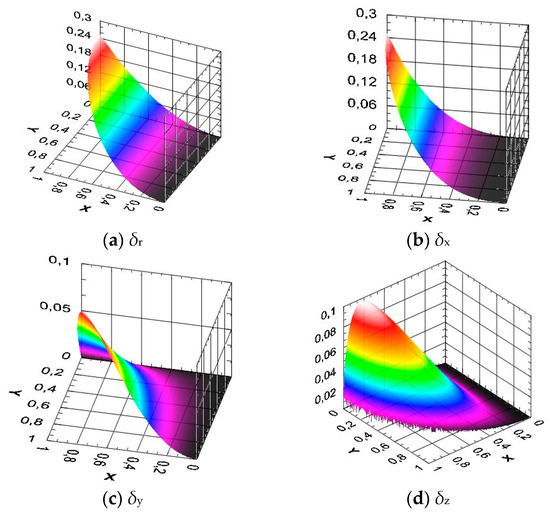
Figure 4.
The distortion components δr, δx, δy, and δz at the moment of time nt = 1.0, plotted in the (x,y)-plane, for the same shock and gas parameters shown in Figure 3.
As the plots in Figure 3 demonstrate, the distributions for δr and δx in the radial and longitudinal directions are fully symmetrical, as well as those in Figure 4, exhibiting the same tendency and maximum locations. With projecting the profiles into the two planes of symmetry in Figure 3 and Figure 4, it can be seen that they are similar to those obtained with the 2D model in [27] (Figure 5). In the plot of Figure 5, the curve used for comparison at the moment of time nt = 1.0 is the one crossing the sphere pole.
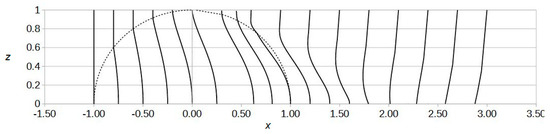
Figure 5.
Shock profiles obtained with a 2D model in the (z,y)-plane at various times, as shown in Figure 3. The curves correspond to dimensionless times through the equal intervals of Δnτ = 0.2 for the first six curves, Δnt = 0.15 for the next three crossing the back interface, and Δnt = 0.3 for those propagating freely behind it. The curve crossing the sphere pole corresponds to the time nτ = 1.0.
A problem featuring cylindrical symmetry can be considered here by using the polar coordinate system (i.e., to which the 2D model is applied), in which the relations derived above are reduced to the planar case by taking φ = 0 and leaving θ as a variable, resulting in yi = 0, ys = 0, and δy = 0. In this case, the problem corresponds to a planar shock interacting with the interface of a cylindrical shape that is shown by the gray-colored surface in Figure 6a. The results for the distortion profiles at the time nt = 1.0 and the same shock and gas parameters as used above are presented in Figure 6.
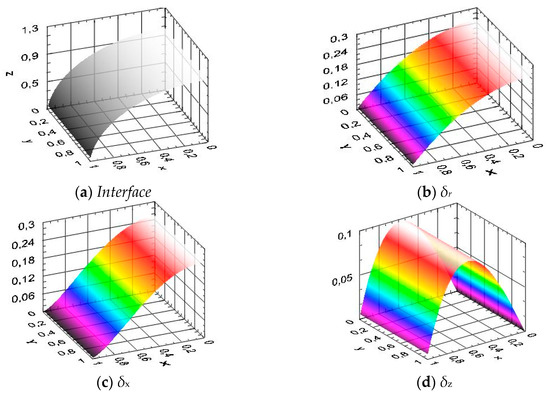
Figure 6.
The initial planar shock front modification in the case of cylindrical symmetry at the time nt = 1.0 and with the same shock and gas parameters as shown in Figure 3.
The profiles match those in the previous figures when projected onto the corresponding planes of symmetry, as well as those in Figure 5 if taken as a slice in the (z,x)-plane. To demonstrate the exact matching, the data obtained with the 3D model are compared with the data of the 2D case in Figure 5 at a particular moment of time, nt = 1.0. For this, the longitudinal component of the front distortion δx is plotted against one of the two lateral coordinates, z, as shown in Figure 7. The 2D plot, as a projection of the 3D function δx(x,y,z), was obtained by taking it at y = 0 (φ = 0). The function δx (x,y = 0,z) corresponds to the plane passing through the longitudinal axis of symmetry of the heated spot (y = 0), where the distortion of the front has an extremum.
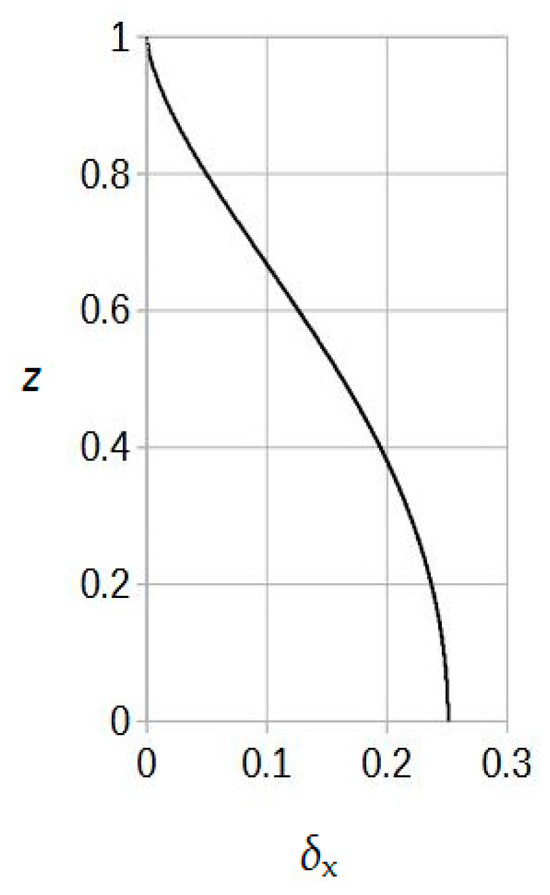
Figure 7.
The distortion component δx vs. coordinate z in the plane passing through the longitudinal axis of symmetry (y = 0), at the time nt = 1.0.
Comparing the data in the Figure 7 and the curve in Figure 5 corresponding to the moment of time nt = 1.0 (the one crossing the sphere pole) shows that they exactly match each other. Thus, in both planes of symmetry, the 3D model transitions into its 2D equivalent. Because of the symmetry, the y- and z-directions are equivalent, which essentially justifies the use of the 2D model for axi-symmetrical geometries. The results for the two models match analytically as well, if different definitions of the angles are accounted for using the transition θ → π/2 − α.
4. Conclusions
The examples obtained based on the 3D spherical coordinate representation illustrated that the front distortion in the transversal plane exhibits a fully symmetrical distribution, thus validating the use of the 2D model in spherically symmetrical problems. The projection of the 3D results onto the two planes of symmetry coincided with the results obtained with the 2D model, thus showing that the 3D model relations can exactly transition into their 2D equivalent (at φ = 0).
Considering the interaction problem in 3D, it was shown to be advantageous using the spherical coordinate system instead of the cartesian system, as this reduces all the changes to the front to one component of the distortion vector. This is the direct consequence of the continuity principle for the tangential components of the velocity, from which it follows that there will be no change in the distortion vector components in the azimuthal and orbital directions. It immediately follows that the lack of tangential components of the distortion vector at the interface excludes the possibility of an additional spinning of the front elements due to refraction itself. When relating this result to the phenomena of vorticity generation triggered at the interface and described in [1], the following difference should be noted. While there is no instant, jump-like rotation of the shock velocity vector at the moment of refraction at the interface, the positive dynamics in the radial component of the front distortion initiates and further supports the production of vorticity. As shown in [1], the vorticity is triggered and amplified at the locations of the steepest changes in the front. Thus, a presentation of the distortion components in the spherical coordinate system offers a transparent way to show and essentially rule out the possibility of an instant vorticity generation at the interface. It points to a different type of mechanism and a different location, suggesting that vorticity production occurs at a later point in the shock propagation, rather than at the interface.
It should be noted that one of the findings here associated to no vorticity generation immediately at the interface is not generally related to the Crocco’s theorem. The theorem states that in a case of non-zero change in the entropy and/or enthalpy, the flow must be rotational. The statement particularly applies across a curved shock wave, as the parameter jumps are dependent on the local shock angle α. Consequently, the rotational component of the flow velocity is dependent on the shock front curvature ∂α/∂l along the front surface [28]. This implies that as long as the shock front is curved, it is an effective generator of vorticity. To avoid possible confusion, it should be noted that the findings of this work apply to the change in the hypersonic flow across the interface with a heated gas, while the theorem is valid in the area across the shock front.
Still, the findings are in agreement with this theorem locally when considering the flow motion in the shock–plasma interaction, which can be divided into two separate stages. The first one is the shock wave refraction at the interface, where instant changes in the shock parameters occur. At the second stage, the shock front of an increasing with time curvature propagates freely inside the heated spot until it hits its rear boundary. Assuming the heated gas parameters are uniformly distributed, Crocco’s theorem applies at this stage and the generation of vorticity in the post-shock flow is expected. This goes along with the findings in [1], where the vorticity tied to the locations of the steepest distortions in the shock front, i.e., proportionally to the derivative ∂α/∂l, is produced during its propagation in the heated medium. It was also shown that this occurs in the medium with a non-uniform parameter distribution as well. This fact does not contradict the theorem of [28], where the theorem’s validity was extended to the conditions of non-uniformity and reacting gases.
As another bonus of the spherical coordinate representation, the form of the solution obtained here is more transparent in terms of its interpretation. It significantly shortens the calculation by eliminating a set of parameters needed in the procedure, such as the incident and refraction angles, the associated Mach number, and velocity components. As in the 2D model, the 3D relations can be presented in a dimensionless form and thus can be applied in a wider range of applications.
Funding
This research received no external funding.
Data Availability Statement
The original contributions presented in the study are included in the article, further inquiries can be directed to the corresponding author.
Conflicts of Interest
The author declares no conflict of interest.
References
- Markhotok, A. Wave Drag Modification in the Presence of Discharges. In Compressible Flows and Shock Waves; IntechOpen: London, UK, 2019. [Google Scholar] [CrossRef]
- Zel’Dovich, Y.B.; Raizer, Y.P. Physics of Shock Waves and High-Temperature Hydrodynamic Phenomena; Academic Press: New York, NY, USA; London, UK, 1967. [Google Scholar]
- Bushnell, D. Shock wave drag reduction. Ann. Rev. Fluid Mech. 2004, 36, 81–96. [Google Scholar] [CrossRef]
- Starikovskiy, A.; Aleksandrov, N. Gasdynamic Flow Control by Superfast Local Heating in a Strongly Nonequilibrium Pulse Plasma. Plasma Phys. Rep. 2021, 47, 148–209. [Google Scholar] [CrossRef]
- Kremeyer, K.; Sebastian, K.A.; Shu, C.-W. Computational study of shock mitigation and drag reduction by pulsed energy lines. AIAA J. 2006, 44, 1720–1731. [Google Scholar] [CrossRef][Green Version]
- Avramenko, R.F.; Rukhadze, A.A.; Teselkin, S.F. Structure of a shock wave in a weakly ionized nonisothermal plasma. JETP Lett. 1981, 34, 463–466. [Google Scholar]
- Ridoux, J.; Lardjane, N.; Monasse, L.; Coulouvrat, F. Comparison of Geometrical Shock Dynamics and Kinematic models for shock wave propagation. Shock Waves 2017, 28, 401–416. [Google Scholar] [CrossRef]
- Sturevant, B.; Kulkarni, V.A. The focusing of weak shock waves. J. Fluid Mech. 1976, 73, 651–671. [Google Scholar] [CrossRef]
- Keller, J.B. Geometrical Acoustics I. The Theory of Weak Shock Waves. J. Appl. Phys. 1954, 25, 938. [Google Scholar] [CrossRef]
- Prasad, P. A nonlinear ray theory. Wave Motion 1994, 20, 21–31. [Google Scholar] [CrossRef]
- Sharma, V.; Radha, C. Three dimensional shock propagation in an ideal gas. Intern. J. Non-Linear Mech. 1995, 30, 305–322. [Google Scholar] [CrossRef]
- Truesdell, C.; Toupin, R. The classical field theories. In Principles of Classical Mechanics and Field Theory; Springer: Berlin/Heidelberg, Germany, 1960; pp. 226–858. [Google Scholar]
- Ravindran, R.; Prasad, P. On an Infinite System of Compatibility Conditions Along a Shock Ray. J. Mech. Appl. Math. 1993, 46, 131–140. [Google Scholar]
- Ravindran, R.; Prasad, P. A new theory of shock dynamics Prt. I: Analytic considerations. Appl. Math. Lett. 1990, 3, 77–81. [Google Scholar] [CrossRef][Green Version]
- Hendershaw, W.D.; Smith, N.F.; Schwendeman, D.W. Numerical shock propagation using geometrical shock dynamics. J. Fluid Mech. 1986, 171, 519–545. [Google Scholar] [CrossRef]
- Whitham, G.B. A new approach to problems of shock dynamics Pt I: Two dimensional problems. J. Fluid Mech 1957, 2, 145–171. [Google Scholar] [CrossRef]
- Haas, J.-F.; Sturtevant, B. Interaction of weak shock waves with cylindrical and spherical inhomogeneities. J. Fluid Mech 1987, 181, 41–76. [Google Scholar] [CrossRef]
- Niederhaus, J.H.; Oakley, J.A.G.J.G.; Ranjan, D.; Anderson, M.H.; Bonazza, R. A computational parameter study for the three-dimensional shock-bubble interaction. J. Fluid Mech 2008, 594, 85–124. [Google Scholar] [CrossRef]
- Markhotok, A. A shock wave instability induced on a periodically disturbed interface. IEEE Trans. Plasma Sci. 2018, 46, 2821–2830. [Google Scholar] [CrossRef]
- Markhotok, A.; Popovic, S. Refractive phenomena in the shock wave dispersion with variable gradients. J. Appl. Phys. 2010, 107, 123302. [Google Scholar] [CrossRef]
- Markhotok, A. The Effect of Gas Nonideality on the Interface Reflectivity When Interacting with a Shock Wave. IEEE Trans. Plasma Sci. 2020, 48, 3759–3767. [Google Scholar] [CrossRef]
- Paterson, S. The Reflection of a Plane Shock Wave at a Gaseous Interface. Proc. Phys. Soc. 1948, 61, 119. [Google Scholar] [CrossRef]
- Bulat, P.V.; Silnikov, M.V.; Chernyshov, M.V. Shock Wave Refraction at Gas Media Interface. Indian J. Sci. Technol. 2016, 9, 1–5. [Google Scholar] [CrossRef]
- Colella, P. A Numerical Study of Shock Wave Refraction at a Gas Interface. In Proceedings of the 9th Computational Fluid Dynamics Conference, Buffalo, NY, USA, 13–15 June 1989; pp. 426–439. [Google Scholar]
- Markhotok, A. Nonequilibrium Factor in the Structure of a Curved Shock Wave Refracted into an Intensively Heated Medium. IEEE Trans. Plasma Sci. 2022, 50, 596–608. [Google Scholar] [CrossRef]
- Bethe, H.A.; Teller, E. Deviations from Thermal Equilibrium in Shock Waves; Bethe, H.A., Ed.; University Microfilms, Inc.: Ann Arbor, MI, USA, 1961. [Google Scholar]
- Markhotok, A. Non-symmetry in the Shock Refraction at a Closed Interface as a Recovery Mechanism. Dynamics 2024, 4, 57–80. [Google Scholar] [CrossRef]
- Emanuel, G. Vorticity in Unsteady, Viscous, Reacting Flow and Downstream of a Curved Shock. AIAA J. 2007, 45, 2097–2099. [Google Scholar] [CrossRef][Green Version]


Disclaimer/Publisher’s Note: The statements, opinions and data contained in all publications are solely those of the individual author(s) and contributor(s) and not of MDPI and/or the editor(s). MDPI and/or the editor(s) disclaim responsibility for any injury to people or property resulting from any ideas, methods, instructions or products referred to in the content. |
© 2024 by the author. Licensee MDPI, Basel, Switzerland. This article is an open access article distributed under the terms and conditions of the Creative Commons Attribution (CC BY) license (https://creativecommons.org/licenses/by/4.0/).