Article

Toroidal CO2 Plasma Sources with Low- and High-Frequency Power Coupling Configurations for Improved Energy Transfer Efficiencies

1
Plasma Solar Fuels Devices, Dutch Institute for Fundamental Energy Research (DIFFER), De Zaale 20, 5612 AJ Eindhoven, The Netherlands
2
PWR Electron, Analogue & RF Development, 6744 WB Ederveen, The Netherlands
3
Electrical Engineering and Computer Science Department, University of Michigan, Ann Arbor, MI 48109-2122, USA
4
Leiden Institute of Physics, Leiden University, Niels Bohrweg 2, 2333 CA Leiden, The Netherlands
5
Fontys, Applied Physics, Nexus, de Rondom 1, 5612 AP Eindhoven, The Netherlands
6
Eindhoven Institute for Renewable Energy Systems, Eindhoven University of Technology, 5600 MB Eindhoven, The Netherlands
*
Author to whom correspondence should be addressed.
These authors contributed equally to this work.
Plasma 2024, 7(3), 566-584; https://doi.org/10.3390/plasma7030030
Submission received: 29 March 2024 / Revised: 5 July 2024 / Accepted: 9 July 2024 / Published: 24 July 2024

Abstract

:
Electrodeless Low-Frequency (LF)/Radio-Frequency (RF) plasma sources often suffer from low power coupling efficiencies due to the lack of overlapping field with the dynamic plasma load. However, the power supplies for these plasma sources typically have very high power efficiencies (>90%) and are more cost-effective compared to microwave sources. If the coupling efficiency to the plasma can be increased, these plasma sources offer a competitive technology for the sustainable electrification of the chemical industry. This work experimentally investigates five power coupling methods, applied to toroidal CO2 plasmas in a quartz vessel. The research was based on similar ferrite coupling as used in energy-efficient plasma lamps. The higher resistance of the CO2 plasma decreased the power coupling from 90% (for mercury-vapor plasma) to 66% at 1 mbar. High coupling efficiencies in LF/RF powered discharges can be achieved in two manners: either the inductance of the transformer cores can be increased, or the electromagnetic wave frequency can be increased. Furthermore, additional ferrite cores in parallel with the primary coils can be used to increase the impedance transformation. An experiment with six ferrite cores with a single primary winding in parallel, at a frequency of about 10 MHz and a power of 1 kW, showed that this frequency has a detrimental effect on the magnetic permeability and the losses in the ferrite result in a decrease of coupling to 33% at 1.5 mbar. At a frequency of 66 kHz with a nanocrystalline soft magnetic material core, a coupling of 89% was achieved in 1.5 mbar plasma for a power of 3.1 kW. This configuration exhibits decreasing coupling efficiencies at higher pressures since the plasma impedance increases, which again limits the coupling of the transformer due to a lack of inductance. The investigation of alternative coreless coil plasma configurations resulted in coupling efficiencies up to 89% decreasing to 50% at 102 mbar for a toroidal plasma enclosed by toroidally spiraling coils.

1. Introduction

The design and optimization of cheap, efficient, high-density plasma sources are needed for the sustainable electrification of the chemical industry. Since solid-state Low-Frequency (LF) and High-Frequency (HF) power sources have a long lifetime, are very efficient (>90%), and are cheap compared to state-of-the-art solid-state microwave sources [1], we propose the use of LF and HF Radio-Frequency (RF) plasma sources for chemistry applications. Additionally, RF source power per unit (i.e., transistor pallet) increases with decreasing frequency [2]. In general, in microwave plasmas, the power coupling is very high if the impedance of the plasma is matched and there are no power leakages. However, in LF/HF plasmas, a full matching does not mean full power coupling since there is incomplete field overlap with the generated plasma. The aim of this paper is to assess transformer-like coupling methods as possible approaches for efficient LF/HF plasma production.
In 2013, Godyak et al. published a review article about ferromagnetic-enhanced inductive plasma sources [3]. The conventional Inductive Coupled Plasma (ICP) antenna coil requires a resonant-matching network and leads to relatively high power losses. This diminishes the ICP power transfer efficiency and prevents ICP operation at low plasma density. In addition, the leakage induction makes the traditional linear ICP very inefficient. In this paper, five approaches are explored to increase the power coupling of inductive plasma by mitigating leakage induction, minimizing the coil and matching network losses. This is performed using coupling configurations involving a plasma toroid that is transformer-like (as in efficient plasma lamps) or that employs a coil around the plasma to induce a poloidal or toroidal plasma current.
To improve the coupling efficiency of a linear ICP, the ratio of the plasma radius to the coil winding radius should approach unity to maximize the flux overlap of winding and plasma. This can be achieved by scaling up. An increase in the plasma diameter must be compensated by a decrease in the operating frequency and an increase in the power level. From Boulos et al. [4], we can derive that in a practical situation, with a conventional linear ICP and a thick cooled coil, coupling efficiencies are limited to a maximum of 30% above 0.3 mbar (e.g., with the layout of Rauner et al. [5]). This can be explained by the fact that the thickness of the hollow coil wire limits the ratio of the radius of the plasma to the radius of the coil. Higher frequencies will lead to better coupling efficiencies as the skin depth reduces and the majority of the plasma current is closer to the coil and is, hence, driven by higher electric fields.
For commercially relevant sustainable chemistry, efficient reactors at high throughputs (10 s of SLM) and, thus, higher pressures (10 s to >100 s of mbars) are desirable. Therefore, the focus of this research is to create inductive plasmas at higher pressures with high power coupling efficiencies. The following methods are investigated to sustain a toroidal plasma in a quartz torus.
Transformer coupling, employing ferrites and iron-like cores, is also used in fusion tokamaks where the largest toroidal plasma to date is inductively ignited and sustained [6]. In Godjak et al., there is also an implementation for a transformer plasma source mentioned and used as a chemical reactor [7]. Couplings with helical–poloidal coil configurations are also used in stellarators [8], and spiral coil configurations are mentioned in [9,10,11]. The novelty of the spiral coil plasma reactor mentioned in this paper is that the plasma torus is fully enclosed by the spiral coils, achieves high coupling efficiency at high pressures, and enables new plasma applications at higher pressures.

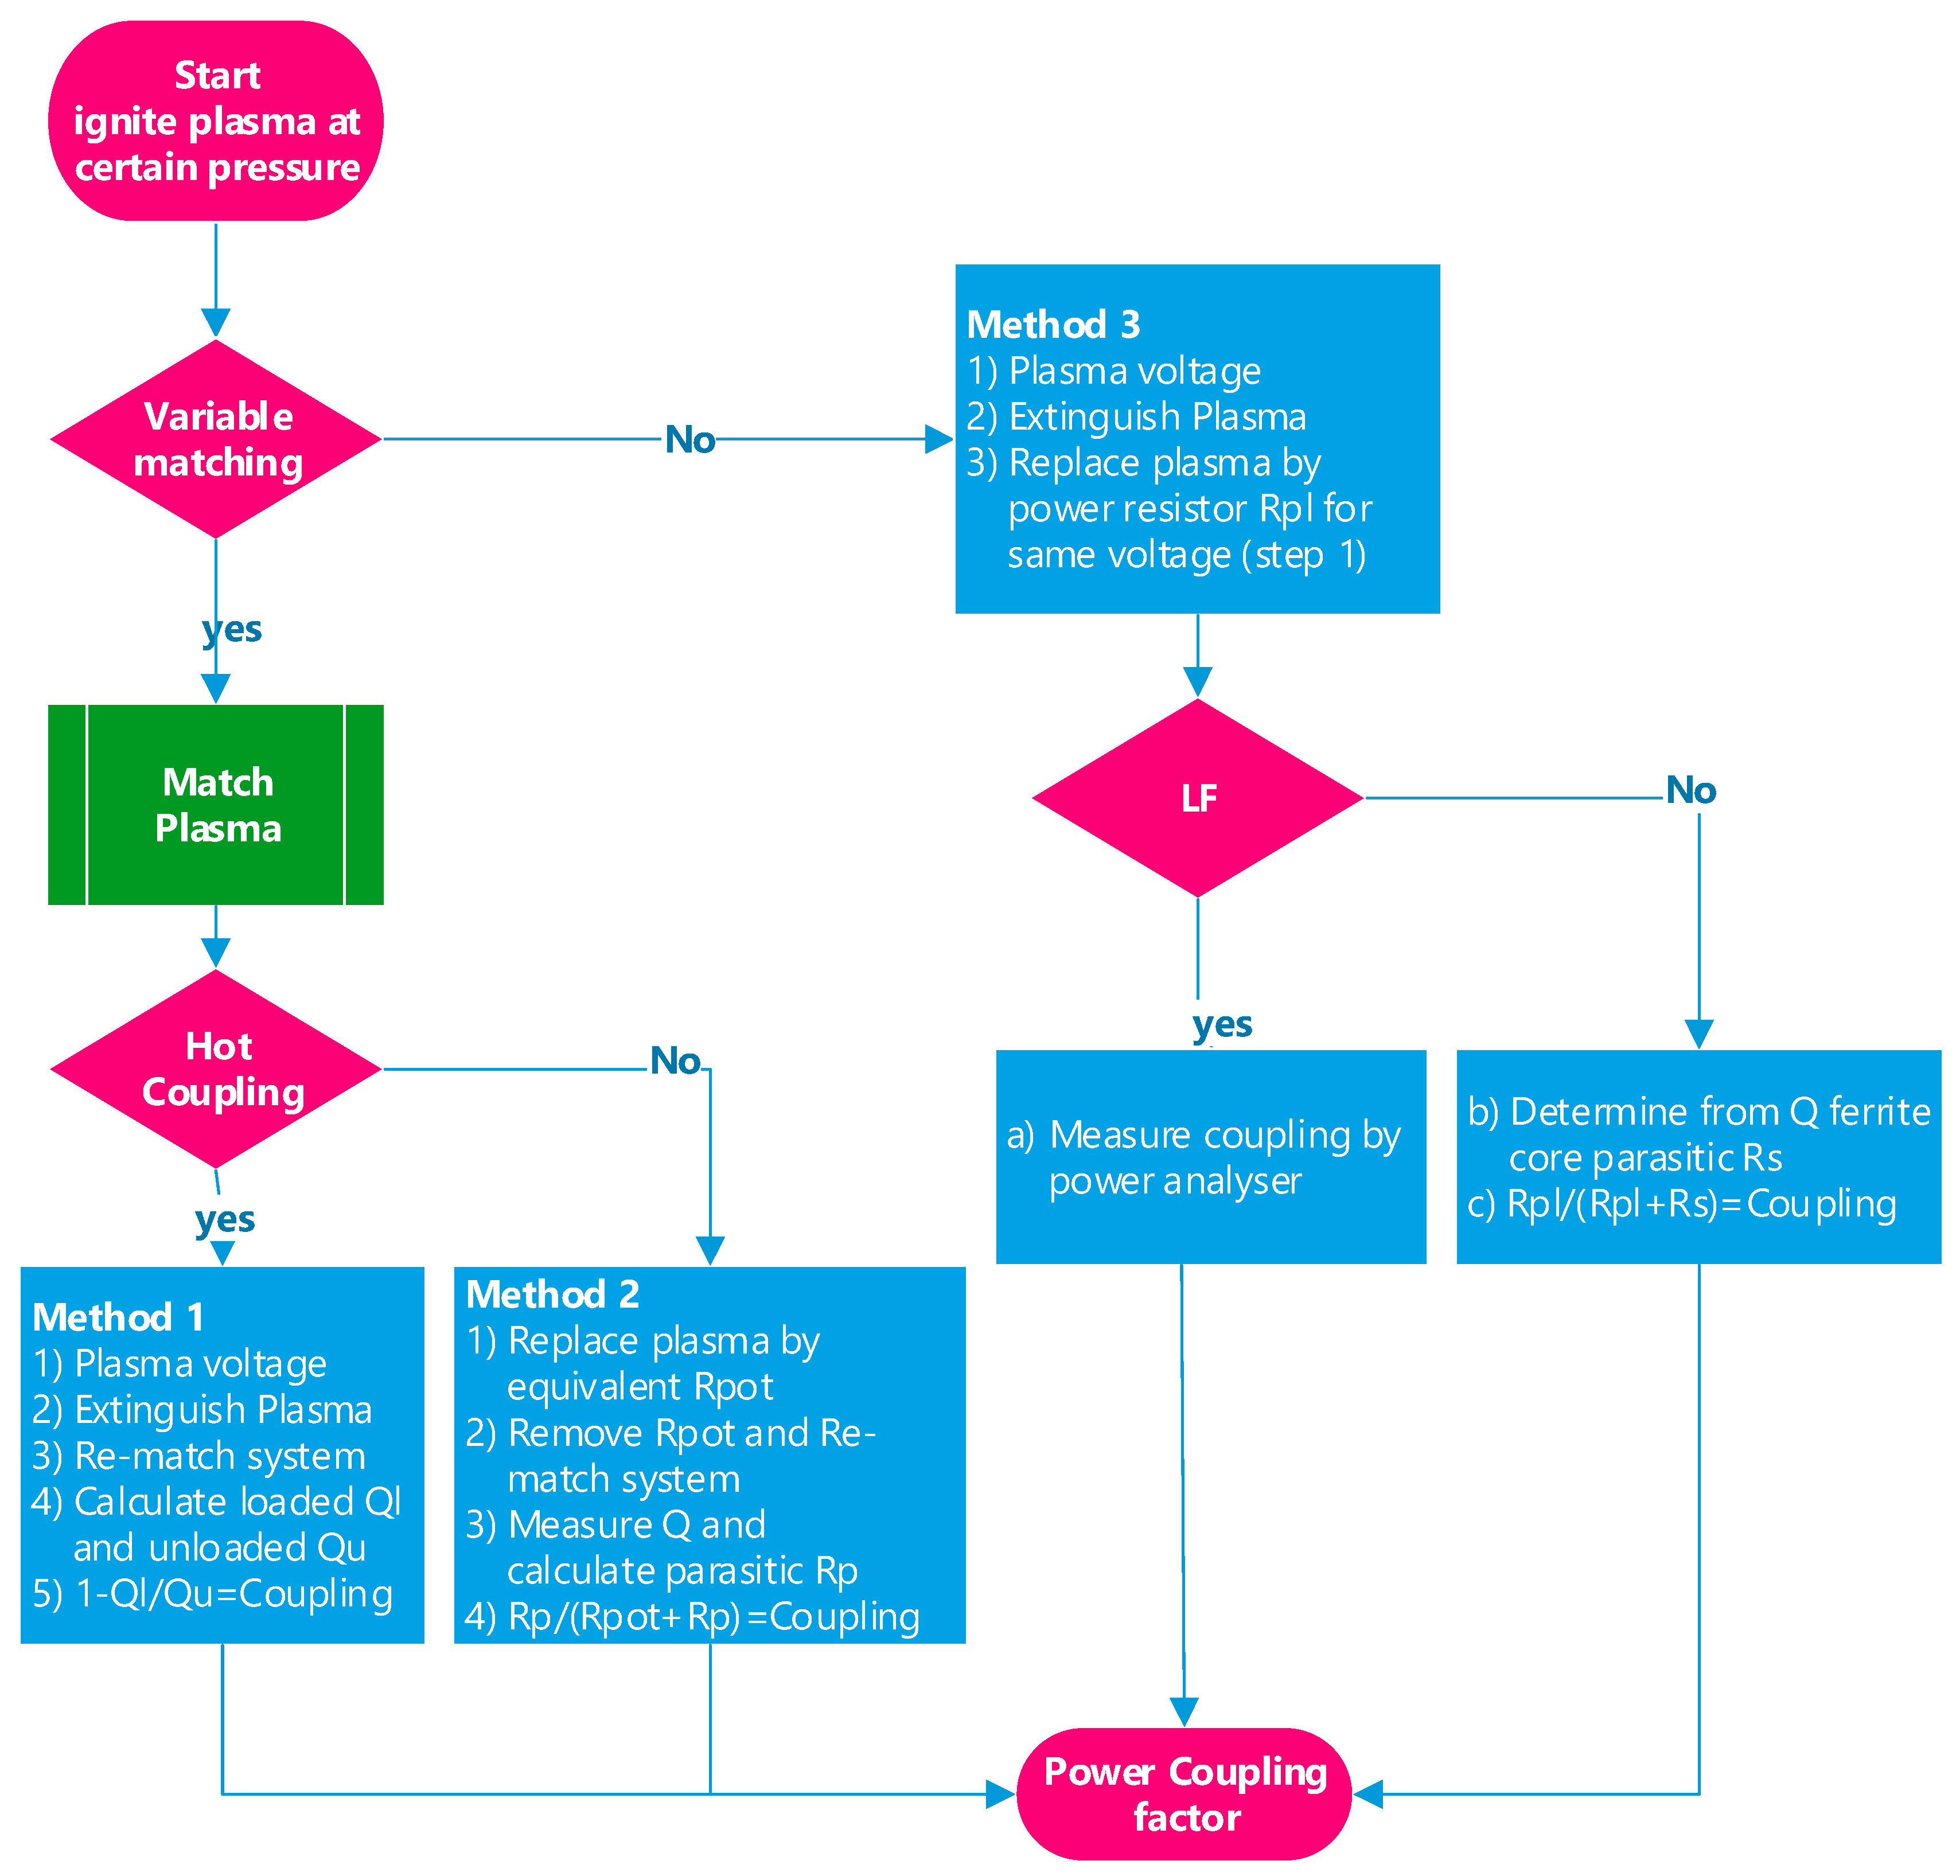
2. Power Coupling Efficiency Recipes

In this paper, four experimental methods are employed to determine the power coupling efficiency, described below. Depending on the parameters of the plasma setup, the most convenient method can be chosen. Method 1 is employed for cases in which the plasma is operated in a “hybrid hot/cold (powered, plasma-activated/low-powered, no plasma)” fashion, and method 2 is employed where the plasma is operated in a “fully powered” fashion. These methods are based on the standard definitions of the Q factor (or Quality Factor). For each method, the reflected power is computed and subtracted such that a coupled “Q factor” can be computed. The unloaded Q factor determines the energy lost by auxiliary inefficiencies such as electromagnetic (EM) radiation to the environment, the heating of the coils, etc. For all the methods below, the starting situation is that the plasma is ignited and the pressure is adjusted to a certain value.
For methods 1 and 2, the matching is first optimized to zero reflection (see Scheme 1, step match plasma).
  • Method 1 is employed to measure the energy transfer in a fully powered (hot), HF plasma:
    • The voltage is measured with plasma inside the inductor (as an alternative to this, a less invasive 50 Ω coupling loop field probe at a certain distance from the coil can be used to determine a voltage proportional to the magnetic field strength for in situ monitoring purposes).
    • The plasma is extinguished by increasing the pressure to 1 bar.
    • After re-tuning to zero reflecting power (if necessary), the voltage over the inductor is measured again (or using the field probe described in point 2).
    • The Q factor ratio is calculated with and without plasma from the ratio of the voltages (or the fields) at the same power.
    • The Q factor ratio determines the loss of energy via radiation to the environment or heating of the coil. One minus this Q factor ratio represents the power absorbed by the plasma.
  • Method 2 was performed in the case of a high frequency (HF) plasma in hybrid hot/cold conditions:
    • Without plasma, an additional resistance is placed parallel to the coil and varied until full matching (zero reflection) is again obtained; this resistance represents the equivalent plasma resistance, Rpot.
    • Now, this resistance is removed and the system is re-matched (still without plasma), and the unloaded Q of this system is measured by measuring the resonant frequency and bandwidth through the reflected power (i.e.,|S11|2) on the vector network analyzer with a bandwidth of −3 dB points of the resonance dip
    • Using the (unloaded) Q, the parasitic parallel resistance, Rp, is determined. If an uncooled coil is used and its temperature changes dramatically during the plasma (e.g., at a glowing condition), then the increase in the parasitic series resistance of the coil can be determined to calculate the loaded Q. In this case, this should be used to recalculate the Rp for a better approximation.
    • The coupling factor is the ratio of loaded equivalent (plasma) resistance (from step 1) over the total resistance (step 1) and parasitic resistance (step 3), i.e., Rp/(Rp + Rpot).
  • Method 3 is used when there is no variable active matching circuit available (see Scheme 1, the path to method 3):
    • The voltage is measured over the plasma by an additional single winding parallel to the plasma in the transformer.
    • The plasma is extinguished (i.e., by increasing the pressure to atmospheric pressure or removing the whole plasma chamber).
    • The plasma is replaced by a low-inductance-variable power resistor that is adjusted until the voltage is the same as that of the plasma (i.e., the plasma impedance) as in step 1.
      If an LF circuit is used,
      • With a two-channel-power analyzer (measuring the complex amplitudes of all voltages and currents) connected to both the primary and secondary side of the transformer, the coupling is measured.
      If an HF circuit is used,
      b.
      The Q factor of the original ferrite transformer core is measured at the right frequency, and this gives the equivalent loss resistance in series, Rs.
      c.
      The loss resistance is compared with the plasma impedance of CO2, where the ratio of the two gives the power coupling.
For methods 1 and 2, if the Q factor in a pressure range is determined, all the steps should be repeated for each pressure independently. These three methods were applied in the following paragraphs (see Scheme 1).

3. Results and Discussion

In this section, we investigate five power coupling methods for toroidal plasma reactors using CO2 gas. The aim of each section is to explore the coupling and the operational pressure range of the different types of plasma reactors.

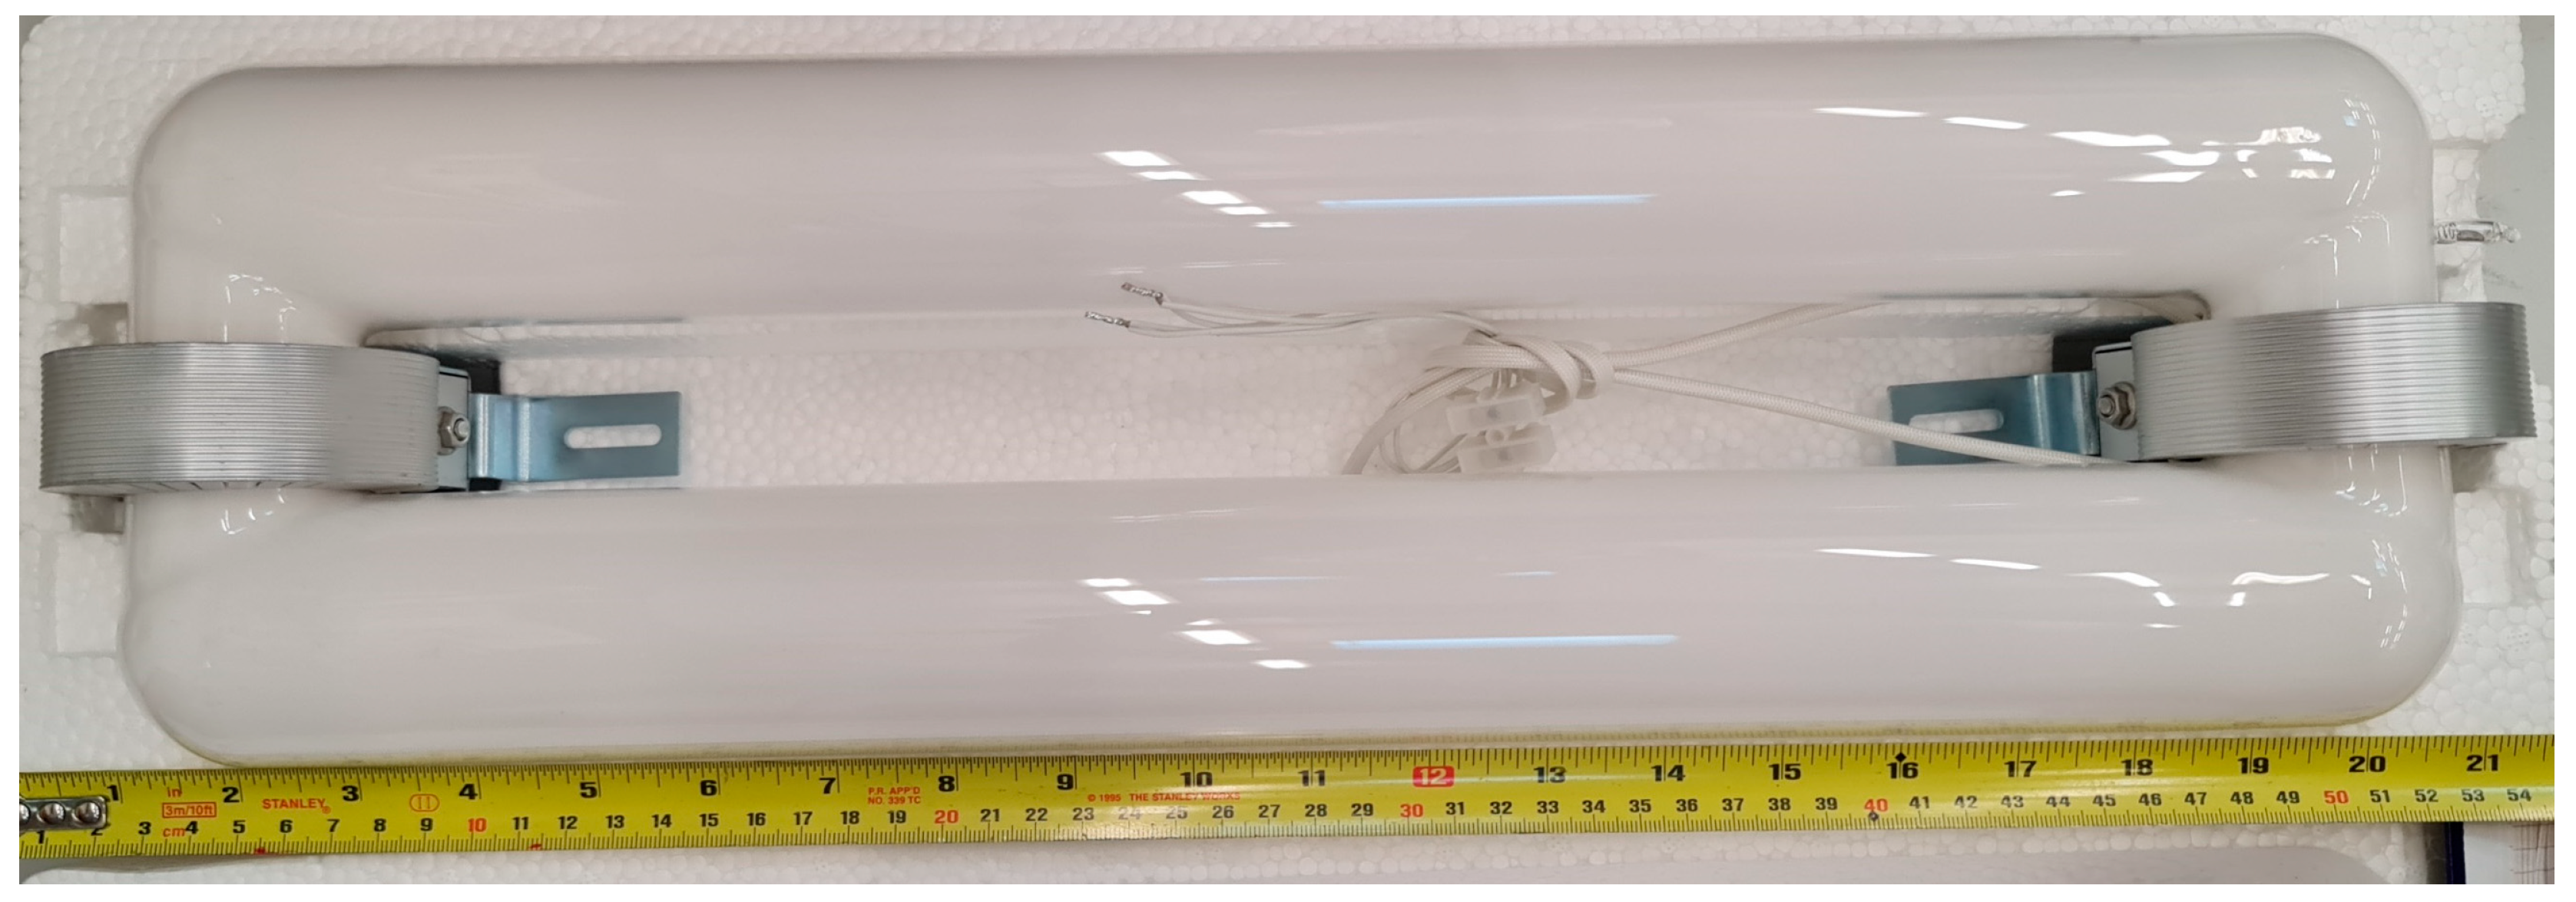
3.1. Fluorescent Plasma Lamp

As a starting point for a concept CO2 plasma reactor, a commercial fluorescent plasma lamp (model 1076, LTTS–LVD300SB, 300 Watts, purchased from Hortilight; see Figure 1) was employed. The original lamp had a nominal power of 300 W (frequency of 226 kHz) and used a glass “racetrack” tube with a diameter of 56 mm and a total length of 1120 mm surrounded by two transformer cores. The idea was to replace the fluorescent plasma “racetrack” with a smaller toroidal plasma loop. For an efficiency comparison, the properties of the original lamp were determined. Electrical measurements revealed that for the 300 W burning plasma lamp (mercury vapor ~3 mbar), its loop voltage was 28 VRMS (11.2 ARMS at 226 kHz) for plasma with a length of 1120 mm. By applying method 3 (see Section 2), from these values, in combination with phase difference measurements, a plasma impedance of 2.03 + 0.75i Ω was determined. The coupling efficiency of this 300 W plasma lamp was determined to be about 90%. During the coupling efficiency measurement, the power meter also measures the primary impedance (of the two coils in parallel). The primary impedance was 162 + 65i Ω. Since the voltage coupling ratio of the plasma lamp is nine (eighteen turns per transformer coil, two coils in parallel), the plasma impedance should be about 2.0 + 0.8i Ω (assuming an ideal transformer). After these tests, this plasma lamp concept was converted into a plasma reactor as described in the following subsection. The fluorescent tube is replaced with a toroidal quartz plasma vessel to allow for the introduction of CO2 gas for plasma chemistry processing.

3.2. CO2 Plasma Torus Reactor with Two Ferrite Transformer Toroid Cores

For the plasma vessel to be placed inside the toroids of the original lamp, it could be decided to use the same size racetrack-shaped tube. However, our goal was to reach CO2 plasmas at significantly higher pressures (>100 mbar). At these pressures, significantly higher power densities are needed than what is used in the original plasma lamp. Therefore, in maintaining the same plasma diameter, the vessel was minimized in size to a donut shape that just fitted to the transformer cores (see Figure 2).
Experimentation revealed that CO2 plasma could be obtained at pressures below 1 mbar; see Figure 3 for the setup and Figure 4 for results. Power coupling efficiencies of up to ~66% were determined using method 3; see Section 2.
Following this method for CO2 plasma at a pressure of 0.5 mbar, the plasma impedance was measured to be 13 Ω. Increasing the pressure to 1 mbar increases the plasma impedance to 26 Ω while reducing the coupling efficiency to 60%. The cause for this low coupling efficiency is that the imaginary impedance of the toroids (XL) on the plasma side is too low compared with the CO2 plasma impedance (versus the 2 Ω of the original lamp). The final goal is to obtain pressures of 100 s of mbars where impedances are expected in the order of kΩs. This demonstrates that an adjustable impedance matching is needed.
Several other ferrite configurations were tested at higher frequencies, but we never obtained the desired XL/R ratio of above 0.5, which is the general condition—as also concluded from Figure 4—in which the toroids can work as an ideal transformer with a loss of <90%. If the inductance of the toroid, L = AL n2, where n is the number of turns, would remain constant, then increasing the frequency would improve this XL/R ratio and solve the current problem. However, this is not the case, because AL decreases with increasing frequency. This is a general property of ferrites apart from the fact that the losses of the toroids will also increase. In the next section, other ferrite cores with high AL values were chosen to be used at higher frequencies in a configuration better adapted to the higher CO2 plasma impedance.

3.3. HF Toroidal Plasma Reactor Employing Six Parallel Ferrite Transformer Cores in CO2

To increase the coupling, a fixed voltage transformation was used by means of the combination of six toroids (ferrite rings FT290\43 from Amidon, Saerbeck, Germany) with one winding in parallel combined with impedance matching in the form of a variable capacitive divider. This creates a resonant circuit fed by a 50 Ω RF source at about 10 MHz. The plasma impedance can be determined by measuring the capacitance values of the matching network, tuned with the ignited plasma.
The ferrite rings (i.e., FT290\43) were characterized using a network analyzer to determine the real and imaginary parts of the impedance at the frequency of about 10 MHz. Since there is a significant part of real impedance present in one turn through the toroid, the losses are expected to be large. These losses can be derived from the matched plasma conditions by considering the impedance of the plasma.
We can calculate the impedance at point ZA (see Figure 5) by applying the following formula:
Z A = i 1 ω C 2 Z 0 Z 0 i 1 ω C 2 i 1 ω C 1 + i ω L p a r
Here, Z0 is the characteristic impedance of the source and C1 and C2 are the matching capacitors that form—together with all the combined coils—a resonant circuit. Lpar represents the total induction of the six toroids in parallel. In the total circuitry, the inductance of each turn is 6 times Lpar.
ZA represents the impedance of the entire reactor while the plasma is present. Since the circuit is fully matched, we can assume that ZA is the complex conjugate of ZA.
ZA was determined as 6.9026 + 3.6068i Ω for the 1.4 mbar plasma at 1 kW. As the circuits are parallel, we convert impedance to admittance (1/ZA = YA), YA = 0.1138 − 0.05946i S. Then,
Ypri + Ysec = YA
where Ypri represents the replacement circuit of the six parallel toroids without plasma. Ysec represents the plasma admittance after the transformation (Yplasma = Ysec/n2) and n = 6 since six ferrite toroids were used (see Figure 5). Since we know YA, we only have to determine Ypri, from which we can determine Ysec. To carry this out this, the impedance of one core Zprimary-1 core is measured with a vector network analyzer, and Zprimary-1 core = 27.2 + 37.6i Ω. The impedance of the six parallel cores (Zprimary) is, therefore, Zprimair-1 core/6 = 4.53 + 6.27i Ω.
In order to transfer the primary impedance into an RL-parallel circuit, we use the admittance 1/Zprimary = Ypri = 0.07578 − 0.10475i S. From Ysec = 0.03802 + 0.04529i S, we obtain Yplasma = 0.001056 + 0.001258i S. Yplasma represents a parallel RC circuit, where
Rplasma = Re(1/Yplasma)
C plasma =   I m Y p l a s m a 2 π f
where Rplasma = 947 Ω and Cplasma = 19.75 pF. From the ratio of the real parts,
Re(Ysec)/Re(Ypri) = η
where η is the power transfer efficiency from the power generator to the plasma. The result is that 33% is transferred to the plasma. The largest part of the remaining power is dissipated in the toroids (minor losses originating from connection wire losses).
Apart from this calculation, we also measured the heating of the toroids over a period of time to estimate the absorbed power. Within half a minute, the toroid increased by 42 °C in temperature, leading to a power loss in all six toroids of about 790 W, which partly came from magnetic losses of the toroids and partly from the heat of the plasma.
From the values of the matching network, a plasma impedance of 947 Ω (1.4 mbar) is derived at an inductance of 3.6 μH, which is formed by toroids in series. The XL/R ratio should be 0.24 now. Reading this from the graph in Figure 4, the coupling efficiency would be about 50%. However, the core losses are in this case higher at a frequency of 10 MHz, giving a coupling efficiency of about 33%. As seen before, increasing the frequency not only decreases the AL value but also increases the relative losses of the ferrite toroids. To assess the degree to which the driving frequency affects the power coupling efficiency, a novel LF-transformer-coupled source was constructed with an extremely high-AL-value transformer core, as outlined in the following subsection.

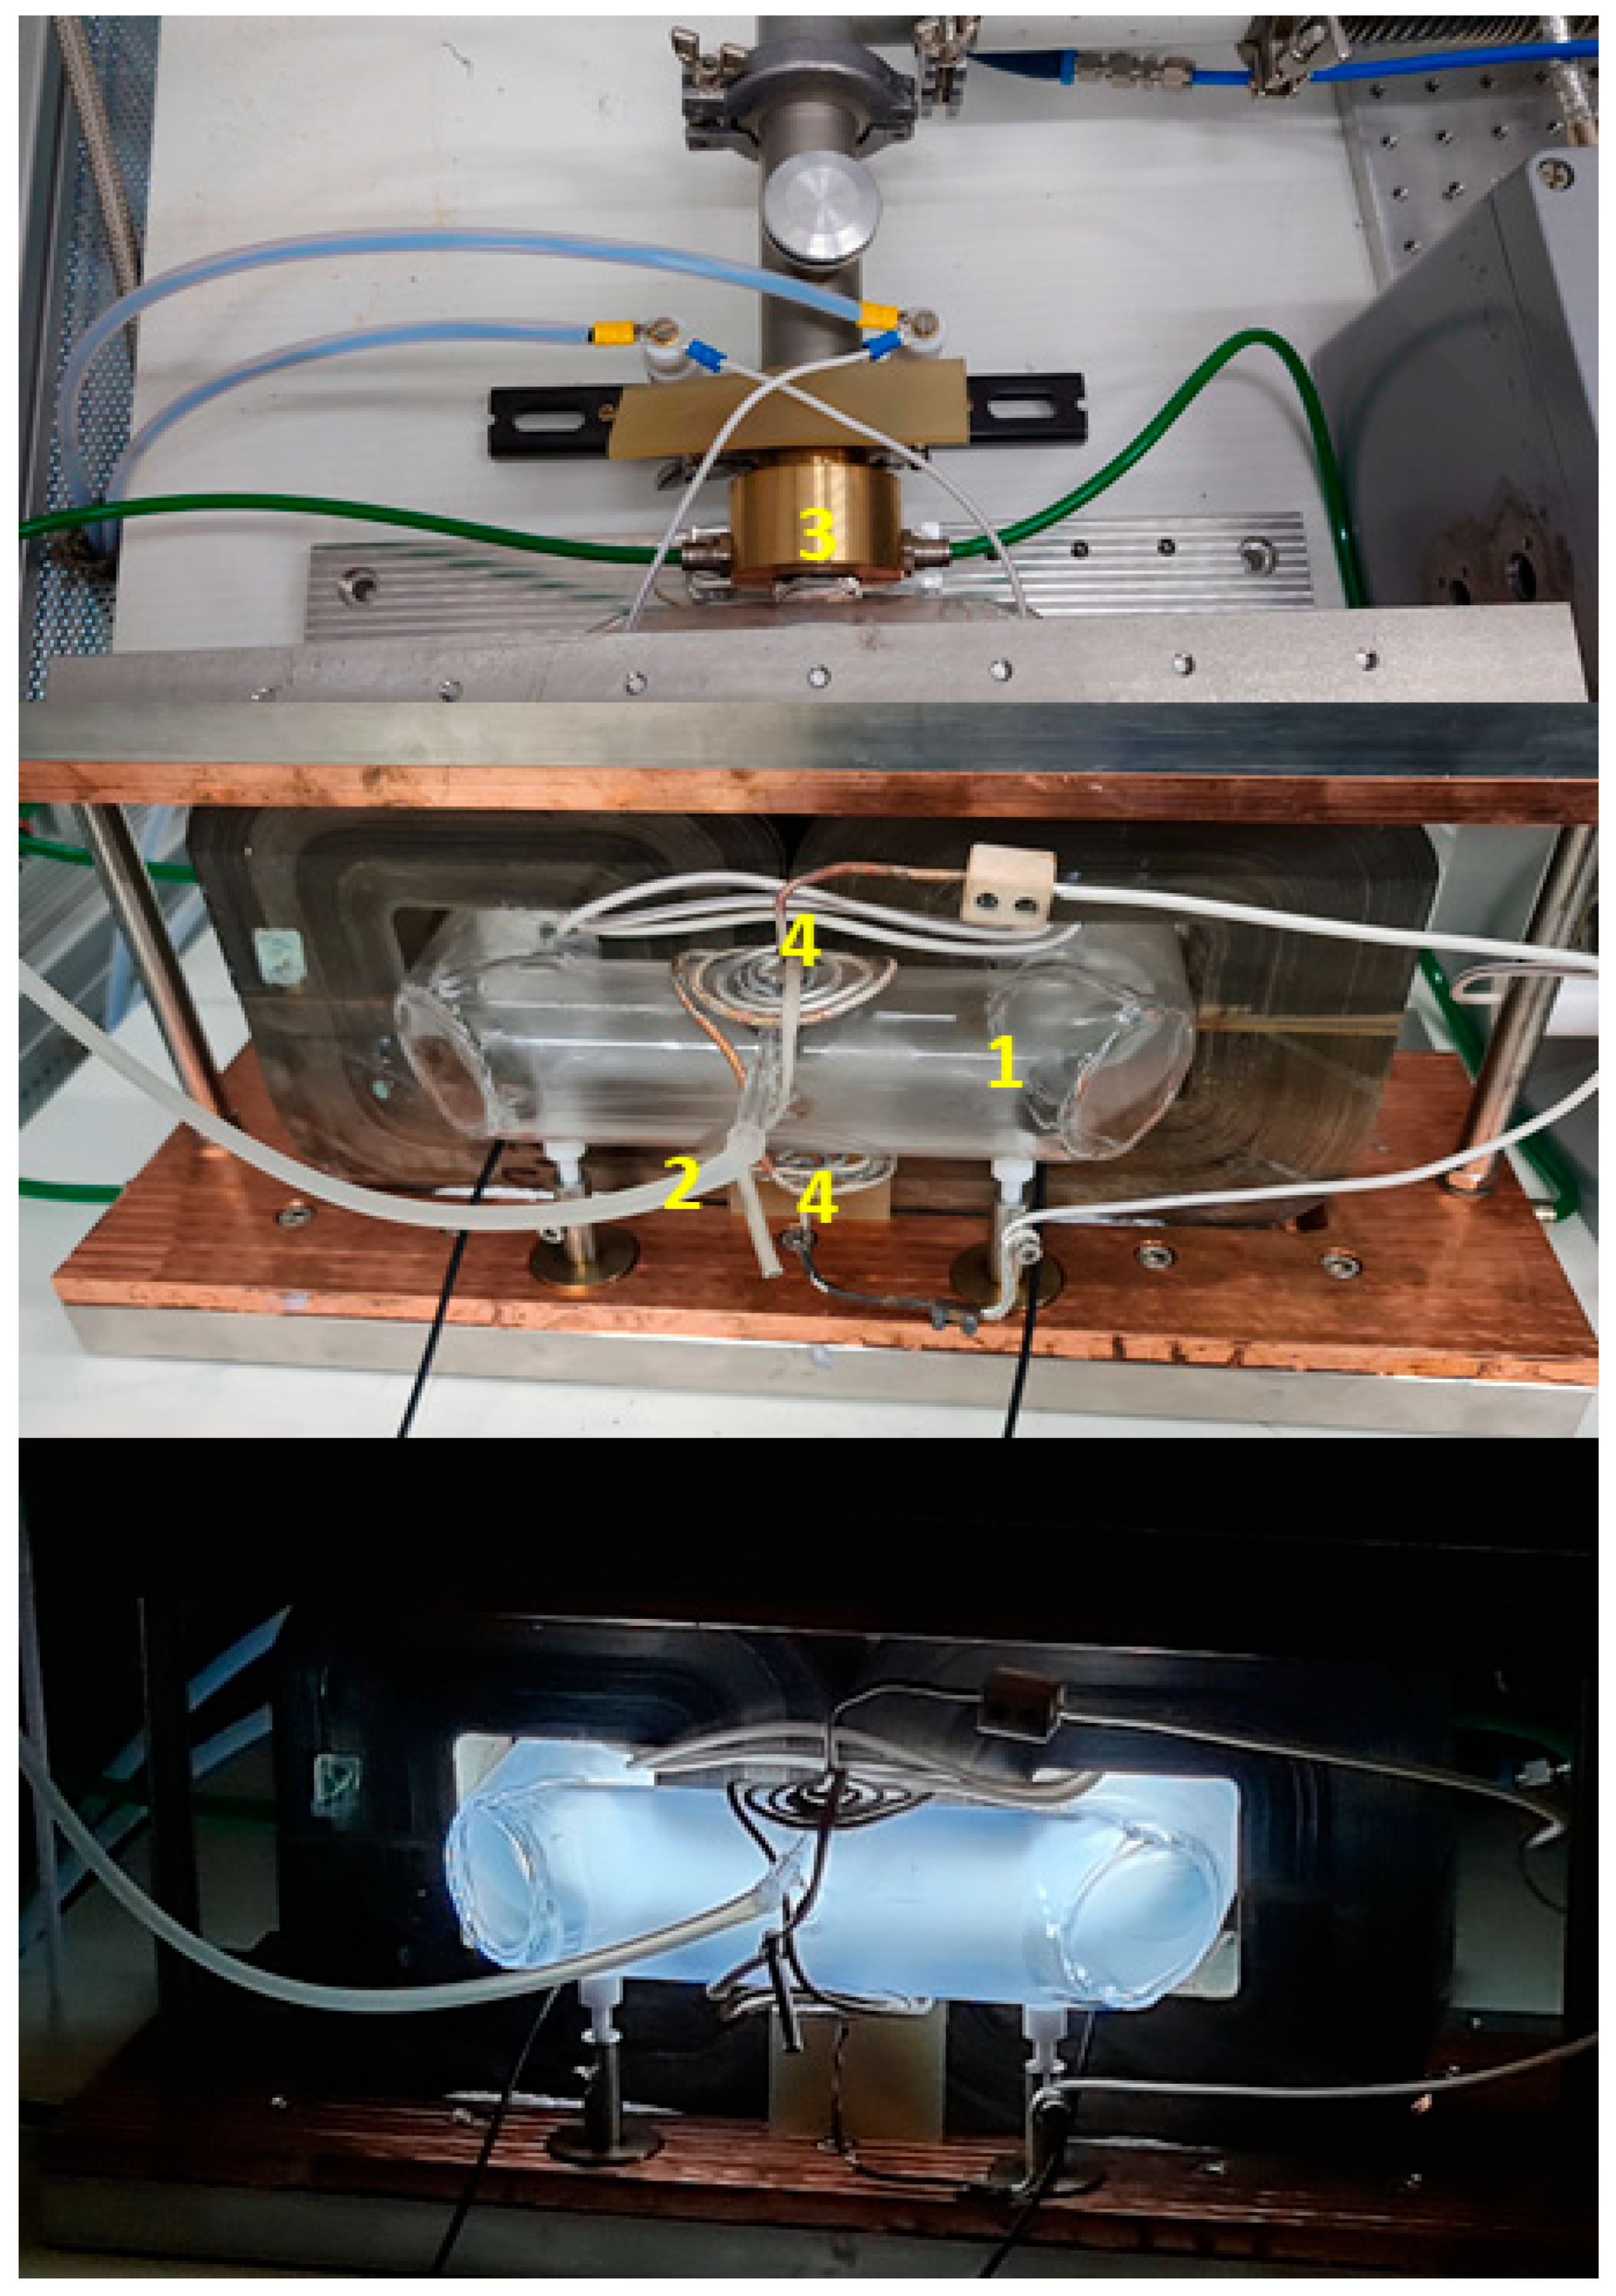
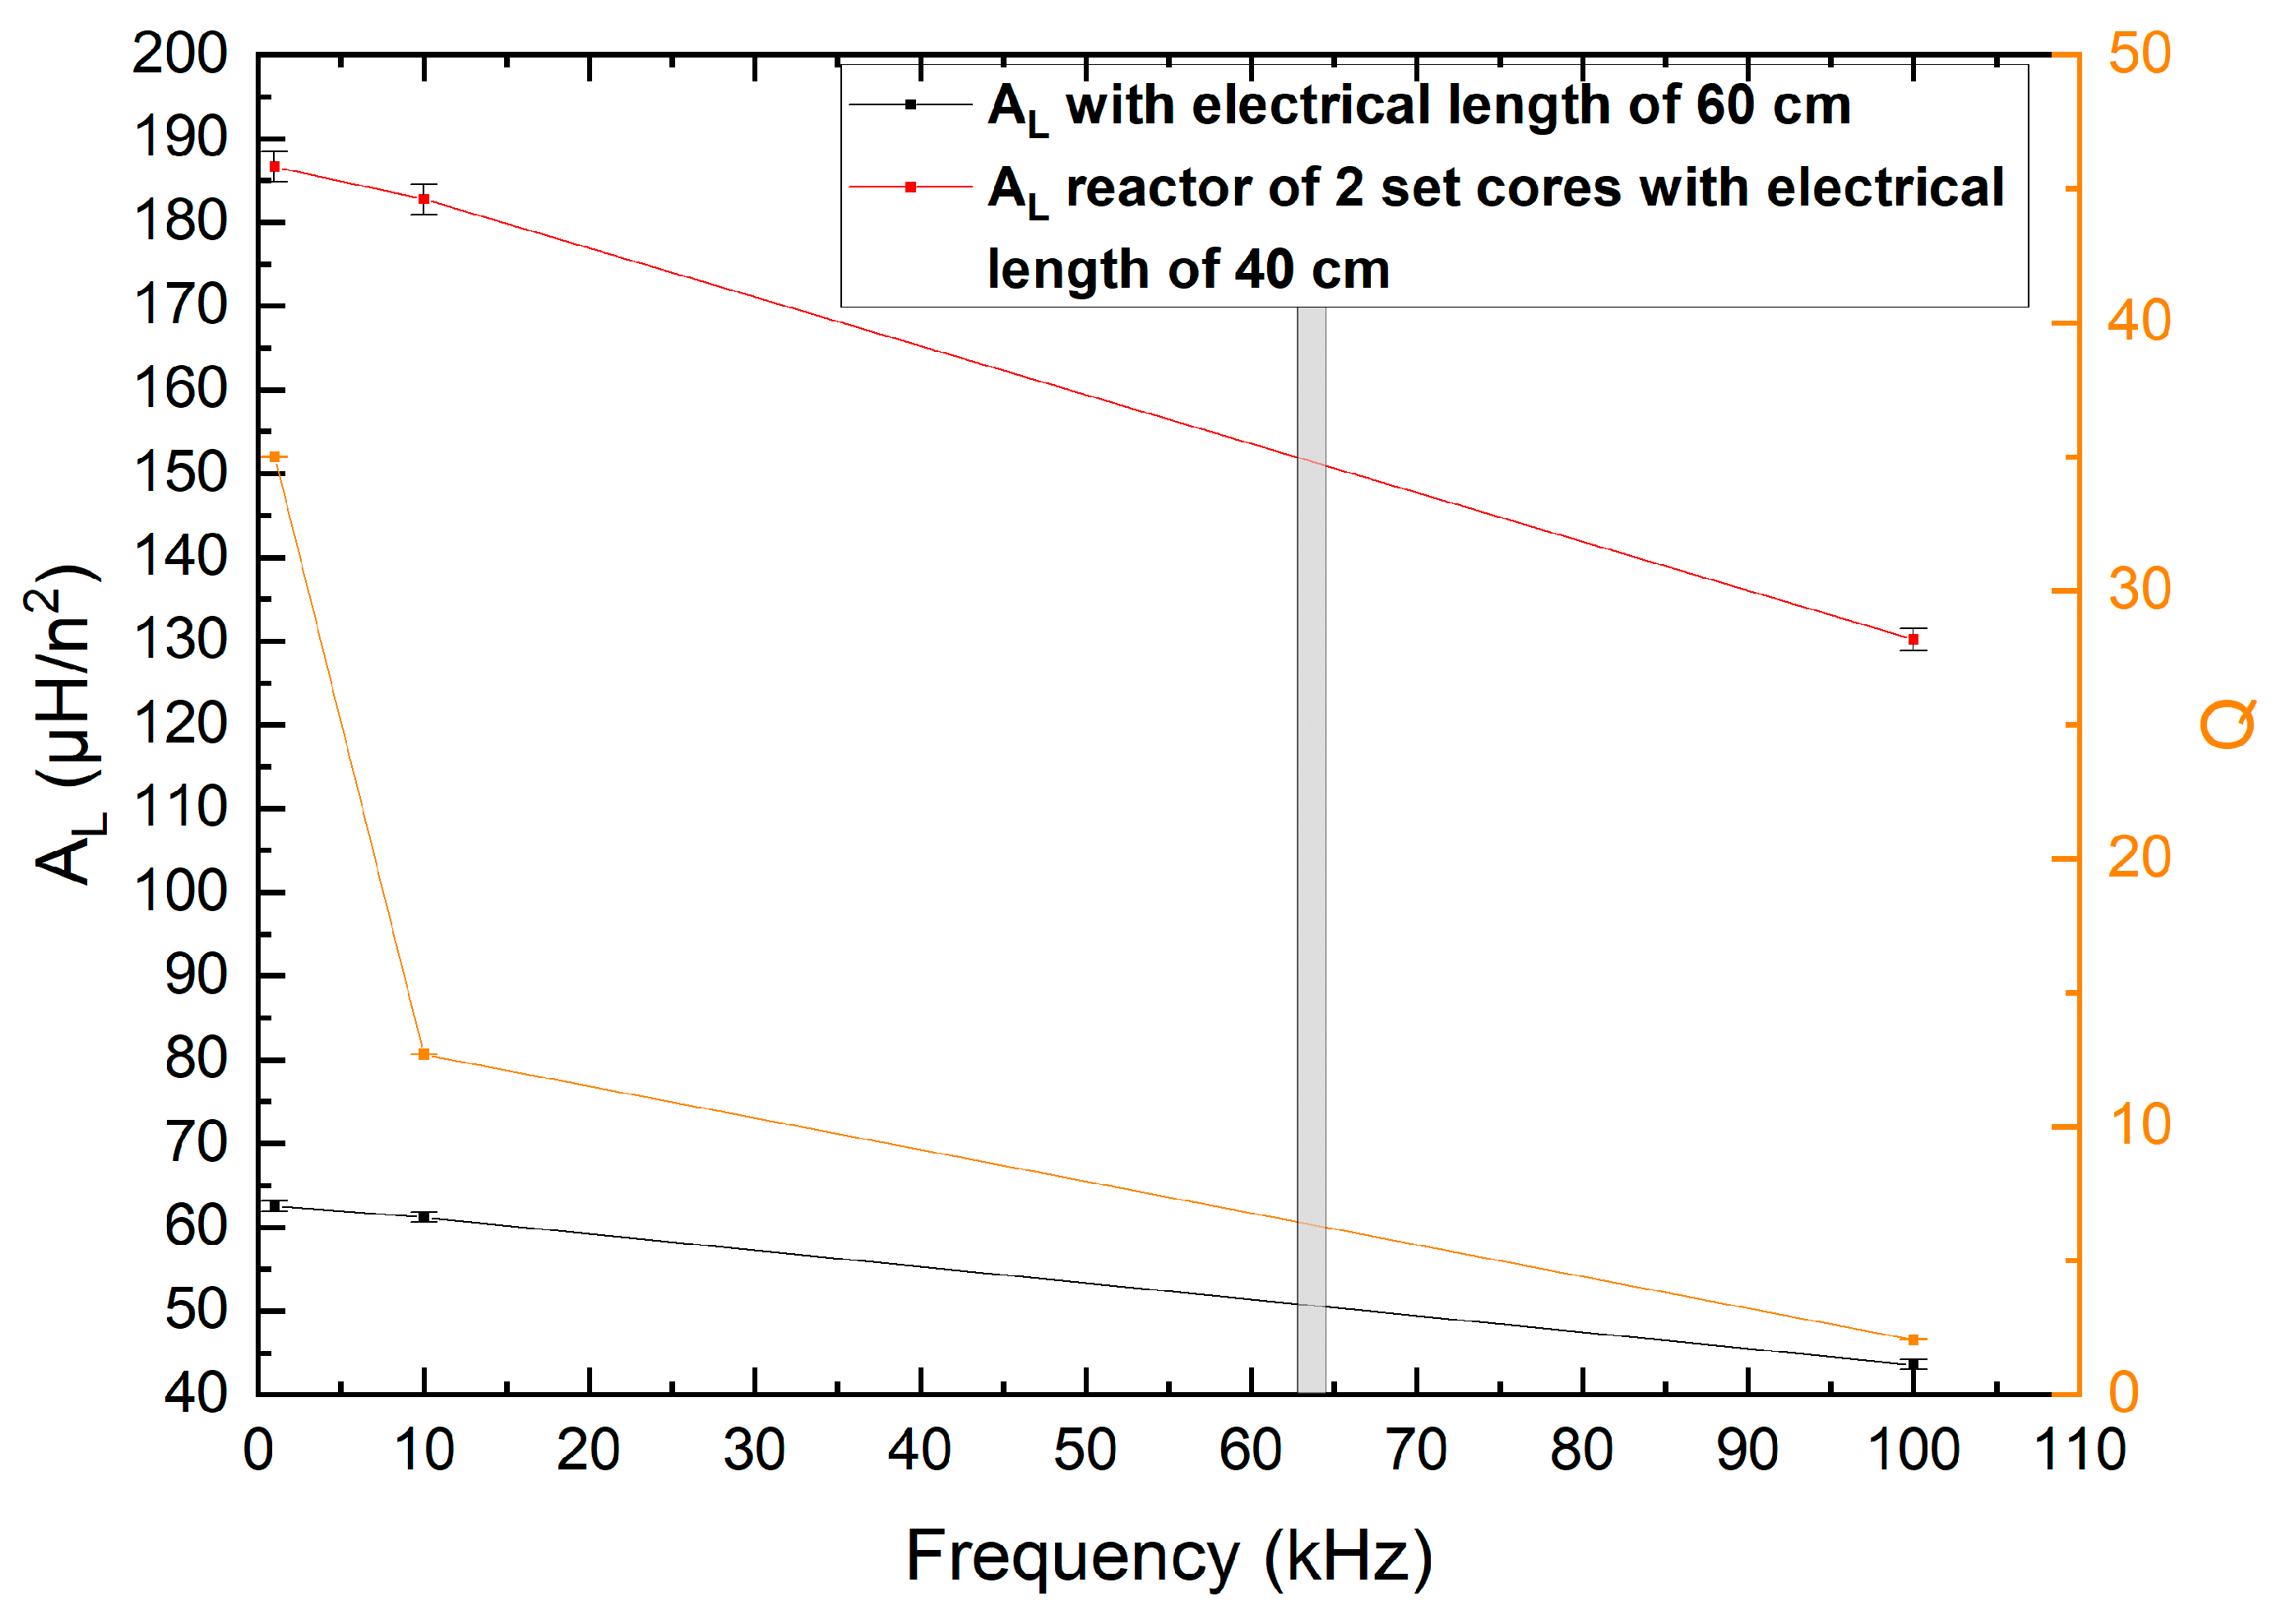
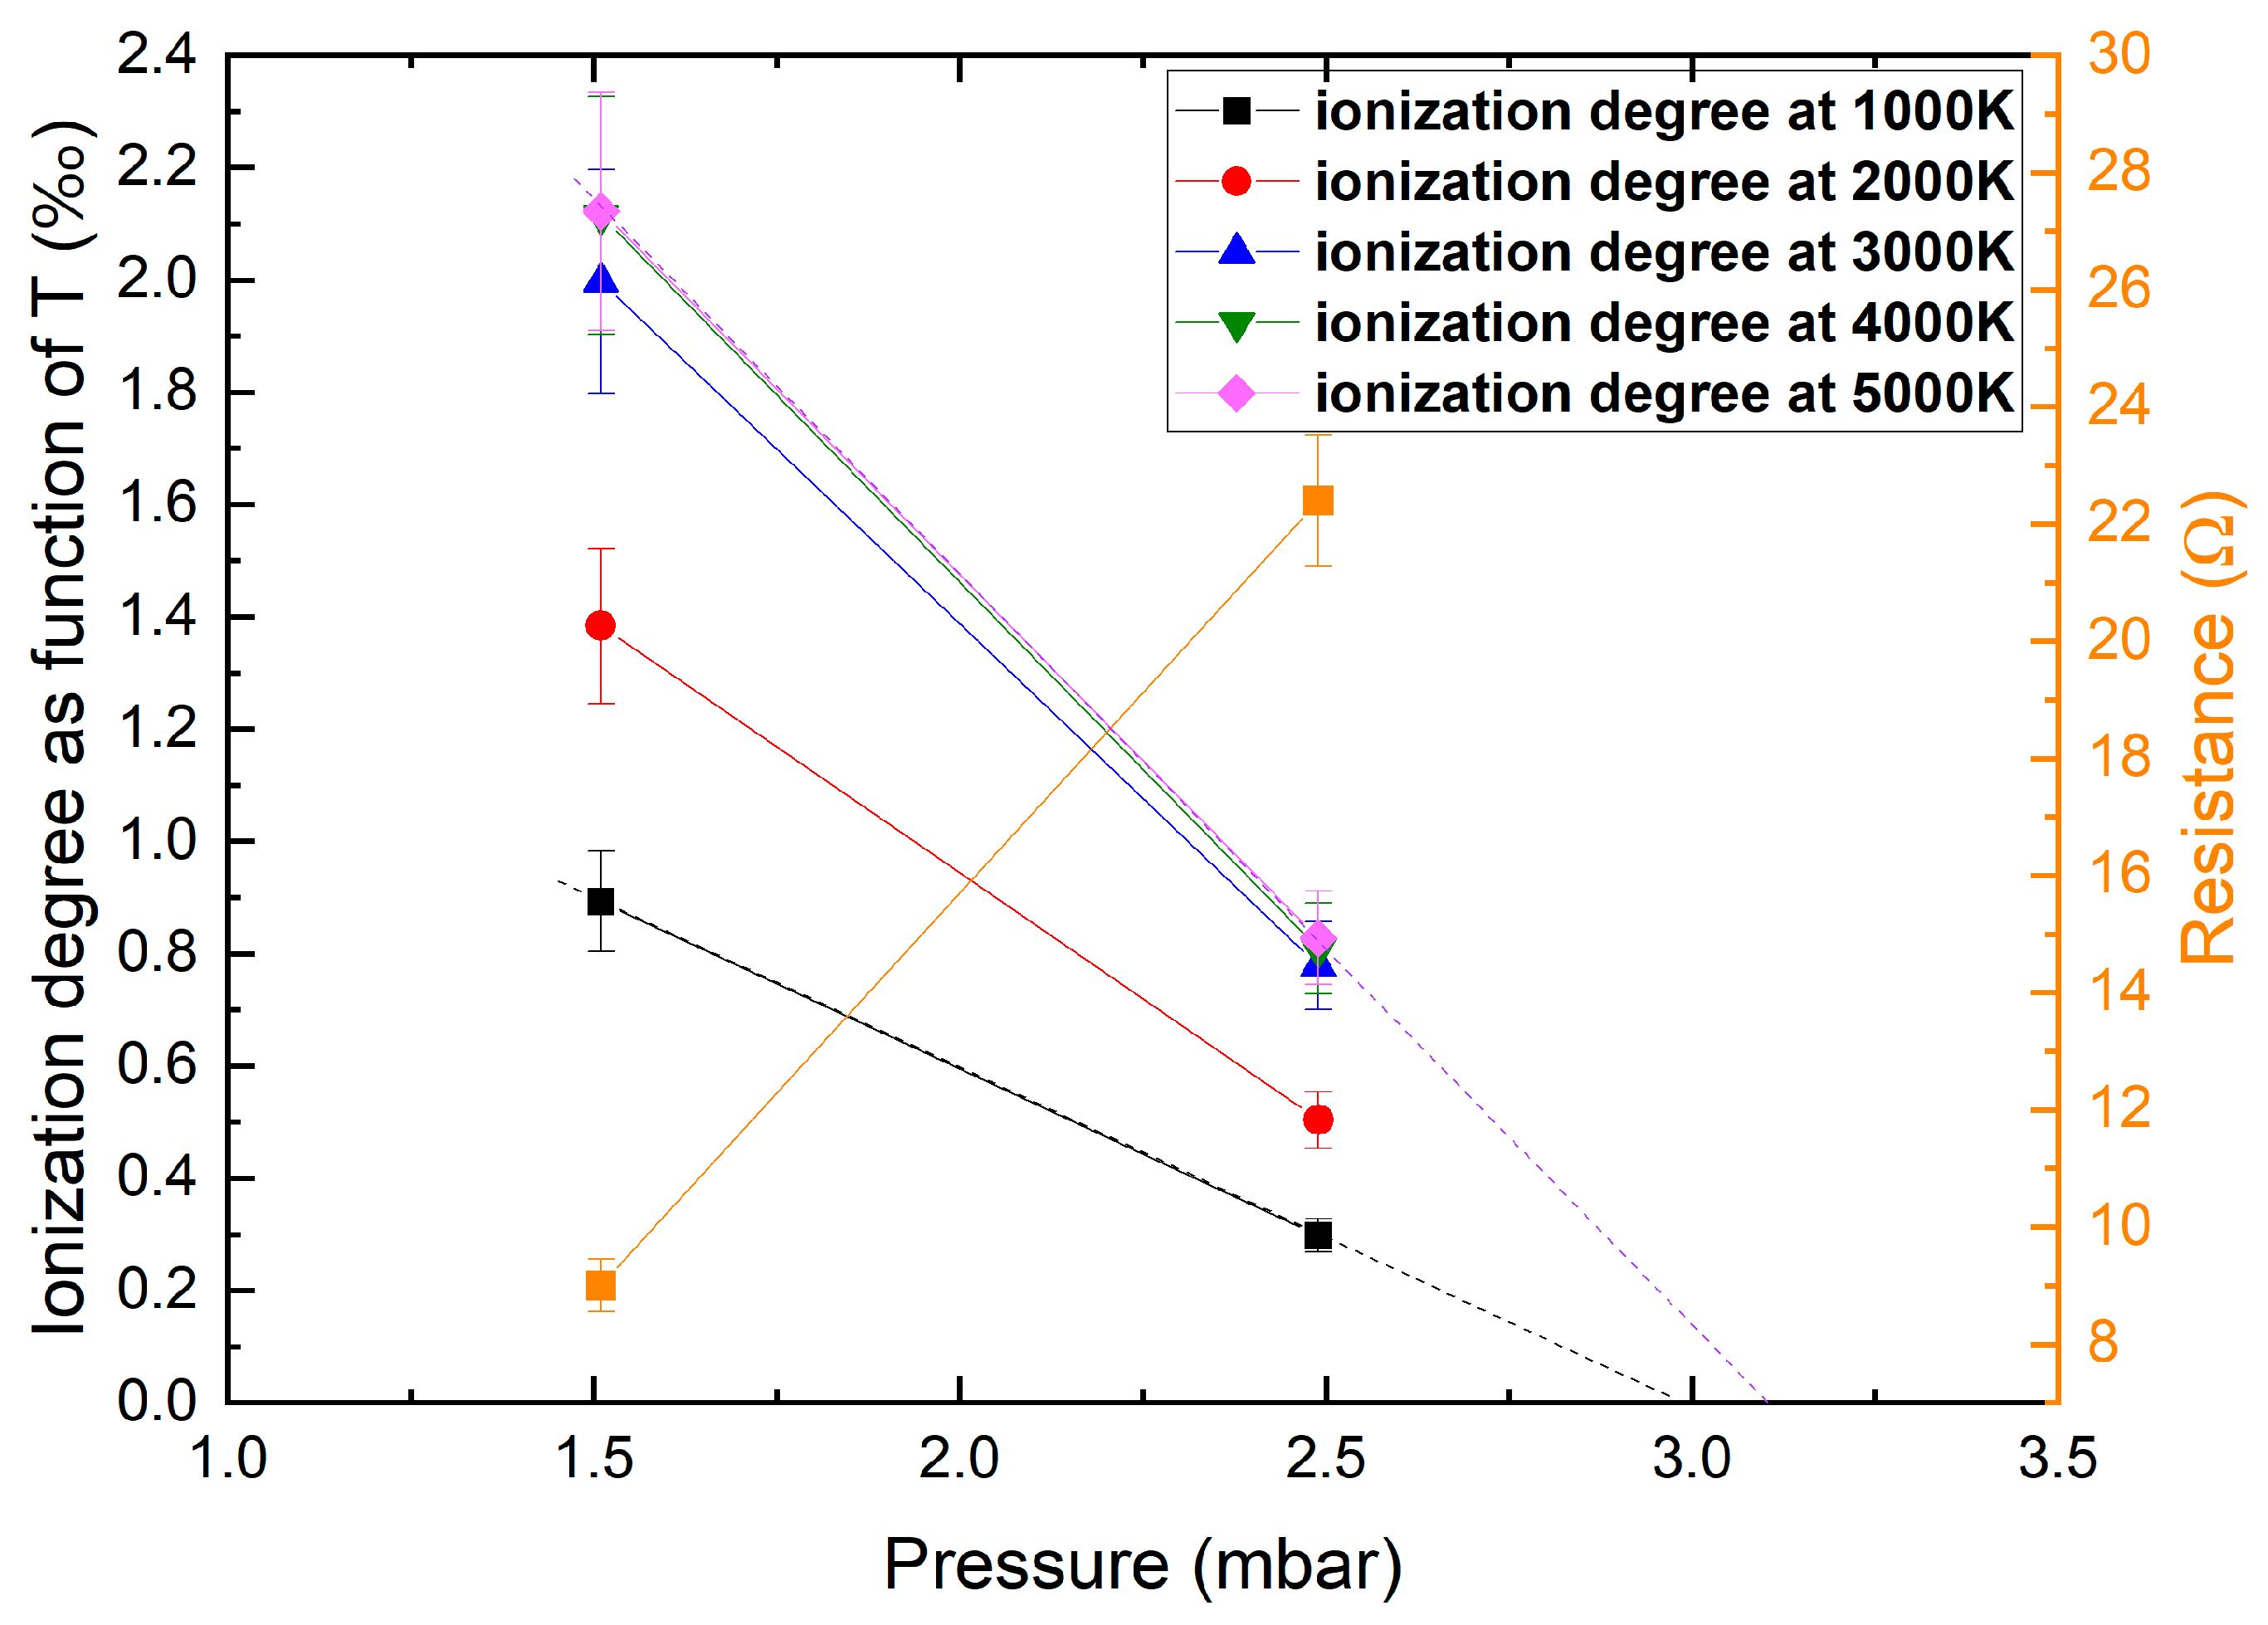
3.4. Low-Frequency Plasma Reactor with High-AL-Value Transformer Cores

The previous subsection used the approach of increasing the XL of the transformer by increasing the frequency. However, in practice, all ferrite materials of toroids/transformers suffer from decreases in magnetic susceptibility with increasing frequency. Hence, we investigate a low-frequency approach employing a material with a very high magnetic susceptibility. We used four new cores with a total combined AL value of 150 μH/n2 (product name FINEMET F1AH1269U—core materials from Hitachi Europe, Düsseldorf, Germany) at 3 kW power and about 64 kHz power for the plasma source.
The power source consisted of an LF inductive heater (Vevor, HT-15A, range of 3–15 kW, 30–100 kHz) including a ferrite transformer (outside dimensions: 10.3 × 9.2 cm2, leg dimension: 3 × 2.8 cm2) with one water-cooled primary loop coil. The output circuit of the power source, formed by a secondary coil (with 55 windings), feeds the LF plasma reactor (see Figure 6 and Figure 7), with three primary windings and one plasma winding confined in the vessel, as the secondary coil. The properties of the yoke of the plasma transformer are shown in Figure 8.
The original dimensions of the cores were modified (shortened from 77 mm to 27 mm in the leg length of the U core, keeping the surface at 5 × 5 cm2) to increase the induction and AL and to fit the reactor. Imperfections in the electrical connection surfaces between the two cores resulted in the decreasing AL of the total reactor assembly to 70 μH/n2 at 100 kHz.
Following method 3, first the plasma loop voltage was measured with an oscilloscope on a single-loop winding parallel to the plasma. Then, without plasma, a replacement resistor (i.e., method 3, a low-inductance-variable power resistor, represented by Rplasma) was found by combining several power resistors in series, which are connected to the single-loop winding replacing the plasma. A two-channel complex power analyzer (PM3000A, Voltech, Harwell, UK) was connected between the power source and the primary coil of the plasma reactor and was also connected to the one-turn secondary winding. The secondary winding contained a power resistor so that the winding voltage represented the plasma voltage (i.e., U RMS plasma). The power analyzer continuously measures the frequency and both the primary and secondary powers, allowing for the determination of the effective power coupling from the source to the plasma.
To obtain more insight into the plasma parameters, simulations using a combination of PLASIMO [12] and BOLSIG+ [13,14] were performed.
The following experimentally obtained parameters were used for the simulations:
From the experiment, the toroidal plasma length of 456.4 mm was measured at the center of the plasma column, the plasma diameter was 13.33 mm, the source frequency was 66.12 kHz, the plasma resistance is shown below, and the plasma Vrms is shown below (see Table 1).
From the PLASIMO LTE (Local Thermodynamic Equilibrium) CO2 model [15], the molar fractions as a function of temperature and pressure values are derived assuming a plasma temperature of between 1000 and 5000 K. These molar fractions were used as input for BOLSIG+.
The neutral gas number density N is calculated from the assumed temperature, the measured pressure, and the ideal gas law. The voltage, Vrms, over the plasma length gives the electric field strength, E, which is divided by N to give the reduced electric field, E/N.
BOLSIG+/bolsigminus was run with the following inputs: cross-sections from LXCat [16]; for CO2, CO, and O2 [17,18,19,20]; for O [21]; for E/N, angular frequency/N, mole fractions, gas temperature, ionization degree (order of magnitude estimate), and plasma density (N*ionization degree). The initial ionization degree estimate was 1.0 × 10⁻⁵, based on Viegas et al. [22]. The output relevant to this study is the reduced momentum transfer (collision) frequency ν/N.
The ionization degree was determined from the electron (number) densities for a range of temperatures (1000 K to 5000 K); see Figure 9. This electron density range was determined graphically by comparing the measured resistance to the calculated resistance R as a function of both the electron density ne and the collision frequency for momentum transfer ν (the range of ν was found with BOLSIG+ for the temperature range):
R = ρ L A = L σ A
where L is the plasma length, A is the cylindrical area (π r2), ρ is the resistivity, and σ is the conductivity
σ = ω ε 0 η γ 1 + γ 2
where ω = 2πf (f the frequency), ε0 is the permittivity of free space, γ = ν/ω is the normalized collision frequency, and η = ne/nc is the normalized electron density, with nc being the critical electron density, which is 5.42 × 10⁷ m−3 at the frequency f = 66.12 kHz.
At lower pressures, we obtain high coupling factors. The FINEMET cores possess a two times lower AL value because of surface contact mismatch. If this is corrected, a two times higher pressure can be obtained; however, the pressure is still limited to the millibar range since the low power density of the plasma causes a too high plasma impedance compared to the inductance of the transformer. An order of magnitude of power increase is required to reach higher pressures in this configuration. The coupling losses were dissipated by heating the FINEMET material. In the following subsections, attempts were made to reach higher CO2 plasma pressures by omitting the cores and applying special coil configurations to also increase the coupling efficiency.

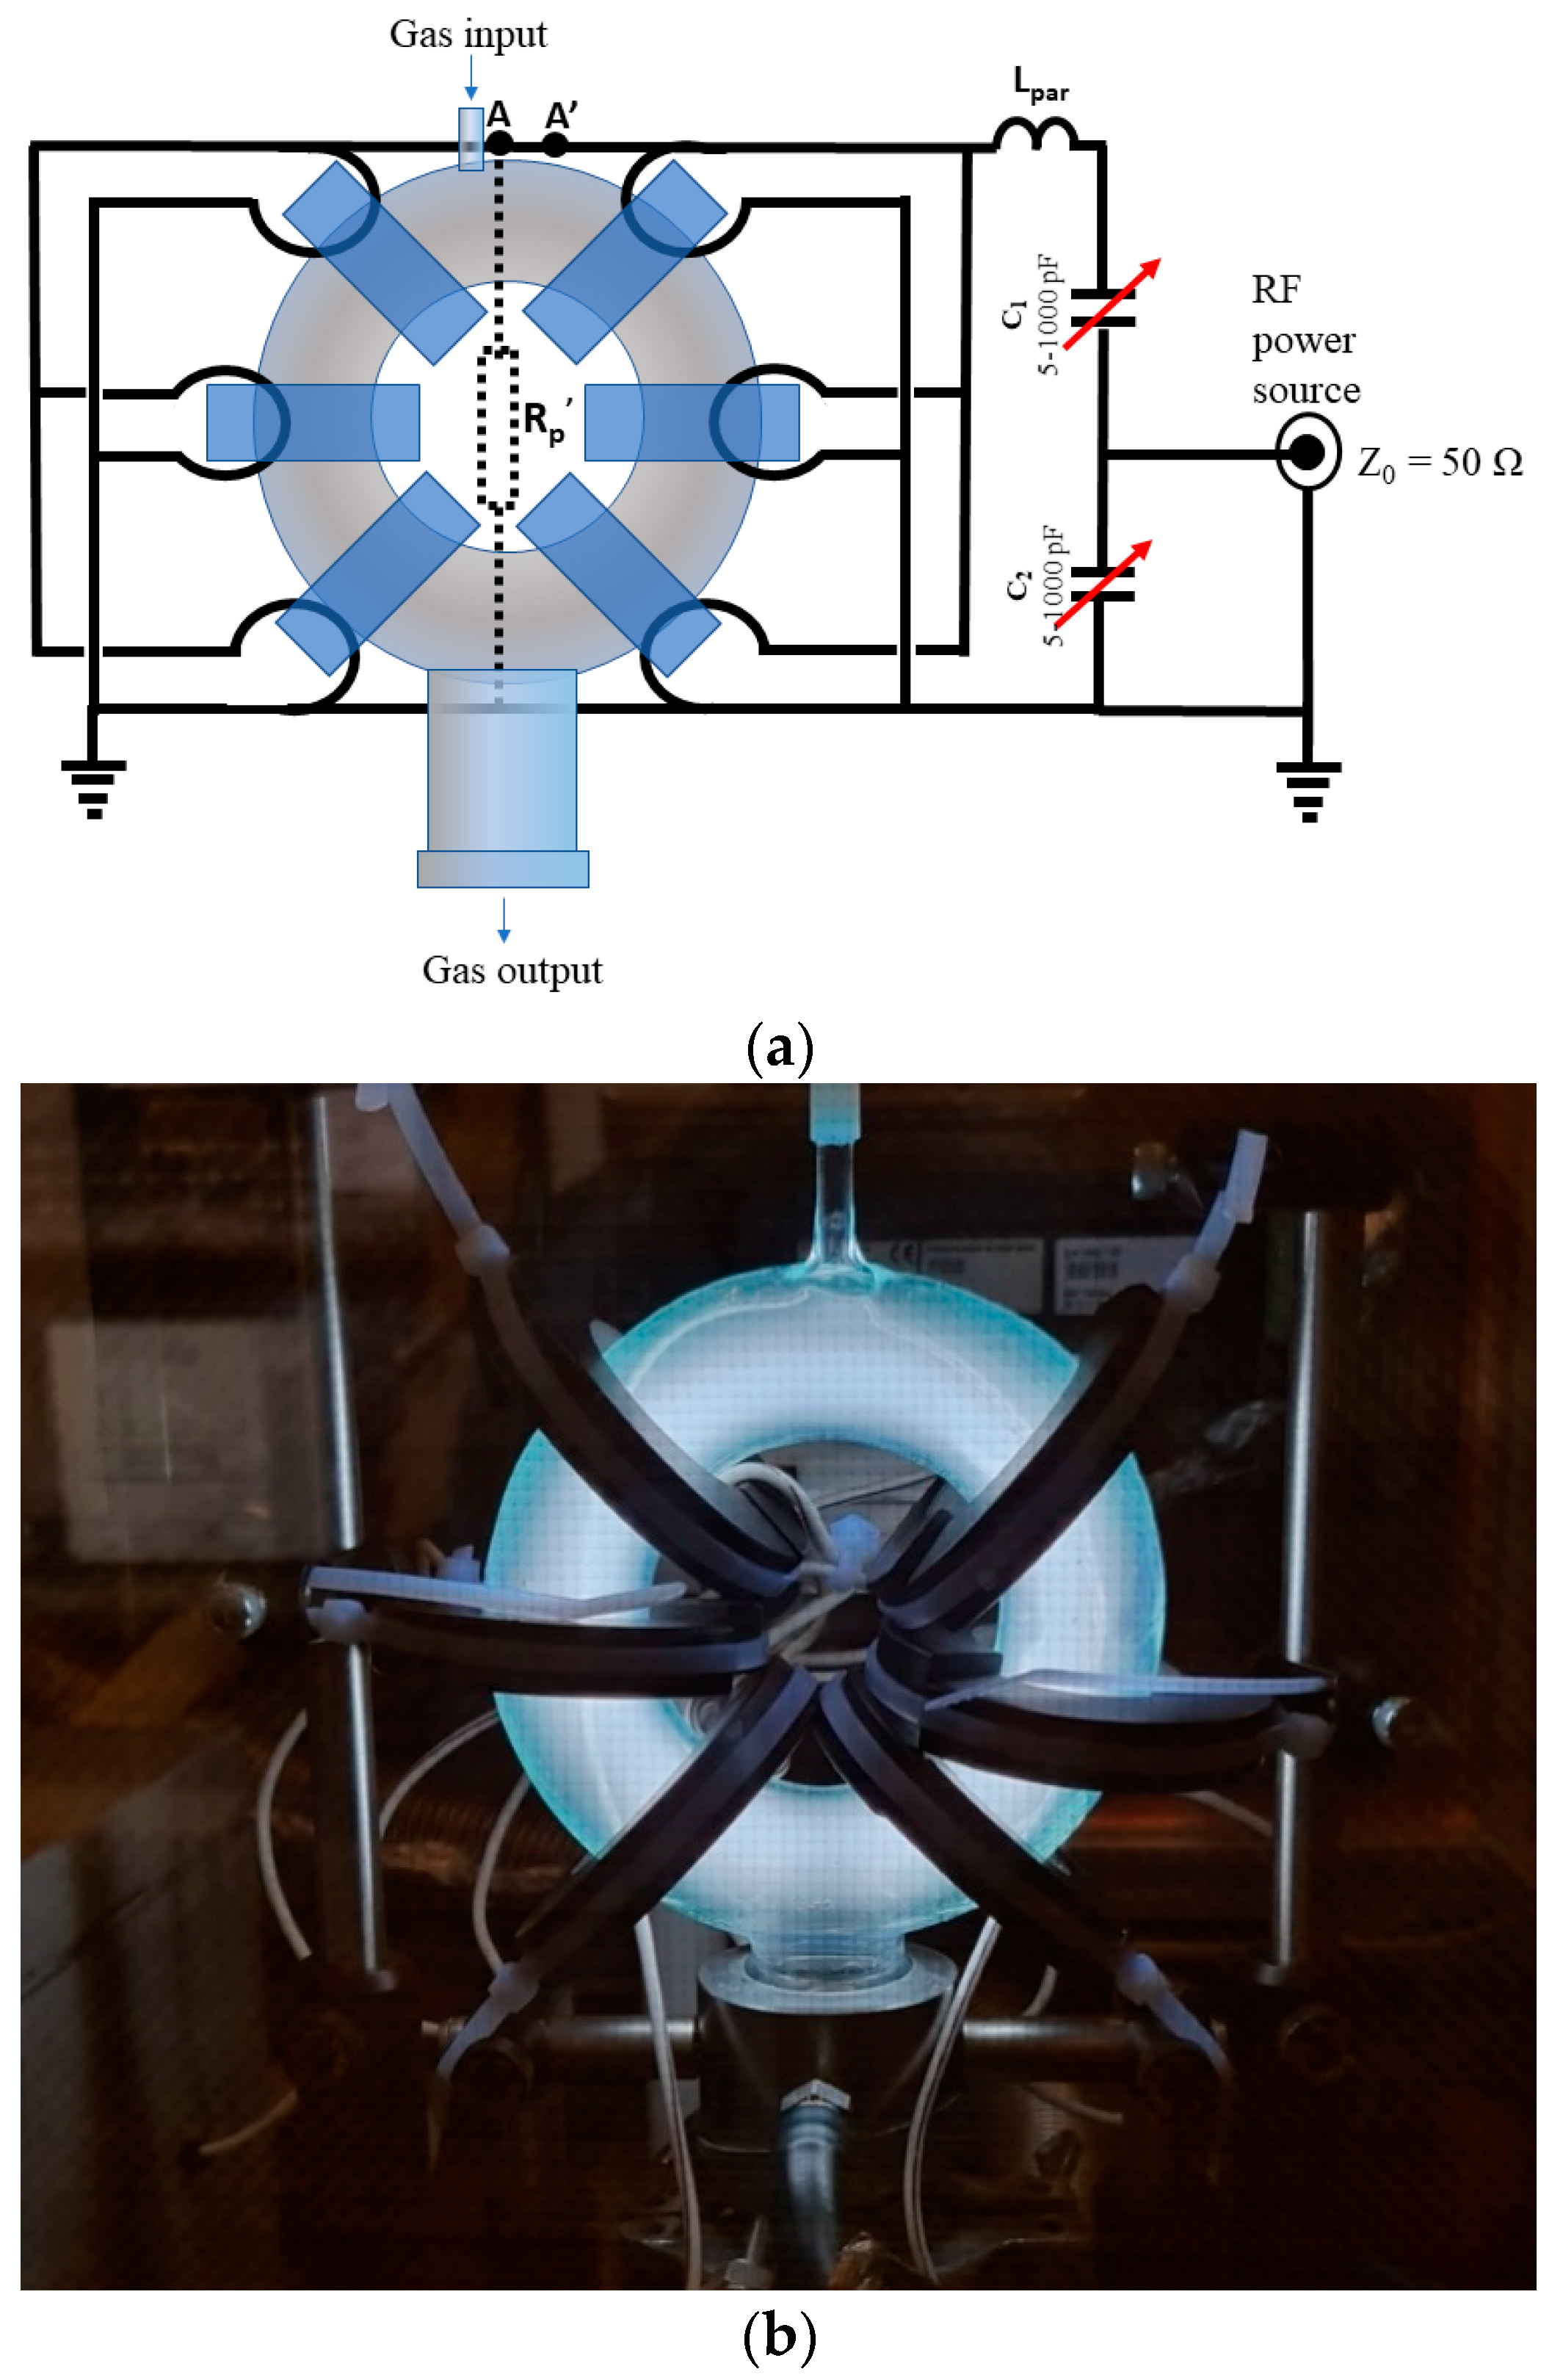
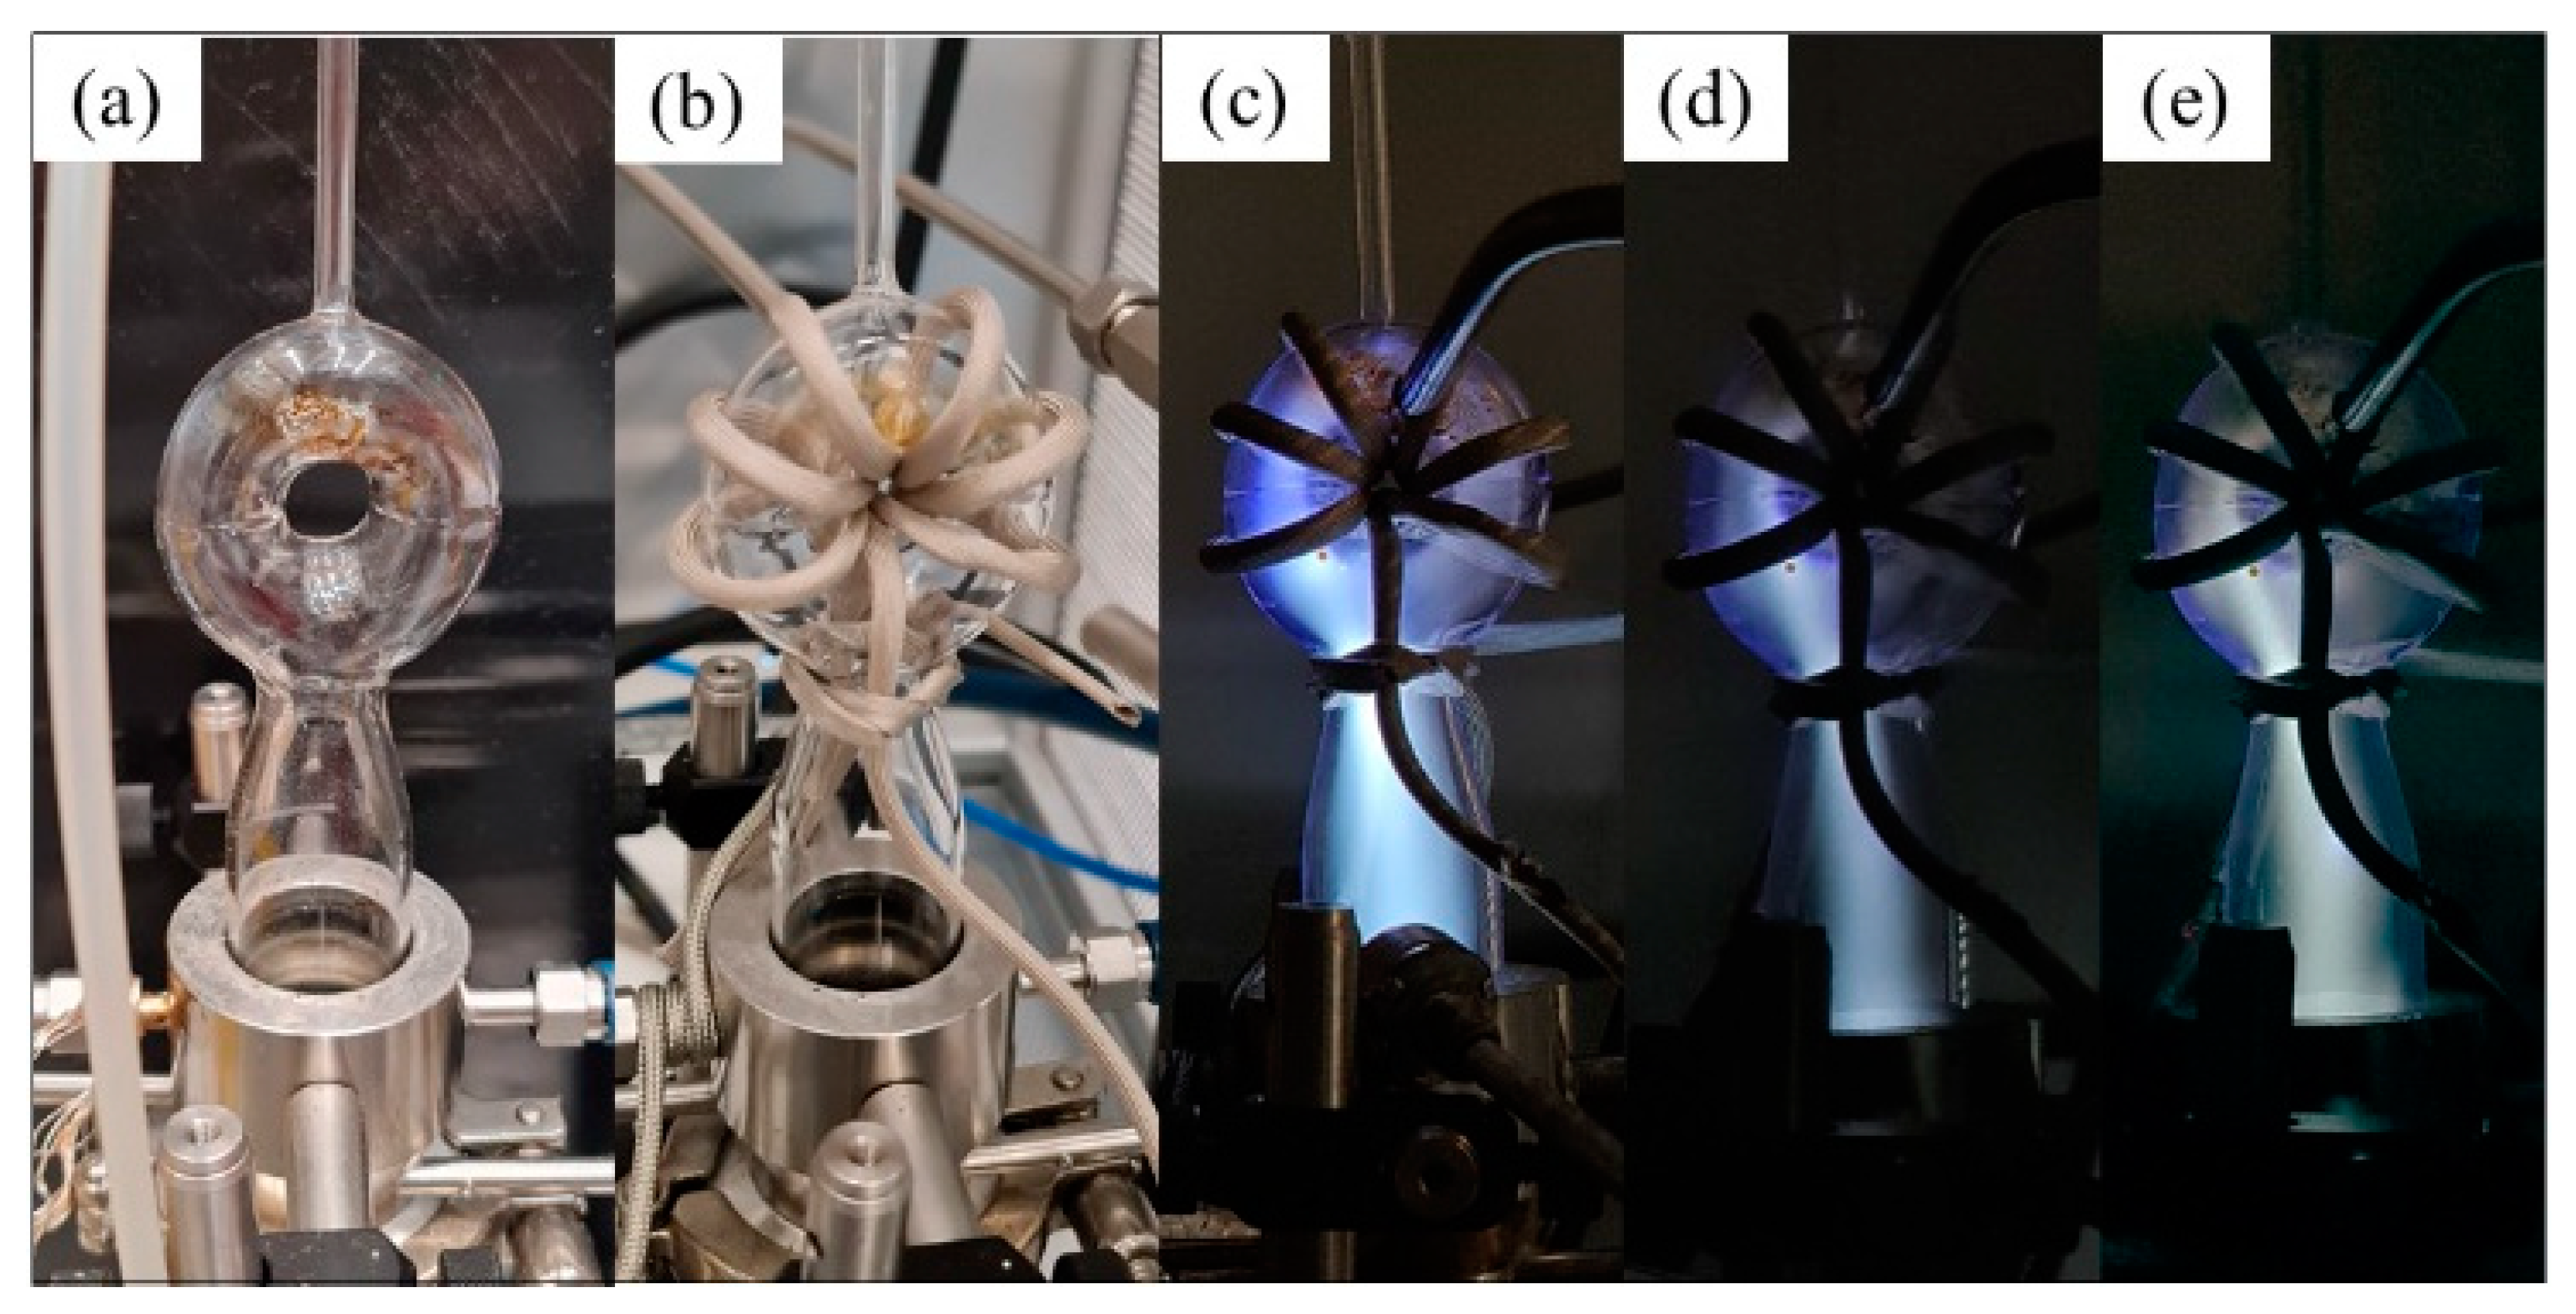
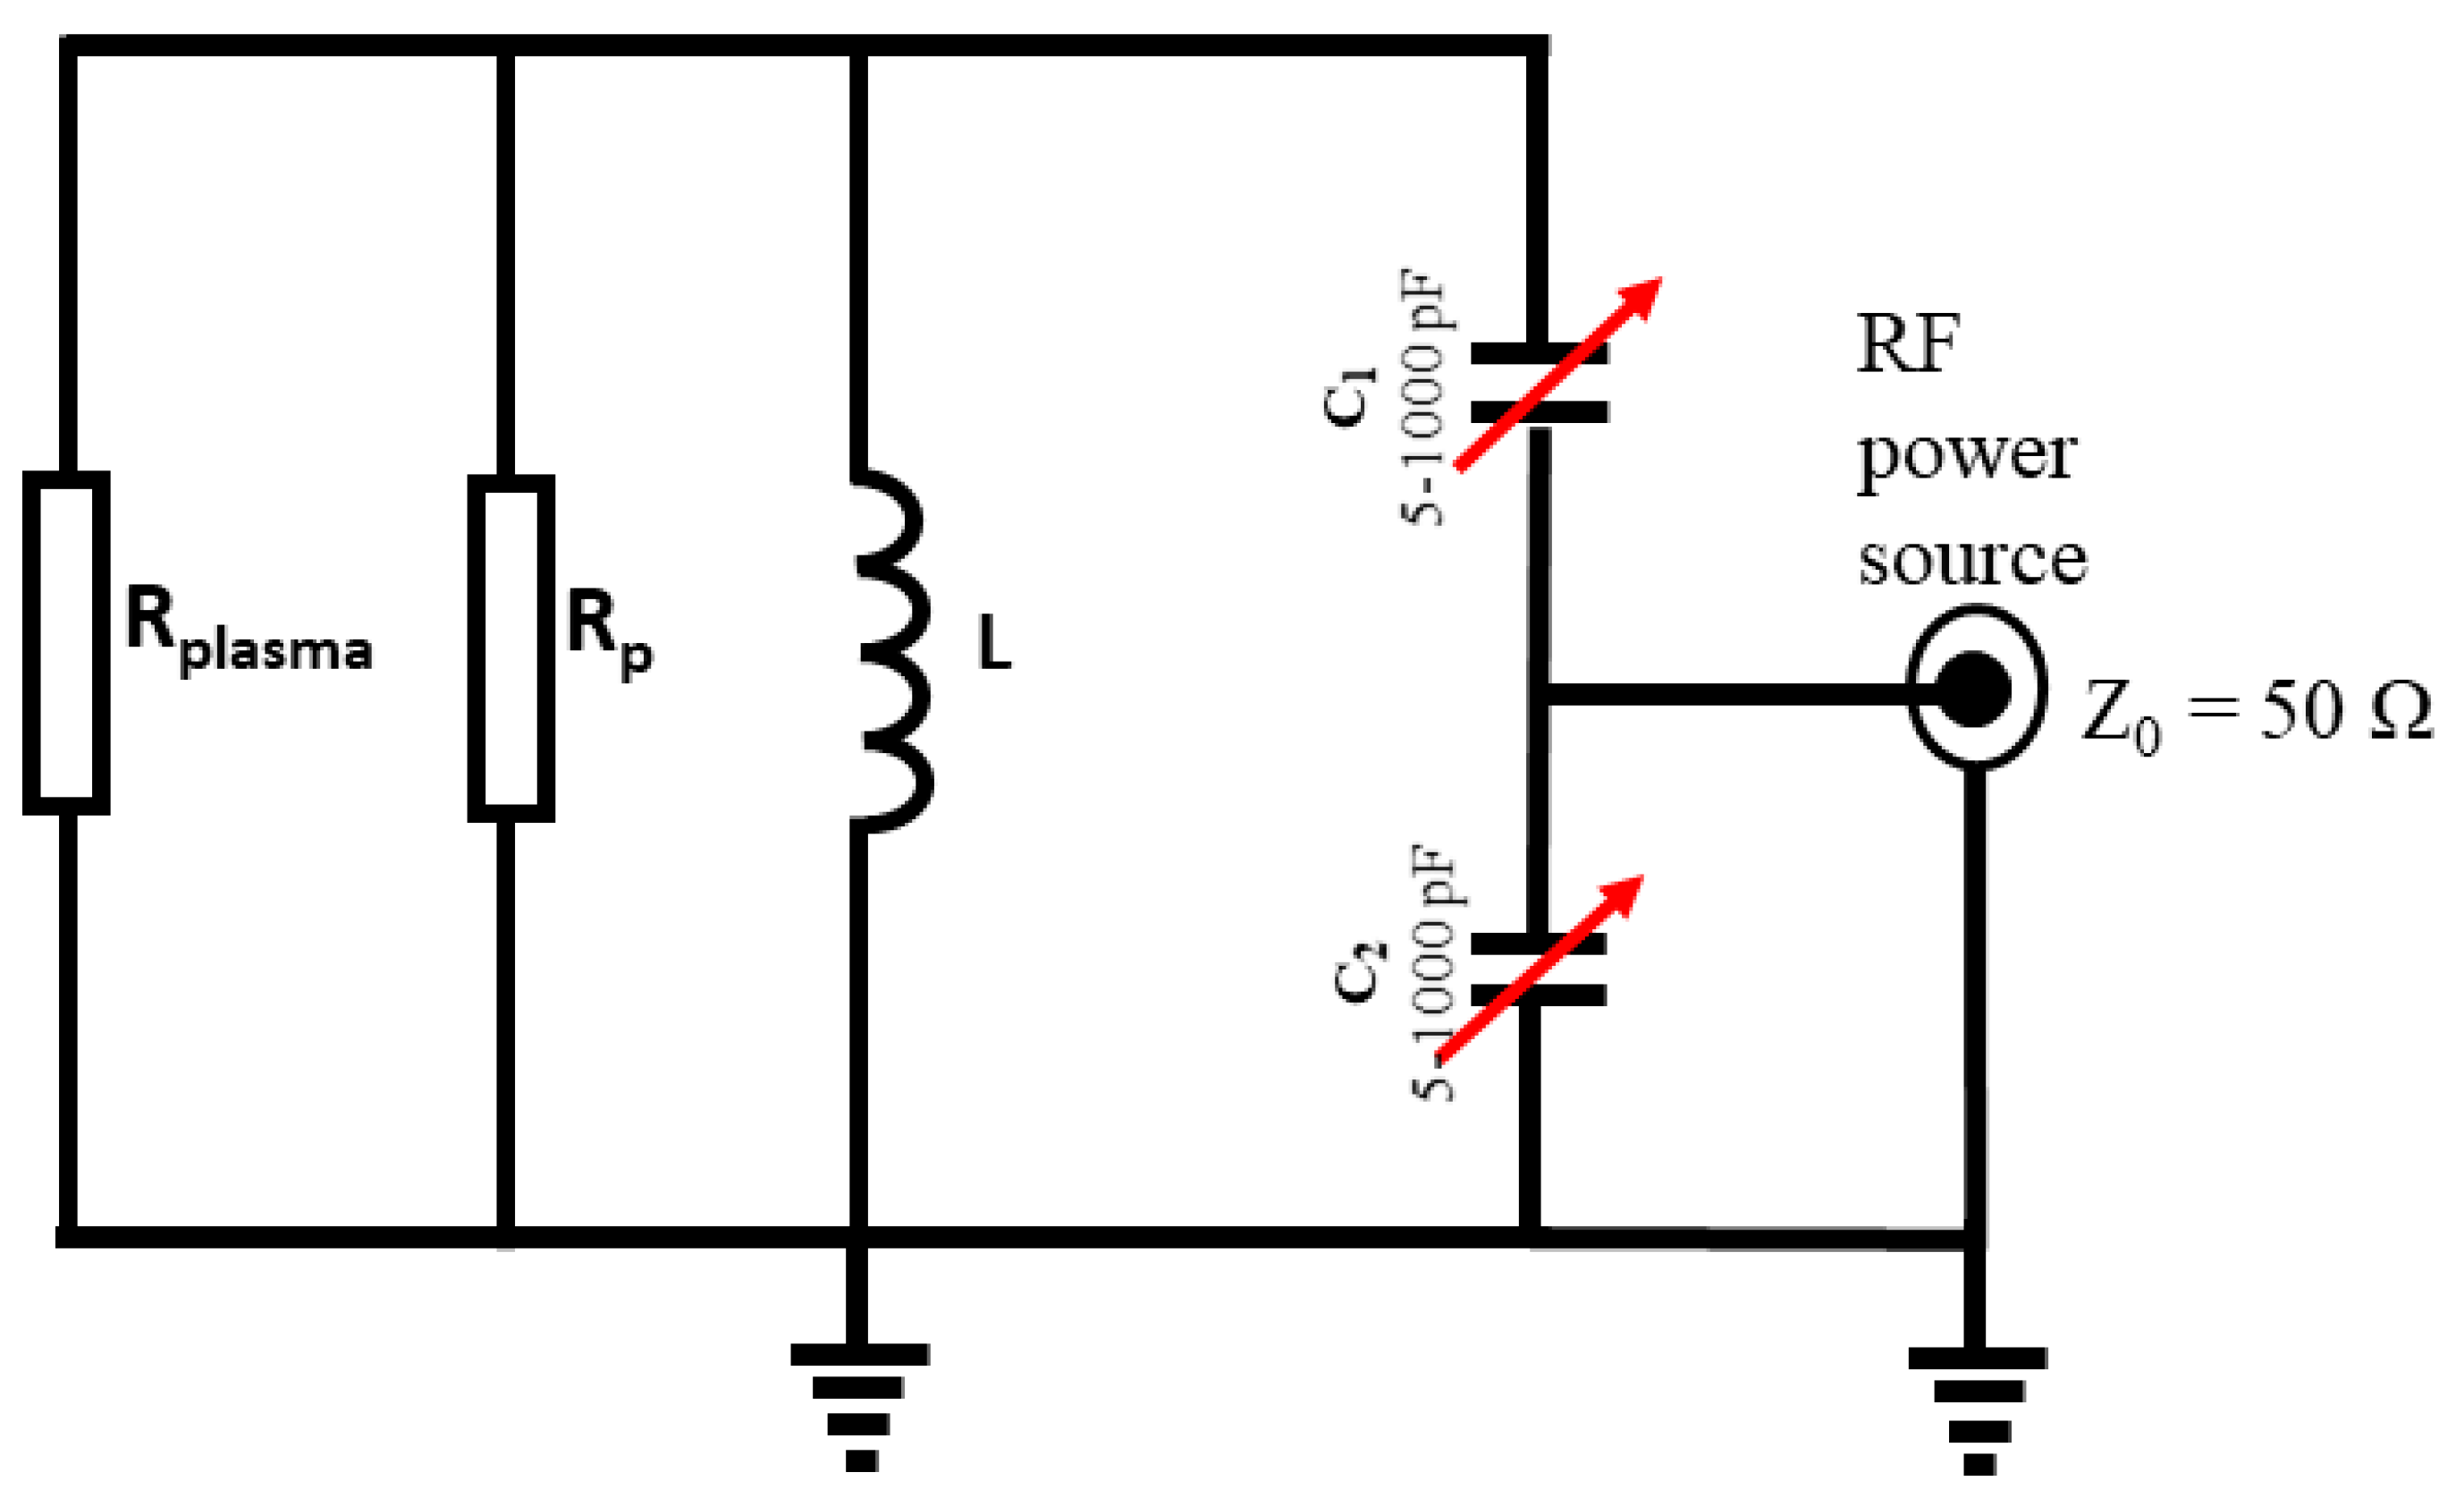
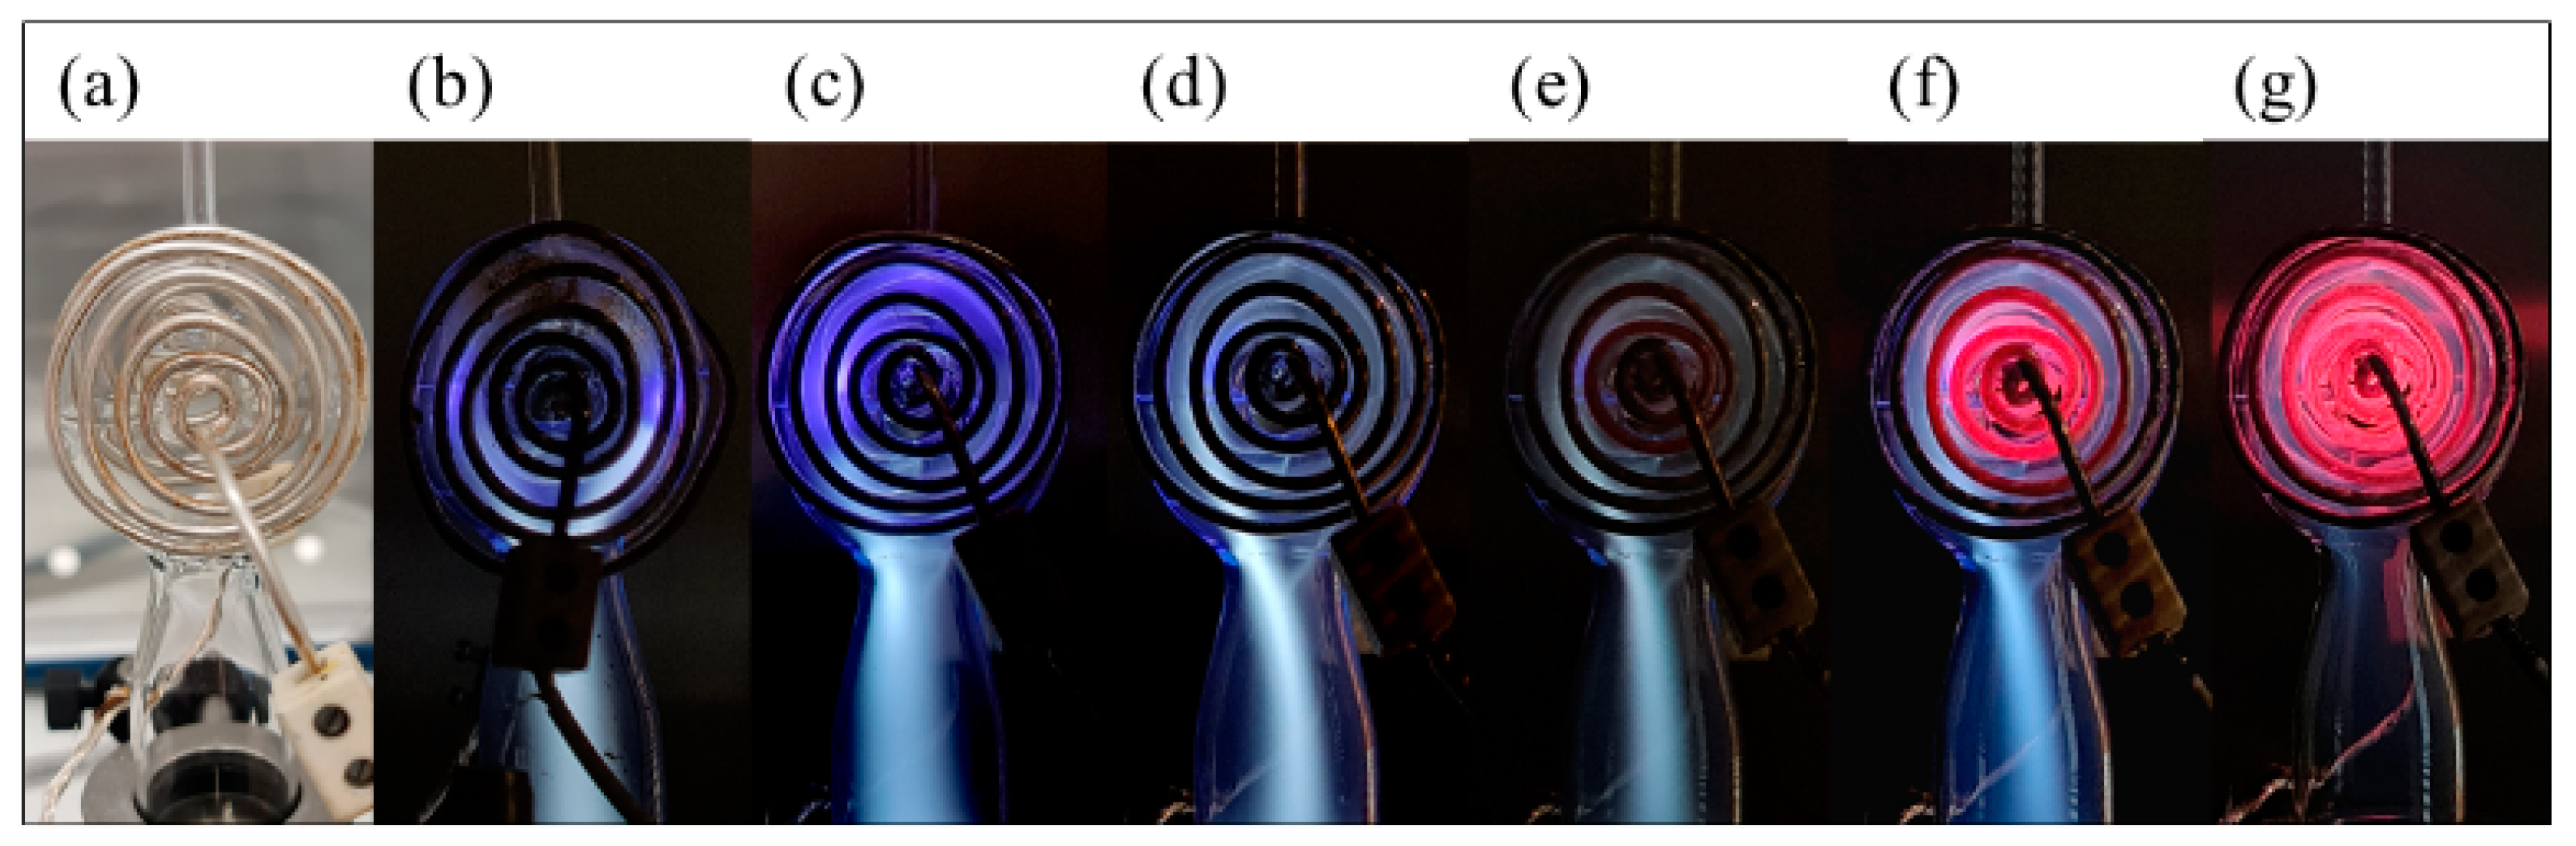
3.5. HF (10.1 MHz) Poloidal Plasma Coupling Configuration

Since ferrite core coupling has the limitation of increasing losses at increasing frequencies, an alternative approach to transformer-like coupling is explored. This involves a plasma source, employing a poloidally (perpendicular to the source curvature) wrapped primary coil winding, fed with a frequency of 10.1 MHz. This orientation induces poloidal plasma currents adjacent to each of the windings, minimizing the EM radiation leakage into the environment as compared to the previous ferrite arrangement. As a trade-off, the plasma volume must be minimized in order to increase the power density and to decrease the plasma resistance. Additionally, the absence of a continuous toroidal plasma current loop intrinsically reduces the homogeneity of the discharge.
A configuration of a torus-shaped quartz plasma vessel with an average diameter of 2.1 cm and a column thickness of 1.9 cm was chosen, shown in Figure 10a. The gas input (internal diameter of 4 mm) is tangentially aligned to the torus. The gas output of the system is tapered from a 1.9 to 2.8 cm internal diameter; see Figure 10a,b (below).
For the determination of the power coupling from the RF source to the plasma, the method was used as described in Section 2 (method 2), see also Figure 11 for the electrical scheme. First, the plasma was ignited and adjusted to the desired pressure while matching the system through C1 and C2.
L = 1 4 π 2 f 0 2 C S ,   with   C S = C 1 C 2 C 1 + C 2 ,   R p = Q u n l o a d e d C s L   and Coupling   efficiency = R P R P + R p o t
The plasma was replaced with a low induction/capacitance variable resistor and the resistor varied until it was again matched. The adjusted resistor was removed and measured to represent the plasma resistance (Rpot). For the remainder system, the Q of the system (without plasma) was measured after re-matching with a vector network analyzer. From the Q, Rp was calculated which was the up-transformed impedance of the power source and the parasitic resistance of the coil (including some stray radiation, if present); see Table 2.
Considering the images in Figure 10, the first observation is that only at lower pressures is the torus almost completely filled with CO2 plasma. If the pressure increases, regions appear where the plasma disappears in the torus and the plasma tends to contract more. This results in the less effective flux surface coverage of the toroidal coil and in the length of the coil. The absence of plasma in certain regions in the coil decreases the coupling efficiency dramatically. As noted previously, the poloidal alignment of the coils and local poloidal plasma currents reduce the homogeneity of the discharge, as observed in Figure 10c–e. Coupling efficiencies are reduced due to the inhomogeneity in plasma density, and, hence, conductivity, adjacent to each of the feeding coil turns. In essence, each poloidal winding sees a different plasma load and, hence, the coupled power varies for each winding, reducing the coupling efficiency and negating the benefits of reduced environmental EM radiation. In the next subsection, a coil configuration is explored that generates a toroidal current in the plasma.

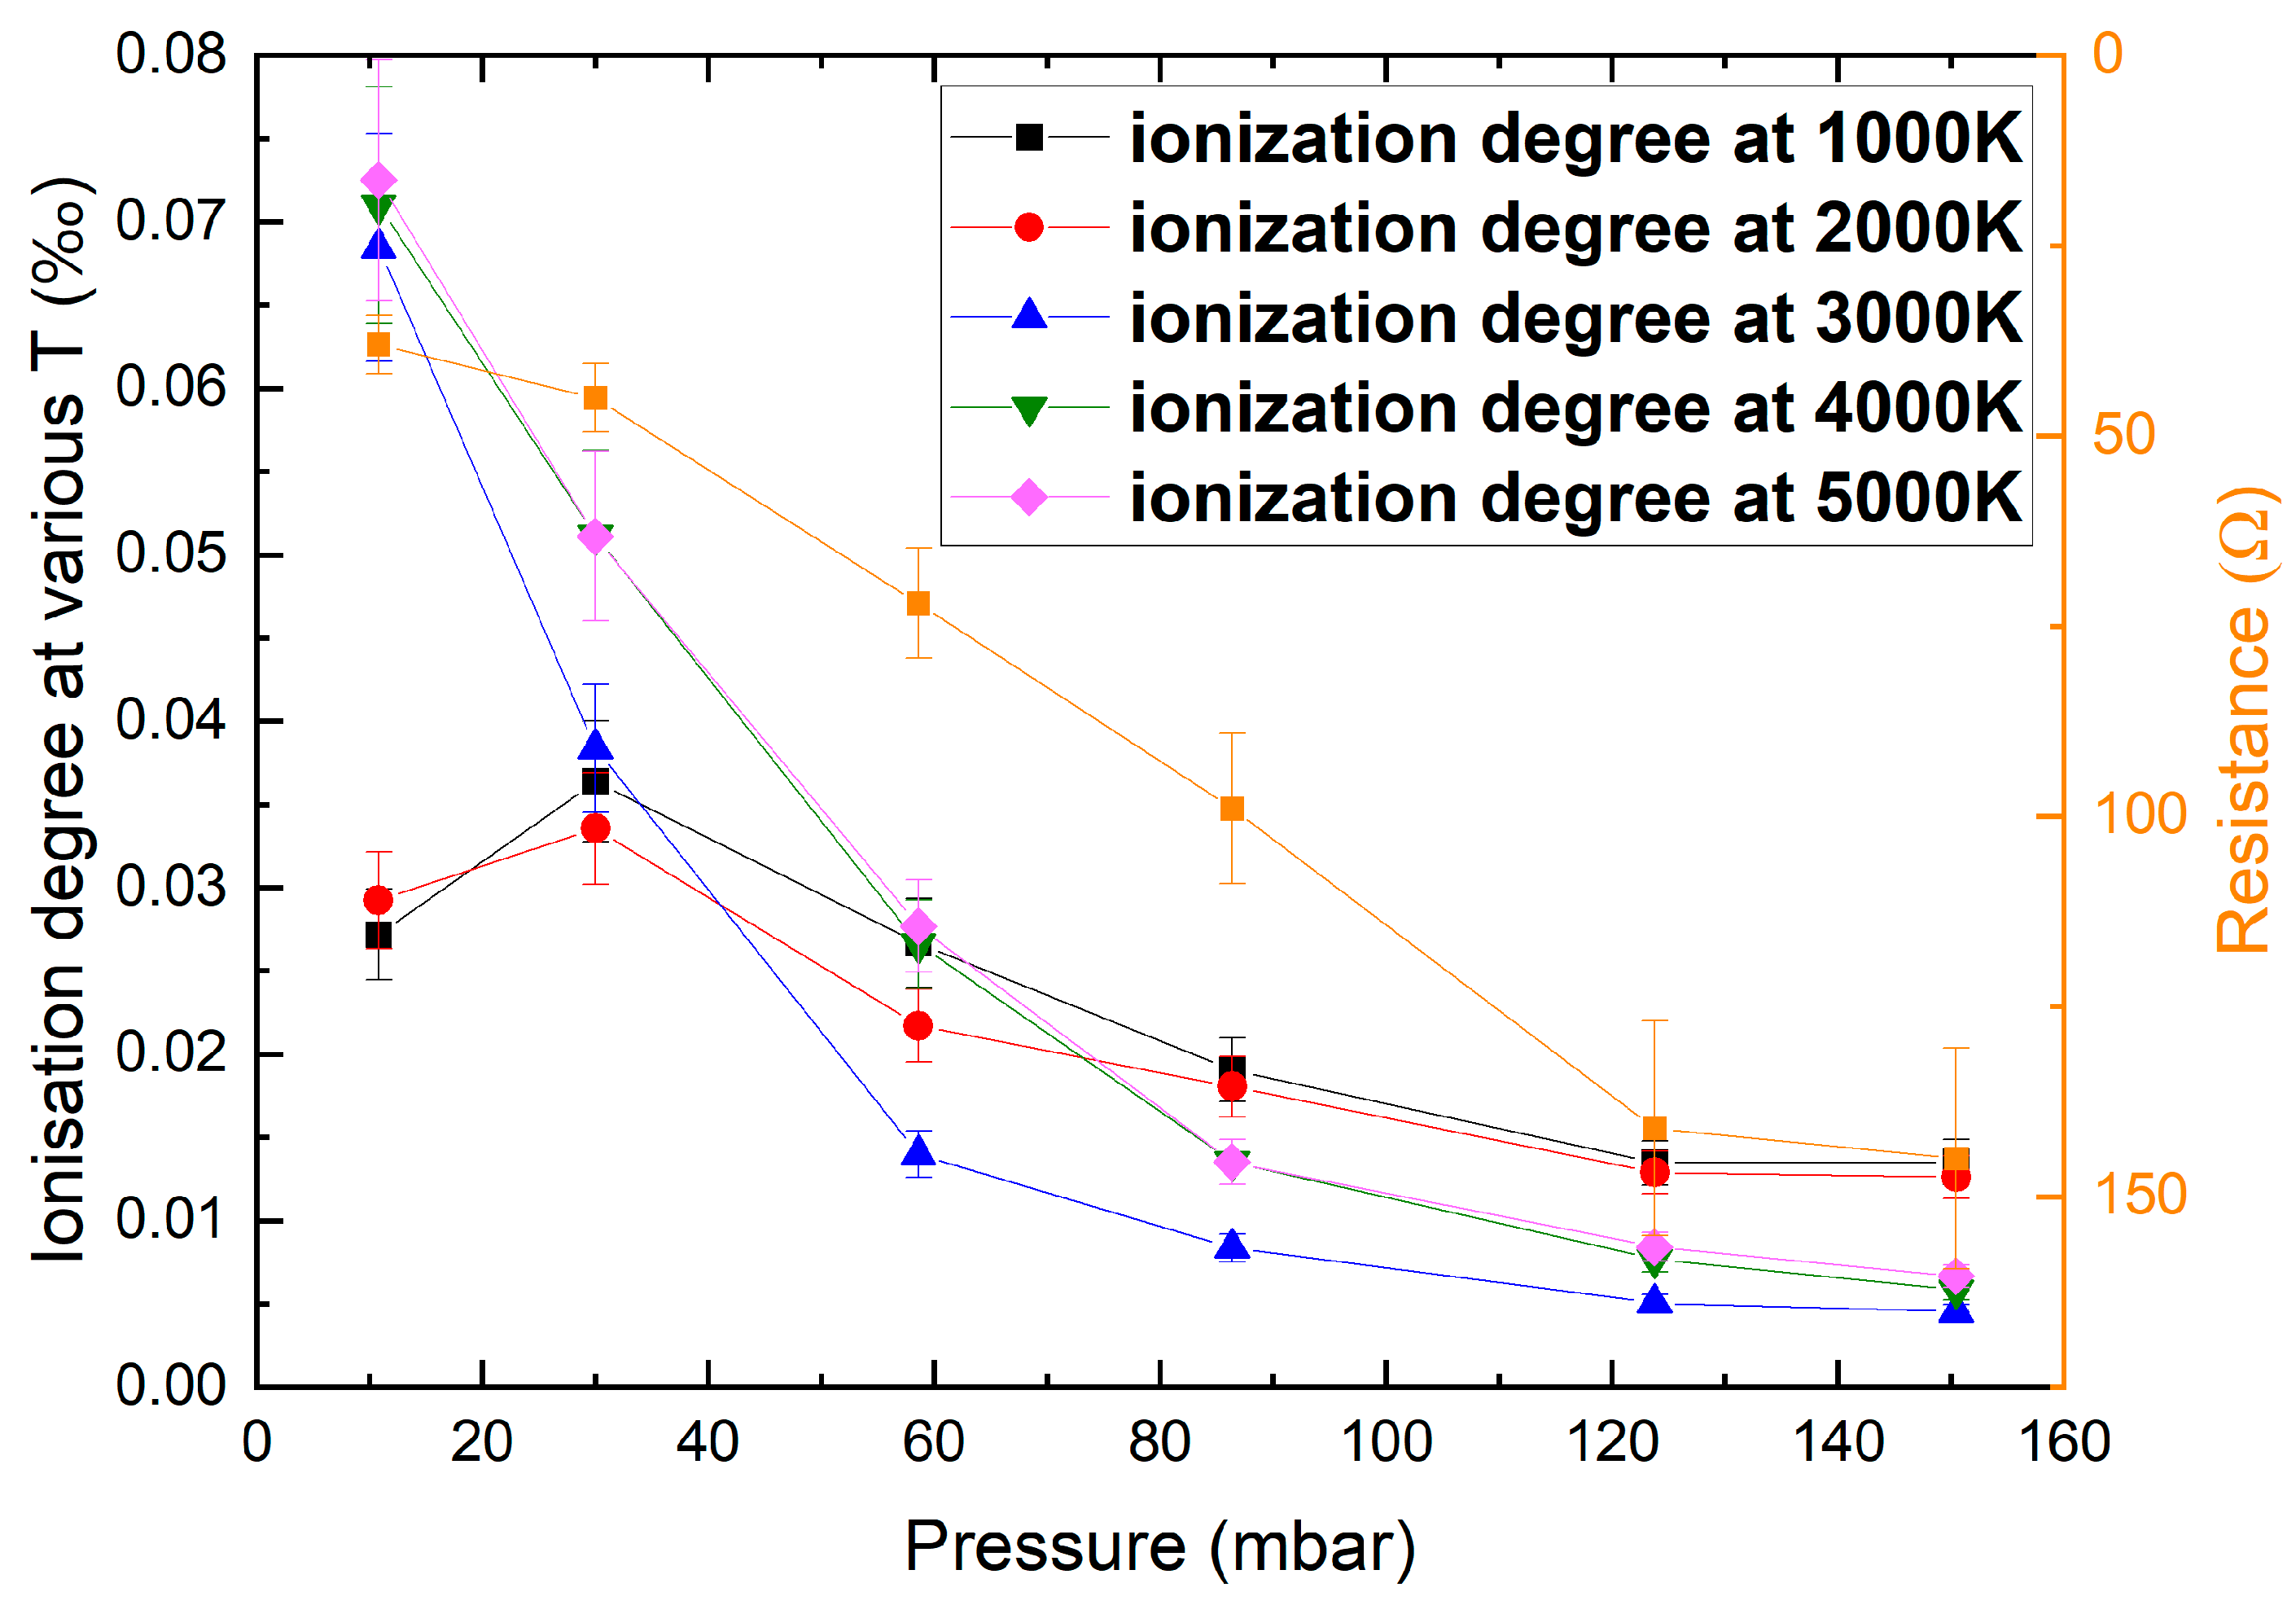
3.6. HF (21.7 MHz) Toroidal Coil Plasma Coupling Configuration

In the previous configuration, we investigated a poloidally turned coil that supported the poloidal currents. The coil and reactor were not completely filled with plasma and, therefore, the coupling was not optimal. To address this issue of reduced plasma homogeneity in non-ferrite-coupled poloidal coil RF discharges, it is necessary to drive a significant fraction of toroidal current along the plasma. To achieve this, a toroidally spiraling helical coil (i.e., pancake shape) was employed, covering the entire quartz torus, and fed with a frequency of 21.7 MHz; see Figure 12a. The electrical scheme remains the same compared with the previous subsection (see Figure 11), except that the plasma torus now has one turn, and the coil around the torus in the toroidal plane has eleven turns (5.5 at each side of the torus), which down-converts the primary voltage of the coil to the plasma. So, method 2 is followed to determine the coupling including the temperature compensation on the loaded Q and, as a result, on the parallel resistance, Rp.
The same method of consecutive simulations was applied with PLASIMO and BOLSIG+, and then graphically determining the electron density and the ionization degree, as used in Section 3.4 (Figure 9), was applied to this pancake configuration; see Figure 13.
The ionization degree in Figure 13 is constant at higher pressures and, therefore, the plasma remains intact. In contrast to the pictures shown in Figure 10 (in the previous subsection) with the poloidally turned coil, the plasma with the pancake coil in Figure 12 shows a more homogenous distribution inside the coil even at higher pressures. The coupling efficiency is an order of magnitude higher. Thermal losses within the coils increase with increasing pressure. Without active cooling, the coils begin to glow red at ~77 mbar. Beyond 102 mbar, the coil losses exceed the power coupled into the plasma; see Table 3. In practice, operations would likely be limited to below 60 mbar, where the coupling efficiency is above 80%. This coupling efficiency approaches the coupling of an inductive plasma lamp seen in Section 3.1.
When comparing the total plasma impedance of the poloidally turned coil versus the pancake coil configuration, it can be concluded that in the poloidally turned coil, its total torus (plasma) impedance, Rp, is about two orders of magnitude higher than in the pancake coil configuration, as shown in Figure 11. The pancake configuration reached a maximum plasma coupling of 89% and pressures of over 100 mbar. The coupling at higher pressures can be improved using a cooled, low-loss coil.

4. Conclusions and Outlook

In this work, RF power coupling methods and efficiencies have been investigated, employing novel transformer-coupled and inductively coupled toroidal plasma configurations.
With the same setup as used in commercial plasma lamps, CO2 plasma had a lower ionization degree and significantly higher resistance compared to the original mercury-vapor lamp. The inductance of the ferrite rings had to be increased (through higher magnetic permeability) to achieve a high coupling efficiency of the LF power to the plasma.
In the first attempt, improved ferrite rings, capable of higher frequency and higher AL values, were used. The expected coupling should be 50%; however, the core losses were higher at the frequency of about 10 MHz, resulting in a coupling efficiency of ~33%. Increasing the frequency not only decreased the AL values but also increased the relative losses of the ferrite toroids. Better ferrite (with low loss at HF range) materials, if available, would have been a feasible option.
Since no suitable ferrite material was found, a lower-frequency (LF band) plasma reactor configuration was investigated, where the high-AL-value FINEMET material was used. The reactor was used in a transformer configuration (similar to plasma lamps) and resulted in a coupling efficiency of 89% at a low pressure range (1.5 mbar) with an input power of 3.1 kW at about 65 kHz. This configuration suffers from decreasing coupling at higher pressures since the plasma impedance increases. This limits the coupling of the transformer due to a lack of sufficient inductance of the ferrite cores. Additionally, the power density is too low to sustain half a meter of plasma.
Measurements in combination with PLASIMO and BOLSIG+ simulations on alternative coil configurations at HF frequencies (without ferrite cores/rings) such as a poloidally turned toroidal coil and a toroidally spiraling helix coil have been investigated with a toroidal plasma vessel of relatively small size to increase the power density. The poloidally turned coil (toroidal) plasma source gave an insufficient coupling of ~10% (at 10 MHz and about 0.5 kW in the mbar range), which resulted in an inhomogeneous plasma. It was learned that a plasma current in the poloidal plane gave a low coupling resulting in a low ionization degree. The alternative configuration with a toroidally spiraling helix coil (“pancake”) resulted in an 83% coupling efficiency at relatively high pressure (59 mbar) and 0.5 kW at an HF frequency of 21.7 MHz. See Table 4 for an overview of the experimental configurations tested and their couplings.
The reactor with the toroidally spiraling helix coil allowed pressures above 100 mbar but since the coil was uncooled, a thermal runaway effect was observed, which increased the resistance of the coil and decreased the plasma coupling. This problem can be mitigated by cooling the coil. The outlook is that the toroidally spiraling helix plasma source has the potential for further development towards a robust, cheap, and scalable plasma source for plasma chemistry applications as an alternative to microwave plasma sources [23] up to atmospheric pressures. Since the Technical Readiness Level (TRL) of the “pancake” plasma source is much lower as compared to existing microwave plasma sources, we could not foresee the typical operational conditions (i.e., likely maximum pressures and energy efficiencies). However, even if coupling might be a limiting factor, the energy efficiency and lifetime of microwave power sources are still far behind compared to the energy efficiency and lifetime of the RF power sources, which the toroidal coil plasma source uses. This concept is worth further investigation.

Author Contributions

Conceptualization, E.J.D., W.A.B., P.W.C.G., S.J.D., M.v.G., F.M.A.S., C.F.A.M.v.D., K.S., S.L., M.A.G. and M.C.M.v.d.S.; methodology, E.J.D., W.A.B., F.M.A.S. and M.C.M.v.d.S.; software, E.J.D., W.A.B., P.W.C.G. and S.J.D.; validation, E.J.D., W.A.B., P.W.C.G., S.J.D., M.v.G., F.M.A.S., C.F.A.M.v.D., K.S., S.L., M.A.G. and M.C.M.v.d.S.; formal analysis, E.J.D., W.A.B., P.W.C.G., M.v.G., F.M.A.S., C.F.A.M.v.D., K.S. and S.L.; investigation, E.J.D., W.A.B., P.W.C.G., M.v.G., F.M.A.S., C.F.A.M.v.D., K.S. and S.L.; resources, E.J.D., W.A.B., P.W.C.G., M.v.G., F.M.A.S., C.F.A.M.v.D., K.S., S.L. and M.C.M.v.d.S.; data curation, E.J.D., W.A.B., K.S. and S.L; writing—original draft preparation, E.J.D., W.A.B., P.W.C.G., S.J.D., M.v.G., F.M.A.S., C.F.A.M.v.D., K.S., S.L., M.A.G. and M.C.M.v.d.S.; writing—review and editing, E.J.D., W.A.B., P.W.C.G., S.J.D., M.v.G., F.M.A.S., C.F.A.M.v.D., K.S., S.L., M.A.G. and M.C.M.v.d.S.; visualization, E.J.D., W.A.B., P.W.C.G., M.v.G., C.F.A.M.v.D., K.S. and S.L.; supervision, E.J.D., W.A.B. and M.C.M.v.d.S.; project administration, E.J.D. and W.A.B.; funding acquisition, E.J.D., W.A.B. and M.A.G. All authors have read and agreed to the published version of the manuscript.

Funding

This research was funded by the Netherlands Organization for Scientific Research (NWO) XS grant (number OCENW.XS22.4.115).

Data Availability Statement

The data will be made available upon request.

Acknowledgments

The authors would like to acknowledge Guus Pemen (TU/e) and Hitachi (Kenji Hayashi) for the availability of the FINEMET material. Our thanks go also to Stefan Welzel and the SFFI group and Ed van Wijk and the Engineering support group for their aid and the use of equipment. We thank Mark J. Kushner at the University of Michigan for insightful discussions.

Conflicts of Interest

The authors declare that they have no known competing financial interests or personal relationships that could have appeared to influence the work reported in this paper.

References

  1. Piovesan, N.; Gambin, A.F.; Miozzo, M.; Rossi, M.; Dini, P. Energy sustainable paradigms and methods for future mobile networks: A survey. Comput. Commun. 2018, 119, 101–117. [Google Scholar] [CrossRef]
  2. Nikoo, M.S.; Jafari, A.; Perera, N.; Zhu, M.; Santoruvo, G.; Matioli, E. Nanoplasma-enabled picosecond switches for ultrafast electronics. Nature 2020, 579, 534–539. [Google Scholar] [CrossRef] [PubMed]
  3. Godyak V, Ferromagnetic enhanced inductive plasma sources. J. Phys. D Appl. Phys. 2013, 46, 283001. [CrossRef]
  4. Boulos, M.I. The inductively coupled R.F. (radio frequency) plasma. Pure Appl. Chem. 1985, 57, 1321–1352. [Google Scholar] [CrossRef]
  5. Rauner, D.; Mattei, S.; Briefi, S.; Fantz, U.; Hatayama, A.; Lettry, J.; Nishida, K.; Tran, M.Q. Investigation of the RF efficiency of Inductively CoupledHydrogen Plasmas at 1 MHz. AIP Conf. Proc. 2017, 1869, 030035. [Google Scholar]
  6. Kamada, Y.; Barabaschi, P.; Ishida, S. the JT-60SA Team and JT-60SA Research Plan Contributors, Progress of the JT-60SA project. Nucl. Fusion 2013, 53, 104010. [Google Scholar] [CrossRef]
  7. Smith, D.K.; Chen, X.; Holber, W.M.; Georgelis, E. Toroidal Low-Field Reactive Gas Source. U.S. Patent 6,150,628, 21 November 2000. [Google Scholar]
  8. Onenga, J. Fusion: A true challenge for an enormous reward. EPJ Web Conf. 2022, 268, 00011. [Google Scholar] [CrossRef]
  9. Paranjpe, A.P. Plasma Sources Employing Spiral RF Coil and Method for Using Same. U.S. Patent 5,436,528, 25 July 1995. [Google Scholar]
  10. Wang, Y.; Wang, Z.; Dong, L.; Zhou, Y.; Sun, R.; Li, C. Micro inductively coupled plasma excitation source based on the three-dimensional spiral-shaped coil. In Proceedings of the 2010 International Conference on Measuring Technology and Mechatronics Automation, Changsha, China, 13–14 March 2010; pp. 660–663. [Google Scholar]
  11. Munsat, T.; Hooke, W.M.; Bozeman, S.P.; Washburnd, S. Two new planar coil designs for a high pressure radio frequency plasma source. Appl. Phys. Lett. 1995, 66, 2180–2182. [Google Scholar] [CrossRef]
  12. Dijk, J.; Peerenboom, K.S.C.; Jimenez-Diaz, M.; Mihailova, D.B.; Mullen, J.J.A.M. The plasma modelling toolkit. J. Phys. D Appl. Phys. 2009, 42, 1940121. [Google Scholar]
  13. Hagelaar, G.J.M.; Pitchford, L.C. Solving the Boltzmann equation to obtain electron transport coefficients and rate coefficients for fluid models. Plasma Sources Sci. Technol. 2005, 14, 722. [Google Scholar] [CrossRef]
  14. BOLSIG+ Version 12-2019. Available online: https://www.bolsig.laplace.univ-tlse.fr/index.html (accessed on 22 March 2024).
  15. Janssen, J.F.J. Equilibrium and Transport in Molecular Plasmas. Ph.D. Thesis, Eindhoven University of Technology, Eindhoven, The Netherlands, 2016. [Google Scholar]
  16. Phelps Database. Available online: www.lxcat.net (accessed on 22 March 2019).
  17. Hake, R.D.; Phelps, A.V. Momentum-Transfer and Inelastic-Collision Cross Sections for Electrons in O2, CO, and CO2. Phys. Rev. 1967, 158, 70. [Google Scholar] [CrossRef]
  18. Phelps Database, CO2 cross Sections. Available online: www.lxcat.net (accessed on 22 March 2024).
  19. Phelps Satabase, CO cross Sections. Available online: www.lxcat.net (accessed on 22 March 2024).
  20. Phelps Database, O2 cross Sections. Available online: www.lxcat.net (accessed on 22 March 2024).
  21. Blaha, M.; Davis, J. Elastic scattering of electrons by oxygen and nitrogen at intermediate energies. Phys. Rev. A 1975, 12, 2319. [Google Scholar] [CrossRef]
  22. Viegas, P.; Vialetto, L.; Wolf, A.J.; Peeters, F.J.J.; Groen, P.W.C.; Righart, T.W.H.; Bongers, W.A.; van de Sanden, M.C.M.; Diomede, P. Insight into contraction dynamics of microwave plasmas for CO2 conversion from plasma chemistry modelling. Plasma Sources Sci. Technol. 2020, 29, 105014. [Google Scholar] [CrossRef]
  23. Hecimovic, A.; Mayer, M.T.; De Haart, L.G.J.; Gupta, S.; Kiefer, C.K.; Navarrete, A.; Schulz, A.; Fantz, U. Benchmarking microwave-induced CO2 plasma splitting against electrochemical CO2 reduction for a comparison of promising technologies. J. CO2 Util. 2024, 83, 102825. [Google Scholar] [CrossRef]
Scheme 1. Flow chart to choose the method for determining the power coupling of an LF or HF plasma source.
Plasma 07 00030 sch001
Figure 1. Commercial LTTS–LVD300SB electrodeless fluorescent plasma lamp (i.e., a diameter tube of 56 mm and a total length of 1120 mm) to test its high coupling efficiency.
Plasma 07 00030 g001
Figure 2. Small toroidal plasma vessel for CO2 processing placed in the original transformer cores of the plasma lamp.
Plasma 07 00030 g002
Figure 3. (a) Toroidal plasma vessel in a reactor setup, (b) reactor with air plasma (with a very bright red glow) at 0.3 mbar without gas flow, (c) reactor with CO2 plasma (with a faint grey-blue glow) at 0.5–0.6 mbar without gas flow. Input power of 600 W.
Plasma 07 00030 g003
Figure 4. The coupling efficiency (black) and load resistance (green) as a function of the reactance-to-load resistance ratio (XL/R) in the transformer of the plasma reactor. To measure this, the plasma resistance was simulated using a fixed resistor Rload to measure the coupling efficiency. In conclusion, the reactance of the ferrite cores needs to be minimally a factor of 4 higher than the plasma load resistance to have a high coupling efficiency of a few hundred kHz. Note that the maximum of 100% (full) coupling can never be reached since there is always a small amount of energy needed to overcome core losses.
Plasma 07 00030 g004
Figure 5. (a) The plasma reactor configuration with 6 ferrite rings at 10 MHz. Each toroid has one primary winding coupled in parallel for the total set, which is connected via a capacitive divider to the RF power source. This configuration gives a fixed transformation ratio of 1/6 to the plasma combined with an adjustable matching of the total resonant circuit by the capacitive divider. (b) Reactor with CO2 plasma at 1 kW (full matching/no reflected input power), 1.4 mbar, and 10.19 MHz in the working setup. Gas input (0.1 SLM CO2) at the top is off-center tangential. The pressure is controlled using a throttling valve after the plasma reactor and before the vacuum pump.
Plasma 07 00030 g005
Figure 6. Design of the LF reactor with shorted Hitachi-U cores (backside) The golden part shows the water-cooled gas input manifold; the grey parts are the FINEMET ring cores; and the red, brown, and yellow parts are copper heatsink metal plates attached to the blue water-cooled labyrinths. The transparent part is the quartz vessel, which forms the secondary coil in the transformer (with plasma). The cyan pillars are wire connectors for the primary coil in the transformer.
Plasma 07 00030 g006
Figure 7. The LF reactor plasma reactor: quartz vessel (1), tangential gas input (2), gas output (3), spiral ignition coil (4; discussed in next subsection). The three white wires here form the primary feeding coil. The illustrated plasma reached 2.5 mbar at about 3 kW.
Plasma 07 00030 g007
Figure 8. The factory-specified magnetic properties of the FINEMET materials (Hitachi-U cores (F1AH1269)) in factory dimensions (black) and calculated for our reactor dimensions, with shortened FINEMET, core (red). The Q factor is shown as the orange line. The grey bar represents the operating frequency range of the source.
Plasma 07 00030 g008
Figure 9. The simulated ionization degree at various temperatures and the measured resistance of the plasma as a function of the pressure in the LF plasma reactor configuration. The dashed lines are an indication for the maximum pressure of this plasma source at about 3 kW of power.
Plasma 07 00030 g009
Figure 10. (a) Image of quartz toroid reactor vessel without coil configurations, (b) with a coil configuration, (c) 530 W discharge employing 0.532 mbar of CO2, (d) 570 W discharge employing 5.05 mbar of CO2, (e) 596 W discharge employing 10.4 mbar of CO2. All discharges employed a source current frequency of 10.1 MHz.
Plasma 07 00030 g010
Figure 11. General electrical scheme of Poloidal Plasma Coupling Configuration including the equations.
Plasma 07 00030 g011
Figure 12. (a) Picture of the toroidally spiraling helix reactor (“pancake” with no power applied), (b) 430 W at 11 mbar of CO2, (c) 445 W at 30 mbar of CO2, (d) 422 W at 59 mbar of CO2, (e) 294 W at 86 mbar of CO2, (f) 265 W at 124 mbar of CO2, and (g) 146 W at 151 mbar of CO2. In pictures (be) only a plasma is observed, in pictures (f,g) the coils starts (red) glowing caused by the increased losses.
Plasma 07 00030 g012
Figure 13. The ionization degree at various temperatures and the resistance of the plasma as a function of the pressure in the pancake plasma reactor configuration.
Plasma 07 00030 g013
Table 1. LF reactor performance plasma reactor, plasma reactor with 3 turns primary and 1 turn secondary (the plasma).
CO2 Flow (SLM)p
(mbar)
f
(kHz)
Pprimary
(W)
Psecondary
(W)
XL
(Ω)
XL/RplasmaRplasma
(Ω)
U RMSplasma
(V)
Coupling
Efficiency
0.511.5166.13546312029.083.29.0181.488%
0.962.4962.83944312527.621.2322.4254.679%
Error margins: CO2 flow: ±0.1 SLM; p: ±0.1 mbar; f: ±0.1 kHz; P: ±5%; XL: ±5%; Rplasma: ±5%; U RMSplasma: ±3%; Coupling efficiency: ±5%.
Table 2. The performance of an HF poloidal coupled plasma reactor with a Q of 8.6 at a frequency of 10.137 MHz with no resistance and 7 windings (L and CS are constant at 1 μH and 2.47 pF, respectively). The pressure is controlled via a throttling valve after the plasma reactor and before the vacuum pump.
CO2 Flow (SLM)p (mbar)Pr
(W)
Po
(W)
Rpot
(Ω)
Rp
(Ω)
Pab
(W)
Rplasma
(Ω)
U RMSplasma
(V)
Coupling Efficiency
0.100.531530499054852.4493.58160.869.9%
0.275.05857117,72054817.1531.3395.383.0%
0.2710.4759671,3005484.5543.5849.700.8%
0.27152691136,7005482.8545.5738.790.4%
Pr is reflected power, Po is output power, Pab is absorbed power, and Rpot is the replace resistance to receive the matching obtained at no plasma for plasma conditions. Error margins: CO2 flow: ±0.1 SLM; p: ±0.1 mbar; P: ±10%; R: ±5%; U RMSplasma: ±3.2%; Coupling efficiency: <±0.5%.
Table 3. The performance of an HF “pancake” plasma reactor coupled with a toroidally spiraling helix configuration with 11 windings; CO2 flow is 2.55 SLM, plasma length is 97 mm, and diameter plasma column is 15 mm at a frequency of 22 MHz. The pressure is controlled via a throttling valve after the plasma reactor and before the vacuum pump.
p
(mbar)
P Total
(W)
Pabsorbed
(W)
Rp temperature compensated
(kΩ)
Rpot
(kΩ)
Rplasma
(Ω)
U RMSplasma
(V)
Coupling Efficiency
10.850043032.85.3838.2128.286%
3050044547.96.1745.2141.889%
58.650842250.010.5772.1174.483%
86.449929429.020.4199.1170.859%
123.851521629.341.10141.3174.842%
150.550414624.860.00145.1145.629%
Error margins: CO2 flow: ±0.1 SLM; p: ±0.1 mbar; P: ±10%; R: ±10%; U RMSplasma: ±3.2%; Coupling efficiency: ±5%.
Table 4. Overview of experimental configurations and their reached coupling.
Type CO2 Plasma SourceVessel, Size (cm)Core (y/n)Power (W)Freq. (MHz)Pressure Range (mbar)Max.
Coupling (%)
Modified Plasma lamp 1QT, 7 × 3.4y, ×26000.220.5–0.666–60
6 parallel FerriteQT, 7 × 3.4y, ×6100010.191.433
High AL 2RT, 20.4 × 10.4 × 5.2y, ×231000.0641.5–2.588–79
PoloidalQT, 2.1 × 1.9n59627.700.5–1510–0.4
ToroidalQT, 2.1 × 1.9n~50021.711–12486–29
1 Quartz torus (QT), average outer diameter x average inner diameter; 2 racetrack (RT), average length × average width × average diameter.
Disclaimer/Publisher’s Note: The statements, opinions and data contained in all publications are solely those of the individual author(s) and contributor(s) and not of MDPI and/or the editor(s). MDPI and/or the editor(s) disclaim responsibility for any injury to people or property resulting from any ideas, methods, instructions or products referred to in the content.

