Article

Decomposition Mechanisms of Lignin-Related Aromatic Monomers in Solution Plasma

Graduate School of Energy Science, Kyoto University, Yoshida-honmachi, Sakyo-ku, Kyoto 606-8501, Japan
*
Author to whom correspondence should be addressed.
Plasma 2025, 8(2), 14; https://doi.org/10.3390/plasma8020014
Submission received: 1 March 2025 / Revised: 28 March 2025 / Accepted: 7 April 2025 / Published: 10 April 2025
(This article belongs to the Special Issue Feature Papers in Plasma Sciences 2025)

Abstract

:
Lignin is a natural aromatic macromolecule present in wood and an abundant resource on Earth, yet it is hardly used. In this study, an aqueous solution plasma treatment was investigated for the catalyst-free production of valuable chemicals from lignin. To elucidate the decomposition mechanism, the aqueous solution plasma treatment was applied to the fundamental lignin aromatic model compounds—phenol, guaiacol, and syringol. The results showed that the decomposition rate followed the order syringol > guaiacol > phenol, indicating that electron-donating methoxy groups enhance reactivity. These aromatic model compounds underwent hydroxylation at the ortho and para positions, oxidative ring cleavage, and fragmentation, leading to the formation of various dicarboxylic acids, primarily oxalic acid. All these reactions were promoted by hydroxyl radicals generated from water. Ultimately, decarbonylation and decarboxylation of carboxyl groups resulted in gasification, mainly producing H2, CO, and CO2. These results provide fundamental insights into lignin decomposition and demonstrate that aqueous solution plasma is a promising method for producing dicarboxylic acids from lignin under mild conditions without catalysts.

Graphical Abstract

1. Introduction

As the demand for a sustainable society grows, woody biomass, a carbon-neutral resource, is recognized as a key material in the circular economy. Currently, it is primarily used for lumber, fuel, and pulp production. The kraft pulping process, the most widely used method for pulp production globally, removes lignin from wood and generates black liquor as a byproduct. Lignin, a major component of wood cell walls, is an aromatic macromolecule synthesized through the dehydrogenative polymerization of cinnamyl alcohols, resulting in a highly complex structure [1]. Due to this complexity, its utilization remains challenging, and black liquor is primarily used for heat recovery within the pulping process, leaving its potential as an aromatic resource largely untapped.
To utilize lignin as a chemical feedstock, various conversion technologies were explored. Pyrolysis [2] and catalytic hydrogenolysis [3] are among the most studied approaches, but they face challenges such as coke and tar formation [4] and the high cost of catalysts. Other methods, including oxidative depolymerization [5] and supercritical fluid-based conversion [6], were also investigated. However, the development of cost-effective and scalable technologies remains an ongoing challenge.
In this context, this study investigated solution plasma, which has a boundary with a liquid. When high-voltage pulses are applied to the gap between electrodes in a liquid, Joule heating generates vapor bubbles. Within these bubbles, electric breakdown readily occurs, leading to gas phase discharge. The resulting solution plasma contains high-energy electrons, radicals, and positive ions and is therefore expected to facilitate chemical reactions of the solute and solvent itself without the need for catalysts. Solution plasma has been extensively studied for various applications, including the decomposition of harmful substances [7], surface modification [8], and nanoparticle synthesis [9]. Regarding the decomposition of organic compounds in solution plasma, promising results were reported for hydrogen production from methanol [10] and ethanol [11]. Previously, we reported the decomposition of saccharides and aliphatic alcohols in aqueous solution plasma and proposed their gasification mechanisms [12,13].
Several studies examined lignin decomposition using solution plasma. Diono et al. applied pulsed discharge plasma to an aqueous lignin solution extracted from cedar with a deep eutectic solvent and observed lignin depolymerization [14]. Zhou et al. applied pulsed discharge plasma to an ethanol solution of alkali lignin and detected the formation of various aromatic compounds and dicarboxylic acids [15]. Lee and Park investigated hydrogen production from bio-oil obtained through the rapid pyrolysis of kraft lignin in ethanol solution plasma [16]. Tange et al. decomposed industrial lignin in methanol solution plasma and observed the formation of gases, benzene, toluene, and phenol [17].
These studies highlighted the potential of solution plasma for lignin conversion but also demonstrated the challenges of discussing the reaction mechanisms due to the structural complexity of lignin. Understanding the reaction mechanisms of lignin in solution plasma is essential for designing efficient conversion processes. Therefore, in this study, phenol (p-hydroxyphenyl (H) unit), guaiacol (2-methoxyphenol, guaiacyl (G) unit), and syringol (2,6-dimethoxyphenol, syringyl (S) unit), the simplest model compounds representing the fundamental aromatic units of lignin, were treated in aqueous solution plasma, and their decomposition mechanisms were examined. It should be noted that softwood lignin consists primarily of G-units, hardwood lignin is composed of both G- and S-units, and herbaceous lignin contains all three types of units [1].
Several previous studies examined the use of aqueous solution plasma for phenol degradation as a wastewater treatment. Tezuka and Iwasaki treated aqueous phenol solutions using contact glow discharge electrolysis and demonstrated that phenol decomposition proceeded via hydroxylation and oxidative cleavage of the aromatic ring [18]. They also pointed out that the hydroxylation occurred selectively at the ortho and para positions. Y.J. Liu and Jiang treated aqueous phenol solutions using diaphragm glow discharge and also reported decomposition pathways involving hydroxylation, oxidative cleavage, and gasification of the aromatic ring [19]. J.L. Liu et al. [20] and Cheng et al. [21] independently reported similar decomposition pathways using water-based in-liquid arc plasma jet systems.
This study aimed to further elucidate the reaction mechanisms of lignin aromatic units by thoroughly analyzing the gaseous and liquid phase products, with a particular focus on the influence of methoxy groups in the guaiacyl and syringyl units. Through this investigation, we aimed to provide fundamental insights for future studies on lignin decomposition in solution plasma.

2. Materials and Methods

2.1. Materials

Phenol (98% purity, Kanto Chemical Co., Inc., Tokyo, Japan), guaiacol (98%, Nacalai Tesque, Inc., Kyoto, Japan), and syringol (98%, BLD Pharmatech Ltd., Shanghai, China), shown in Figure 1, were purchased and used without further purification. Deionized water was produced using an ultrapure water system (Milli-Q Integral 3, Merck Millipore, MA, USA) and degassed for 10 min by vacuum aspiration and ultrasonic treatment to eliminate dissolved CO2. Each sample was dissolved in this water at a concentration of 1 g/L, with sodium chloride (99.5%, Nacalai Tesque, Inc.) added at 0.1 g/L to maintain electrical conductivity.

2.2. Solution Plasma Treatment

The experimental setup for solution plasma treatment is illustrated in Figure 1 [12,13]. A sealed reactor setup was used, consisting of a 100 mL Pyrex glass bottle and a pair of tungsten electrodes (outer diameter, 1.0 mm) insulated with ceramic tubes, with the tips exposed. To generate solution plasma, an aqueous sample solution (100 mL) was introduced into the reactor, and high-voltage alternating current pulses (MPP04-A4-30, Kurita Manufacturing Co., Ltd., Kyoto, Japan; switching frequency, 30 kHz; pulse width, 0.8 µs; no-load voltage, ±4 kV0-p) were applied between the electrodes. Since the discharge power is dependent on the electrode gap [12], the gap was varied in this study to 0.5 mm, 1.0 mm, and 1.5 mm, which resulted in average discharge powers of approximately 16 W, 21 W, and 28 W, respectively. The electrode gap was precisely adjusted through iterative manual fine-tuning while observing magnified camera images using the electrode diameter (1.0 mm) as a reference scale.
To mitigate water and sample evaporation due to heat accumulation, the solution was continuously circulated at a flow rate of 5 mL/min through a coiled heat exchanger in a cold-water bath. Additionally, an intermittent operation was employed, alternating between 1 min of discharge and 1 min of rest, which effectively controlled the temperature increase. As a result, the solution temperature remained below 60 °C across all experimental conditions. The effective plasma treatment time was determined on the basis of the net discharge time, excluding rest intervals.
To avoid nitric acid formation due to atmospheric N2, the reactor was purged with Ar gas prior to the experiment. The generated gases were collected in a 1 L aluminum gas bag. For aqueous phase analysis, approximately 1 mL of the treated solution was collected at 15 min intervals. Each experiment was performed in duplicate or triplicate under identical conditions, and the results were averaged.

2.3. Analytical Methods

The voltage and current waveforms across the electrodes were recorded using a high-voltage probe (SS-0170R, Iwatsu Electric Co., Ltd., Tokyo, Japan) and a current probe (Model 110, Pearson Electronics, Inc., Palo Alto, CA, USA), respectively, to assess the discharge power. Representative voltage and current waveforms of a single pulse are shown in Figure A1 in Appendix A. The solution temperature was monitored with a thermocouple placed approximately 1 cm below the liquid’s surface. Fluctuations in the discharge power and solution temperature during the experiments are summarized in Figure A2 in Appendix A.
The gases collected in the gas bag were analyzed using micro-gas chromatography (micro-GC, Agilent 990, Agilent Technologies Inc., Santa Clara, CA, USA) after the addition of 10 mL of Ne gas as an internal standard. The analysis was carried out under the following conditions: Channel 1 column, MS5A (10 m) at 100 °C; Channel 2 column, PoraPLOT Q (10 m) at 80 °C; Channel 3 column, PoraPLOT U (10 m) at 80 °C; carrier gas, Ar, with inlet pressures of 170 kPa for Channel 1 and 190 kPa for the others; detector, thermal conductivity. Some of the generated gases also remained in the empty spaces of the reactor and the connecting tube. These gases were accounted for in the gas yield using the correction method described in our previous report [12].
The sample solutions were analyzed using high-performance liquid chromatography (HPLC) and gas chromatography–mass spectrometry (GC/MS). For the HPLC analysis (Prominence, Shimadzu Corp., Kyoto, Japan), 10 μL of the solution was directly injected under the following conditions: column, Aminex HPX-87H (Bio-Rad Laboratories, Inc., Hercules, CA, USA); eluent, 5 mM sulfuric acid; flow rate, 0.6 mL/min; column oven temperature, 45 °C; detector, ultraviolet (UV) absorption at 210 nm.
For GC/MS analysis (GCMS-QP2010 Ultra, Shimadzu Corp.), 10 mL of the solution was freeze-dried and derivatized with trimethylsilyl (TMS) reagents in 100 μL of pyridine, and 1,3-diphenoxybenzene was added as an internal standard. The derivatized sample was analyzed under the following GC/MS conditions: column, CP-Sil 8 CB (Agilent Technologies, Inc., Santa Clara, CA, USA); carrier gas, H2; flow rate, 1.1 mL/min; column oven temperature, 70 °C (2 min hold), ramped to 150 °C at 4 °C/min, then to 310 °C at 10 °C/min (3 min hold).
To evaluate the total organic acid content in the sample solution, a potentiometric titrator (AT-510, Kyoto Electronics Manufacturing Co., Ltd., Kyoto, Japan) was used. The solution (80 mL) was placed in a beaker with a stirrer, and a pH titration curve was obtained by gradually adding a 0.05 M potassium hydroxide solution (titration factor: 0.906).

3. Results and Discussion

3.1. Recovery Rates of Aromatic Model Compounds

Figure 2 shows the HPLC chromatograms of aqueous solutions of three aromatic model compounds treated in the solution plasma (gap = 1.5 mm, 28 W). The peak areas of the aromatic model compounds (a, phenol; b, guaiacol; c, syringol) decrease with the plasma treatment time, indicating their decomposition by the solution plasma. In contrast, several product peaks emerge and increase in area over time. These aqueous phase products are discussed in Section 3.2. Note that the boiling points of water, phenol, guaiacol, and syringol are 100 °C, 182 °C, 205 °C, and 262 °C, respectively, under ambient pressure [22]. As shown in Appendix A, the solution’s temperature was maintained below 60 °C under this discharge condition; therefore, their volatilization into the gas bag did not occur.
Figure 3 shows the recovery rates of the three aromatic model compounds over plasma treatment time under different discharge conditions based on the HPLC peak areas. The recovery rates of all aromatic model compounds decrease with treatment time, and the decrease is more pronounced with a larger electrode gap, i.e., higher discharge power. This figure also includes error bars indicating experimental variation, but the variation remained very small, demonstrating the high reproducibility of the experiments in this study.
Thus, since the discharge power and treatment time influenced the recovery rate, Figure 4 presents a re-plotted graph in which the horizontal axis of treatment time was converted to energy input (=discharge power × treatment time). As a result, the differences due to the electrode gap nearly disappeared, demonstrating that within the setup and experimental conditions of this study, the decomposition rate of the aromatic model compounds (100—recovery rate, %) was determined by the energy input. Figure 4 also shows that at the same energy input, the decomposition rate follows the order syringol > guaiacol > phenol. This indicates that compounds with a greater number of methoxy groups tend to decompose more easily in aqueous solution plasma. Since both hydroxyl and methoxy groups, which are substituents of these model compounds, are electron-donating groups, the electron density of the aromatic ring may influence the decomposition reaction.

3.2. Aqueous Phase Products

The HPLC chromatograms shown in Figure 2 were obtained using a UV detector; therefore, only compounds with UV absorption could be detected. Several small product peaks are observed in the retention time range of approximately 20 to 80 min. Figure 5 provides enlarged views of this region. The compound names and chemical structures of these products are also indicated in this figure. These products were identified by comparing their retention times with those of authentic samples. For confirmation, the chemical structures of these products were further verified by proton nuclear magnetic resonance spectrometry (1H-NMR), as explained in Appendix B.
From phenol, compounds hydroxylated at the ortho, para, and both positions of the phenolic hydroxyl group (catechol, hydroquinone, and hydroxyquinol, respectively) were produced, consistent with the report by Tezuka and Iwasaki [18]. As they stated, this hydroxylation is caused by hydroxyl (·OH) radicals generated from water in aqueous solution plasma. Similarly, from guaiacol, compounds hydroxylated at the ortho and para positions (3-methoxy-catechol and methoxy-hydroquinone, respectively) were detected. In addition, catechol was produced by methoxy-to-hydroxyl replacement, while phenol was produced by demethoxylation. From syringol, a compound hydroxylated at the para position (2,6-dimethoxy-hydroquinone) was detected, along with 3-methoxy-catechol from methoxy-to-hydroxyl replacement and guaiacol formed by demethoxylation.
Figure 6 presents the quantification results of the identified aromatic products on the basis of their HPLC peak areas. The total yield of aromatic products (carbon-based) was highest for syringol, followed by guaiacol and phenol. The major products from phenol were compounds hydroxylated at the ortho or para position, with the ortho-hydroxylated products’ yield being approximately twice that of the para-hydroxylated products. This result is reasonable, as phenol has two ortho positions available for hydroxylation. For guaiacol, the major product was catechol formed by methoxy-to-hydroxyl substitution, while the formation of ortho- or para-hydroxylated products and phenol via demethoxylation was minor. Similarly, the methoxy-to-hydroxyl substitution product (3-methoxy-catechol) was the most abundant in syringol, but the para-hydroxylated product (2,6-dimethoxy-hydroquinone) was also produced in relatively large amounts. However, the formation of guaiacol via demethoxylation was rare.
On the basis of these results, the reactions of the lignin aromatic units are summarized in Figure 7. The phenolic hydroxyl group in the aromatic model compounds is an electron-donating group, resulting in relatively high electron density at the ortho and para positions (marked with * in Figure 7). As shown in Figure 7a, hydroxylation is expected to selectively occur at the ortho and para positions through the attack of electron-deficient ·OH radicals at these sites. For phenol, this hydroxylation was the dominant reaction. As shown in Figure 7b, methoxy-to-hydroxyl replacement appears to proceed via the same mechanism as hydroxylation. In guaiacol and syringol, which contain methoxy groups, this reaction was predominant. The preference for methoxy-to-hydroxyl replacement over hydroxylation remains unclear. In Figure 4, the decomposition rate follows the order syringol > guaiacol > phenol, which may be attributed to the increasing number of electron-donating groups, leading to higher electron density in the aromatic ring and greater reactivity with ·OH radicals.
In contrast, as shown in Figure 7c, demethoxylation, or methoxy-to-hydrogen replacement, was observed but rare. This suggests that the reactions of the aromatic model compounds primarily occur in the liquid phase. The formation of ·OH and ·H radicals from water molecules occurs in the plasma region (gas phase) [23]. However, in the liquid phase, ·H radicals immediately react with other species and disappear (e.g., ·H + H2O → H2 + ·OH). On the other hand, ·OH radicals can be present even in the liquid phase [24]. For example, an ·OH radical can react with another one, producing H2O2, which is stable in the liquid phase and can return to ·OH radicals. Thus, ·OH radicals primarily contribute to reactions in the liquid phase. Since the lignin aromatic model compounds have higher boiling points than water, they predominantly remain in the liquid phase, where they react with ·OH radicals, while reactions with ·H radicals, as shown in Figure 7c, appear to be infrequent.
On the other hand, a single peak distinct from the aromatic products is observed from each aromatic model compound at a retention time of approximately 5 min in the HPLC chromatograms shown in Figure 2. This peak appears to contain multiple products, as such an early retention time indicates minimal retention in the column. Since the column used in this study tends to elute compounds with higher polarity and lower molecular weight more quickly, this peak appears to be a mixture of such compounds. Therefore, GC/MS analysis was conducted for the separation and identification of these compounds.
Figure 8 shows the GC/MS total ion chromatograms of the products from the aromatic model compounds. The samples were analyzed after freeze-drying and TMS derivatization. This figure also presents the names and structures of the compounds identified on the basis of the match of mass fragments and retention times with those of authentic samples. From phenol, guaiacol, and syringol, dicarboxylic acids such as oxalic, malonic, and succinic acids were detected, along with hydroxylated dicarboxylic acids including tartronic, malic, and tartaric acids, as well as glycolic acid as a monocarboxylic acid. Figure 9 presents the quantification results of these organic acids based on GC/MS peak areas. For phenol and guaiacol, the peaks of succinic acid and catechol overlapped; therefore, quantification was based solely on mass fragments derived from succinic acid. From all aromatic models, oxalic acid was the predominant organic acid product. The total yield and composition of organic acids showed no significant differences among the aromatic model compounds.
In the GC/MS analysis, some of the products may have partially volatilized during the freeze-drying process. Therefore, 80 mL aliquots from each of the 100 mL aromatic model solutions after plasma treatment were directly subjected to potentiometric titration, yielding pH curves as shown in Figure 10. The consumption of 0.05 M KOH (titration factor: 0.906) at the neutralization points was 11.1, 10.2, and 12.1 mL for the phenol, guaiacol, and syringol solutions, respectively, corresponding to H⁺ concentrations of 6.3, 5.8, and 6.9 mmol/L. On the other hand, the H⁺ concentrations calculated on the basis of the GC/MS analysis in Figure 9 were 5.5, 5.5, and 5.7 mmol/L for the phenol, guaiacol, and syringol solutions, respectively. Since the H⁺ concentrations determined by GC/MS and titration were in close agreement, the loss of organic acids during freeze-drying was minimal, confirming the reliability of the quantification results in Figure 9.
The dicarboxylic acids detected in this study are known to be major products formed during the oxidative degradation of lignin. For example, in the oxidative degradation of guaiacol using H2O2 with chalcopyrite as a catalyst [25], catechol and hydroquinone are initially produced, followed by their oxidation via ortho-quinone and para-quinone intermediates, respectively, leading to oxidative ring cleavage and the formation of dicarboxylic acids such as malonic, succinic, and malic acids. These reactions are all mediated by ·OH radicals. There is also a report that dicarboxylic acids were formed through oxidative cleavage during the decomposition of benzoquinone (para-quinone) in aqueous solution plasma [26]. In the solution plasma treatment of this study, the formation of ortho- and para-hydroxyl compounds and dicarboxylic acids, which are known to be produced during the oxidative degradation of lignin, was confirmed from phenol, guaiacol, and syringol. Therefore, it is inferred that these aromatic model compounds decomposed through pathways largely similar to the previously reported oxidative degradation of lignin [25], driven by the action of ·OH radicals generated in aqueous solution plasma.

3.3. Gaseous Phase Products

Figure 11 shows the quantitative results (mL) of the gases produced during the solution plasma treatment of aromatic model compounds (gap = 1.5 mm, 28 W, 60 min), analyzed by micro-GC. The results are presented by generated volume, but the yield (C-mol%) based on the supplied aromatic model compound is discussed in the next subsection. The main gaseous products were H2, CO, and CO2, with a small amount of CH4 also being detected, while C2 and C3 gases were barely detected. Note that H2 can also be generated from water. In the blank test without aromatic model compounds, approximately 45 mL of H2 was produced under the same treatment conditions. Therefore, although approximately 60 mL of H2 was generated from each aromatic model compound, about 45 mL is considered to originate from water.
The formation of CO and CO2 is considered to occur via dicarboxylic acids rather than directly from aromatic compounds. CO can be generated through decarbonylation, as shown in Figure 12a, while CO2 can be produced via ·OH radical-induced decarboxylation, as illustrated in Figure 12b. To further investigate this process, we conducted an aqueous solution plasma treatment of formic acid, the simplest monocarboxylic acid, and confirmed the formation of both CO and CO2. Although the specific molecular mechanism remains unclear, this result indicates that CO and CO2 can be formed from carboxylic acids. H2 can be generated during the progression of decarboxylation and decarbonylation.
On the other hand, CH4 can be generated through demethylation at the methoxy group, as shown in Figure 13a. In this process, catechol is formed from guaiacol. In Section 3.2, the formation of catechol from guaiacol was attributed to methoxy-to-hydroxyl substitution; however, it can also occur through demethylation. Nevertheless, demethylation is considered a minor or negligible reaction. This is because despite the number of methoxy groups being zero in phenol, one in guaiacol, and two in syringol, the CH4 yield from syringol was the lowest. Therefore, CH4 is more likely derived from the carbon backbone of dicarboxylic acids rather than from methoxy groups, while catechol formation primarily occurs via methoxy-to-hydroxyl substitution. When methoxy-to-hydroxyl substitution takes place, the detached methoxyl (·OCH3) radical is expected to decompose into H2 and CO rather than into CH4, as illustrated in Figure 13b.

3.4. Decomposition Behavior of Aromatic Model Compounds

Figure 14 shows the product yields, including unreacted feedstocks, from phenol, guaiacol, and syringol after aqueous solution plasma treatment (gap = 1.5 mm, 28 W, 60 min). These yields are expressed as carbon yield based on the initial feedstock, and the total should be 100 C-mol% if all products are accounted for. Notably, as the yields are carbon-based, H2 is not included in this figure.
The yield of unreacted feedstock after solution plasma treatment was approximately 38 C-mol% for phenol, 34 C-mol% for guaiacol, and 19 C-mol% for syringol, indicating that syringol underwent the most extensive decomposition. As previously discussed, this is likely due to the greater number of electron-donating groups in syringol. On the other hand, the total yield of aromatic products, organic acids, and gases was approximately 20 C-mol% from phenol, 22 C-mol% from guaiacol, and 27 C-mol% from syringol. Even when the unreacted feedstock is included, the total accounted for only approximately 58 C-mol% for phenol, 56 C-mol% for guaiacol, and 46 C-mol% for syringol, indicating that a significant fraction was not detected within the scope of this study.
To investigate this undetected fraction, the gas bag was rinsed with water and methanol, and the resulting liquid was analyzed by HPLC and GC/MS; however, no peaks corresponding to unreacted feedstock or products were observed. Additionally, no solid products or phase-separated substances were observed in the aqueous solution after the solution plasma treatment. Furthermore, hexane extraction of the aqueous solution followed by GC/MS analysis also did not reveal any detectable compounds. Although the undetected fraction remains an issue for further investigation, the identified products in this study reliably reflect the major reactions occurring in aqueous solution plasma. Nevertheless, the presence of this undetected fraction implies that additional, yet-unidentified reaction pathways may also be involved.
In this paper, the product yields are presented for the case with an electrode gap of 1.5 mm (average discharge power: 28 W). However, similar product distributions were observed at electrode gaps of 0.5 mm (16 W) and 1.0 mm (21 W), indicating that the discharge power had little effect on the distribution of products and affected only the decomposition rate, as shown in Figure 3.
A characteristic feature of aqueous solution plasma treatment of the aromatic model compounds is the relatively low gas fraction among the products. In contrast, plasma treatment of high-volatility compounds such as methanol, ethanol, and 1-propanol predominantly yields gases such as H2, CO, and CO2, with only trace amounts of liquid phase products [12,13]. This suggests that gasification primarily occurs in the plasma region (gas phase). Since high-volatility compounds readily evaporate into the plasma region, gasification proceeds rapidly. In the present study, however, the intermediate products, including aromatic compounds and dicarboxylic acids, have high boiling points. For example, catechol boils at 246 °C, malic acid at 306 °C (at atmospheric pressure), and oxalic acid at 200 °C (at 0.1 Torr) [22]. These intermediates are less volatile and tend to remain in the aqueous phase, where they are protected from gasification.
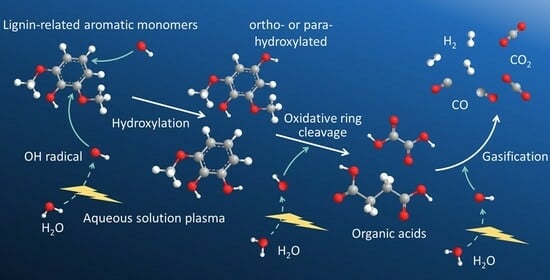
Figure 15 summarizes the decomposition reactions and major products identified in this study. Although this scheme represents the case of phenol, similar pathways are applicable to guaiacol and syringol. First, phenol undergoes hydroxylation at the ortho and para positions, forming the corresponding ortho- and para-hydroxy derivatives. These intermediates are further oxidized to ortho- and para-quinones, which subsequently undergo oxidative cleavage, leading to the ring-opening of the aromatic structure and the formation of dicarboxylic acids. Furthermore, C=C double bonds undergo oxidative cleavage, breaking down into dicarboxylic acids with a lower molecular weight. All these oxidative degradation processes are considered to be mediated by ·OH radicals derived from water. Finally, decarbonylation and decarboxylation occur at the carboxyl groups, leading to the formation of gases, primarily H2, CO, and CO2. However, ortho- and para-quinones were not detected in the aqueous solution by HPLC or GC/MS analysis, suggesting that they are relatively unstable and decompose readily.

4. Conclusions

Aqueous solution plasma treatment was conducted for the fundamental aromatic units of lignin—phenol, guaiacol, and syringol—to investigate their decomposition behavior. The key findings are summarized as follows.
  • The decomposition rate in aqueous solution plasma follows the order syringol > guaiacol > phenol, which may be attributed to the greater number of electron-donating methoxy groups.
  • The decomposition of the aromatic model compounds was mediated by OH radicals, involving hydroxylation of the aromatic ring, followed by ring-opening and fragmentation via oxidative cleavage, leading to the formation of various dicarboxylic acids. Ultimately, decarbonylation and decarboxylation produced H2, CO, and CO2. These results support previously proposed reaction mechanisms [18,19].
  • In guaiacol and syringol, which contain methoxy groups, methoxy-to-hydroxyl substitution occurred more readily than hydroxylation. Demethylation of the methoxy group hardly occurred.
  • The gaseous fraction of the products was relatively low. Since dicarboxylic acids and other intermediates have high boiling points, they may remain in the aqueous phase, hindering their gasification.
These results indicate that aqueous solution plasma treatment offers a promising approach for the production of dicarboxylic acids, particularly oxalic acid, from lignin aromatic units with relatively low power consumption and without catalysts, highlighting its potential for chemical production.

Author Contributions

Conceptualization, E.M.; methodology, T.M. and E.M.; validation, T.M. and E.M.; formal analysis, T.M. and J.A.; investigation, T.M. and J.A.; resources, E.M. and H.K.; data curation, T.M.; writing—original draft preparation, T.M.; writing—review and editing, E.M.; visualization, T.M. and E.M.; supervision, E.M. and H.K.; project administration, E.M. and H.K.; funding acquisition, H.K. All authors have read and agreed to the published version of the manuscript.

Funding

This research was funded by the JST-Mirai Program, grant number JPMJMI20E3, Japan.

Institutional Review Board Statement

Not applicable.

Informed Consent Statement

Not applicable.

Data Availability Statement

The raw data supporting the conclusions of this article will be made available by the authors on request.

Conflicts of Interest

The funders had no role in the design of the study; in the collection, analyses, or interpretation of data; in the writing of the manuscript; or in the decision to publish the results.

Appendix A

Figure A1 shows representative voltage and current waveforms of single-pulse dis-charge when the water temperature was close to room temperature. The power supply used in this study employs a leakage magnetic transformer, which inherently provides constant-current characteristics. As a result, the current waveforms remain almost unchanged regardless of the electrode gap. In contrast, the voltage during the discharge period increases with the electrode gap. This is because a larger gap results in higher impedance between the electrodes, requiring a higher voltage to maintain the same current. Consequently, the discharge power, calculated as the product of voltage and current, increased with the electrode gap.
Figure A2 shows the fluctuations in discharge power and solution temperature during the aqueous solution plasma treatment with an electrode gap of 0.5 mm, 1.0 mm, and 1.5 mm. The 1 min rest periods are excluded, and the figure represents the net discharge time. Both discharge power and solution temperature increase with plasma treatment time; however, the average values over the treatment period are presented in the main text. The increase in discharge power with rising water temperature results from an increase in discharge voltage, presumably due to higher impedance, caused by enhanced vapor bubble formation between the electrodes.
Figure A1. Voltage and current waveforms of single-pulse discharge with an electrode gap of (a) 0.5 mm, (b) 1.0 mm, and (c) 1.5 mm when the water temperature was close to room temperature.
Plasma 08 00014 g0a1
Figure A2. Fluctuations in discharge power and solution temperature during aqueous solution plasma treatment with an electrode gap of (a) 0.5 mm, (b) 1.0 mm, and (c) 1.5 mm.
Plasma 08 00014 g0a2

Appendix B

Figure A3. 1H-NMR spectra (400 MHz, AvanceCore, Bruker, MA, USA) of the products obtained from (a) phenol, (b) guaiacol, and (c) syringol after aqueous solution plasma treatment. The products were freeze-dried, acetylated, and dissolved in dimethyl sulfoxide-d6 before analysis.
Plasma 08 00014 g0a3

References

  1. Boerjan, W.; Ralph, J.; Baucher, M. Lignin biosynthesis. Annu. Rev. Plant Biol. 2003, 54, 519–546. [Google Scholar] [CrossRef] [PubMed]
  2. Lu, X.; Gu, X. A review on lignin pyrolysis: Pyrolytic behavior, mechanism, and relevant upgrading for improving process efficiency. Biotechnol. Biofuels Bioprod. 2022, 15, 106. [Google Scholar] [CrossRef]
  3. Ye, K.; Liu, Y.; Wu, S.; Zhuang, J. A review for lignin valorization: Challenges and perspectives in catalytic hydrogenolysis. Ind. Crops Prod. 2021, 172, 114008. [Google Scholar] [CrossRef]
  4. Kawamoto, H. Lignin pyrolysis reactions. J. Wood Sci. 2017, 63, 117–132. [Google Scholar] [CrossRef]
  5. Vangeel, T.; Schutyser, W.; Renders, T.; Sels, B. Perspective on lignin oxidation: Advances, challenges, and future directions. Top. Curr. Chem. 2018, 376, 30. [Google Scholar] [CrossRef]
  6. Yilin, Y.; Minami, E.; Kawamoto, H. High pressure facilitates delignification of Japanese cedar in supercritical methanol. J. Wood Sci. 2023, 69, 26. [Google Scholar] [CrossRef]
  7. Akyuz, A.; Ozkan, M. Degradation of polyvinylpyrrolidone by solution plasma process. Acta Phys. Pol. A 2017, 131, 343–345. [Google Scholar] [CrossRef]
  8. Wang, R.; Wang, C.; Xing, Y.; Zhang, X. Solution plasma for surface design of advanced photocatalysts. Catalysts 2023, 13, 1124. [Google Scholar] [CrossRef]
  9. Watthanaphanit, A.; Saito, N. Solution plasma applications for the synthesis/modification of inorganic nanostructured materials and the treatment of natural polymers. Jpn. J. Appl. Phys. 2018, 57, 0102A3. [Google Scholar] [CrossRef]
  10. Shiraishi, R.; Nomura, S.; Mukasa, S.; Nakano, R.; Kamatoko, R. Effect of catalytic electrode and plate for methanol decomposition by in-liquid plasma. Int. J. Hydrogen Energy 2018, 43, 4305–4310. [Google Scholar] [CrossRef]
  11. Xin, Y.B.; Sun, B.; Zhu, X.M.; Yan, Z.Y.; Liu, Y.J.; Liu, H. Characteristics of hydrogen produced by pulsed discharge in ethanol solution. Appl. Energy 2016, 168, 122–129. [Google Scholar] [CrossRef]
  12. Minami, E.; Miyamoto, T.; Kawamoto, H. Decomposition of saccharides and alcohols in solution plasma for hydrogen production. Hydrogen 2022, 3, 333–347. [Google Scholar] [CrossRef]
  13. Miyamoto, T.; Minami, E.; Kawamoto, H. Gasification of lower monohydric alcohols by solution plasma treatment and its reaction mechanism. Hydrogen 2023, 4, 373–388. [Google Scholar] [CrossRef]
  14. Diono, W.; Ibuki, T.; Machmudah, S.; Kanda, H.; Bito, M.; Zhao, Y.; Goto, M. Pulsed discharge plasma over the surface of an aqueous solution to induce lignin decomposition. Arab. J. Sci. Eng. 2022, 47, 5923–5934. [Google Scholar] [CrossRef]
  15. Zhou, R.; Zhou, R.; Wang, S.; Ekanayake, U.; Fang, Z.; Cullen, P.; Bazaka, K.; Ostrikov, K. Power-to-chemicals: Low-temperature plasma for lignin depolymerisation in ethanol. Bioresour. Technol. 2020, 318, 123917. [Google Scholar] [CrossRef]
  16. Lee, H.; Park, Y.K. Hydrogen production from a solution plasma process of bio-oil. Int. J. Hydrogen Energy 2020, 45, 20210–20215. [Google Scholar] [CrossRef]
  17. Tange, K.; Nomura, S.; Mukasa, S.; Toyota, H. Production of hydrogen and monomer aromatics by in-liquid plasma treatment of lignin. J. Jpn. Inst. Energy 2018, 97, 171–175. [Google Scholar] [CrossRef]
  18. Tezuka, M.; Iwasaki, M. Oxidative degradation of phenols by contact glow discharge electrolysis. Denki Kagaku 1997, 65, 1057–1060. [Google Scholar] [CrossRef]
  19. Liu, Y.J.; Jiang, X.Z. Phenol degradation by a nonpulsed diaphragm glow discharge in an aqueous solution. Environ. Sci. Technol. 2005, 39, 8512–8517. [Google Scholar] [CrossRef]
  20. Liu, J.L.; Park, H.W.; Hamdan, A.; Cha, M.S. In-liquid arc plasma jet and its application to phenol degradation. J. Phys. D Appl. Phys. 2018, 51, 114005. [Google Scholar] [CrossRef]
  21. Cheng, H.H.; Chen, S.S.; Yoshizuka, K.; Chen, Y.C. Degradation of phenolic compounds in water by non-thermal plasma treatment. J. Water Chem. Technol. 2012, 34, 179–189. [Google Scholar] [CrossRef]
  22. SciFinder, Chemical Abstracts Service. Available online: https://www.cas.org/ (accessed on 1 March 2025).
  23. Sun, B.; Sato, M.; Clements, J.S. Optical study of active species produced by a pulsed streamer corona discharge in water. J. Electrostat. 1997, 39, 189–202. [Google Scholar] [CrossRef]
  24. Schüttler, S.; Schöne, A.L.; Jeß, E.; Gibson, A.R.; Golda, J. Production and transport of plasma-generated hydrogen peroxide from gas to liquid. Phys. Chem. Chem. Phys. 2024, 26, 8255–8272. [Google Scholar] [CrossRef] [PubMed]
  25. Ma, R.; Guo, M.; Zhang, X. Selective conversion of biorefinery lignin into dicarboxylic acids. ChemSusChem 2014, 7, 412–415. [Google Scholar] [CrossRef]
  26. Bratescu, M.A.; Saito, N. Analysis of benzoquinone decomposition in solution plasma process. J. Instrum. 2016, 11, C01009. [Google Scholar] [CrossRef]
Figure 1. Structures of aromatic model compounds and schematic of the solution plasma reactor.
Plasma 08 00014 g001
Figure 2. HPLC chromatograms of aqueous solutions of (a) phenol, (b) guaiacol, and (c) syringol treated in solution plasma (gap = 1.5 mm, 28 W).
Plasma 08 00014 g002
Figure 3. Changes in the recovery rate of lignin aromatic model compounds, (a) phenol, (b) guaiacol, and (c) syringol during the aqueous solution plasma treatment.
Plasma 08 00014 g003
Figure 4. Relationship between the recovery rate and the energy input in the aqueous solution plasma treatment for phenol, guaiacol, and syringol.
Plasma 08 00014 g004
Figure 5. Enlarged HPLC chromatograms of aqueous solutions of (a) phenol, (b) guaiacol, and (c) syringol treated in solution plasma (gap = 1.5 mm, 28 W) for 60 min.
Plasma 08 00014 g005
Figure 6. Aromatic product yields (C-mol%) from phenol, guaiacol, and syringol after aqueous solution plasma treatment (gap = 1.5 mm, 28 W) for 60 min.
Plasma 08 00014 g006
Figure 7. Possible reactions of lignin aromatic model compounds in aqueous solution plasma. (a) replacement of H with OH; (b) replacement of OCH3 with OH; (c) replacement of OCH3 with H.
Plasma 08 00014 g007
Figure 8. GC/MS total ion chromatograms of the products from phenol, guaiacol, and syringol after aqueous solution plasma treatment (gap = 1.5 mm, 28 W) for 60 min. (The * mark indicates aromatic compounds).
Plasma 08 00014 g008
Figure 9. Organic acid yields (C-mol%) from phenol, guaiacol, and syringol after aqueous solution plasma treatment (gap = 1.5 mm, 28 W) for 60 min.
Plasma 08 00014 g009
Figure 10. Titration curves of aqueous solutions of phenol, guaiacol, and syringol (80 mL, 1 g/L each) after solution plasma treatment (gap = 1.5 mm, 28 W) for 60 min (titration factor: 0.906).
Plasma 08 00014 g010
Figure 11. Volume of produced gases (mL) from phenol, guaiacol, and syringol after aqueous solution plasma treatment (gap = 1.5 mm, 28 W) for 60 min.
Plasma 08 00014 g011
Figure 12. Possible reactions of carboxylic acid in aqueous solution plasma. (a) decarbonylation; (b) decarboxylation.
Plasma 08 00014 g012
Figure 13. Comparison between demethylation and demethoxylation of guaiacol in aqueous solution plasma. (a) demethylation; (b) demethoxylation.
Plasma 08 00014 g013
Figure 14. Product yields, including unreacted feedstocks, from phenol, guaiacol, and syringol after aqueous solution plasma treatment (gap = 1.5 mm, 28 W, 60 min), expressed as carbon yield based on the initial feedstock (C-mol%).
Plasma 08 00014 g014
Figure 15. Decomposition of phenol during aqueous solution plasma treatment.
Plasma 08 00014 g015
Disclaimer/Publisher’s Note: The statements, opinions and data contained in all publications are solely those of the individual author(s) and contributor(s) and not of MDPI and/or the editor(s). MDPI and/or the editor(s) disclaim responsibility for any injury to people or property resulting from any ideas, methods, instructions or products referred to in the content.

