Article

Influence of Seat Vibration Frequency on Total Annoyance and Interaction Effects Caused by Simultaneous Noise and Seat Vibrations in Commercial Vehicles

by
Maria Mareen Maravich
1,* and
Ercan Altinsoy
1,2,*
1
Chair of Acoustical and Haptic Engineering, Faculty of Electrical and Computer Engineering, Technische Universität Dresden, 01069 Dresden, Germany
2
Centre for Tactile Internet with Human-in-the-Loop (CeTI), 01069 Dresden, Germany
*
Authors to whom correspondence should be addressed.
Vibration 2022, 5(2), 183-199; https://doi.org/10.3390/vibration5020012
Submission received: 13 January 2022 / Revised: 14 March 2022 / Accepted: 16 March 2022 / Published: 23 March 2022

Abstract

:
In vehicles, noise and seat vibrations can be perceived by the driver, depending on their signal properties, as annoying or unpleasant. Because perception is a complex process, it is necessary to consider both types of stimuli at the same time to assess annoyance in such situations. A perception experiment was carried out to investigate the interaction between simultaneous noise and seat vibrations, as well as the influence of seat vibration frequency in vehicle situations. For the experiment, acoustic and optical stimuli such as seat vibrations were recorded in a mini excavator and a refuse collection vehicle from the view of the driver. The recordings were prepared for plausible reproduction in a laboratory experiment. The participants of the experiment were presented with two different vehicle scenes with simultaneous noise, seat vibrations and visuals. The average total levels of vibration and noise, as well as the vibration frequency ranges of the various vehicle scenes, were varied. The results suggest that an interaction effect between noise and vibration should be accounted for when assessing total annoyance in such situations. Models for the prediction of the relative total annoyance causes of variations in noise and vibration levels were developed.

1. Introduction

In vehicles, drivers are exposed not only to noise but also to simultaneous vibrations. Both stimuli can be harmful to the health of the driver if the legal limit values are exceeded. However, not only above but also below these limit values, these stimuli can trigger perceived annoyance and have a negative effect on the driver. Although combined noise and vibration situations are to be understood as a multi-modal overall event [1], current guides and regulations are based on evaluations of a single stimuli. Comments in some regulations indicate that both stimuli can have combination effects, but no measures are given for this case [2,3,4]. More information about subjective reactions when both stimuli are exposed at the same time is necessary to predict total annoyance, i.e., whether one or both stimuli mask the annoyance of the other stimulus, increases it, weakens it or does not influence it, and whether these assumptions are only valid in certain level ranges or whether they depend on other signal characteristics.
Studies of simultaneous noise and vibrations regarding annoyance or discomfort can relate to different environments, such as vehicles [5,6,7] or buildings [8,9,10,11]. Subjective reactions to noise or vibrations were determined with different questions to the participants, i.e., in the case of combined stimuli, questions were only asked about noise, only about vibration or about the overall situation. In some of these studies, participants rated different properties of the same stimuli in different sessions. For complex investigations with stimuli consisting of several stimuli, the duration of an experiment is a limiting factor. Collecting different responses from participants for the same stimuli in separate experimental sessions requires longer experimental durations. In their study, Maigrot et al. [12] showed that no differences were observed between collecting partial or total annoyance responses of stimuli with combined noise and vibration in separate sessions or during the same session after each stimulus. With such an experimental design, the same information can be collected in a shorter duration, and it is helpful for experiments if the number of stimuli is high. Regardless, different combined effects were found. In some studies, vibrations had no influence on subjective reactions to a combined noise and vibration stimulus when the participants were only asked about noise annoyance [8,10]. Howarth and Griffin [8] further found that noise changed vibration reactions while investigating reactions based on recorded signals in a building while a train passed by. For lower vibration levels, they described an antagonistic effect, and for higher vibration levels, they described a synergetic effect of noise on vibration annoyance. However, other findings show that vibrations mask the annoyance caused by lower noise levels [5], and others show that noise annoyance seems to be influenced by vibration [11]. Maigrot et al. [12] found that in a session where participants evaluated their total annoyance in a multi-modal scene, significant interaction between noise and vibration were observed. Nicht and Altinsoy [6] assumed that, in a multi-modal situation, examined with regard to combined noise and vibrations in street sweepers, noise is the stronger stimulus, i.e., with a comparable increase in the r.m.s. level of vibration and noise, overall annoyance increases more because of an increase in noise than in the vibration level. These findings are comparable to previous results from Paulsen and Kastka [11]. They found that, in the case of higher noise levels, noise is the main influence for annoyance and that vibrations have little influence. That noise can increase the threshold of vibrations was shown by Meloni and Krueger [13]. They also found that the subjective judgment of one stimulus is not influenced by another stimulus, but the assessment of the overall situation differs. Laroche et al. [7] also investigated the combined effect of noise and vibrations on overall discomfort in passenger cars. They also observed a “masking” effect, where increased vibration levels masked the effect of noise. Morihara et al. [14] investigated the combined effect of high-speed railway noise and vibration on daily life, especially during reading and calculation tasks. Participants then evaluated questions regarding the noisiness of the stimuli, vibration sensitivity as well as the disturbance of their activities due to noise and vibration. They found separate significant effects of noise and vibration, especially on disturbance evaluations; however, no interaction effect between noise and vibration levels was observed. Another summary on the combined effects of vibration and noise on total annoyance can be found in the publication of Trollè et al. [15]. Although the results are not unified in terms of the interaction effect of noise and vibration, it is obvious in all of the available literature that noise and vibration have an effect on total annoyance ratings and should not be investigated separately.
Some authors determined models to predict the subjective response of both stimuli from their results. Available models were compared with each other by Laroche et al. [7], and their differences and similarities, in terms of their results as well as the used input parameters, were explained. A new model for evaluating simultaneous noise and vibration exposure in passenger cars was developed, and equivalent discomfort curves were constructed. Howarth and Griffin [8,9] calculated the total annoyance from the sum of the single reactions and determined the equivalence of noise and vibration. Paulsen and Kastka [11] also chose the same approach for their investigations, compared their results with the equation of equivalence of Howarth and Griffin [9] and found a difference in the size of the slope, which was only half the size. Huang and Griffin [16] predicted total discomfort with a multiple regression model and with a root-sums-of-squares model from the single reactions and concluded that the root-sums-of-squares model rendered a better prediction of the situation.
Due to the different methodologies used in all these studies, such as magnitude estimation with and without reference or numerical scales, as well as the different stimulus contents and environments from which they originated and the different levels or even different units, it is difficult to directly compare these investigations. However, they do provide helpful information about the interaction between both stimuli.
There are other factors that could be taken into account that could influence total annoyance or its evaluation. Huang and Li [17] showed, with investigations about the frequency content of vibration from different micro vehicles, that differences in annoyance ratings with the same frequency-weighted acceleration levels are possible. As another factor, visual content could also influence ratings from participants. An investigation by Hashimoto and Hatano [18] showed that visual context and vibrations could influence sound quality. Additionally, in their investigations, Nicht and Altinsoy [6] used a visual context in a virtual environment. Yokoshima et al. [19] investigated whether negative attitudes towards Japan’s high-speed Shinkansen train line had an influence on noise annoyance for the people living closer to the Shinkansen railways. They found that, as well as negative attitude, vibrations also have a combined effect on noise annoyance.
To investigate interaction in combined noise and vibration situations, the following assumptions are made: (1) the total annoyance caused by simultaneous noise and whole-body vibrations (seat vibrations) is based on an interaction effect between noise and vibration levels, (2) the frequency content of weighted seat vibration has an influence on the total annoyance, and (3) the relationships are linear, and, from the results of the perception experiments, a model for predicting the relative total annoyance of combined noise and vibration can be developed with the help of multiple linear regression.

2. Apparatus

The stimuli were reproduced in the Multi Modal Measurement Laboratory of Technische Universität Dresden [20]; see Figure 1. With this laboratory, it is possible to present simultaneous visual and vibro-acoustic stimuli to participants. Whole-body vibration stimuli from lower-frequency vibrations were reproduced with a six-degree-of-freedom hydraulic motion platform (Hagenbuch Hydraulic Systems AG, Ebikon, Switzerland) with a vehicle seat on it. The platform was expanded by an electrodynamic shaker (ESE 201 Typ 11075, VEB Schwingungstechnik und Akustik WIB, Dresden, Germany) underneath the driver’s seat, which also enabled the reproduction of higher-frequency vertical vibrations. The transfer function of the shaker was compensated with an FIR filter, depending on the subject, before each experiment.
Depending on the frequency content of the reproduced stimulus, crosstalk to the horizontal axes could occur, especially when reproducing strong, low-frequency components with the movement platform. This is important to consider when interpreting the results; see Section 3 and Section 8.
The background noise generated by the platform was approximately 47 dBA at the left-ear position of a seated person, measured with one person wearing the BHS II Headphones by Head Acoustics.
The audio was reproduced by wave field synthesis (IOSONO GmbH Erfurt, Germany). For this purpose, two focused sources were presented to the subjects at the ear level. The room properties were compensated at the position of the two focused sound sources with an FIR filter.
The experimental setup included a projector, which presented the visual content.

3. Stimuli

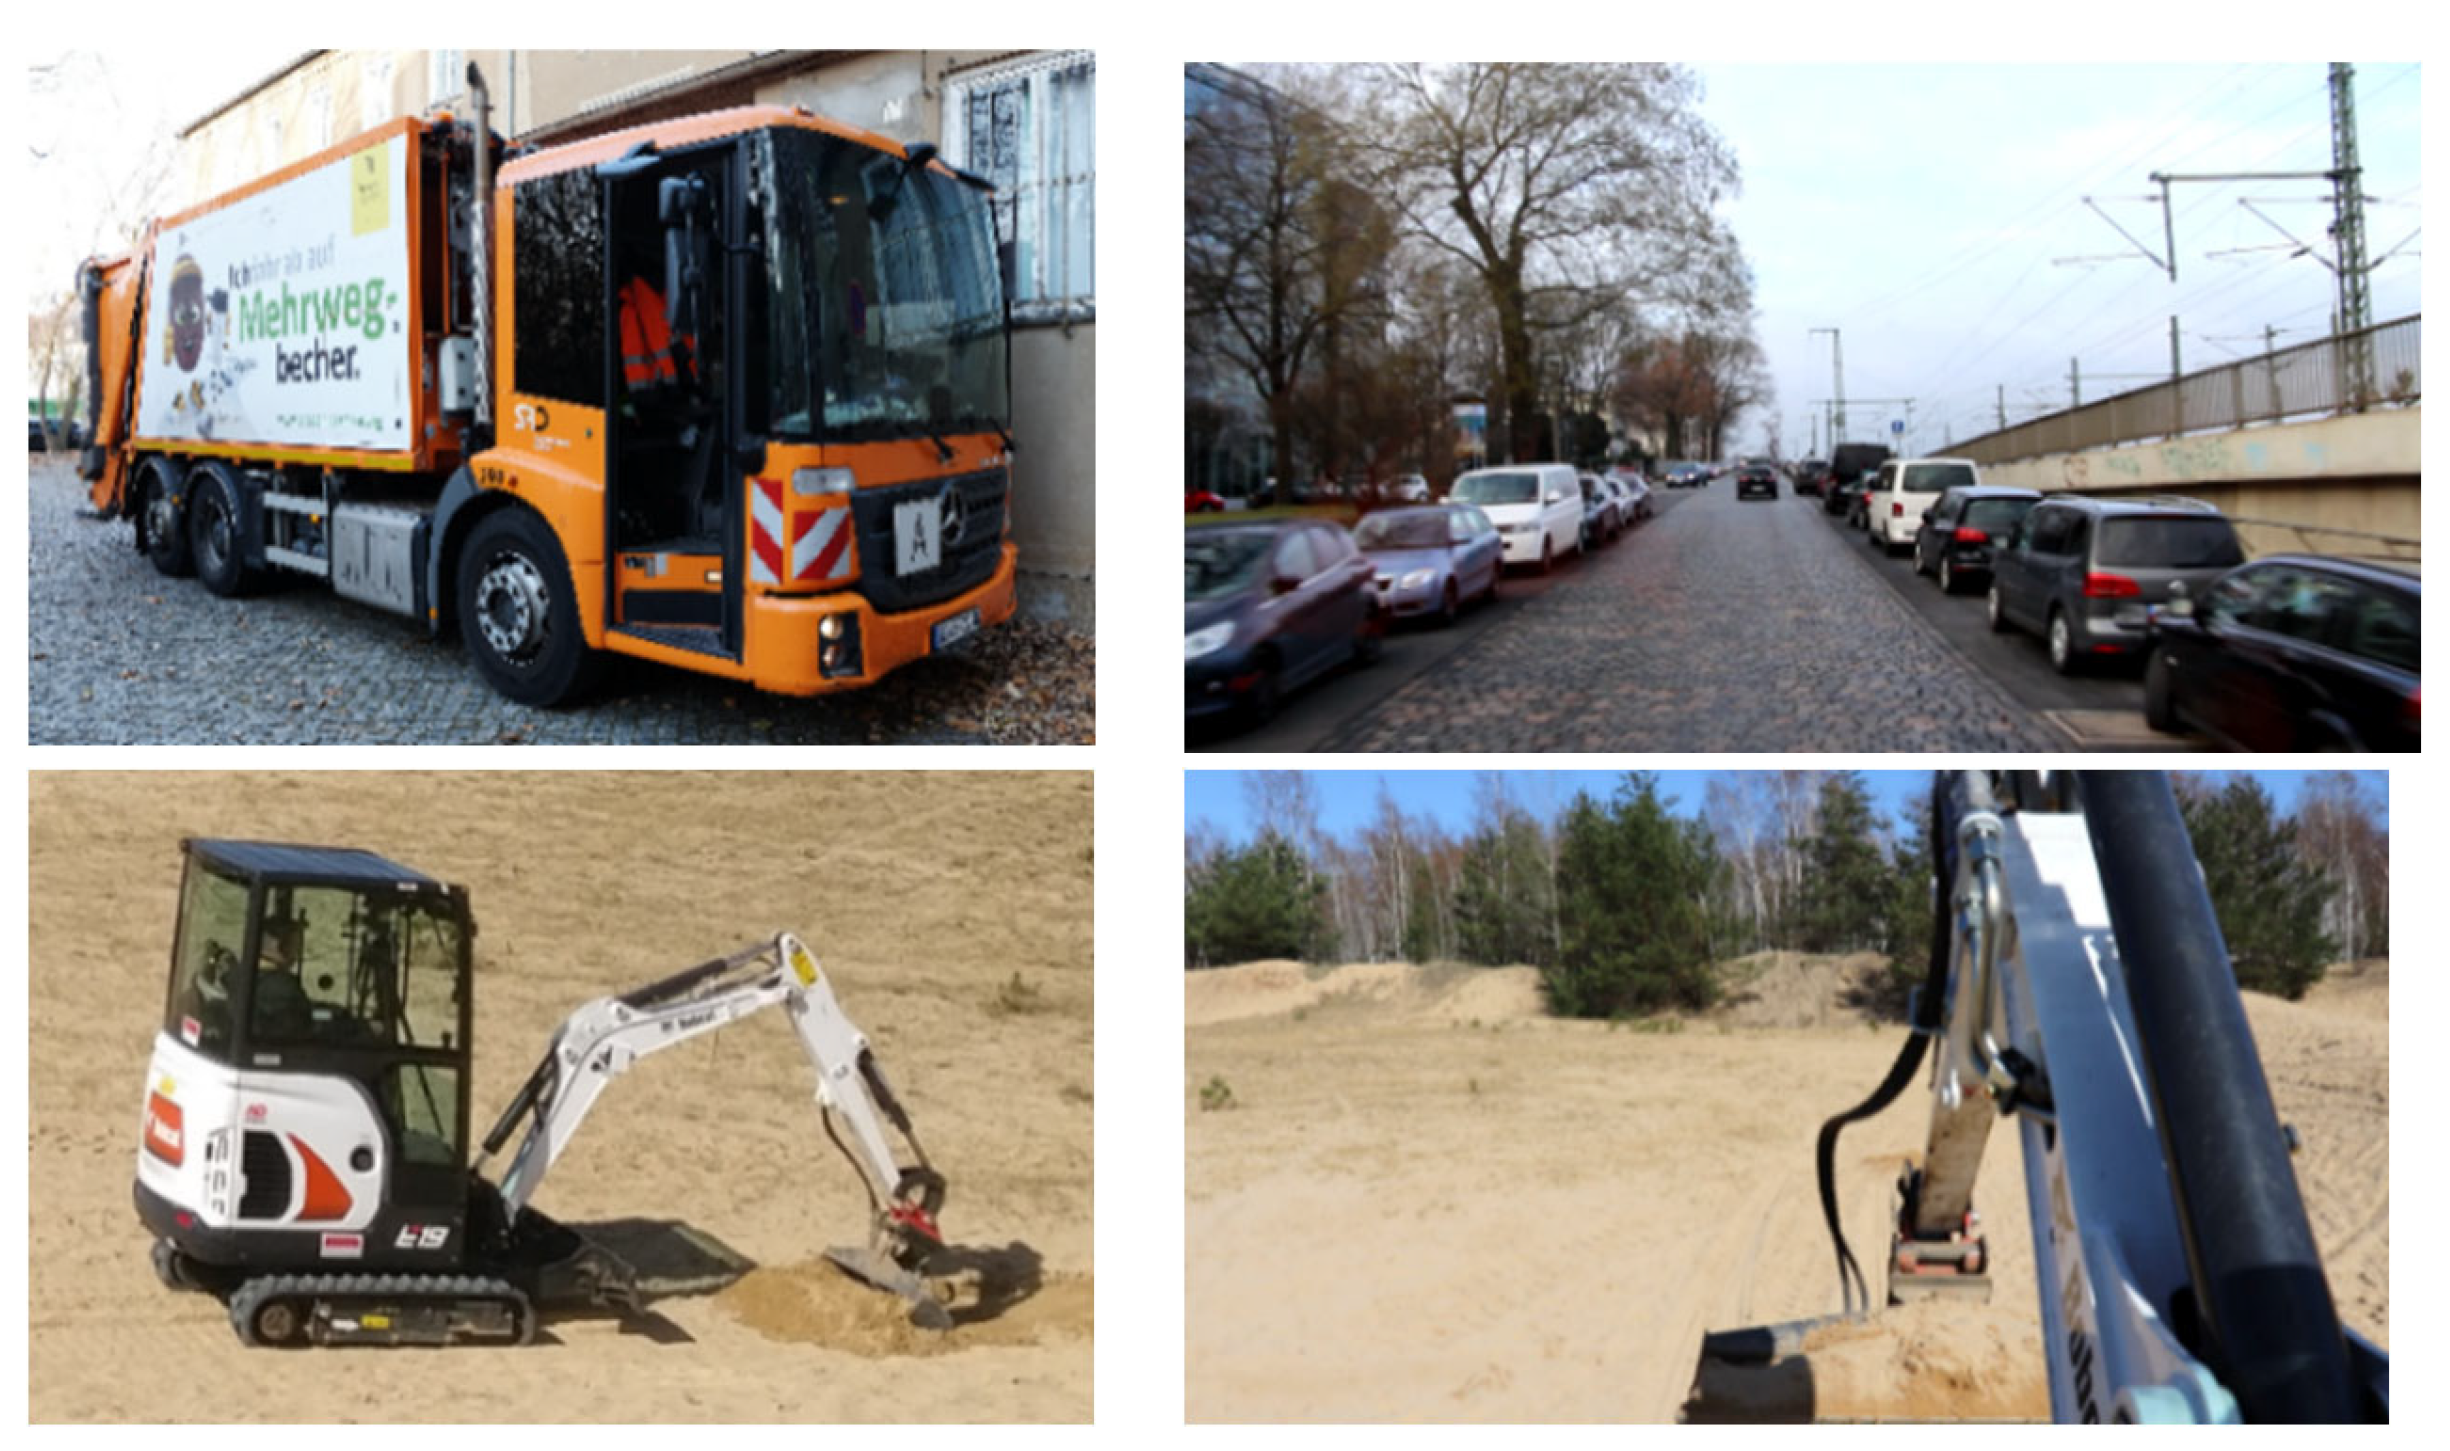
The stimuli for the investigations were recorded in a refuse collection vehicle of Stadtreinigung Dresden, Germany, and in a mini excavator; see Figure 2. The recordings in the mini excavator were carried out in a sand plant. To make recordings of the refuse collection vehicle in the city, refuse collection employees were included in the recording. Seat vibrations (Triaxial Seat Accelerometer Type 4515B, Brüel & Kjær Sound & Vibration Measurement A/S, Nærum, Denmark and Capacitive Accelerometer Type 8305B10, Kistler Instrumente AG, Winterthur, Switzerland), audio recordings in the driver’s ear position (Binaurales Headset BHS II, Head Acoustics, Herzogenrath, Germany and Microphone Type 4188 with Preamplifier Type 2671, Brüel & Kjær Sound & Vibration Measurement A/S, Nærum, Denmark) and camera shots (Camera Type EOS 750D and 800D, Canon, Tokio, Japan) were carried out from the driver’s perspective. The vibrations were measured with both sensors on the center of the driver’s seat surface.
For the investigation, a scene with a length of 7 s was used for each vehicle: the refuse collection vehicle on cobblestones (approx. 20 km/h) and the mini excavator driving forward on sand, see Figure 3. The length of 7 s was determined to be explorative for this experiment and was a compromise between immersion into the scene and the overall length of the experiment. A longer scene would have lengthened the duration of the experiment overall, but a scene that was too short might not have been sufficient to comprehend a multi-stimulus scene. The scenes were plausibly prepared for the experiments in the laboratory and modified depending on the experimental design. Each stimulus consisted of simultaneous vertical seat vibrations, noise in the vehicle and the visual context of the driver’s view.
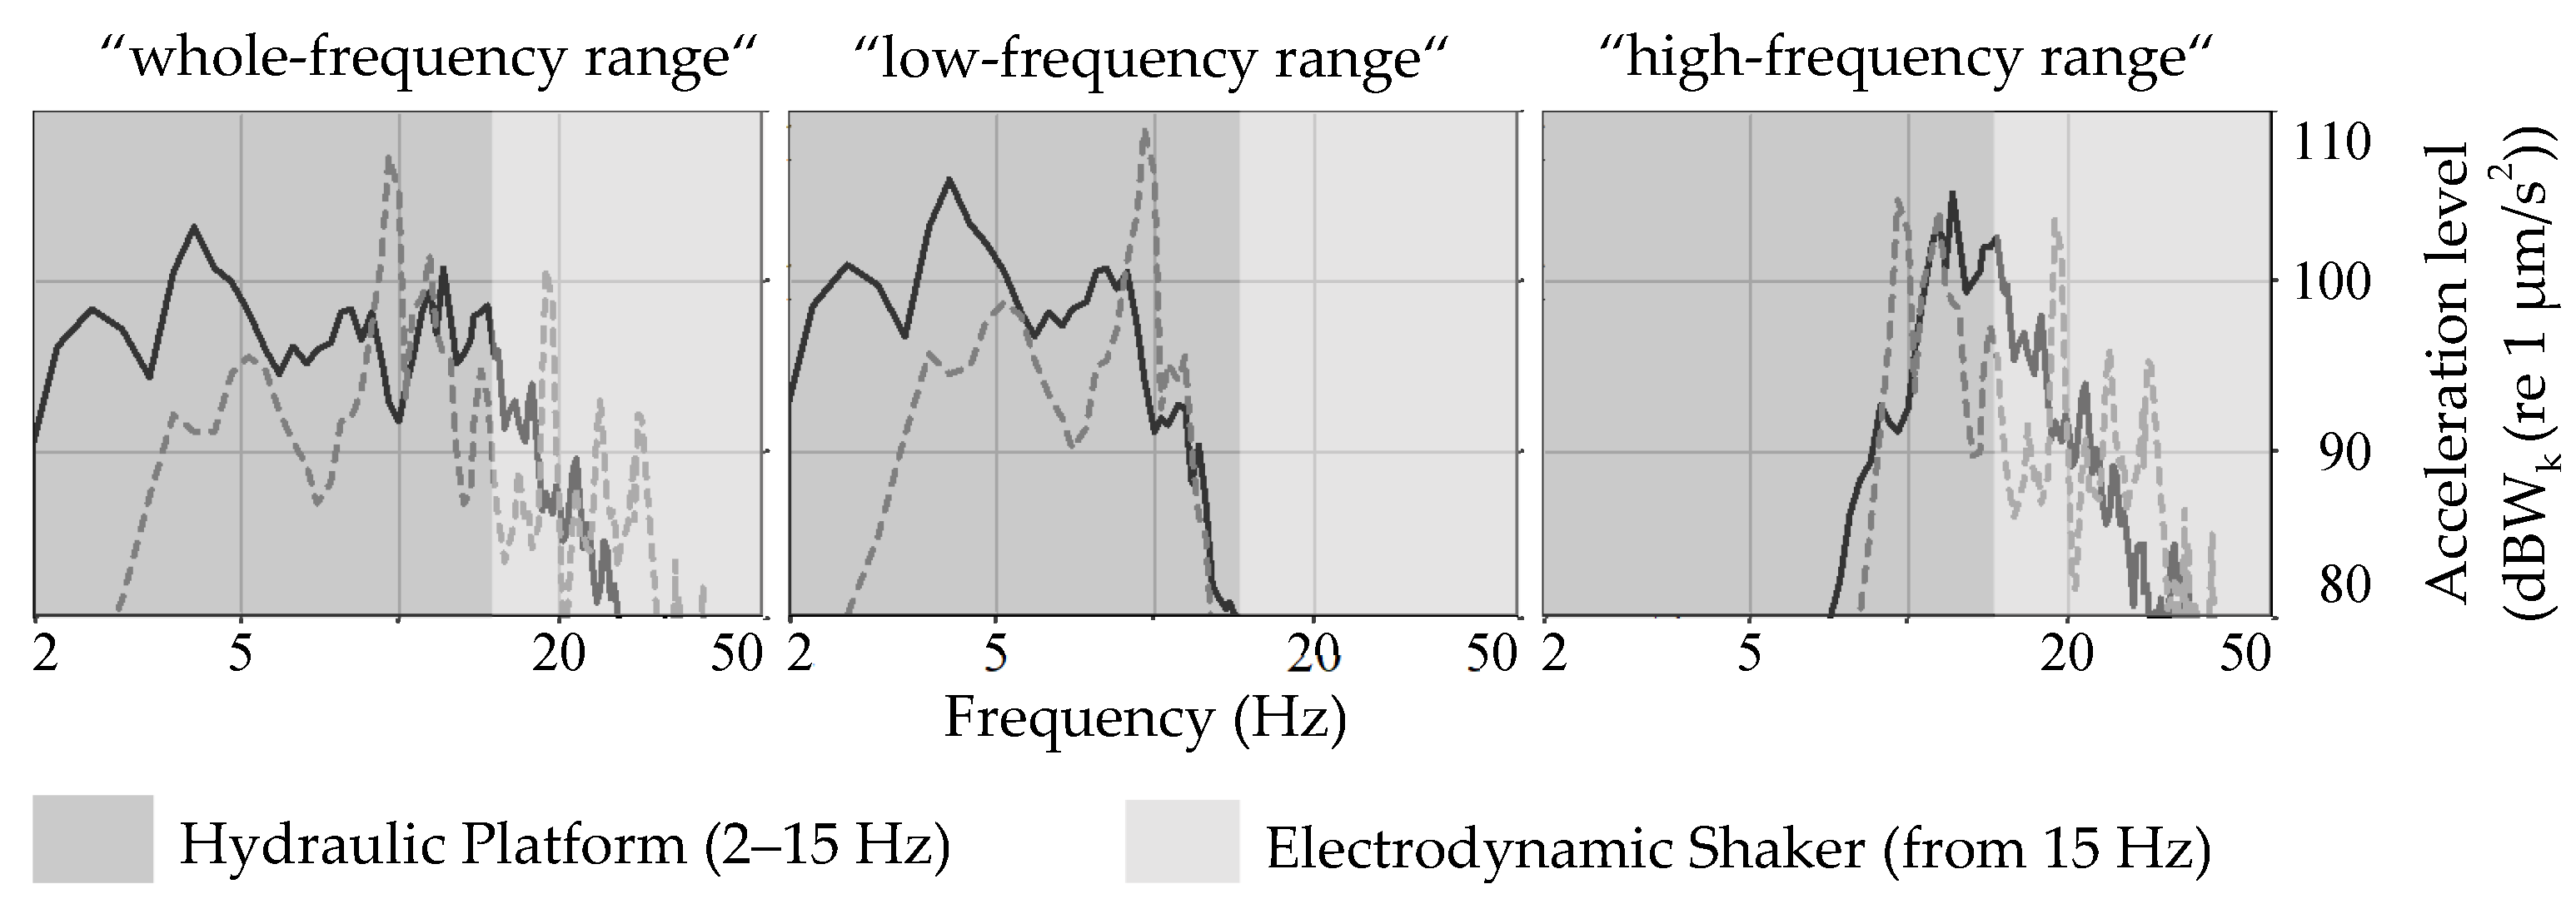
Because there are indications that a lower-level increase is more necessary for the increase in the perceived intensity of the vertical vibration than for the acoustic intensity [21], for each experiment, the average acceleration level was varied in 3 dB steps, and the average sound pressure levels were varied in 6 dB steps. The averaged sound pressure levels were based on the original levels for the refuse collection vehicle (59, 65 and 71) dBA and for the mini excavator (70, 76 and 82) dBA. The following three vibration levels were used: (109, 112 and 115) dBWk (1 × 10⁻⁶ m/s2) corresponding to (0.28, 0.40 and 0.56) m/s2Wk. The vertical vibrations were reproduced for plausible reproduction from 2 Hz. The vibrations were frequency filtered (inverse Chebyshev Filter) into three different areas: the “whole-frequency range” (2–100 Hz), high-pass filtered from 2 Hz, a “low-frequency range” (2–10 Hz), high- and low-pass filtered from 2 to 10 Hz, and a “high-frequency range” (10–100 Hz), which was high-pass filtered from 10 Hz. The reproduction for frequencies from 2 to 15 Hz was carried out with the hydraulic platform, and from 15 Hz, with the electrodynamic shaker (see Figure 4). For each vehicle scene, 27 stimuli were used.
On the seat of the vibration chair in the laboratory with the seat pad (Triaxial Seat Accelerometer Type 4515B, Brüel & Kjær Sound & Vibration Measurement A/S, Nærum, Denmark), crosstalk for the horizontal axis was measured for the used stimuli. To compare and interpret the crosstalk, Wk- and Wd-weighting for vertical and horizontal axes were applied. Crosstalk on the horizontal axis was only observed in the low-frequency range. For the mini excavator scenes for all stimuli conditions, the levels of the y-axis were not at a perceptible range below 85 dBW, and for the x-axis for the highest-level condition (115 dBWk) and all three frequency conditions, approximately 93–96 dBW. For the other level conditions, the levels were lower. For the refuse collection vehicle scene, the average weighted level for the x-axis was also 93–96 dBW for all frequency conditions for the highest-level condition (115 dBWk), but for the x-axis, only for the stimuli with frequency content below 10 Hz (2–10 Hz and 2–100 Hz) was the level 87–90 dBW, and thus higher than the high-frequency condition (10–100 Hz) of this scene and also higher than the level of the mini excavator in this axial direction. This means that the refuse collection vehicle scenes with the low-frequency content (2–10 Hz and 2–100 Hz) might be perceived as more annoying, and this should be validated in the discussion based on the results.

4. Design and Methodology

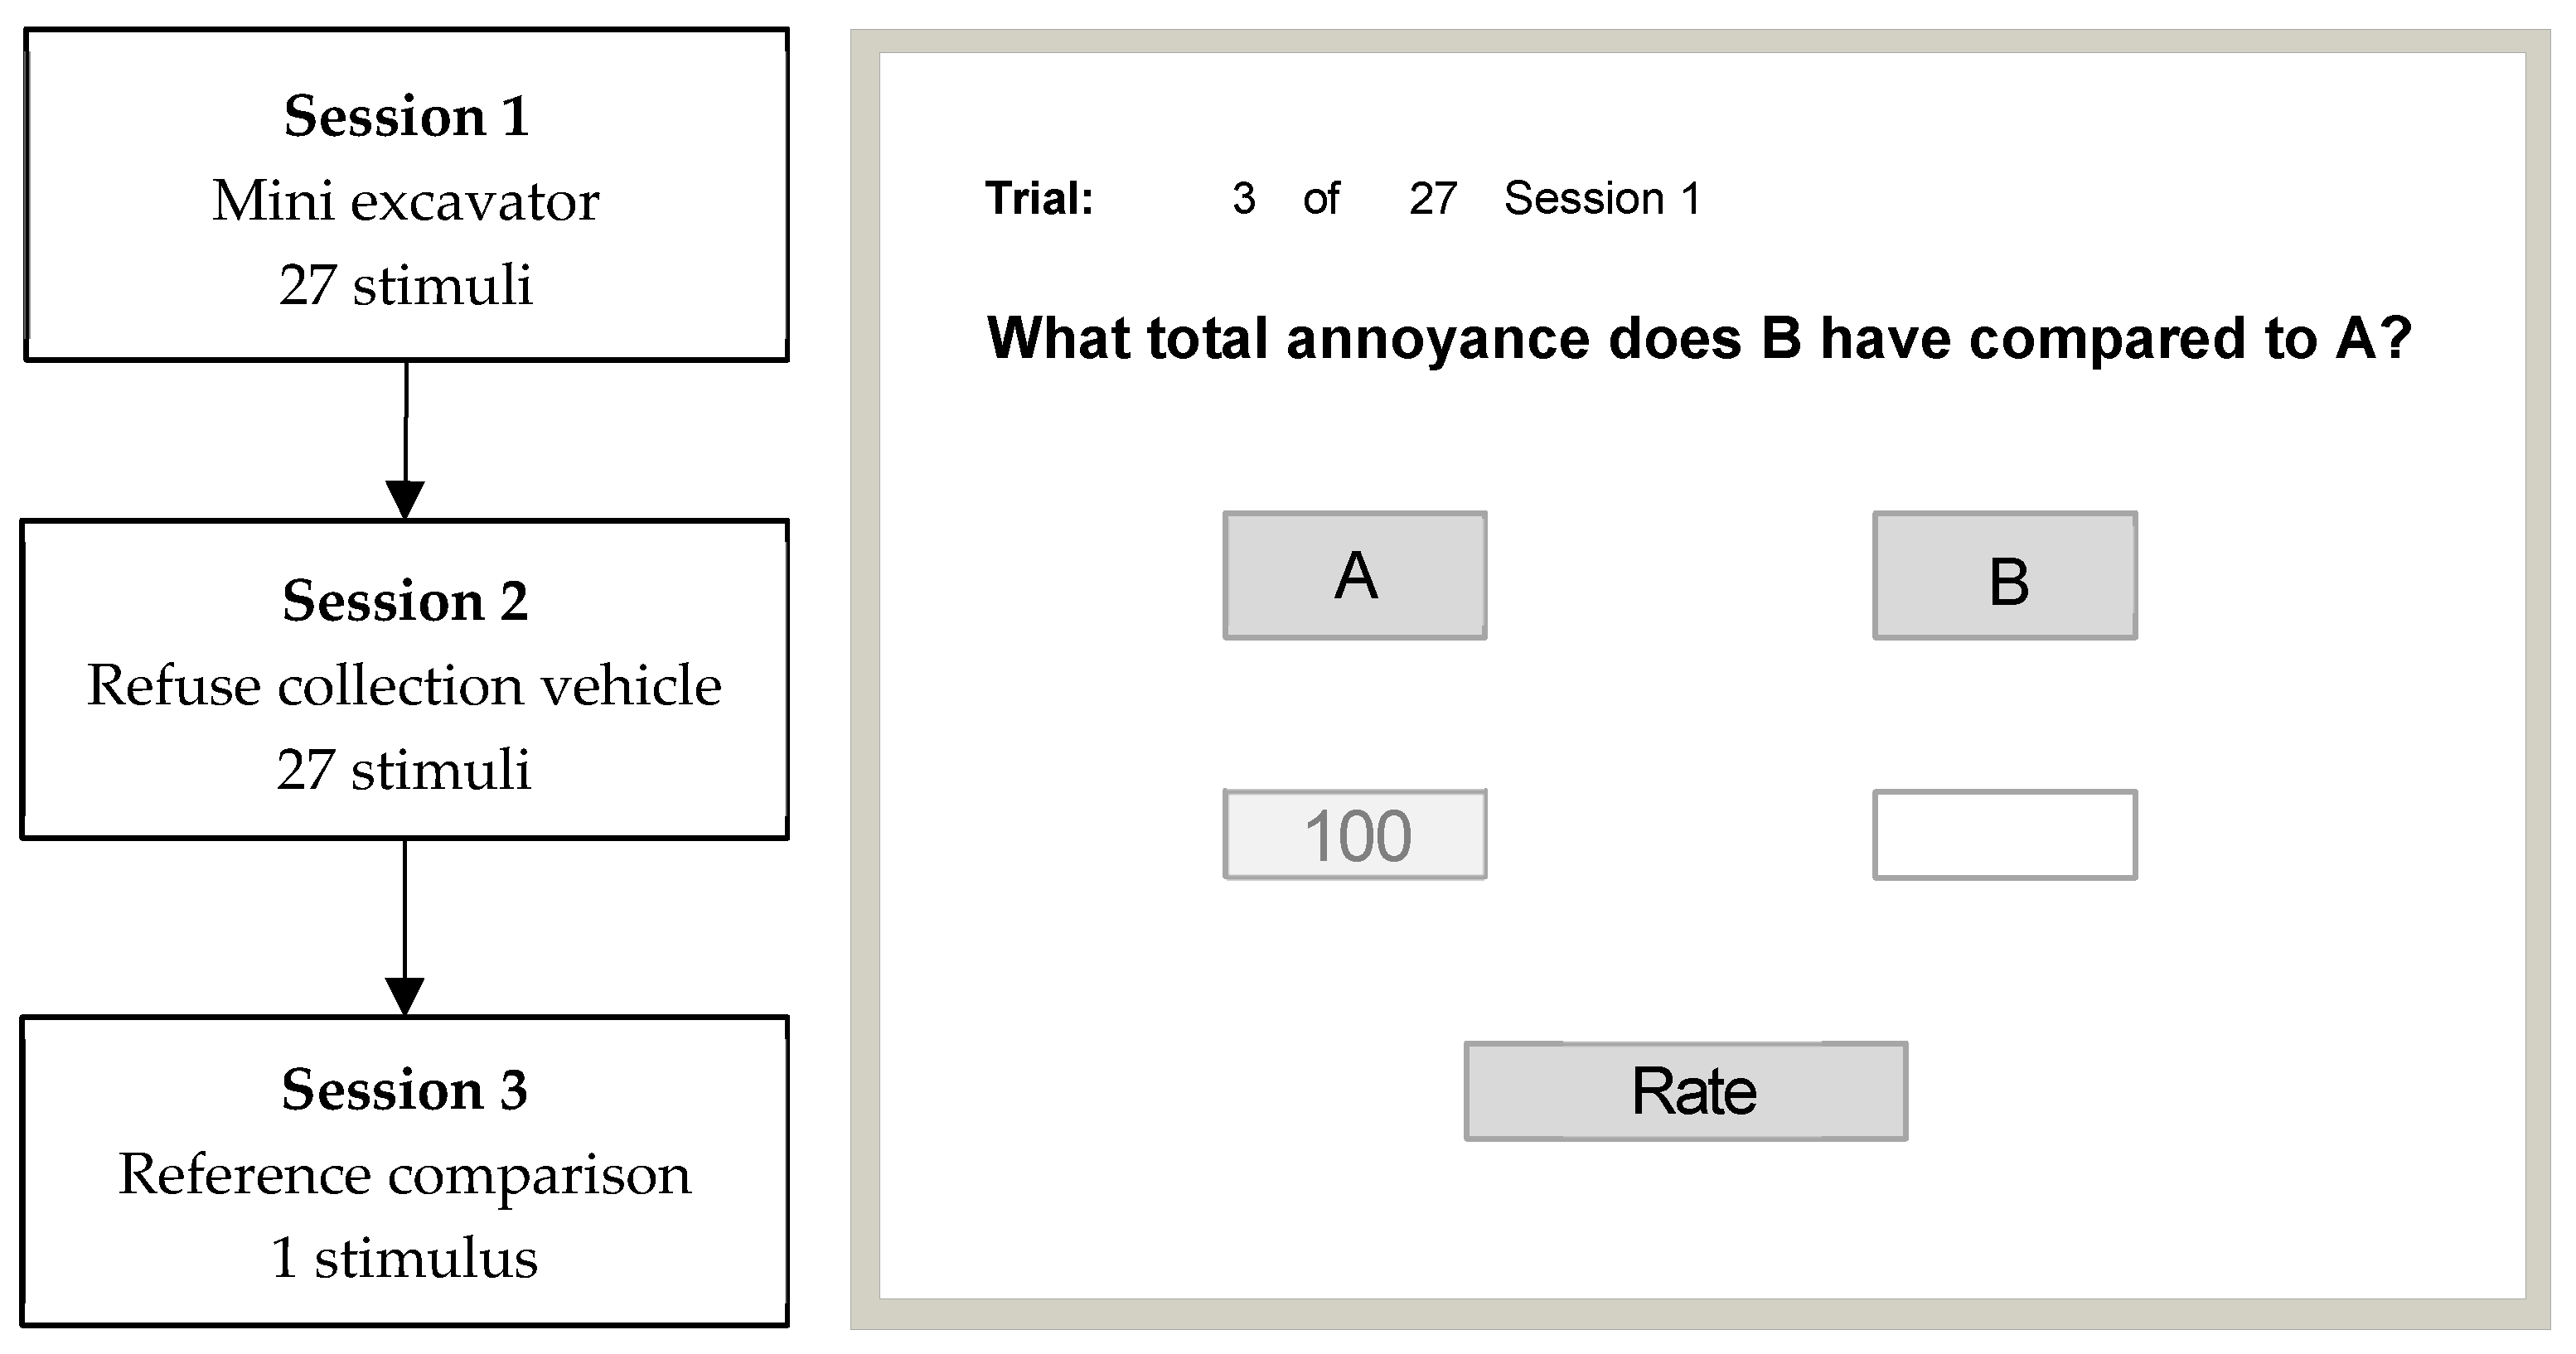
The GUI in Figure 5 was used for the participants to play and evaluate the stimuli. Magnitude estimation with a reference was chosen as the test method. The numerical value of the reference stimulus, called “A”, was 100. The test stimulus, called “B”, was evaluated in comparison to “A”. To evaluate a stimulus, the reference was first played using button “A”, and then a test stimulus was played using button “B”. The participants entered their evaluation in the empty field and then loaded a new stimulus using “Rate”. Because of two different visual contexts for each commercial vehicle, shown in Figure 2, and to investigate the relative total annoyance, each vehicle scene was evaluated in a separate session with a separate reference stimulus corresponding to the scenes, consisting of noise, vertical seat vibrations and a video clip. Both reference stimuli, one for each scene, consisted of the medium sound and acceleration levels and the signal with the widest frequency band, i.e., “2–100 Hz”. The video clip for each stimulus, meaning the test and reference stimulus, was always the same in each session. The whole experiment was divided into three sessions, which were carried out one after the other: first, 27 mini excavator scenes were evaluated in comparison to [1] (Session 1), and then, 27 refuse collection vehicle scenes were evaluated in comparison to [2] (Session 2). In the third and last session in this experiment (Session 3), the two references were compared, and the refuse collection vehicle was the reference in this comparison. The stimuli of session 1 and session 2 were presented in a randomized order.

5. Participants

Twelve healthy participants, aged 25 to 57 years, voluntarily attended the experiment. The median age of all participants was 32.5 years. A total of 2 of the participants were women, and 10 were men. The majority of the participants were students and staff at the university.

6. Statistics

The individual scenes were separately statistically evaluated using parametric methods. A three-factor analysis of variance (Repeated Measures ANOVA) was carried out with log-transformed data using IBM SPSS Statistics. The groups were checked for sphericity, and the line of freedom was corrected using Greenhouse–Geisser adjustment if this was violated. The results are interpreted with a stricter significance level of 1%. In the Section 7, the statistical results of the mini excavator are discussed first, followed by those of the refuse collection vehicle.

7. Results

All 27 stimuli groups of each scene were checked for normal distribution using the Shapiro–Wilk test (α = 5%). In total, 75% of the groups of the mini excavator scene and 85% of the groups of the refuse collection vehicle scene were normally distributed. Groups that were not normally distributed according to the Shapiro–Wilk test were visually checked using a histogram, and the deviations from the normal distribution of these groups were classified as low.
The reference scene (numerical value 100) in each session was also presented as a test stimulus and could provide information about the reliability of the evaluations. For the refuse collection vehicle scene, 11 participants evaluated the reference as 100 and 1 participant as 110. For the mini excavator scene, 6 participants evaluated the reference as 100, and 5 did not. The answers from those participants varied from 75 to 120.

7.1. Main Effects

The results are shown in Figure 6. The total annoyance of the three vibration frequency ranges of the mini excavator and the refuse collection vehicle scene did not differ significantly from each other (F(1.215,13.367) = 2.994, p = 0.101) and (F(2,22) = 3.396, p = 0.052). In contrast, the sound pressure level had a significant influence on the total annoyance in both scenes (F(1.267,13.942) = 47.949, p < 0.001, Ƞ2p = 0.81) and (F(1.312,14.436) = 77.778, p < 0.001, Ƞ2p = 0.88).
Post hoc analysis (Bonferroni-adjusted) showed that all levels of the sound pressure level differences within both scenes differed significantly from each other (p < 0.001). The acceleration level difference also showed a significant influence on the total annoyance in the conducted scenes (F(1.251,13.761) = 25.018, p < 0.001, Ƞ2p = 0.695) and (F(1.136,12.493) = 35.076, p < 0.001, Ƞ2p = 0.761). All level steps within the refuse collection vehicle scene differed significantly from each other (p < 0.001). For the mini excavator scene, the lowest (−3 dB) and the highest (+3 dB) as well as the middle (0 dB) and the highest (+3 dB) acceleration level conditions differed significantly from each other. According to Cohen [22], the strength of both of the main effects “sound pressure and acceleration level” for both scenes could be classified as strong.

7.2. Interaction Effects

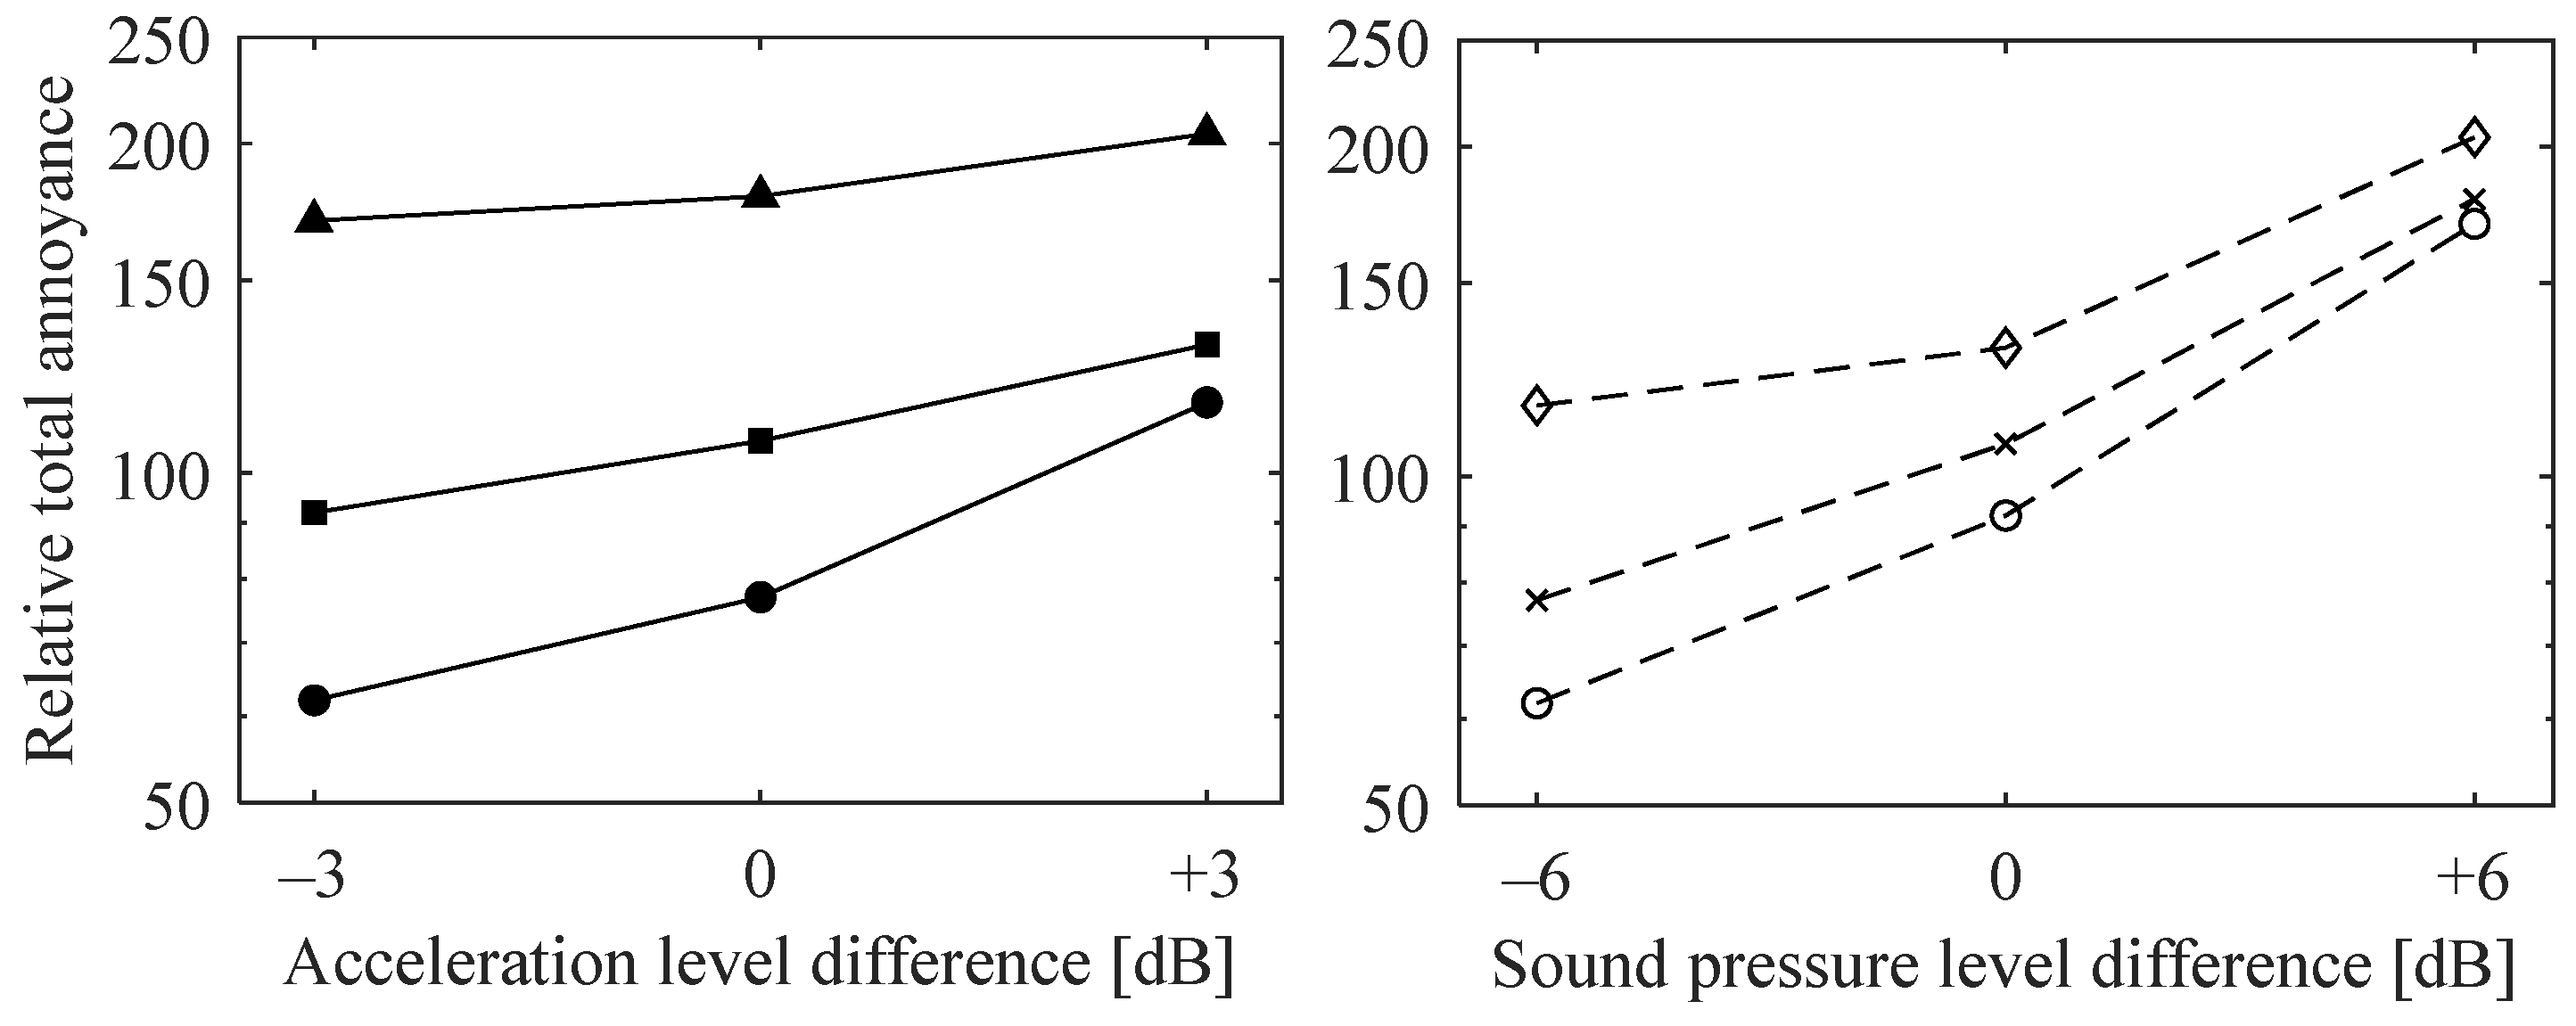
A statistically significant interaction between the sound pressure and acceleration level difference could be determined within both scenes (F(4,44) = 6.996, p < 0.001, Ƞ2p = 0.40) and (F(4,44) = 7.544, p < 0.001, Ƞ2p = 0.41), with a strong effect strength according to Cohen [22]. Figure 7 shows the interaction diagrams for the mini excavator scene. The interaction diagrams for the refuse collection vehicle scene were comparable. The first-order interaction diagrams showed ordinal interaction. At high sound pressure levels (+6 dB), the total annoyance was only influenced by the sound pressure level regardless of the change in acceleration level. At lower sound pressure levels (−6 dB, 0 dB), the acceleration level change had an influence on the total annoyance.
Both of the other first-order interactions, sound pressure level difference and vibration frequency range, as well as vibration frequency range and acceleration level difference, showed no statistically significant effect, taking into account the 1% significance level, for the mini-excavator scene (F(4,44) = 0.654, p = 0.627) and (F(4,44) = 1.445, p = 0.235), or for the refuse collection vehicle scene (F(2.338,25.714) = 0.785, p = 0.485) and (F(4,44) = 2.998, p = 0.028). For a lower level of significance of 5%, however, significant interaction between acceleration level and vibration frequency for the refuse collection vehicle scene was observed. The second-order interaction of all three main factors also showed no significant result for either scene (F(8,88) = 1.225, p = 0.294 and F(8,88) = 0.466, p = 0.877).

7.3. Comparisons between Both References (Experimental Part 3)

The comparison of the reference scenes of both vehicles showed that the reference scene of the mini excavator (geometric mean 192, median 190) was rated approximately two times more annoying than the reference scene of the refuse collection vehicle (100). According to the Shapiro–Wilk test, the log-transformed data were normally distributed. Both scenes had the same Wk-weighted acceleration level with different frequency structures, but the averaged sound pressure level was approximately 10 dB higher in the mini excavator scene than in the refuse collection vehicle scene.

8. Discussions

8.1. Influence of Weighted Vibration Frequency on Total Annoyance

There was neither significant influence of the main factor “(weighted) seat vibration frequency” on the total annoyance with the stricter significance level of 1% nor with a more liberal significance level of 5%. In a study by Maigrot et al. [18], the influence of the frequency content on the perception of annoyance was examined with the help of signals from two different trains. However, no significant effect could be demonstrated. These results are therefore in line with the results of the current study.
In the present study, interaction between the acceleration level and the vibration frequency of the refuse collection vehicle scene with a p value of less than 5% (p = 0.028) was observed. There was no such effect in the mini excavator scene.
The refuse collection vehicle scene contained more low vibration frequency components than the other scene (see Figure 3). This significance suggests the influence of the frequency range depending on the acceleration level. Figure 8 shows this possible interaction. This would mean that signals that only contain vibration frequency components from 10 Hz (10–100 Hz) lead to less annoyance at stronger acceleration levels than signals that only contain vibration frequency components below 10 Hz. However, since the vertical vibrations of the stimuli had the same frequency-weighted acceleration level, this would mean that the frequency weighting for high-vibration frequencies is overestimated by the Wk-weighting and that Wk-weighted vibrations are perceived as more annoying than they are. In the literature [17,23], however, especially high frequencies seem to have more annoying characteristics than suspected in the actual Wk-weighting of ISO 2631-1 [4].
However, this indication of interaction was relativized because of the experimental setup. The motion platform could produce crosstalk to other axes, especially at the lower frequency range, which could be perceived more strongly when the level rose. Because of the crosstalk, it was assumed that the scenes of the refuse vehicle scene with the low-frequency content (2–10 Hz and 2–100 Hz) would be perceived as more annoying than the scene with the high-frequency content (10–100 Hz). Indeed, when evaluating the results, these two stimuli (2–10 Hz and 2–100 Hz) were evaluated as more annoying. The stimulus with the low-frequency range (2–10 Hz) was even perceived as more annoying than the stimulus with the whole-frequency range (2–100 Hz). This can also be explained by the fact that the levels of the horizontal axes were higher for the stimulus with the low frequencies (2–10 Hz). The presence and the effect of several simultaneous axial stimuli can lead to subjectively higher annoyance (see ISO 2631-1 [4]). This could explain the lower ratings of the stimulus with a high acceleration level (115 dBWk) and high-frequency range (10–100 Hz). What cannot be explained by crosstalk on other axes is the fact that the high-frequency stimulus (10–100 Hz) was perceived as just as annoying as the stimulus with the low-frequency content (2–10 Hz) at the middle level (112 dBWk), although there was also crosstalk for the stimulus with the low-frequency content (2–10 Hz), which was higher than for the high-frequency stimulus. This could in turn be an indication that high-frequency content is underestimated in its annoyance, as has already been discussed. On the other hand, the evaluation of all stimuli conditions with the low-level condition (109 dBWk) was almost identical. However, the results of the study are too ambiguous to draw any conclusions from them. For these reasons and because the conditions of the other scene were more homogeneous and there was no effect either, it is assumed for this experiment that there was no interaction between the frequency range and the acceleration level in the examined level range.

8.2. Influence of Noise and Vibration Magnitude Differences and Their Interaction on Relative Total Annoyance

In this laboratory study, with the help of a multi-level experimental design and parametric statistics, it was possible to show that sound pressure and acceleration level, as well as their interaction, had a highly significant influence on the relative change in the overall perceived annoyance in the examined scenes. While a change in the acceleration level leads to a steep increase in the perception of annoyance at low sound pressure levels, a change in the acceleration in combination with higher sound pressure levels leads to no change in total annoyance. This means that a relatively high sound pressure level is the dominant stimulus in a multi-modal situation, but the assessment of overall annoyance is independent of the second stimulus, the vibration. In view of real signals in commercial vehicles below the legal limit values, the sound pressure level seems to be the dominant stimulus in most situations.
Maigrot et al. [24] also examined the overall annoyance in trains and were also able to determine a significant effect of the noise, the vibration and the interaction between the two stimuli. They also used parametric statistics.
In the present study, for lower sound pressure levels, the vibration increased the total annoyance. Huang and Griffin [16] showed similar findings regarding the effects between noise and vibration. They observed that noise assessment is not influenced by vibrations and that the annoyance of vibrations is reduced, i.e., masked. In their study, it seemed that noise was the stronger stimulus, even when only evaluating one modality in the presence of the other. It seems likely that a combination effect is stronger when the noise is lower. However, this assumption for the present study is based on values that are technically classified as below the limits for occupational health and safety.
The evaluation tendency and interaction effect were the same for both scenes, although the sound pressure level of the refuse collector vehicle scene was approximately 10 dB lower than the sound pressure level of the mini excavator scene. Therefore, there seemed to be an effect regarding the relative change in both magnitudes. When a level changes, which “starting point” it is viewed from must be taken into account. This relative effect is largely related to the observed limits of the used levels.

8.3. Prediction of Relative Total Annoyance with Multiple Linear Regression

Multiple linear regression was used to predict total annoyance and to understand whether interaction between sound and seat vibrations is indicated for the prediction. For the dependent and the independent variable (total annoyance and SPL, acceleration level and vibration frequency range), a linear relationship was assumed in this experiment. The prediction of this study is based the following regression Equation (1):
y = b 1 · x 1 + b 2 · x 2 + b 3 · x 1 · x 2 + a
The dependent variable “y” describes the predicted total annoyance. The predictors, i.e., independent variables, are referred to as “x”. In the case of this application and context, the sound pressure level (difference) is denoted as “x1”, and the acceleration level (difference) as “x2”. The coefficients “b” result from the multiple regression calculation performed for this study in IBM SPSS Statistics. For Equation (1), “b1” describes the coefficient of the sound pressure level (Slope SPL) and “b2” the coefficient of the acceleration level (Slope Vibration). In the case of interaction, as the results of the ANOVA in Section 7 already suggest, “b3” will be the coefficient of the interaction term (Slope SPL∗Vibration), where both predictors “x1” and “x2” are multiplied. The multiple linear regressions were performed with log-transformed annoyance ratings. Therefore, in order to regain the numerical ratings as in the perception experiments, “y” has to be inverse transformed as log10(y) in the equations.
Multiple linear regression, using median and mean values of the annoyance ratings of 12 participants for each stimulus, was carried out and discussed. The mean and median values of both scenes are compared in Table 1 and Table 2. To see what difference the median or mean values for the calculations made, the coefficients of Equation (1) were calculated with both values with mean centered predictors, SPLs and acceleration levels; see Table 3. For this application, “mean centering predictors” mean that the level differences were used as predictors, i.e., −6 dB to 6 dB for the SPL and −3 dB to 3 dB for the acceleration level, instead of the absolute level values, i.e., for example, 70 to 82 dBA for calculating the coefficients.
The coefficients of multiple linear regression for both scenes are shown in Table 3.
It was found that, for the “mean model” and “median model”, the coefficients for SPL and acceleration level (Slope SPL, Slope Vibration) and the coefficient for interaction (Slope SPL∗Vibration) of the investigated scenes were highly significant. The inclusion of the interaction term in the “mean model” and in the “median model” led to a significant increase in the adjusted coefficient of determination. For the mini excavator scene, the adjusted coefficient of determination increased from 0.895 to 0.934 for the mean model and from 0.837 to 0.893 for the median model. The refuse collection vehicle (RCV) scene showed the same tendency: the adjusted coefficient of determination increased from 0.914 to 0.952 for the mean model and from 0.880 to 0.920 for the median model. No significant interaction terms were found in comparable studies [8]. However, other studies have confirmed that noise can change the perception of vibration. Aladdin et al. [25], for example, described a perturbation effect from noise to vibration and, based on this, modeled a prediction equation for the total annoyance of random whole-body vibration under the influence of noise. The authors assumed that from the equivalence point of noise and vibration, the noise has a synergetic effect on the total annoyance and, below that, an antagonistic effect. The principle of the prediction equation of the current study is essentially comparable: the interaction term, calculated using multiple regression, produced a comparable effect. In this study, however, the point of change between the reinforcing and weakening effects was created by a selected reference in the experimental design.
The coefficients of the current study for the sound pressure level were comparable, regardless of whether the calculation was made with median or mean values. The coefficient for the vibration in the “median models” was lower in each case than in the “mean models”. The coefficients differed between the scenes. This suggests that other influencing factors could also play a role in total annoyance. For the refuse collection vehicle scene, the regression coefficient for vibration had more weighting than that for the other scene. Because the vibration frequency showed no significant effect and the vibration levels in both scenes were comparable, there must have been other parameters that influenced the ratings. One plausible explanation might be the sound pressure levels. They differed in both scenes and were lower for the refuse collection vehicle scene. It is possible that the perception changed in connection with the lower audio level because the other stimulus, the vibration, became the focus of attention.
The interaction term remained the same in all scenes, with approximately −0.003. If it is noted that the fluctuations in the evaluations of whole-body vibrations are generally higher or very individual, the approach with the median values seems to be more suitable. The values from Table 3 can now be used in Equation (2):
log 10 ( Rel .   total   annoyance )         = ( Slope   SPL ) · Δ L sp dB + ( Slope   Vib ) · Δ L acc dB + ( Slope   Vib * SPL ) · Δ L sp · Δ L acc dB · dB + Intercept
Since the coefficients of Table 3 were determined using mean centering predictors, these coefficients would predict the relative change in annoyance when changing the SPL into “−6, 0, +6 dB” (ΔLsp) and/or the acceleration level into “−3, 0, +3 dB” (ΔLacc). In order to perform a prediction where measured values could be used as predictors, multiple linear regression was carried out without mean centering with the absolute level values, i.e., “70–82 dBA” or “59–71 dBA” and “109–112 dBWk”. Therefore, Equations (3)–(6) predict the total annoyance with the absolute level values of acceleration and sound pressure level:
log 10 ( Rel .   total   annoyance ,   ME Mean )         = 0.334879 · L Aeq dBA + 0.235447 · L a , rms dBW k 0.002729 · L Aeq · L a , rms dBA · dBW k 26.517170
log 10 ( Rel .   total   annoyance ,   ME Median )         = 0.377128 · L Aeq dBA + 0.261778 · L a , rms dBW k 0.003124 · L Aeq · L a , rms dBA · dBW k 29.303009
log 10 ( Rel .   total   annoyance ,   RCV Mean )         = 0.336473 · L Aeq dBA + 0.211261 · L a , rms dBW k 0.002744 · L Aeq · L a , rms dBA · dBW k 23.482724
log 10 ( Rel .   total   annoyance , RCV Median )         = 0.319361 · L Aeq dBA + 0.198864 · L a , rms dBW k 0.002615 · L Aeq · L a , rms dBA · dBW k 21.914177
The other predictors, vibration frequency and the interaction between vibration frequency and acceleration level, were not significant for the mini excavator scene, but the coefficient for low-frequency vibration for the refuse collection vehicle scene was significant (mean values: regression coefficient = 0.042, p = 0.004). Adding this coefficient to the prediction equation would increase the adjusted coefficient of determination from 0.920 to 0.945. The interaction between vibration frequency and acceleration level with the repeated-measures ANOVA was significant, so it was likely, because of the similarity of procedures, that maybe there might have also been an effect for the regression. The difference between the two comparable statistical methods can arise from the differences in the calculations. However, the tendency of the influence of the low vibration frequencies was the same, so the evaluation and discussion of significance in Section 8.1 applies here as well. There was crosstalk to both other axes for the stimuli with the deep-frequency ranges (2–10 Hz, 2–100 Hz), which were the highest crosstalk levels compared to the other stimuli. Therefore, this stimulus was probably perceived as the most annoying stimulus, and this effect occurred in the regression. Due to this experiment, this effect should not be generalized and applied to other vehicles and also not generalized for this special vehicle. This coefficient should not be included in the model. If such an effect had occurred for higher frequencies, however, the coefficient should have been included, because this could not be explained by the experimental setup.
Table 3 shows that the coefficients for the two vehicles were almost identical, with small differences in the Vibration Slope. This suggests that the relative change from a starting point will be nearly identical for other vehicles and can be transferred in this case. It is suggested that for other vehicles, the coefficients from Table 3 with Equation (2) can be used when they have a level range like the vehicle signals under study, i.e., for sound pressure levels from approximately 60 to 70 dBA, the RVC equation, and for level ranges from approximately 70 to 80 dBA, the ME equation, if the relative differences are of interest. If the absolute level should be used as an input parameter, and Equations (3)–(6) should also only be used if the vehicle measurements are in an identical level range.

8.4. Other Influencing Factors on Total Annoyance and Limitations

A study can only provide a limited overview or indications of the real situation. The choice of experimental design and statistical means, as well as the choice of stimuli and the experimental environment, have a decisive influence on the direction of the results and must be evaluated in the context of these. Annoyance evaluations are particularly shaped by the context of the situations in which the stimuli occur and should be interpreted in connection with this. In general, however, realistic measurement environments can have an advantageous effect in experiments.
Vertical vibrations were investigated in this experiment, which gives a good indication of the actual annoyance. Since horizontal vibrations are not uncommon in commercial vehicle situations, the annoyance can increase further depending on the situation. The same also applies to other influencing factors on total annoyance that were not explicitly investigated in this study.
It must also be taken into account that vibration perception seems to be much more individual than noise perception and can therefore be more different between the participants, which is generally a challenge for predictions.
The comfort of the seat in the measuring environment as well as optical stimuli could also have an influence on the total annoyance, but these were constant influencing factors in this experiment. The duration of exposure and adaptation effects are also factors that may influence the application of the results, which is more difficult to achieve in experimental investigations.
Regarding the scene length used in this experiment, it turned out that a scene length of 7 s was sufficient to understand the context. A shorter duration, e.g., 4 s, may possibly be sufficient to judge a multimodal scene, which should be taken into account in future experiments. Nevertheless, the stimuli are likely to be perceived as more annoying with increasing experimental duration, but this influence can be minimized by the randomized presentation of the stimuli.

9. Conclusions

There was no influence of the weighted seat vibration frequency content on the total annoyance for each of the investigated commercial vehicle situations. This is an indication that Wk-weighting can still be used for whole-body vibrations even with simultaneous noise. The highly significant influence of sound pressure and acceleration level, as well as their interaction on different commercial vehicle situations, was demonstrated. The interaction is described as follows: when the sound pressure level increases, the acceleration level has less influence on the perception of the overall annoyance; when the sound pressure level decreases and the acceleration level increases, the simultaneous acceleration level increases the overall annoyance. All stimuli were based on real levels and did not exceed the recommended limit values (e.g., occupational health and safety regulations). It turned out, however, that the relative differences were comparable despite the different sound pressure levels in the two scenes, although the scenes with the higher sound pressure level (approximately 10 dB) were perceived as twice as annoying. Models for predicting the relative total annoyance with significant coefficients of sound pressure and acceleration level and their interaction were proposed with the help of multiple linear regression, and various aspects, such as the median and mean, were discussed. Although interaction between the median and the mean values was shown graphically, the coefficient of the interaction term was significant for both types of models.

Author Contributions

Conceptualization, M.M.M. and E.A.; methodology, M.M.M. and E.A.; investigation, M.M.M.; writing—original draft, M.M.M.; project administration, M.M.M.; formal analysis, M.M.M.; visualization, M.M.M.; funding acquisition, E.A.; supervision, E.A.; writing—review and editing, E.A. All authors have read and agreed to the published version of the manuscript.

Funding

This work was funded by German Research Foundation (DFG, Deutsche Forschungsgemeinschaft) AL1473/7-1 and as a part of Germany’s Excellence Strategy—EXC 2050/1—Project ID 390696704—Cluster of Excellence “Centre for Tactile Internet with Human-in-the-Loop” (CeTI) of TU Dresden.

Institutional Review Board Statement

The study was conducted in accordance with the Declaration of Helsinki, and approved by the Ethics Committee of Technische Universität Dresden (protocol code SR-EK-111032020 and date of approval 12.06.2020).

Informed Consent Statement

Informed consent was obtained from all participants involved in the study.

Data Availability Statement

The evaluation results of the participants can be received from the corresponding authors in anonymized form.

Acknowledgments

The recordings in the refuse collection vehicle were organizationally and personally supported by Stadtreinigung Dresden.

Conflicts of Interest

The authors declare no conflict of interest.

References

  1. Altinsoy, M.E. Auditory-Tactile Interaction in Virtuel Environments; Ruhr Universität Bochum: Ruhr, Germany, 2006. [Google Scholar]
  2. VDI 2057 Blatt 1:2017-08; Einwirkung Mechanischer Schwingungen auf den Menschen—Ganzkörper-Schwingungen. Verein Deutscher Ingenieure, Beuth Verlag: Berlin, Germany, 2017.
  3. TRLV Vibration Teil 1:2015-03; Technische Regeln zur Lärm- und Vibrations-Arbeitsschutzverordnung—TRLV Vibrationen—Teil 1: Beurteilung der Gefährdung durch Vibrationen. GMBl 2015 S. 485 [Nr. 25/26]; Verein Deutscher Ingenieure, Beuth Verlag: Berlin, Germany, 2015.
  4. ISO 2631-1:1997-05; Mechanical Vibration and Shock—Evaluation of Human Exposure to Whole-Body Vibration—Part 1: General Requirements. International Organization for Standardization: Genève, Switzerland, 1997.
  5. Huang, Y.; Griffin, M.J. The effects of sound level and vibration magnitude on the relative discomfort of noise and vibration. J. Acoust. Soc. Am. 2012, 131, 4558–4569. [Google Scholar] [CrossRef] [PubMed]
  6. Nicht, A.; Altinsoy, M.E. Multimodale Lästigkeit von Lärm und Vibrationen in Nutzfahrzeugen. Zeitschrift für Lärmbekämpfung. Heft 2015, 5, 212–216. [Google Scholar]
  7. Piranda, D.; Laroche, L.; Parizet, E.; Bornet, F. Multi-Excitation Discomfort in a Driving Car: Contribution from Sound and Vibrations; Forum Acusticum: Lyon, France, 2020. [Google Scholar]
  8. Howart, H.; Griffin, M. Subjective response to combined noise and vibration: Summation and interaction effects. J. Sound Vib. 1990, 143, 443–454. [Google Scholar] [CrossRef]
  9. Howarth, H.V.C.; Griffin, M.J. The annoyance caused by simultaneous noise and vibration from railways. J. Acoust. Soc. Am. 1991, 89, 2317–2323. [Google Scholar] [CrossRef]
  10. Lee, P.J.; Griffin, M. Combined effect of noise and vibration produced by high-speed trains on annoyance in buildings. J. Acoust. Soc. Am. 2013, 133, 2126–2135. [Google Scholar] [CrossRef] [PubMed] [Green Version]
  11. Paulsen, R.; Kastka, J. Effects of combined noise and vibration on annoyance. J. Sound Vib. 1995, 181, 295–314. [Google Scholar] [CrossRef]
  12. Maigrot, P.; Marquis-Favre, C.; Parizet, E. Two laboratory methods of assessing annoyance due to railway noise and vibration. J. Acoust. Soc. Am. 2017, 142, 3284–3287. [Google Scholar] [CrossRef] [PubMed]
  13. Meloni, T.; Krueger, H. Wahrnehmung und Empfindung von kombinierten Belastungen durch Lärm und Vibrationen. Z. Für Lärmbekämpfung 1990, 37, 170–175. [Google Scholar]
  14. Morihara, T.; Yokoshima, S.; Matsumoto, Y. Experimental study on combined effect of Shinkansen railway noise and vibration on daily activities: A case of reading and calculation tasks. Acoust. Sci. Technol. 2020, 41, 607–613. [Google Scholar] [CrossRef]
  15. Trollé, A.; Marquis-Favre, C.; Parizet, E. Perception and Annoyance Due to Vibrations in Dwellings Generated from Ground Transportation: A Review. J. Low Freq. Noise Vib. Act. Control 2015, 34, 413–457. [Google Scholar] [CrossRef] [Green Version]
  16. Huang, Y.; Griffin, M.J. The discomfort produced by noise and whole-body vertical vibration presented separately and in combination. Ergonomics 2014, 57, 1724–1738. [Google Scholar] [CrossRef] [PubMed] [Green Version]
  17. Huang, Y.; Li, D. Subjective discomfort model of the micro commercial vehicle vibration over different road conditions. Appl. Acoust. 2019, 145, 385–392. [Google Scholar] [CrossRef]
  18. Hashimoto, T.; Hatano, S. Effect of Factors other than Sound to the Perception of Sound Quality, Rome, Italy. In Proceedings of the 17th International Congress on Acoustics, Rome, Italy, 2–7 September 2001. [Google Scholar]
  19. Yokoshima, S.; Morihara, T.; Matsumoto, Y. Combined effect of vibrations on railway noise annoyance. In Proceedings of the 23rd International Congress on Acoustics, Aachen, Germany, 9–13 September 2019. [Google Scholar]
  20. Altinsoy, M.E.; Jekosch, U.; Landgraf, J.; Merchel, S. Progress in Auditory Perception Research Laboratories-Multimodal Measurement Laboratory of Dresden University of Technology; Audio Engineering Society Convention: New York, NY, USA, 2010; p. 129. [Google Scholar]
  21. Merchel, S.; Altinsoy, M.E. Auditory-tactile music perception. J. Acoust. Soc. Am. 2013, 133, 3256. [Google Scholar] [CrossRef]
  22. Cohen, J. Statistical Power Analysis for the Behavioral Sciences; Erlbaum: Hillsdale, NJ, USA, 1988. [Google Scholar]
  23. BS 6841; British Standard. Measurement and Evaluation of Human Exposure to Whole-Body Mechanical Vibration and Repeated Shock. British Standards Institution: London, UK, 1987.
  24. Maigrot, P.; Parizet, E.; Marquis-Favre, C. Annoyance due to combined railway noise and vibration: Comparison and testing of results from the literature. Appl. Acoust. 2020, 165, 107324. [Google Scholar] [CrossRef]
  25. Aladdin, M.; Jalil, N.; Guan, N.; Rezali, K. Perturbation effect of noise on overall feeling of discomfort from vertical whole-body vibration in vibro-acoustic environment. Int. J. Ind. Ergon. 2021, 83, 103136. [Google Scholar] [CrossRef]
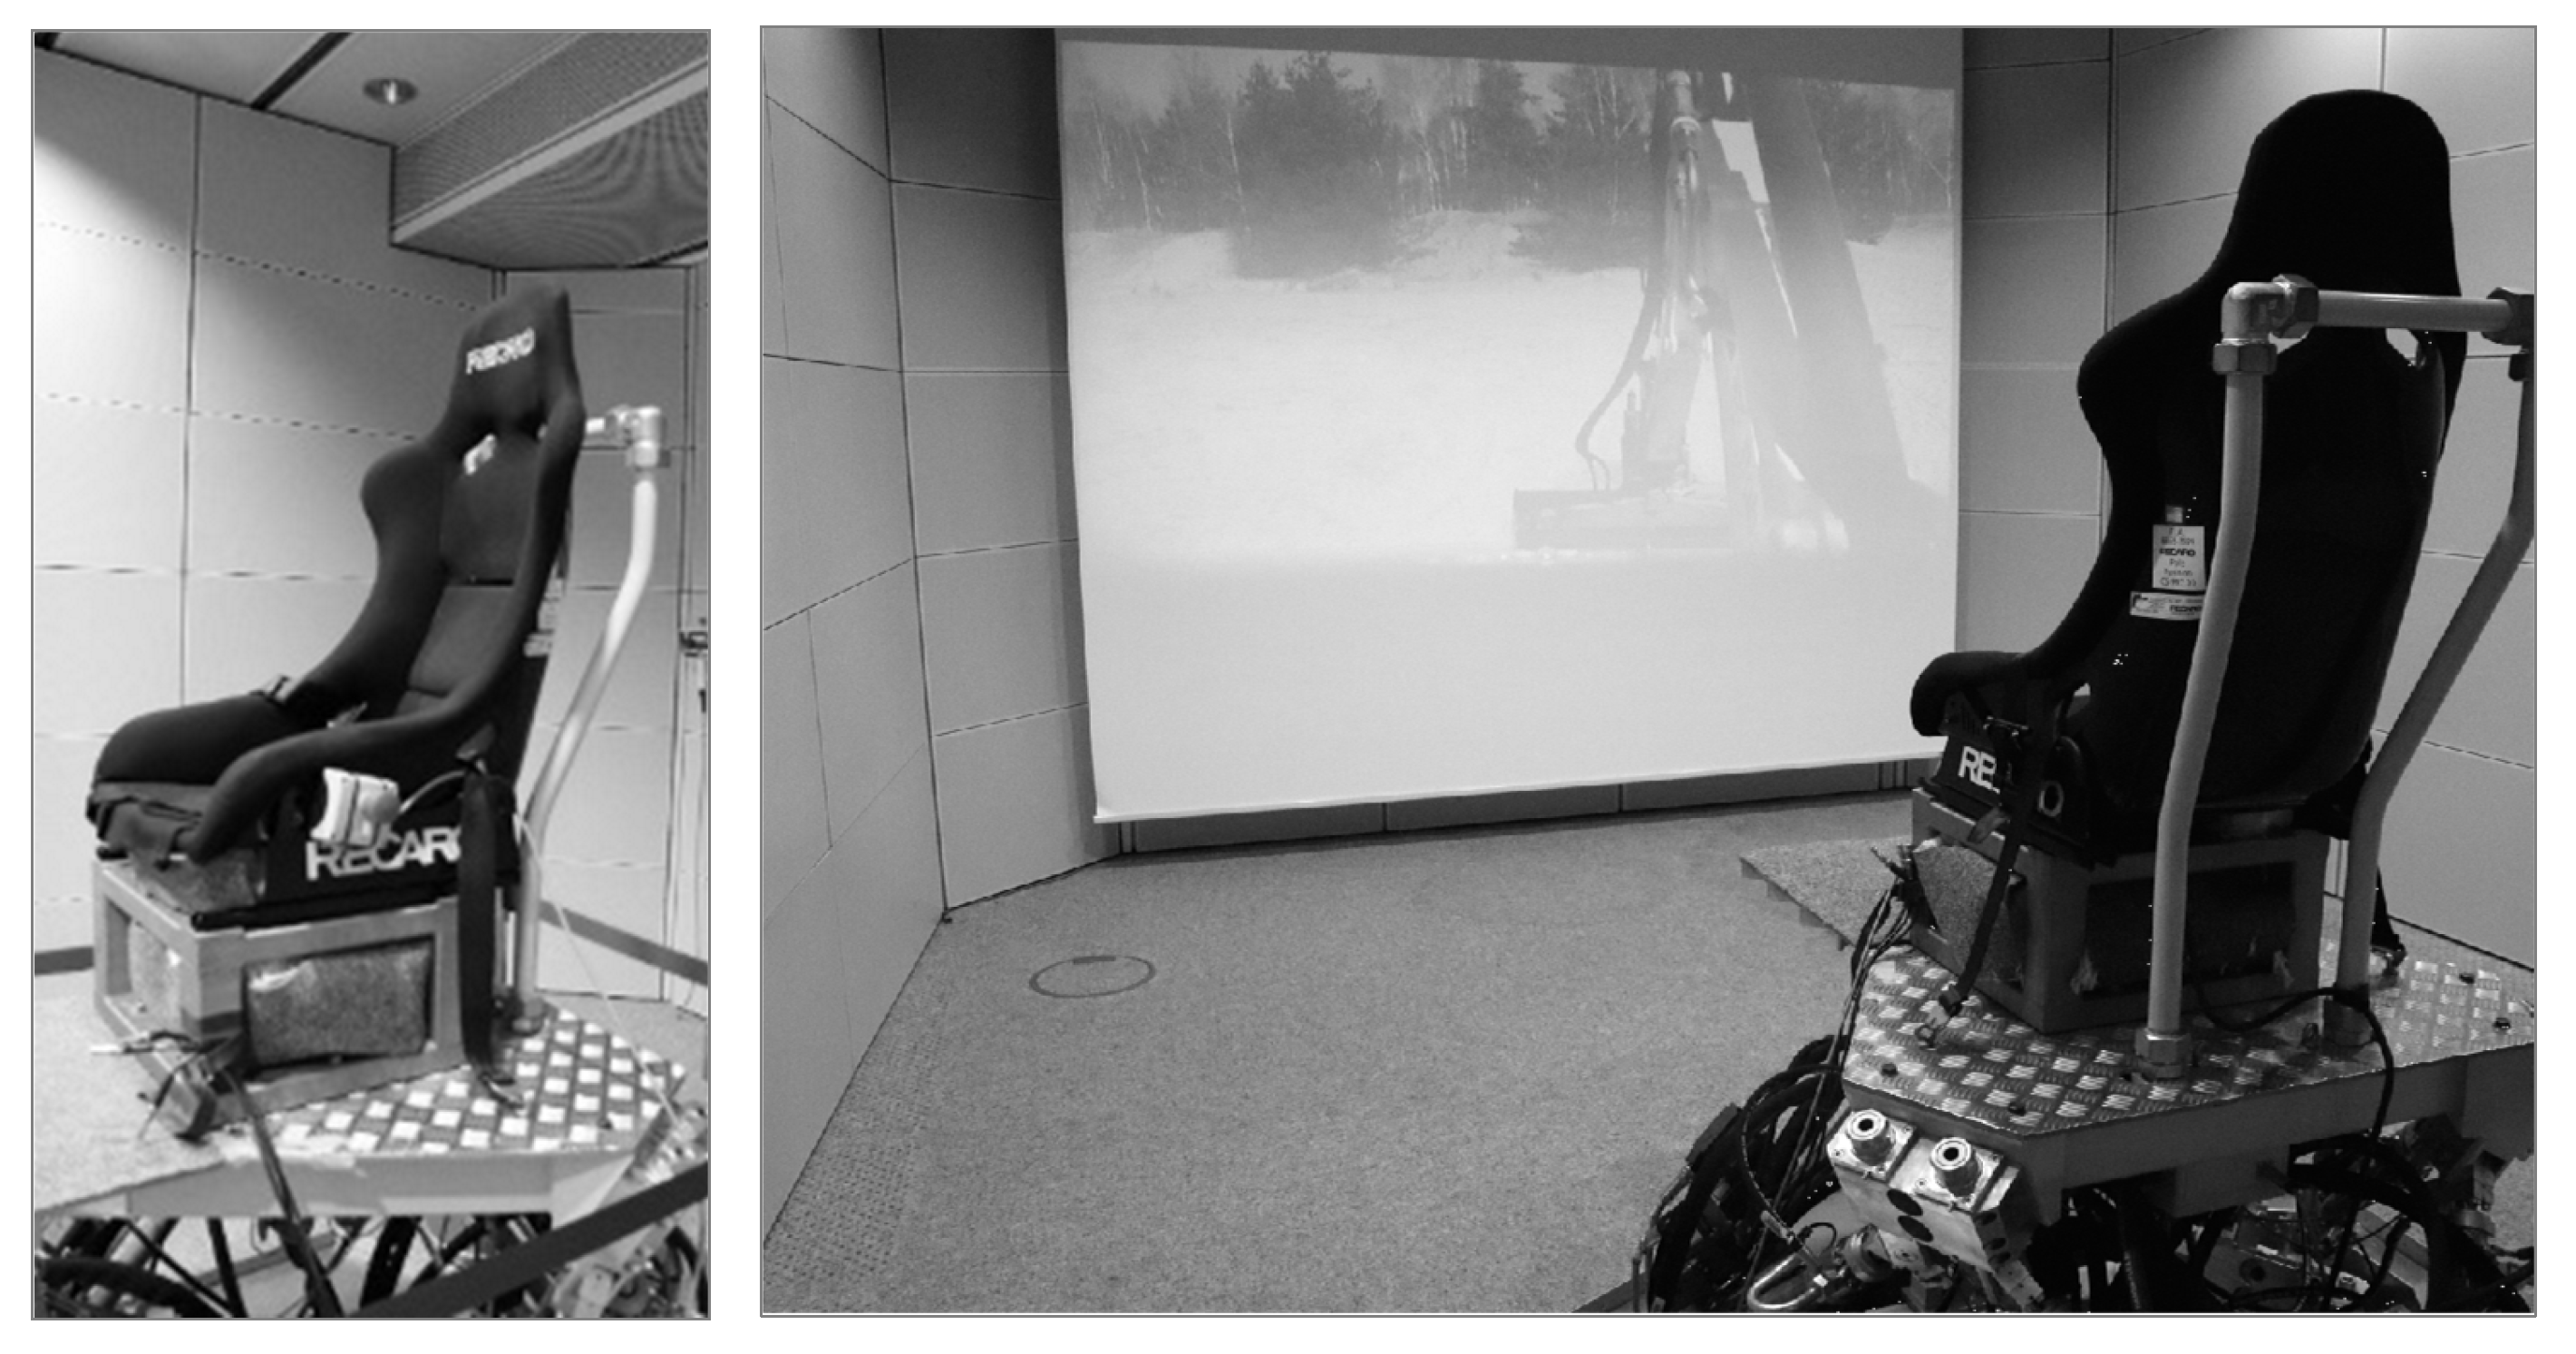
Figure 1. Multi Modal Measurement Laboratory of Technische Universität Dresden.
Vibration 05 00012 g001
Figure 2. Commercial vehicle and driver’s view. Figures at the top: refuse collection vehicle on cobblestone; figures below: mini excavator on sand.
Vibration 05 00012 g002
Figure 3. (a) Examples of A-weighted frequency spectra (FFT: 4096, 50%, HAN) of the sound pressure level for the (i) refuse collection vehicle on cobblestone and (ii) mini excavator on sand. (b) Examples of Wk-weighted frequency spectra: (FFT: 32768, 50%, HAN) of the vertical seat vibrations for the (i) refuse collection vehicle on cobblestone and (ii) mini excavator on sand. Figure at the top: acceleration vs. frequency; figure below: acceleration level vs. frequency.
Vibration 05 00012 g003
Figure 4. Spectra of the selected frequency ranges of vertical seat vibrations and reproduction range of the used systems.
Vibration 05 00012 g004
Figure 5. Figure on the right: Procedure of the experiment; figure on the left: GUI that the participants used to play back and rate the stimuli (the GUI have been translated to English for this figure).
Vibration 05 00012 g005
Figure 6. Geometric mean and standard deviation of the evaluations of all participants of the mini excavator (x) and refuse collection vehicle (o) scene sorted by different vibration frequency from 2 Hz (dark blue), 2–10 Hz (blue) and from 10 Hz (light blue); N = 12.
Vibration 05 00012 g006
Figure 7. Interaction diagrams of the mini excavator scene (sound pressure level, acceleration level); figure on the left: sound pressure level difference ●—−6 dB ■—0 dB ▲—+6 dB vs. acceleration level difference; figure on the right: acceleration level difference ○—−3 dB x—0 dB ◊—+3 d vs. sound pressure level difference; N = 12.
Vibration 05 00012 g007
Figure 8. Interaction diagrams of the refuse collection vehicle scene (acceleration level, vibration frequency range); figure on the left: frequency range ●—2–100 Hz ■—2–10 Hz ▲—10–100 Hz vs. acceleration level difference; figure on the right: acceleration level difference ○—−3 dB x—0 dB ◊—+3 dB vs. frequency range; N = 12.
Vibration 05 00012 g008
Table 1. Geometric mean and median values of the annoyance ratings of the mini excavator scene.
2–100 HzTotal
Annoyance
2–10 HzTotal
Annoyance
10–100 HzTotal
Annoyance
SPL
(dB)
AccL
(dBW)
MeanMedianSPL
(dB)
AccL
(dBW)
MeanMedianSPL
(dBA)
AccL
(dBW)
MeanMedian
701096170701096275701096260
701128080701127880701127472
701151151307011512713070115106115
7610992957610992100761099297
761121001007611211110576112111110
761151181207611515915576115120127
821091741878210919019582109149150
821121691808211218420082112186175
821152152008211520921082115187170
Table 2. Geometric mean and median values of the annoyance ratings of the refuse collection vehicle scene.
2–100 HzTotal
Annoyance
2–10 HzTotal
Annoyance
10–100 HzTotal
Annoyance
SPL
(dB)
AccL
(dBW)
MeanMedianSPL
(dB)
AccL
(dBW)
MeanMedianSPL
(dBA)
AccL
(dBW)
MeanMedian
591095570591095768591095855
5911276755911282855911296100
561151081085611512213556115100105
6510986886510996100651099190
651121011006511213313065112116110
651151421456511517216365115133130
711091481557110917417371109164160
711121701707111218519571112193188
711151941887111521120071115193183
Table 3. Results of a linear multiple regression of the two main factors and their interaction term (ME: mini excavator, RVC: refuse collection vehicle; all predictors are mean centered; *** p ≤ 0.001).
SceneInterceptSlope SPLSlope
Vibration
Slope
SPL∗Vibration
Model with mean values
ME0.942 ***2.072037 ***0.029199 ***0.028021 ***−0.002729 ***
RCV0.957 ***2.075015 ***0.029177 ***0.032919 ***−0.002744 ***
Model with median values
ME0.905 ***2.083175 ***0.027199 ***0.024326 ***−0.003124 ***
RCV0.929 ***2.081055 ***0.026499 ***0.028899 ***−0.002615 ***
Publisher’s Note: MDPI stays neutral with regard to jurisdictional claims in published maps and institutional affiliations.