Article

Alterations in Step Width and Reaction Times in Walking Subjects Exposed to Mediolateral Foot-Transmitted Vibration

1
Dipartimento di Meccanica, Politecnico di Milano, via La Masa 1, 20156 Milano, Italy
2
INAIL (Istituto Nazionale per l’Assicurazione Contro gli Infortuni sul Lavoro), Dipartimento di Igiene del Lavoro, Via di Fontana Candida, 1, 00078 Monte Porzio Catone, Italy
3
Dipartimento di Elettronica, Informazione e Bioingegneria, Politecnico di Milano, Piazza Leonardo da Vinci 32, 20133 Milano, Italy
*
Author to whom correspondence should be addressed.
Vibration 2024, 7(2), 374-387; https://doi.org/10.3390/vibration7020019
Submission received: 7 February 2024 / Revised: 22 March 2024 / Accepted: 11 April 2024 / Published: 14 April 2024

Abstract

:
This study explores how low-frequency foot-transmitted vibration (FTV) affects both gait parameters and cognitive performance. Twenty healthy male participants experienced harmonic mediolateral FTV (1.25 Hz, 1 m/s2) while either standing or walking on a treadmill. We assessed participants’ reaction times to visual stimuli using a psychomotor vigilance task (PVT) test under five conditions, including (i) baseline (standing still without vibration), (ii) vibration (standing still with vibration), (iii) walking (walking without vibration), (iv) walking with vibration, and (v) post-test (standing still without vibration after the tests). Additionally, the step width (SW) was measured with a camera system in conditions (iii) and (iv), i.e., when participants were walking with and without vibration and during PVT execution. The results showed that the average vigilance decreased, and the step width increased while walking and/or with vibration exposure. These findings suggest a potential connection between decreased vigilance, increased step width, and the need for enhanced stability, focusing on balance maintenance and a wider base of support. Implications for future standard revisions are presented and discussed.

1. Introduction

Up to 7% of workers in North America and Europe are exposed to whole-body vibration (WBV) [1,2], putting them at a higher risk of developing vibration-related occupational diseases, including low back disorders, fatigue, neck pain, and headaches [3]. The international standard ISO 2631-1 [4], regulates the measurement, evaluation, and assessment deriving from WBV exposure, but different aspects suggest a revision of the standard [5,6,7]; Foot-transmitted vibrations (FTVs) are a specific type of WBV experienced by people standing still or walking. Several studies emphasized the need for more research on FTVs to understand their unique effects compared to general WBVs [5,6,8]. Many workers, such as seafarers or airplane hostesses and stewards, experience FTV while performing physical tasks like walking. Previous research on how vibration affects cognitive performance has mainly focused on sitting, healthy subjects [9,10,11]. However, in real-world situations, workers often perform mental tasks while walking in environments with vibrations.
To our knowledge, just two prior studies have explored the impact of FTV on the cognitive response of standing individuals. Ishimatsu and colleagues discovered that subjects, when exposed to sinusoidal vertical vibration at 20 Hz and 0.5 m/s2 RMS, did not experience a decline in their performance in target detection or discrimination tasks [12]. At lower frequencies, a deterioration of cognitive performance was evidenced by Marelli and colleagues [13]; the authors examined the cognitive effects by analyzing reaction times (RTs) obtained from the psychomotor vigilance task (PVT) test conducted on 25 standing subjects. Participants were exposed to harmonic horizontal vibration with an amplitude of 0.7 m/s2 RMS and frequencies ranging from 1.5 Hz to 12.5 Hz. The findings indicated that, particularly at low frequencies commonly encountered in transportation settings, there was a decline in vigilance attributable to vibration exposure.
Vibration itself alters gait patterns. Some studies have shown that vertical vibration between 2 and 12 Hz induces people to take longer steps. Research on horizontal vibration has mainly focused on side-to-side movement (mediolateral direction). When exposed to low-frequency horizontal vibration (below 2 Hz), people tend to adjust their walking by taking wider and faster steps to avoid falling [14,15,16,17,18,19].
Finally, engaging in cognitive tasks impacts gait patterns. Hunter and colleagues [20] showed that the addition of either a motor or a cognitive task affects gait performance. Similar findings have been reported in older populations in which the increases in cognitive task complexity while walking speed decreases caused an increase in the stance time [21,22]. Similarly, in young adults, locomotor rhythm and stability of walking decrease when paired with cognitive tasks [23].
Although deciphering the primary influence of cognition, gait, and vibration remains challenging, it is evident that their interaction results in a modified cognitive performance and in a possible alteration of the gait pattern. This aspect is currently overlooked in international standards and regulations, mainly because the existing literature lacks studies that comprehensively address both gait performance and cognition in the context of FTV exposure. For this reason, the main hypothesis investigated in this study was that vigilance metrics and gait strategies can be deteriorated due to mediolateral (left–right direction) FTV exposure while walking over time, causing a higher risk of accidents and injuries in the workers who experienced this condition.

2. Materials and Methods

2.1. Participants

The study enrolled 20 male participants with a height of 179 ± 7 cm (average ± SD, range: 165–191), body mass of 73 ± 8 kg (average ± SD, range: 55–86), and an age of 27 ± 5 years (average ± SD, range: 24–39). Exclusion criteria encompassed lower body injury in the previous six months, current or previous neuromuscular pathology, persistent symptoms of previous orthopedic injury, current or previous long-term WBV exposure, cognitive impairment due to developmental disorders, previous diagnosis of diabetes, current or previous vibration-induced pathology or motion sickness, or concussion. Transport motion sickness was self-reported by the subject using a check box. All experimental protocols conformed to the Declaration of Helsinki and the University’s ethical guidelines and standards (Ethics Committee approval number 09/2021). Signed informed consent was obtained from all subjects prior to participation, and all sensitive data were kept confidential.

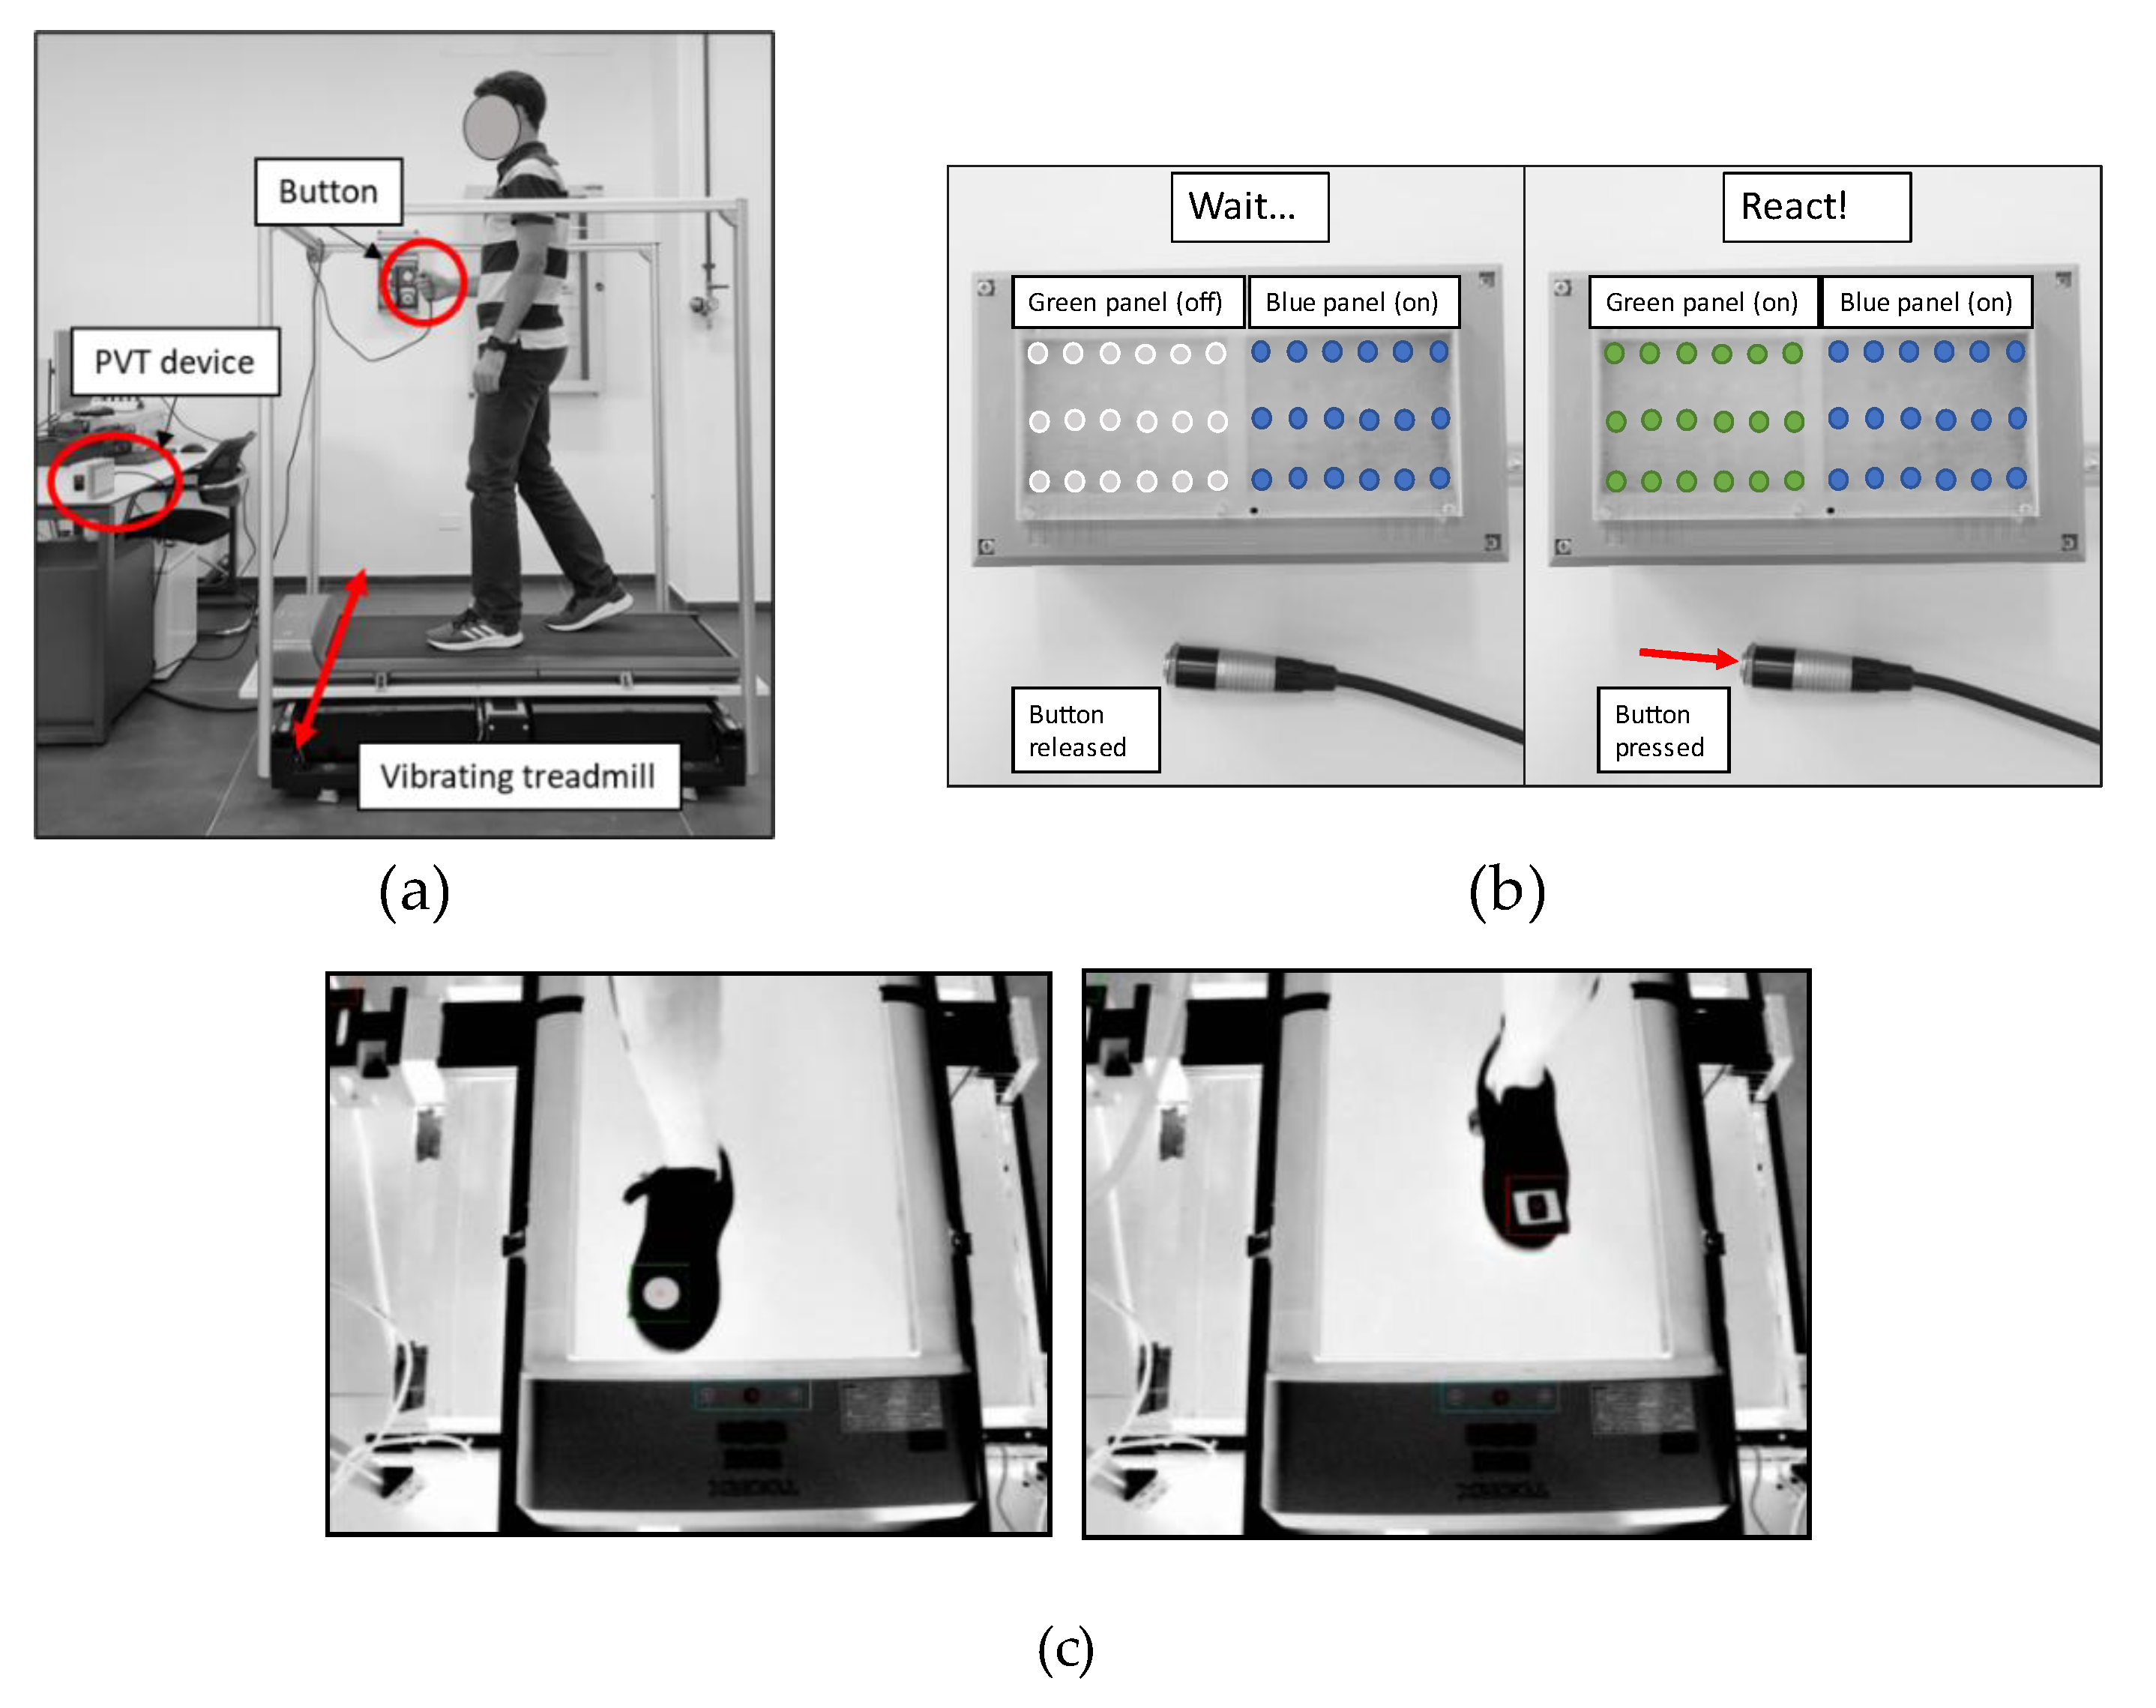
2.2. Experimental Setup

A vibrating platform was purposely developed [24] to impose mediolateral FTV on subjects walking on a commercial treadmill (Toorx walking pad, Garlando S.P.A, Pozzolo Formigaro, Italy) (Figure 1a). Participants were exposed to a mediolateral harmonic vibration at 1.25 Hz and 1 m/s2 amplitude, corresponding to a lateral displacement of 31 mm (peak-to-peak). The selection of sinusoidal FTV was made to align with most of the studies related to whole-body vibration; the frequency was selected to replicate conditions that may be found on ships or on other means of transport. The acceleration amplitude was chosen with reference to the vibration exposure limits for workers outlined in the EU Directive 2002/44/EC [25].
Walking performance was assessed using the step width (SW) parameter. Specifically, two patches were placed on the toes of the shoes (Figure 1c), and a camera system (DMK 72BUC02, The Imaging Source Europe GmbH, Bremen, Germany) positioned above the walking path was used to capture the position of the feet during walking by recording a video (1280 × 960 resolution, 13 fps, black and white sensor) in MP4 format using Matlab (Version: 9.13.0-R2022, MathWorks, Natick, MA, USA).
Cognitive performance was evaluated by using a purposely designed apparatus to administer a shortened version of the PVT test (Figure 1b). This test is used to measure alertness by recording the reaction time (RT) to a stimulus [26], and in this case, we used it to observe the effect of FTV on vigilance. The advantage of using PVT lies in the possibility of performing it while walking, while still providing standardized reaction time data. Specifically, from the beginning to the end of the test, a panel of blue light-emitting diodes (LEDs) was illuminated to indicate that the test was in progress; instead, the visual stimulus was delivered by switching on the adjacent green panel (Figure 1b). The interval between two successive stimuli, also referred to as the interstimulus intervals (ISIs), was randomized and set between 2 and 9 s. Subjects held a button connected directly to the device, and as soon as the green panel lit up, they responded by pressing the button, and the corresponding reaction time was recorded.
In our experiment, the device was positioned at a height of 1 m to allow the subjects to have access to peripheral visual cues from the treadmill to aid balance while walking with vibration. We then used a short version of the PVT protocol, as proposed by Dinges and Powell [27] and validated by Loh and colleagues [28], lasting 5 min and recording 10 reaction times per minute for a total of 50 RTs for each test.

2.3. Experimental Protocol

Prior to the start of the session, the subjects wore light sportswear and a comfortable pair of walking shoes. The use of light-colored shoes was recommended to ensure adequate contrast with the patches attached to the shoes. Participants were then instructed in the full procedure of the PVT protocols with a 30 s familiarization period while standing on the treadmill. Each subject repeated the PVT test in five different trials, interspersed with a 2 min rest period in a seated position. The session, which was completed in one day, took approximately 45 min per subject.
The five PVT trials were performed as follows:
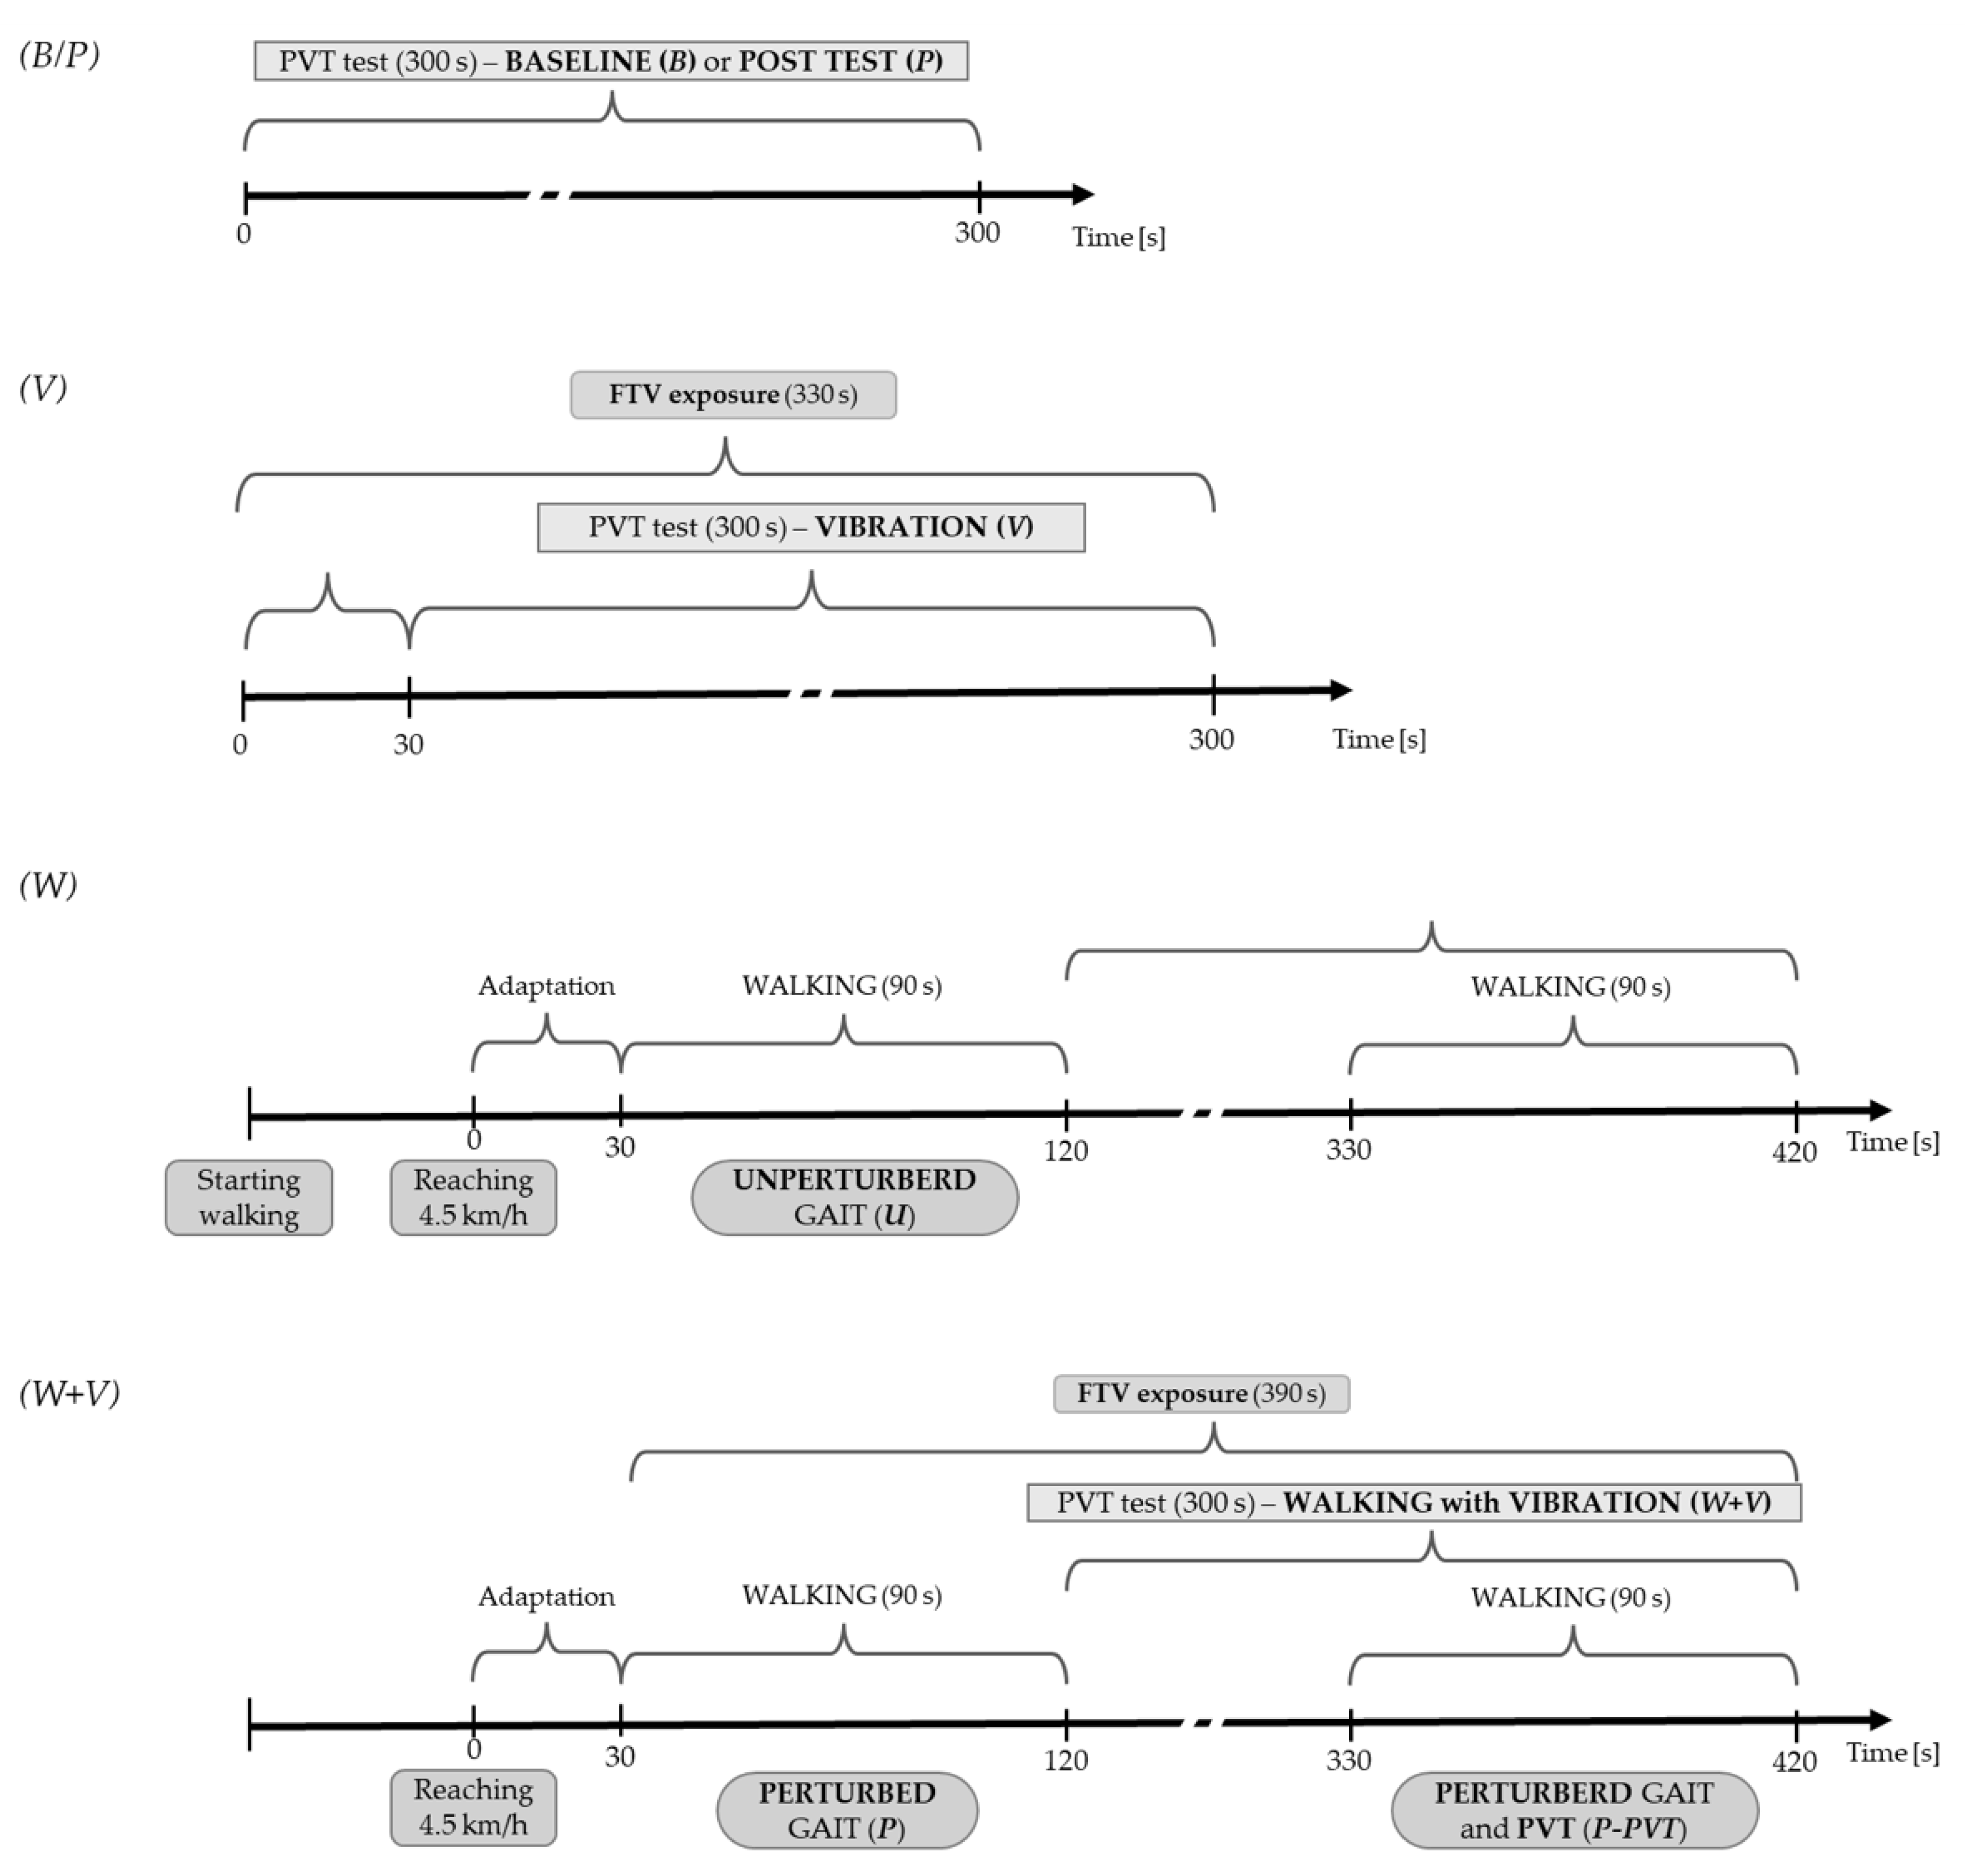
  • B—Baseline trial: the subject executed PVT (5 min duration) standing still on the platform without vibration exposure;
  • V—Vibration trial: the subject performed PVT (5 min duration) standing still on the platform that vibrates in the mediolateral direction, thus exposing participants to FTV. The PVT test started after an adaptation period of 30 s;
  • W—Walking trial: the subject executed PVT walking on the platform without vibration exposure. The participant stood still on the treadmill and started walking at a speed that gradually increased to 4.5 km/h. Once the participant adapted to the final speed (30 s), during the following 90 s, the camera system recorded the participant’s step width while they walked normally (hereinafter, unperturbed gait, U). Then, the PVT test (hereinafter unperturbed gait with PVT, U-PVT) began, and after 210 s, the step width was evaluated again to check the effect of PVT on gait;
  • W+V—Walking with vibration trial: the participant stood on the platform; after imposing the vibration, after a few seconds of adaptation, the treadmill speed slowly increased to 4.5 km/h. The participant then walked for two minutes; the first 30 s allowed them to become used to the speed and the vibration. During the last 90 s, the camera system recorded their step width (perturbed gait, P). After that, the PVT began; in the final 90 s, the step width was measured again (hereinafter perturbed gait with PVT, P-PVT);
  • P—Post-test trial: analogously to the baseline, the subject executed PVT (5 min duration) standing on the platform without vibration exposure.
The tests schemes are shown in Figure 2.
Except for the baseline and post-test (hereinafter referred to as “static” in contrast to the other “dynamic” trials), the order of the trials was randomized to avoid any learning or fatigue effects due to the order of the trials.

2.4. Data Analysis

Data elaboration and analysis were performed by using codes in MATLAB software, and all statistics were performed using Minitab® 21.2 and with a 95% confidence level. The normality distribution of the participants’ weight and height was tested through the Ryan–Joiner test.

2.4.1. PVT Analysis

A total of 250 RTs were recorded for each of the 20 subjects (10 RTs for each of the five minutes of a single trial repeated for five trials). For each condition (B, V, W, W+V, and P) and each subject, the following standardized mean PVT metrics [29] were calculated:
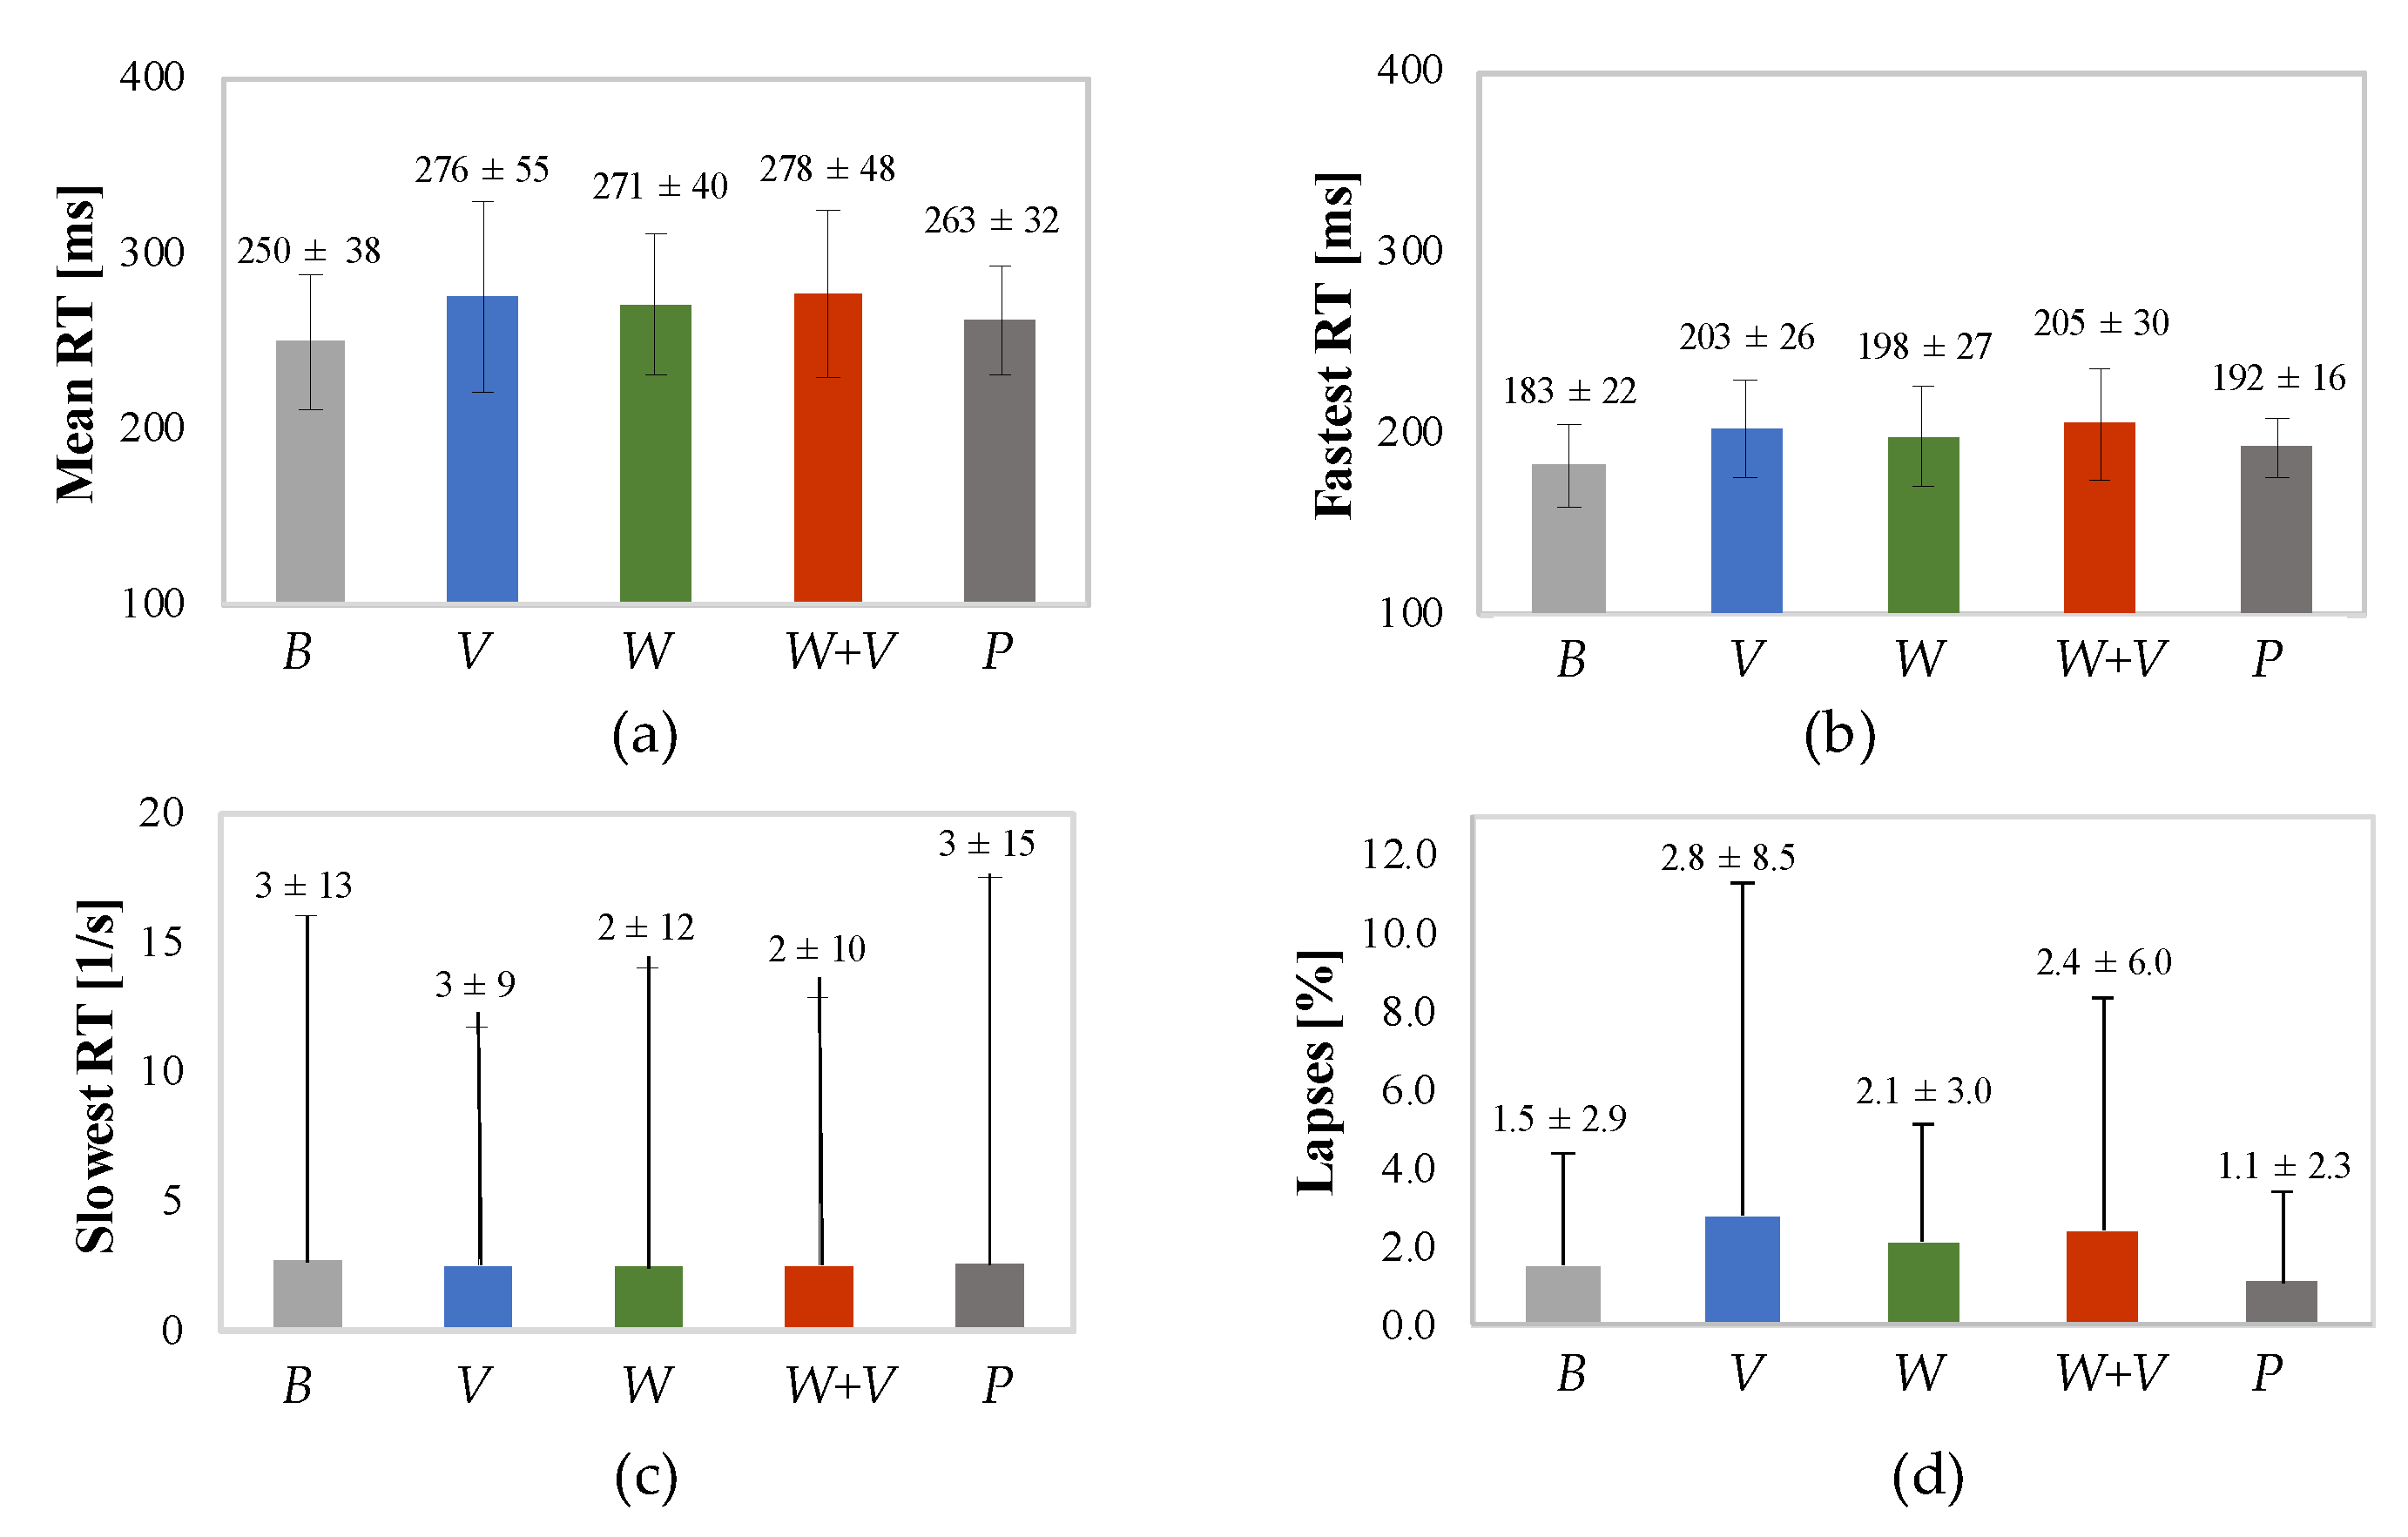
  • Mean RT: the mean of the RTs among the 50 recorded during each trial expressed in ms;
  • Fastest RT: the mean of the 10% shortest RTs of the trial (or optimum response domain) expressed in ms;
  • Slowest RT: the mean of the 10% longest RTs of the trial (or lapse domain). In this case, a reciprocal transformation was applied to the raw data to reduce the contribution of long lapses [27,28], so it is expressed in 1/s;
  • Lapses: the percentage of the error of omission (RT ≥ 500 ms) normalized by 50 RTs of the trial.
The false starts (i.e., errors of commission, defined as responses without stimulus or responses with RTs < 100 ms) were excluded from the analysis.
For each dependent vigilance metric, the effect of the trial condition (B, V, W, W+V, and P) was determined using repeated measures analyses of variance (ANOVA). In the case of a significant effect, Tukey’s post hoc test was used for multiple comparisons.
Secondly, the raw data were used to investigate the effect of time. The 1000 RTs per condition (given by 50 RTs for 20 subjects) were grouped by minute considering that 10 RTs were recorded in each minute of the test. The effect of time (minutes 1, 2, 3, 4, and 5) was determined for each trial type using one-way ANOVA. Again, in the case of a significant effect, Tukey’s post hoc test for multiple comparisons was used.

2.4.2. Step Width Analysis

The initial and final 15 s of the videos were removed, leaving only the middle minute for each recording. A pattern recognition algorithm was implemented to monitor the position of each marker in every frame and reconstruct its path. The moment when the marker reached the furthest point in the direction of walking was identified as the instance of foot impact on the treadmill. Treating consecutive strikes of the right and left foot as one step, the corresponding stride width (SW) was determined as the distance along the side-to-side axis between the positions of the two markers.
The analysis was limited to data from 16 subjects, with a focus on the initial 50 steps for each subject. SW were structured into a matrix comprising 16 rows (denoted by j, representing the subjects) and 50 columns (denoted by i representing the sequential step numbers). Therefore, the SW matrix had 800 elements. Four matrices were acquired in each of the four gait conditions U, U-PVT, P and P-PVT ( S W i , j U , S W i , j U P V T , S W i , j P , S W i , j P P V T ).
The reference gait condition for each of the j subjects was computed as the arithmetic mean of 50 columns, as follows:
S W ¯   j U = i = 1 50 S W i , j U 50
Normalized step widths s w i , j have been defined by dividing S W i , j U , S W i , j U P V T , S W i , j P , and S W i , j P P V T by the average SW in unperturbed conditions S W i U , as follows:
s w i , j U = S W i , j U S W ¯   j U   [ % ]
s w i , j U P V T = S W i , j U P V T S W ¯   j U   [ % ]
s w i , j P = S W i , j P S W ¯   j U   [ % ]
s w i , j P P V T = S W i , j U P P V T S W ¯   j U   [ % ]
For every subject, both the mean   S W j and s w j values were calculated in each of the four gait conditions. These values were then subjected to one-way ANOVA tests to assess the impact of the gait condition on the average step width. If the effect was deemed insignificant, additional one-way ANOVA tests were conducted on the single step values SWi,j and s w i , j data. In instances in which significance was observed, Tukey’s post hoc test was employed for further analysis.

3. Results

The Ryan–Joiner test resulted in a normal distribution for weight and height with RJ coefficients equal to 0.99 for both parameters.

3.1. PVT Results

The results of the PVT analysis are presented as bar plots in Figure 3. The mean and the standard deviation for all the vigilance metrics are reported, including mean RT, fastest RT, slowest RT, and lapses.

3.1.1. Comparison of Metrics in Static and Dynamic Trials

The mean RT metric (Figure 3a) measured in dynamic trials (V, W, and W+V) is larger than that of the static trials (B and P), and the values fall below this mean. Notably, the baseline trial exhibits the minimum mean RT, whereas the W+V trial demonstrates the maximum. The results of the repeated measures ANOVA are shown in Table 1.
There is a statistically significant difference in mean RT between at least two trials. However, the post hoc test showed that only the mean RT of the baseline and the other conditions were significantly different (difference less than 20 ms, p < 0.04, 95% C.I. = [8, 46]). Indeed, the baseline value showed a difference of 26 ms for V, 21 ms for W, 28 ms for W+V, and 13 ms (5%) for P trials.
Analyses conducted on the remaining vigilance metrics showed that there was a significant difference in the fastest RT between at least two trials (F(4, 99) = 6.97, p = 0.0001, Table 1), and the post hoc analysis revealed that there is a difference in the mean fastest RT between baseline and W+V, V and W (22 ms (p = 0.001, 95% C.I. = [9, 36]), 21 ms (p = 0.001, 95% C.I. = [7, 34]), and 16 ms (p = 0.014, 95% C.I. = [2, 30]), respectively). No significant differences were found when looking at the slowest reaction times or the number of lapses across the different conditions.

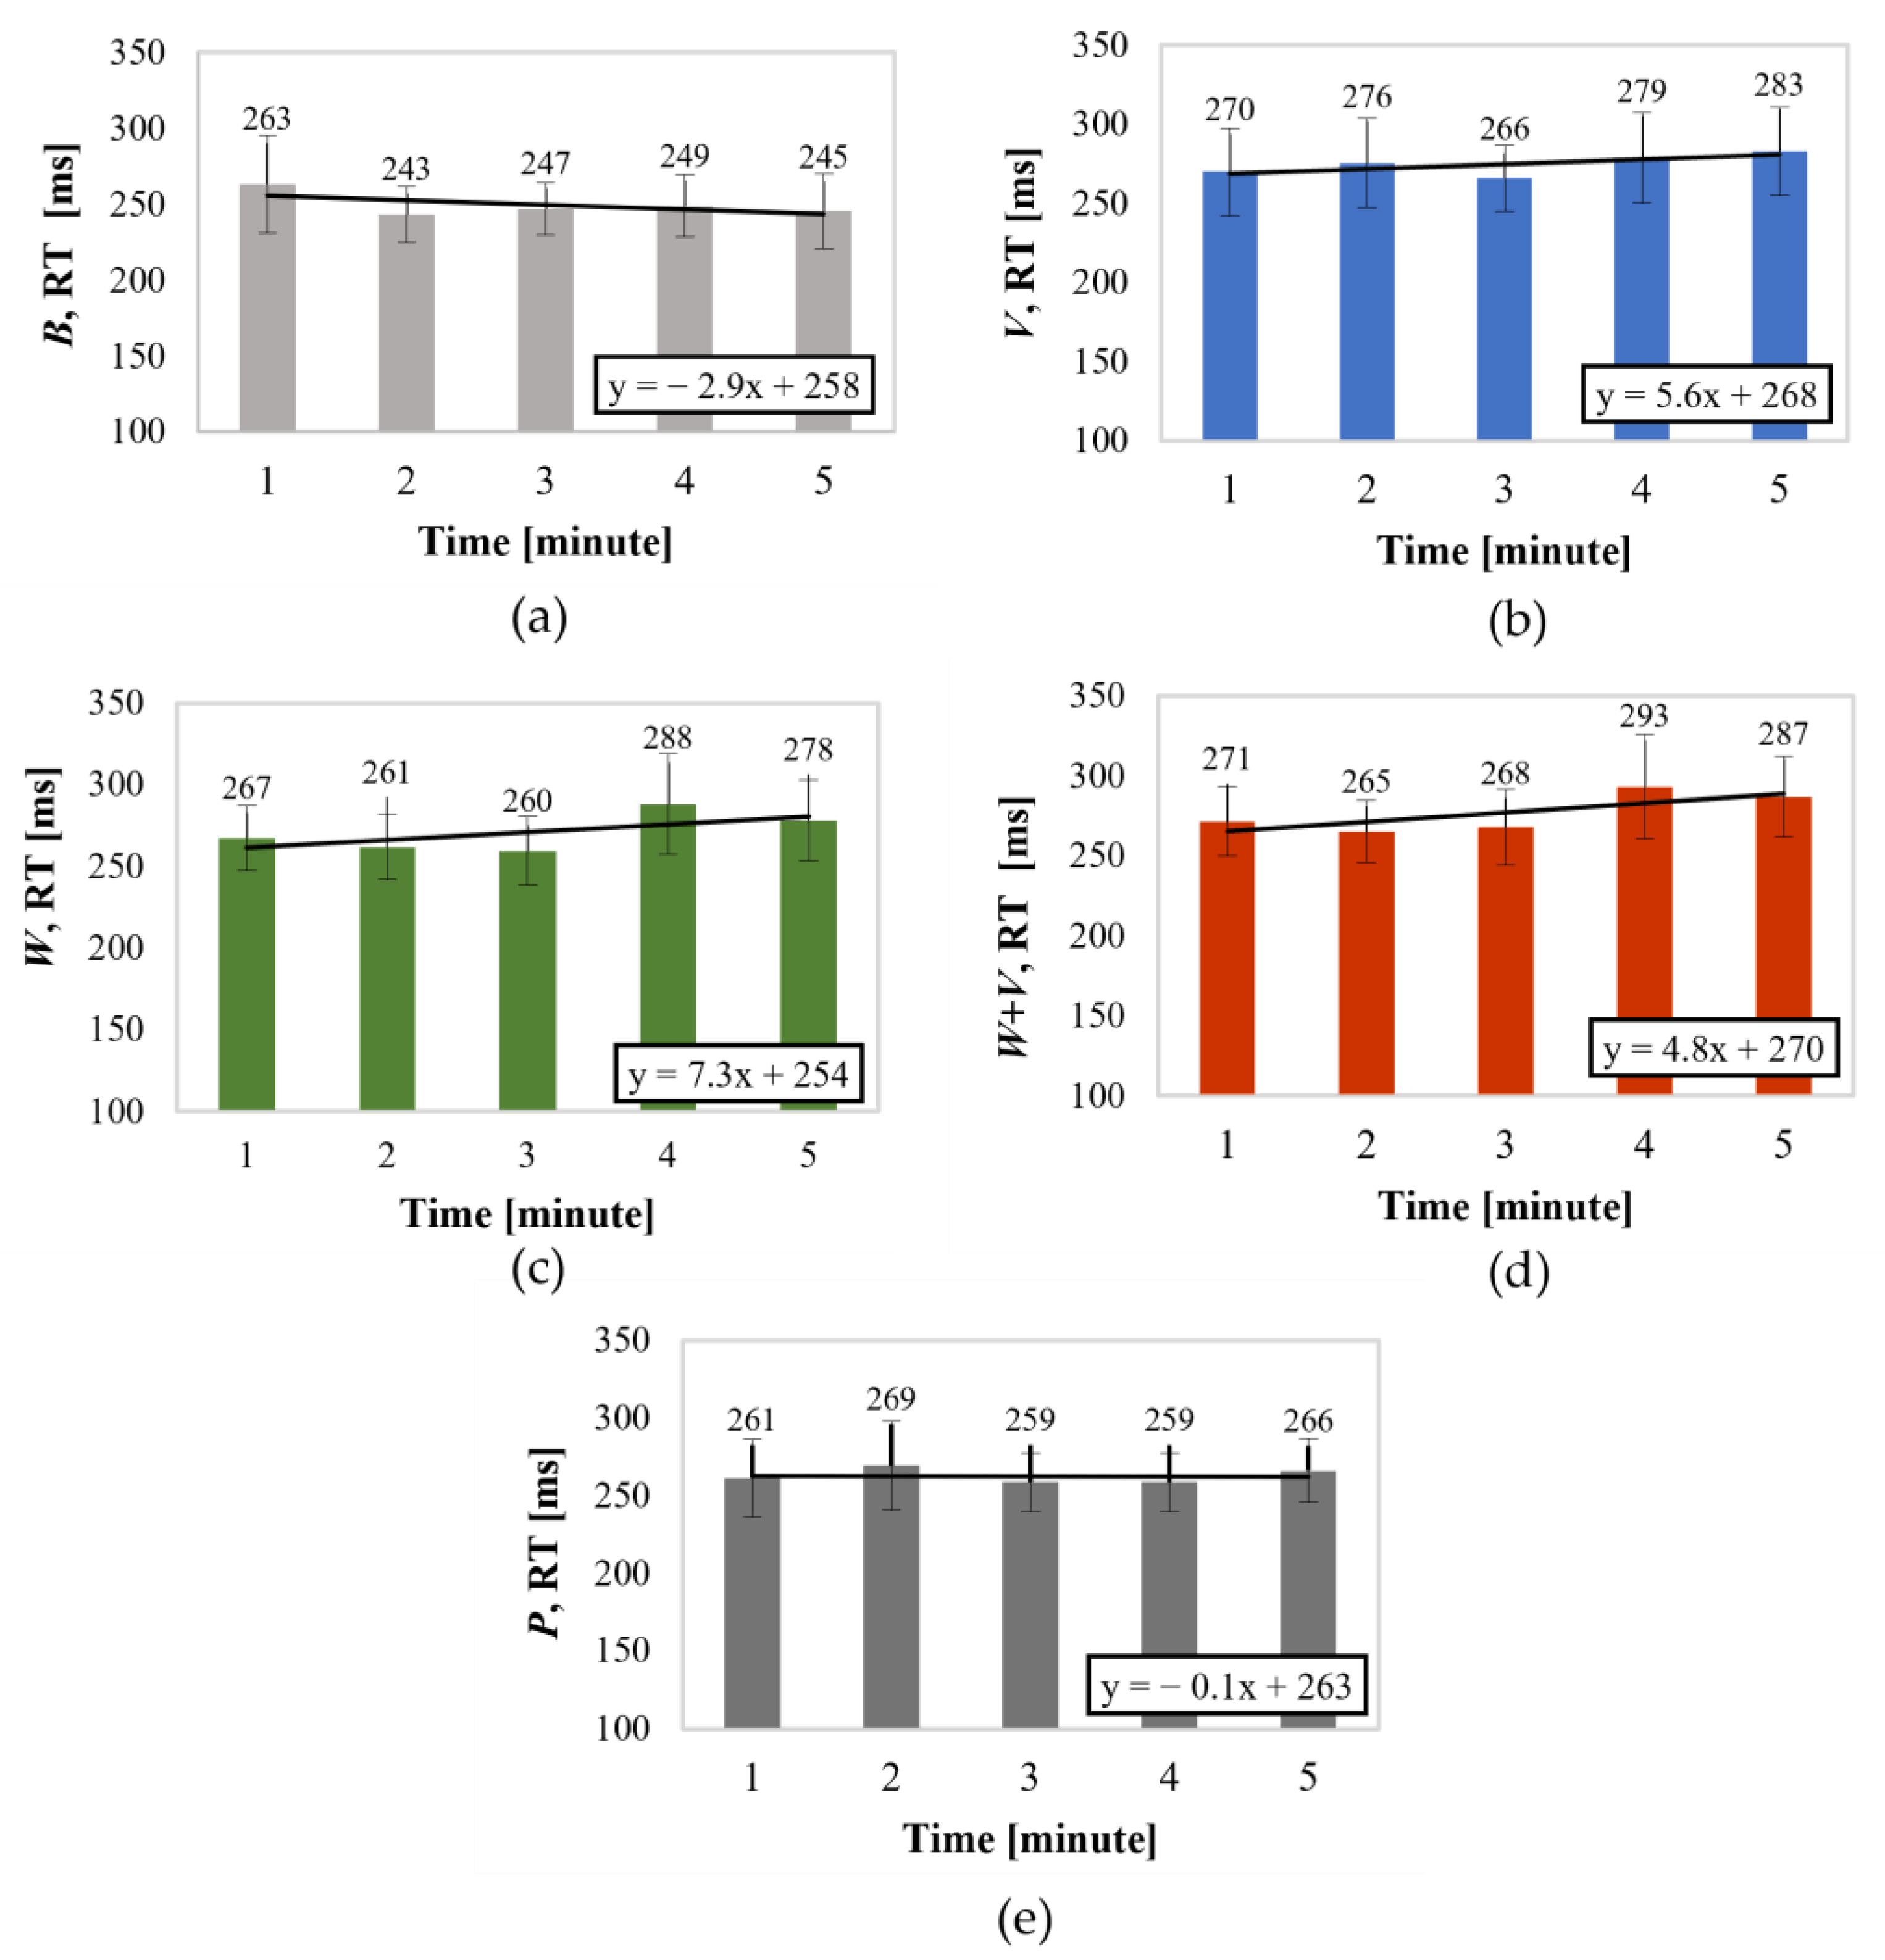
3.1.2. Effect of Time

The effect of fatigue and adaptation was quantified by analyzing the dependence of RT over time (Figure 4). The results evidenced a significant effect of the time only for W and W+V trials.
The one-way measure ANOVA was carried out, and the results are reported in Table 2.
The post hoc test for walking showed that the mean value of RTs is significantly different between minute 4 and minutes 1, 2, and 3, with a mean difference ranging between 22 and 30 ms (p < 0.03, 95% C.I. = [1, 51] for the three comparisons).
For the W+V trial, the post hoc test showed that the mean value of RTs was significantly different between minute 4 and minutes 2 and 3, as well as between minutes 5 and 2, with a mean difference of 23–28 ms (p < 0.024, C.I. = [2, 48]).
Finally, for a comprehensive evaluation, the interaction of trial conditions and time on RTs was also tested with a two-way ANOVA, but no significant effects were observed.

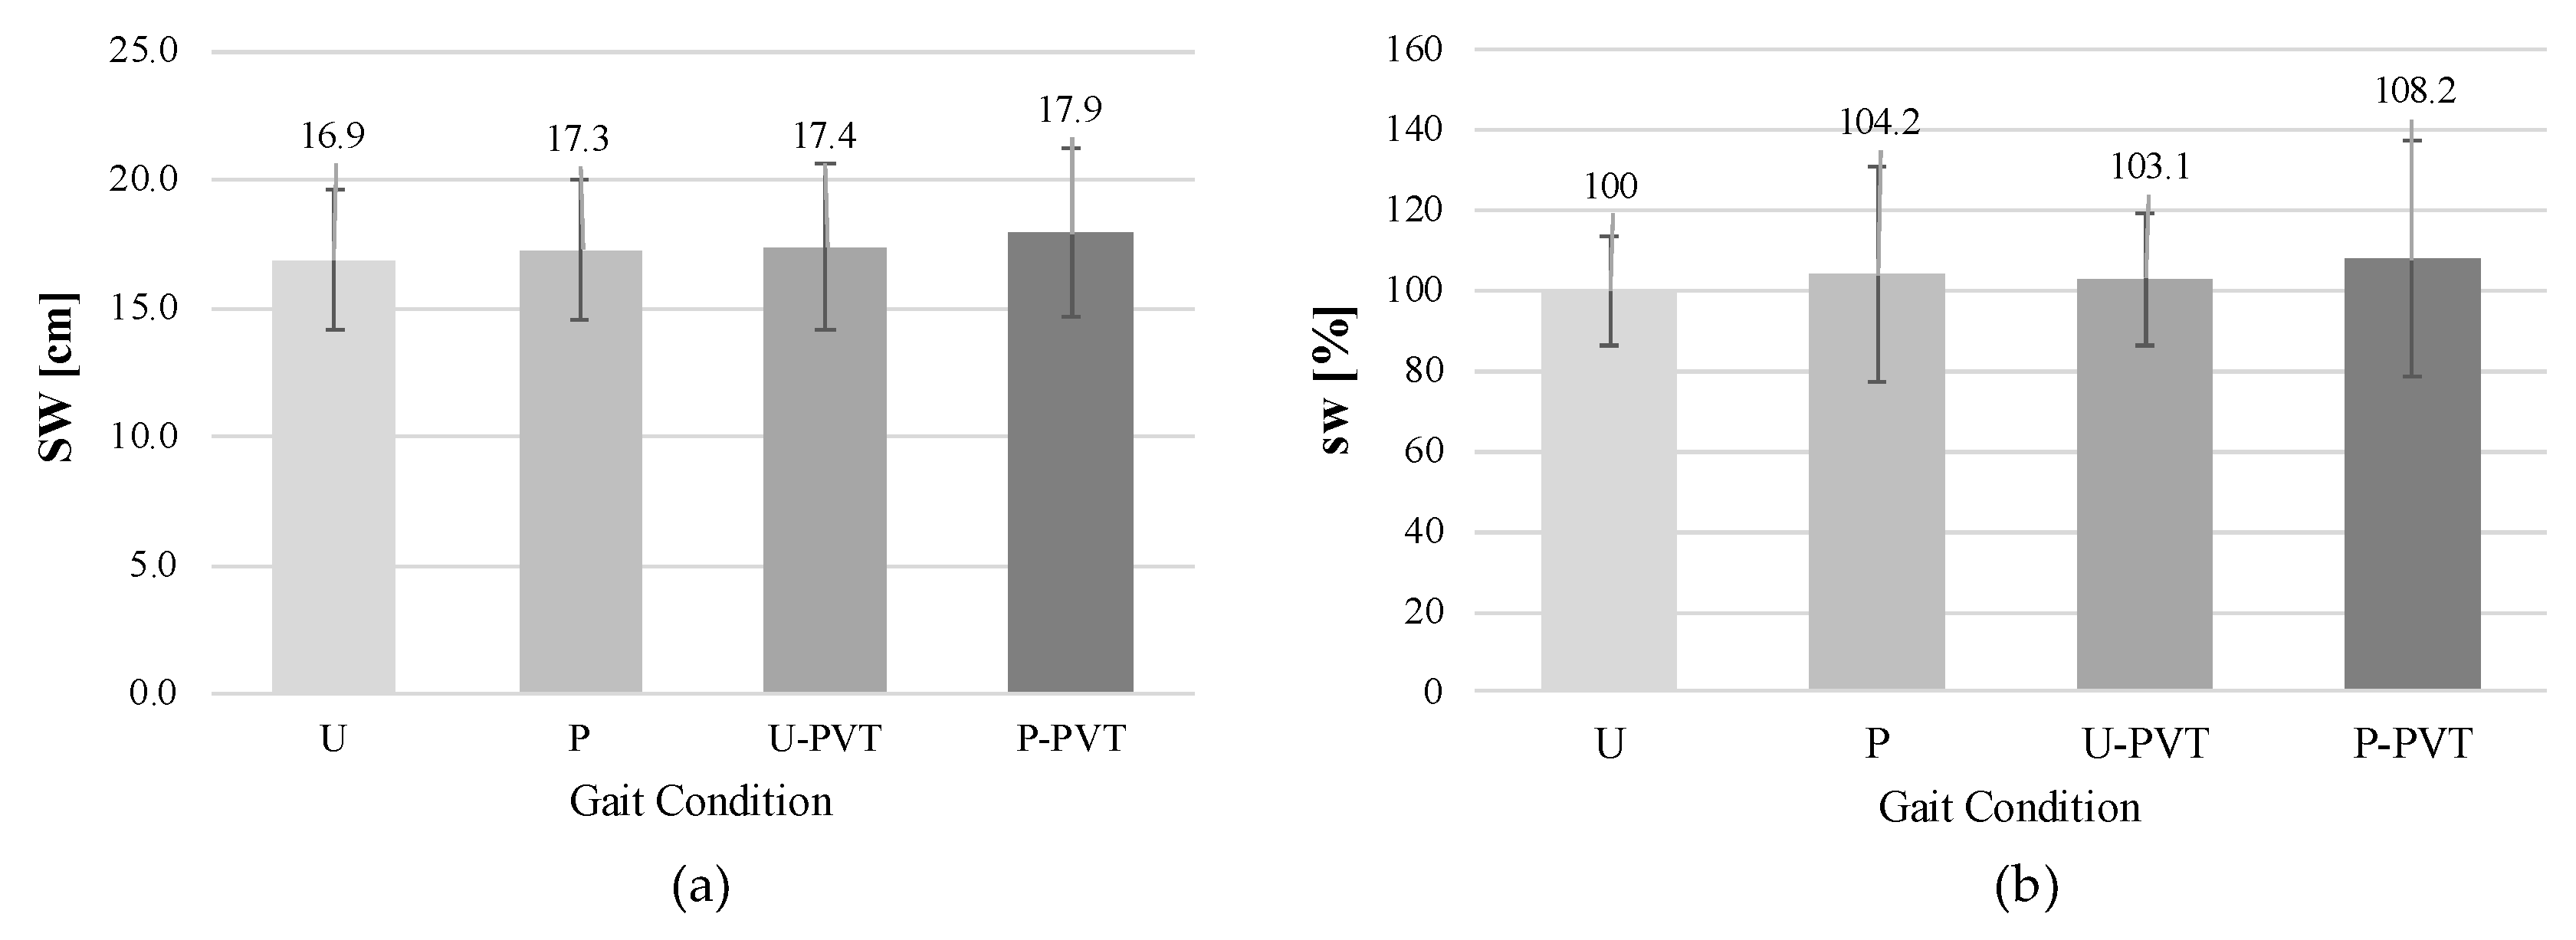
3.2. Step Width Results

Table 3 and Figure 5 shows the mean and standard deviation of the step with (SW) and of the normalized step width (sw) in each gait condition.
sw increased in each condition compared to the unperturbed gait; the increase was 4.2% in presence of vibration (P), 3.1% with PVT without the vibration (U-PVT), and 8.2% in presence of vibration while performing the PVT.
To verify the effect of the gait conditions on the average step width of each subject, the one-way ANOVA test was performed on the mean values of SW and sw. The tests showed that there was no significant effect of the gait condition on the mean values of SW (p-value = 0.795, F = 0.34 (3, 63), η2 = 0.02) and mean values of the sw (p-value = 0.728, F = 0.32 (2, 47), η2 = 0.14).
Instead, the ANOVA tests performed on the raw data (single steps) showed significance both for SW (p-value =< 0.001, F = 9.96 (3, 3199), η2 = 0.01) and the sw (p-value =< 0.001, F = 17.51 (3, 3199), η2 = 0.02). The results of the Tukey post hoc analysis are shown in Table 4 for the SW and sw.
The mean differences on the SW and sw showed that there is a significant increase in the step width in the case of the PVT execution (by comparing U with U-PVT and P with P-PVT) and vibration exposure (by comparing U with P and U-PVT with P-PVT). No significant difference emerged between P (walking with vibration) compared to U-PVT (normal walking while performing PVT).

4. Discussion

4.1. Findings

The findings presented in this paper indicate that exposure to foot-transmitted vibration (FTV) may lead to impairment in cognitive performance and variations in step width.

4.2. Cognitive Effects

The study evidenced that the average reaction times in PVT tests were generally slower when walking and/or in the presence of vibration compared to resting conditions (statical trials). However, the RT slowdown was relatively small, only about 10% on average (28 ms) compared to the baseline reaction time. This pattern was seen also for the fastest reaction time; in W+V, there was an increase of 23 ms compared to resting condition.
Even though the W+V led to the biggest slowdown in reaction time, this difference was not large enough to be statistically significant compared to walking with vibration or just walking. This suggests that walking with or without vibration has similar effects on a person’s ability to stay focused and react quickly to visual stimuli.
The study evidenced that the average reaction time (mean RT) was slower (13 ms) in the final portion of the test compared to the resting condition (both baseline and post-test), although this difference was not statistically significant. Fastest RT, on average, increased with time, while lapses decreased from 1.5% to 1.1% in the final part of the tests. In our interpretation, participants were slower to respond to the stimulus at the end of the session but were not affected by the loss of vigilance, probably due to the training in the PVT execution.
Our findings differ from those reported by Azizan and colleagues [10,30], who observed an increase in lapses after 20 min of random whole-body vibration (WBV) exposure ranging from 1 to 15 Hz, with respect to the baseline condition. In contrast, our study did not find a statistically significant effect of FTV on lapses.
When considering the effect of time, only the V, W, and W+W tests showed a significant effect with an increasing trend in RTs over time. On the other hand, for the static trials, the reaction times over time remained almost unchanged or even decreased over time, underlining that in the absence of vibration and locomotion, there is no fatigue effect; however, on the contrary, there may be an adaptation to such a simple cognitive task. Further experiments with PVT of longer duration and higher complexity could evaluate the observed increasing trends.
Vigilance could be similarly affected in the presence of vibration or during locomotion, probably because both conditions require an additional musculoskeletal effort (walking or balancing with vibration). Then, although the effect of time is not significant, in general, the mean RT generally shows an increasing trend. These results are in line with the literature, which also shows cognitive delays during various cognitive and motor tasks [31,32].

4.3. Step Width

In terms of gait performance, the statistical analysis conducted on the mean values of SW and sw showed no significance, meaning that the gait condition did not affect the average step width due to the intersubject variability (the mean step width can vary up to about 14 cm between subjects). On the contrary, the ANOVA test conducted on the raw data that take into account each subject showed that the gait condition factor affected the distance between the feet in case of SW and the normalized sw.
For each gait condition, the Tukey post hoc test with a 95% confidence interval performed on all the raw data evidenced that there is a difference of the means of about 6 mm in case of the addition of the PVT execution. In addition, the exposure to FTV determines a widening of the support base compared to analogous conditions in the absence of vibration (difference of the means of about 5 mm), as also reported in the literature [16,17,18,19].
The greatest difference between the step width mean values was found when comparing unperturbed gait (U) and perturbed gait with PVT (P-PVT), with a mean increase in the second case of 10.6 mm (around +8%). This indicates that the simultaneous action of the cognitive task and the vibration leads to an increase in step width that is almost twice the size compared to the presence of only one of the two disturbances (U-PVT: +3% and P: +4%).
Instead by comparing U-PVT and P, it emerged that vibration or PVT alone have the same effect on gait performance.
In other words, a greater base of support is required when walking, either in the case of disturbance caused by increased cognitive demand for attention or being exposed to vibration. In the case of both disturbances, there is a combined effect, and the subject has to make a greater effort to remain stable to avoid falling, thus increasing the distance between the feet.

4.4. Limitations

The main limitation of this work is the limited number of participants. Additional data collection is needed to verify whether the results can be extended to a population that includes females and older subjects.
Another limitation derives from the application of a single harmonic excitation in the mediolateral direction. Due to the uneven movement of vehicles, which can vibrate and jolt in various directions, passengers may experience sudden loss of balance, and to regain stability, they may need to use handrails or other kinds of supports (train and airplane seats or lateral walls). While this study used a simple vibration pattern, it showed that vibration can generally make it harder to stay focused; the changes we observed in reaction times and step width might not apply to other types of vibration. More research is needed to understand how different vibration frequencies, amplitudes, and patterns (time history modulations) affect focus and balance.
Although the step width results increased in the presence of perturbation, in the present study, a narrow treadmill (43 cm) was used, and this may not have allowed the subject to walk in full mobility. In addition, it was demonstrated that gait is controlled differently during overground and treadmill dual-task walking, with different cognitive load depending also on the selected speed [33,34,35]. Despite acknowledging the inherent limitations linked to utilizing treadmills, it remained the only viable choice, considering practical considerations, including the need for controlled experimental conditions and the possibility of reliable gait analysis.
Another limitation derives from the camera system; the calculation of the step width that we used is not in compliance with the standardized modality that considers the mediolateral distance between two consecutive strikes of the right and left heels. The patches were positioned on the toes, and it was not possible to detect the exact position of the heels. For this reason, the SW values could have been influenced by the physiological extra-rotation of the feet in the coronal plane and by the mediolateral oscillation of the treadmill. Although this system proved to be advantageous due to the reduced setup preparation and data processing time, it is necessary to conduct further studies with a standard optoelectronic system for a comprehensive evaluation. This would allow for detailed kinematic analysis, including measurements of joint angles and spatiotemporal parameters. Finally, a more realistic environment (i.e., immersive reality) with a wider treadmill and more difficult cognitive and motor tasks might help to obtain results closer to real working conditions.

5. Conclusions

This study examined how sinusoidal mediolateral FTV (1.25 Hz and 1 m/s2) affects cognitive performances and the walking pattern during walking. Reaction times (mean RT, slowest RT, fastest RT) and lapses (longer responses) from the PVT served as measures of vigilance, while step width was measured during each walking condition to assess gait performance.
Compared to baseline, all dynamic conditions (walking alone, FTV only, walking with FTV) showed decreased vigilance (slower reaction times), with some worsening over time. However, there were no significant differences between the dynamic conditions themselves. Step width increased during FTV exposure and/or while performing cognitive tasks during walking, suggesting a possible strategy to improve stability by widening the base of support compared to normal walking.
These findings imply that real-world work environments with multidirectional, random vibrations and shocks might negatively impact worker vigilance and increase the risk of musculoskeletal discomfort. Future research should investigate the effects of different vibration characteristics and employ more comprehensive gait analysis techniques.

Author Contributions

Conceptualization, M.T.; methodology, F.M., S.M. and M.T.; software, S.M. and A.G.; validation, M.T.; formal analysis, F.M. and S.M.; investigation, F.M. and S.M.; resources, S.M., A.G. and M.T.; data curation, F.M., S.M. and A.G.; writing—original draft preparation, F.M.; writing—review and editing, F.M., F.B., E.M., M.T. and M.G.; visualization, F.M. and S.M.; supervision, M.G. and M.T.; project administration, M.T.; funding acquisition, E.M. All authors have read and agreed to the published version of the manuscript.

Funding

This research was funded by INAIL. The research is a part of the “CAPRICORN” project within the program BRIC 2019.

Data Availability Statement

Data available on request due to restrictions, e.g., privacy or ethical.

Acknowledgments

The authors thank Alex Patten Moorhead, Andrea Mazzoleni, and Giuseppe Lorenzini for their help in the setup assessment and preliminary data analysis. The authors would also like to thank all the participants for their time and support during the experiments.

Conflicts of Interest

The authors declare no conflicts of interest.

References

  1. Bovenzi, M. Exposure-Response Relationship in the Hand-Arm Vibration Syndrome: An Overview of Current Epidemiology Research. Int. Arch. Occup. Environ. Health 1998, 71, 509–519. [Google Scholar] [CrossRef] [PubMed]
  2. Anderson, V.; Bernard, B.; Burt, S.E.; Cole, L.L.; Estill, C.; Fine, L.; Grant, K.; Gjessing, C.; Jenkins, L.; Hurrell, J.J.; et al. Musculoskeletal Disorders and Workplace Factors: A Critical Review of Epidemiologic Evidence for Work-Related Musculoskeletal Disorders of the Neck, Upper Extremity, and Low Back; DHHS Publication (NIOSH): Atlanta, GA, USA, 1997; pp. 97–141. Available online: https://stacks.cdc.gov/view/cdc/21745 (accessed on 7 February 2024).
  3. Magnusson, M.L.; Pope, M.H.; Wilder, D.G.; Areskoug, B. Are Occupational Drivers at an Increased Risk for Developing Musculoskeletal Disorders? Spine 1996, 21, 710–717. [Google Scholar] [CrossRef] [PubMed]
  4. ISO 2631-1:1997; Mechanical Vibration and Shock Evaluation of Human Exposure to Whole-Body Vibration—Part 1: General Requirements. International Organization for Standardization: Geneva, Switzerland, 1997.
  5. Diels, C.; Ye, Y.; Tarabini, M.; Bos, J.; Maeda, S. Standards on Standing-the Influence of Posture on Comfort and Health Effects of Whole-Body Vibration. In Proceedings of the 4th International Comfort Congress, Amberg, Germany, 6–7 September 2023; pp. 113–117. [Google Scholar]
  6. Marrone, F.; Massotti, C.; Goggins, K.A.; Eger, T.R.; Marchetti, E.; Bovenzi, M.; Tarabini, M. Comparison between the Biomechanical Responses of the Hand and Foot When Exposed to Vertical Vibration. In Proceedings of the ICHAV 2023, Nancy, France, 6–9 June 2023; p. 34. [Google Scholar]
  7. Maeda, S.; Mansfield, N.J.; Shibata, N. Evaluation of Subjective Responses to Whole-Body Vibration Exposure: Effect of Frequency Content. Int. J. Ind. Ergon. 2008, 38, 509–515. [Google Scholar] [CrossRef]
  8. Chadefaux, D.; Moorhead, A.P.; Marzaroli, P.; Marelli, S.; Marchetti, E.; Tarabini, M. Vibration Transmissibility and Apparent Mass Changes from Vertical Whole-Body Vibration Exposure during Stationary and Propelled Walking. Appl. Ergon. 2021, 90, 103283. [Google Scholar] [CrossRef] [PubMed]
  9. Paddan, G.S.; Holmes, S.R.; Mansfield, N.J.; Hutchinson, H.; Arrowsmith, C.I.; King, S.K.; Jones, R.J.M.; Rimell, A.N. The Influence of Seat Backrest Angle on Human Performance during Whole-Body Vibration. Ergonomics 2012, 55, 114–128. [Google Scholar] [CrossRef] [PubMed]
  10. Azizan, A.; Fard, M.; Azari, M.F.; Benediktsdóttir, B.; Arnardóttir, E.S.; Jazar, R.; Maeda, S. The Influence of Vibration on Seated Human Drowsiness. Ind. Health 2016, 54, 296–307. [Google Scholar] [CrossRef] [PubMed]
  11. Newell, G.S.; Mansfield, N.J. Evaluation of Reaction Time Performance and Subjective Workload during Whole-Body Vibration Exposure While Seated in Upright and Twisted Postures with and without Armrests. Int. J. Ind. Ergon. 2008, 38, 499–508. [Google Scholar] [CrossRef]
  12. Ishimatsu, K.; Shibata, N.; Maeda, S. Does Cognitive Performance Deteriorate after Exposure to Whole-Body Vibration? In Proceedings of the 43rd United Kingdom Conference on Human Response to Vibration, Leicester, UK, 15–17 September 2008. [Google Scholar]
  13. Marelli, S.; Ferrario, C.; Lorenzini, G.; Ravi, Y.S.; Mazzoleni, A.; Marchetti, E.; Tarabini, M. Effects of the Whole-Body Vibration Direction on the Cognitive Response of Standing Subjects. Ergonomics 2022, 66, 1270–1279. [Google Scholar] [CrossRef]
  14. Moorhead, A.P.; Chadefaux, D.; Zago, M.; Marelli, S.; Marchetti, E.; Tarabini, M. Spatiotemporal Gait Parameter Changes Due to Exposure to Vertical Whole-Body Vibration. Gait Posture 2021, 89, 31–37. [Google Scholar] [CrossRef] [PubMed]
  15. Sari, M.; Griffin, M.J. Subjective Assessment of the Postural Stability of Walking Subjects Exposed to Lateral Vibration. In Proceedings of the 44th UK Conference on Human Responses to Vibration, Loughborough, UK, 7–9 September 2009; pp. 111–118. [Google Scholar]
  16. Sari, H.M.; Griffin, M.J. Postural Stability When Walking: Effect of the Frequency and Magnitude of Lateral Oscillatory Motion. Appl. Ergon. 2014, 45, 293–299. [Google Scholar] [CrossRef] [PubMed]
  17. Brady, R.A.; Peters, B.T.; Bloomberg, J.J. Strategies of Healthy Adults Walking on a Laterally Oscillating Treadmill. Gait Posture 2009, 29, 645–649. [Google Scholar] [CrossRef] [PubMed]
  18. McAndrew, P.M.; Dingwell, J.B.; Wilken, J.M. Walking Variability during Continuous Pseudo-Random Oscillations of the Support Surface and Visual Field. J. Biomech. 2010, 43, 1470–1475. [Google Scholar] [CrossRef]
  19. Hak, L.; Houdijk, H.; Steenbrink, F.; Mert, A.; Van Der Wurff, P.; Beek, P.J.; Van Dieën, J.H. Speeding up or Slowing down?: Gait Adaptations to Preserve Gait Stability in Response to Balance Perturbations. Gait Posture 2012, 36, 260–264. [Google Scholar] [CrossRef] [PubMed]
  20. Hunter, S.W.; Divine, A.; Frengopoulos, C.; Montero Odasso, M. A Framework for Secondary Cognitive and Motor Tasks in Dual-Task Gait Testing in People with Mild Cognitive Impairment. BMC Geriatr. 2018, 18, 202. [Google Scholar] [CrossRef] [PubMed]
  21. Wild, L.B.; Lima, D.B.; Balardin, J.B.; Rizzi, L.; Giacobbo, B.L.; Oliveira, H.B.; Lima Argimon, I.I.; Peyré-Tartaruga, L.A.; Rieder, C.R.M.; Bromberg, E. Characterization of Cognitive and Motor Performance during Dual-Tasking in Healthy Older Adults and Patients with Parkinson’s Disease. J. Neurol. 2013, 260, 580–589. [Google Scholar] [CrossRef] [PubMed]
  22. Theill, N.; Martin, M.; Schumacher, V.; Bridenbaugh, S.A.; Kressig, R.W. Simultaneously Measuring Gait and Cognitive Performance in Cognitively Healthy and Cognitively Impaired Older Adults: The Basel Motor-Cognition Dual-Task Paradigm: Motor-cognition dual-task performance. J. Am. Geriatr. Soc. 2011, 59, 1012–1018. [Google Scholar] [CrossRef] [PubMed]
  23. Szturm, T.; Maharjan, P.; Marotta, J.J.; Shay, B.; Shrestha, S.; Sakhalkar, V. The Interacting Effect of Cognitive and Motor Task Demands on Performance of Gait, Balance and Cognition in Young Adults. Gait Posture 2013, 38, 596–602. [Google Scholar] [CrossRef]
  24. Grigera Naòn, M. The Effects of Mediolateral Vibrations While Walking on a Treadmill: A Setup for Cognitive Task and Gait Analysis, Politecnico di Milano. 2020. Available online: https://www.politesi.polimi.it/handle/10589/167252 (accessed on 7 February 2024).
  25. Directives Originating from the EU; General Provisions. Directive 2002/44/EC of the European Parliament and the Council of 25 June 2002 on the Minimum Health and Safety Requirements Regarding the Exposure of Workers to the Risks Arising from Physical Agents (Vibration) (Sixteenth Individual Directive within the Meaning of Article 16 (1) of Directive 89/391/EEC). Off. J. Eur. Communities 2002, L117, 6–7. [Google Scholar]
  26. Thomann, J.; Baumann, C.R.; Landolt, H.-P.; Werth, E. Psychomotor Vigilance Task Demonstrates Impaired Vigilance in Disorders with Excessive Daytime Sleepiness. J. Clin. Sleep Med. 2014, 10, 1019–1024. [Google Scholar] [CrossRef] [PubMed]
  27. Dinges, D.F.; Powell, J.W. Microcomputer Analyses of Performance on a Portable, Simple Visual RT Task during Sustained Operations. Behav. Res. Methods Instrum. Comput. 1985, 17, 652–655. [Google Scholar] [CrossRef]
  28. Loh, S.; Lamond, N.; Dorrian, J.; Roach, G.; Dawson, D. The Validity of Psychomotor Vigilance Tasks of Less than 10-Minute Duration. Behav. Res. Methods Instrum. Comput. 2004, 36, 339–346. [Google Scholar] [CrossRef]
  29. Basner, M.; Dinges, D.F. Maximizing Sensitivity of the Psychomotor Vigilance Test (PVT) to Sleep Loss. Sleep 2011, 34, 581–591. [Google Scholar] [CrossRef] [PubMed]
  30. Azizan, A.; Zali, Z.; Padil, H. Evaluation of Reaction Time Performance and Subjective Drowsiness during Whole-Body Vibration Exposure. IOP Conf. Ser. Mater. Sci. Eng. 2018, 370, 012020. [Google Scholar] [CrossRef]
  31. Leone, C.; Feys, P.; Moumdjian, L.; D’Amico, E.; Zappia, M.; Patti, F. Cognitive-Motor Dual-Task Interference: A Systematic Review of Neural Correlates. Neurosci. Biobehav. Rev. 2017, 75, 348–360. [Google Scholar] [CrossRef] [PubMed]
  32. Al-Yahya, E.; Dawes, H.; Smith, L.; Dennis, A.; Howells, K.; Cockburn, J. Cognitive Motor Interference While Walking: A Systematic Review and Meta-Analysis. Neurosci. Biobehav. Rev. 2011, 35, 715–728. [Google Scholar] [CrossRef] [PubMed]
  33. Penati, R.; Schieppati, M.; Nardone, A. Cognitive Performance during Gait Is Worsened by Overground but Enhanced by Treadmill Walking. Gait Posture 2020, 76, 182–187. [Google Scholar] [CrossRef] [PubMed]
  34. Wrightson, J.G.; Smeeton, N.J. Walking Modality, but Not Task Difficulty, Influences the Control of Dual-Task Walking. Gait Posture 2017, 58, 136–138. [Google Scholar] [CrossRef] [PubMed]
  35. Wrightson, J.G.; Ross, E.Z.; Smeeton, N.J. The Effect of Cognitive-Task Type and Walking Speed on Dual-Task Gait in Healthy Adults. Mot. Control 2016, 20, 109–121. [Google Scholar] [CrossRef] [PubMed]
Figure 1. (a) Pictorial view of the setup: the vibrating platform and the PVT device; (b) PVT device: the subject waits a random amount of time (2–9 s) for the green LED to light up and then presses the button as quickly as possible to record the reaction time; (c) The patches on the feet to measure step width: a round shape on the right, and a square shape on the left.
Vibration 07 00019 g001
Figure 2. Temporal schemes of the baseline (B) and post-test (P), vibration (V), walking (W), and walking with vibration (W+V) trials for the PVT execution, and unperturbed gait (U), unperturbed gait with PVT (U-PVT), perturbed gait (P), and perturbed gait with PVT (P-PVT) for the step width recording.
Vibration 07 00019 g002
Figure 3. Mean and standard deviation for the PVT trial conditions (B: baseline, V: vibration, W: walking, W+V: walking with vibration, P: post-test) of all the PVT metrics: (a) mean RT, (b) fastest RT, (c) slowest RT, and (d) lapses.
Vibration 07 00019 g003
Figure 4. Mean, standard deviation, and regression line of RTs for each minute in all the PVT trials: (a) B: baseline, (b) V: vibration, (c) W: walking, (d) W+V: walking with vibration, and (e) P: post-test.
Vibration 07 00019 g004
Figure 5. SW (a) and sw (b) as a function of the gait condition (U: unperturbed, P: perturbed, U-PVT: unperturbed with PVT, P-PVT: perturbed with PVT).
Vibration 07 00019 g005
Table 1. Effect of PVT trial on vigilance metrics. Results of repeated measures ANOVAs are presented as F value and p-value (significance level α = 0.05) and effect size (η2). The degrees of freedom between and within are in parentheses after the F value.
Effect of TrialMean RTFastest RTSlowest RTLapses
F5.68 (4, 99)6.97 (4, 99)0.70 (4, 99)0.89 (4, 99)
p<0.001 *<0.001 *0.60.5
η20.050.100.300.01
* p-value < 0.05.
Table 2. Effect of time on RTs during each trial (B: baseline, V: vibration, W: walking, W+V: walking with vibration, P: post-test). The results of the one-way ANOVAs are presented as F value and p-value (significance level α = 0.05) and effect size η2. The degrees of freedom between and within are in parentheses after the F value.
Effect of TimeBVWW+VP
F2.13 (4,993)1.66 (4, 991)5.40 (4, 994)5.19 (4, 993)0.95 (4, 995)
P0.0750.1580.003 *0.001 *0.435
η20.0010.010.020.020.001
* p-value < 0.05.
Table 3. Mean and standard deviation (SD) of the step width for each gait condition.
UPU-PVTP-PVT
SW [cm]16.917.317.417.9
SD [cm]2.72.73.23.3
sw [%]100104.2103.1108.2
SD [%]13.626.916.429.3
Table 4. Effect on SW: Tukey pairwise comparisons between all types of gait trials.
Gait Condition 1Gait Condition 2SW (1) − SW (2) [mm]
(95% Confidence Interval)
sw (1) − sw (2) [%]
(95% Confidence Interval)
PU4.0 (−1.1, 9.0)4.2 (1.2, 7.1) *
U-PVTU5.1 (0.0, 10.1) *3.1 (0.1, 6.0) *
P-PVTU10.6 (5.6, 15.6) *8.2 (5.2, 11.1) *
U-PVTP1.1 (−3.9, 6.1)1.1 (−1.8, 4.0)
P-PVTP6.6 (1.6, 11.7) *4.0 (1.1, 6.9) *
P-PVTU-PVT5.5 (0.5, 10.6) *5.1 (2.2, 8.0) *
* Differences of means statistically significant.
Disclaimer/Publisher’s Note: The statements, opinions and data contained in all publications are solely those of the individual author(s) and contributor(s) and not of MDPI and/or the editor(s). MDPI and/or the editor(s) disclaim responsibility for any injury to people or property resulting from any ideas, methods, instructions or products referred to in the content.

