Abstract
Glioma, a highly aggressive cancer, presents a daunting prognosis, with only 5% of glioblastoma patients surviving beyond five years post diagnosis. Current therapeutic strategies, including surgical intervention, radiotherapy, chemotherapy, and immune checkpoint blockade (ICB), while promising, often encounter limited efficacy, particularly in glioblastoma cases. Addressing this challenge requires a proactive approach to anticipate treatment response and resistance. In this study, we analyzed 117 glioma patients who underwent ICB treatment to uncover the mechanisms underlying treatment resistance. Through a meticulous examination of mutational profiles post ICB, we identified several mutations associated with varied survival outcomes. Notably, mutations such as STAG2 Missense, EGFR A289V Missense, TP53 Nonsense, and RB1 FS del were linked to prolonged overall survival, while others, including IF del, FAT1 E1206Tfs*4 FS del, PDGFRA FS del, PIK3R1 M326Vfs*6 FS del, Y463* Nonsense, NF1 Missense, and R1534*, were associated with poorer survival post ICB. Leveraging these insights, we employed machine learning algorithms to develop predictive models. Remarkably, our model accurately forecasted glioma patient survival post ICB within an error of 4 months based on their distinct mutational profiles. In conclusion, our study advocates for personalized immunotherapy approaches in glioma patients. By integrating patient-specific attributes and computational predictions, we present a promising avenue for optimizing clinical outcomes in immunotherapy.
1. Introduction
Glioma, particularly glioblastoma, stands as the most prevalent primary malignant tumor of the central nervous system, exhibiting an incidence rate of 3.19 per 100,000 individuals in the United States [1,2]. Despite concerted therapeutic efforts encompassing surgery, chemotherapy (temozolomide), radiotherapy, and immune checkpoint blockade (ICB), the prognosis remains bleak, with a median survival time of merely 15 months, a median progression-free survival of 7 months, and less than 5% of patients surviving beyond 5 years post diagnosis [3].
While immune checkpoint blockade, notably targeting Programmed Cell Death Protein 1 (PD-1), presents promise, its efficacy in adjuvant settings is constrained, barring notable exceptions in cases of mismatch repair deficiency [2,4,5,6,7,8,9,10]. Recent investigations into the neoadjuvant administration of pembrolizumab for glioblastoma patients, followed by continued adjuvant therapy post surgery, have showcased a significant extension in overall survival compared to exclusive adjuvant anti-PD-1 treatment [2]. However, even in neoadjuvant settings, resistance to immune checkpoint blockade persists as a formidable challenge.
In light of these challenges, conducting a comprehensive meta-analysis spanning glioblastoma patient cohorts assumes paramount significance in elucidating the intricate mechanisms dictating response and resistance to immune checkpoint blockade. Furthermore, the integration of machine learning methodologies into the analysis and interpretation of these datasets emerges as a potent strategy. Leveraging successful applications in prognosticating patient outcomes in various cancers, machine learning tools offer the prospect of refining the precision of response and resistance prediction to immune checkpoint blockade [11,12,13,14]. This, in turn, holds promise in enhancing diagnostic precision and tailoring therapeutic interventions based on patient-specific characteristics.
To advance the monitoring of glioblastoma patients undergoing immunotherapy, we propose to identify key mutational features associated with either resistance or positive response to therapy. Subsequently, these identified features will serve as inputs for training machine learning algorithms, facilitating the development of personalized prediction models tailored to individual patients based on their unique mutational profiles. Once trained, these machine learning models can prognosticate the likely response of new patients to immunotherapy. In instances where a positive response is anticipated, recommending immunotherapy for the specific patient may prove advantageous. Conversely, in cases of predicted resistance, considering alternative therapeutic modalities may offer a more favorable approach. This approach endeavors to refine treatment decisions, ultimately ameliorating outcomes for glioblastoma patients undergoing immunotherapy.
2. Methods
2.1. Patient Datasets and Mutations
Datasets of patients were chosen utilizing cBioPortal. Patients who were part of the MSK cohort underwent treatment with immune checkpoint blockade subsequent to glioma diagnosis (N = 117). Out of these, 87 patients have passed away (74.4%), while 30 remain alive (25.6%). Among them, 77 are male (65.8%) and 40 are female (34.2%). The majority, 114 patients, received PD1/PDL1 blockade (97.4%), while only 3 underwent combination therapy (2.6%). A total of 82 patients were diagnosed with glioblastoma (70.1%). Notably, in the case of 115 patients (98.3%), the tumor sample was primary, whereas in 2 patients (1.7%), it was metastatic. Regarding age distribution, 40 individuals were aged between 50 and 60 years (34.2%), 34 fell within the age group of 31–50 years (29.1%), 22 were between 61 and 70 years old (18.8%), 13 were under 30 years old (11.1%), and 8 were over 71 years old (6.8%). These tumor specimens underwent targeted next-generation sequencing (MSK-IMPACT). Shared mutations were discerned by examining mutations present in no fewer than 2 patients, and we specifically opted for mutations evident in at least 5% of the patients in the cohort.
2.2. Statistics
The statistical significance of the observed differences was determined using both Spearman and Pearson correlations, alongside Cox proportional-hazards models. Additionally, Kaplan–Meier curves and the log rank test were employed for the analysis of survival plots. The difference was deemed significant when the p value fell below the threshold of 0.05. *: p < 0.05.
2.3. Machine Learning to Predict Personalized Response to Immune Checkpoint Blockade
2.3.1. Immunotherapy
Immunotherapy, a groundbreaking approach in modern medicine, represents a paradigm shift in the treatment of various diseases, particularly cancer. Unlike traditional therapies such as chemotherapy and radiation, which directly target cancer cells, immunotherapy harnesses the power of the body’s immune system to identify and destroy cancer cells. This transformative strategy has revolutionized the landscape of cancer treatment and offers hope to patients who previously faced limited options. At its core, immunotherapy works by stimulating or enhancing the body’s immune response against cancer. The immune system is a complex network of specialized cells, tissues, and organs that work together to defend the body against harmful invaders, including viruses, bacteria, and abnormal cells like cancer. Central to this defense mechanism are immune cells known as T cells, B cells, natural killer (NK) cells, and antigen-presenting cells (APCs), which coordinate a multifaceted response to threats. Cancer cells often evade detection by the immune system through various mechanisms, including the expression of immune checkpoint proteins that inhibit the activity of T cells. Immunotherapy seeks to overcome these evasion tactics by either boosting the overall immune response or specifically targeting and disabling mechanisms that suppress the immune system’s ability to recognize and eliminate cancer cells. One of the most well-known forms of immunotherapy is immune checkpoint blockade, which involves blocking inhibitory signals that dampen the activity of T cells. This is typically achieved by using monoclonal antibodies that target checkpoint proteins such as programmed cell death protein 1 (PD-1) or cytotoxic T-lymphocyte-associated protein 4 (CTLA-4). By unleashing the immune system’s full potential, checkpoint inhibitors enable T cells to recognize and attack cancer cells more effectively.
2.3.2. Machine Learning
Machine learning is a subset of artificial intelligence (AI) that empowers computers to learn from data without being explicitly programmed. Instead of relying on predefined rules, machine learning algorithms utilize patterns and inference to make decisions and predictions. The core idea is to enable computers to learn automatically from past data to improve their performance on specific tasks. Machine learning can be broadly categorized into three types. Supervised Learning: In supervised learning, the algorithm is trained on labeled data, meaning that the input data come with corresponding output labels. The algorithm learns from the labeled examples and can make predictions on new, unseen data. Unsupervised Learning: Unsupervised learning involves training the algorithm on unlabeled data. The algorithm must find patterns or structures within the data without explicit guidance. Clustering and dimensionality reduction are common tasks in unsupervised learning. Reinforcement Learning: Reinforcement learning is a type of machine learning where an agent learns to make decisions by interacting with an environment. The agent receives feedback in the form of rewards or penalties based on its actions and uses this feedback to improve its decision-making over time.
2.3.3. Gradient Boosting
Gradient boosting is a powerful machine learning technique used for both regression and classification tasks. It works by sequentially combining multiple weak learners (typically decision trees) to create a strong predictive model. The key principle behind gradient boosting is to optimize a loss function by iteratively fitting new models to the residual errors of the preceding ensemble. Here is how gradient boosting works step by step. Initialization: The algorithm starts with an initial model, often a simple one like a single-leaf decision tree. Iterative Training: In each iteration, a new weak learner is added to the ensemble to correct the errors made by the existing ensemble. The new model is trained on the residual errors of the current predictions. Weighted Combination: The predictions of all weak learners are combined with weights, where each learner’s weight is determined by its contribution to minimizing the loss function. Final Prediction: The final prediction is made by aggregating the predictions of all weak learners, typically by summing them up. Gradient boosting algorithms, such as XGBoost, LightGBM, and CatBoost, are widely used in various domains due to their high predictive performance and ability to handle complex datasets.
2.3.4. Random Forest
Random forest is another ensemble learning method used for classification and regression tasks. It operates by constructing multiple decision trees during training and outputting the mode (classification) or mean prediction (regression) of the individual trees. Here is how random forest works. Bootstrap Sampling: Random forest starts by creating multiple bootstrap samples (random samples with replacement) from the original dataset.
Decision Tree Construction: A decision tree is constructed for each bootstrap sample. However, unlike traditional decision trees, each tree in a random forest is trained on a random subset of features at each split. Voting (Classification) or Averaging (Regression): Once all decision trees are constructed, the final prediction for a new data point is determined by aggregating the predictions of all individual trees. For classification tasks, this is usually done by majority voting, and for regression tasks, it is done by averaging the predictions. Random forest offers several advantages, including the following. Reduced Overfitting: By averaging multiple decision trees, random forest reduces overfitting compared to individual decision trees. Implicit Feature Selection: Random forest selects features randomly at each split, which can help in identifying important features in the dataset. Robustness to Outliers and Noise: Random forest is robust to outliers and noise in the data due to its ensemble nature. In summary, gradient boosting and random forest are two popular ensemble learning techniques that leverage the strengths of multiple weak learners to create strong predictive models. While gradient boosting focuses on sequentially correcting errors made by the ensemble, random forest constructs multiple decision trees independently and combines their predictions through voting or averaging. Both algorithms are widely used in practice and have demonstrated success in various machine learning applications.
2.3.5. Patients
Glioma patients from the Memorial Sloan Kettering (MSK) cohort, comprising 117 individuals, underwent treatment with immune checkpoint blockade. Glioma, a term encompassing a group of tumors that originate in the glial cells of the central nervous system (CNS), presents a complex and formidable challenge in the realm of oncology. These tumors, arising from the supportive tissue of the brain and spinal cord, can manifest at various locations within the CNS, exhibiting a range of behaviors and clinical presentations. As one of the most prevalent forms of primary brain tumors, gliomas represent a significant area of focus in both research and clinical practice. The classification of gliomas is multifaceted, with tumors categorized based on their histopathological characteristics, genetic profiles, and clinical features. The World Health Organization (WHO) grading system stratifies gliomas into several grades, from low-grade (I and II) to high-grade (III and IV), reflecting their aggressiveness and propensity for infiltration into surrounding brain tissue. Glioblastoma multiforme (GBM), a grade IV glioma, stands out as the most malignant and common form, notorious for its rapid growth, infiltrative nature, and dismal prognosis. The clinical manifestations of gliomas can vary widely depending on their location, size, and growth rate. Common symptoms may include headaches, seizures, cognitive deficits, motor impairments, and changes in personality or behavior. The diagnosis of gliomas typically involves a combination of neuroimaging techniques, such as magnetic resonance imaging (MRI) and computed tomography (CT) scans, along with the histopathological examination of tissue samples obtained through biopsy or surgical resection. Treatment approaches for gliomas are multifaceted, often involving a combination of surgery, radiation therapy, and chemotherapy. Surgical resection aims to remove as much of the tumor mass as possible while preserving neurological function, although complete excision may not always be feasible, especially for infiltrative lesions. Adjuvant therapies, including radiotherapy and chemotherapy with agents like temozolomide, are commonly employed to target residual tumor cells and delay disease progression. However, despite advances in treatment modalities, the prognosis for patients with gliomas remains challenging, particularly for those with high-grade tumors like GBM.
Our algorithms assess the likelihood of patient survival post treatment based on genetic mutations. The dataset was partitioned into 5 subsets and further categorized into training (80%) and testing (20%) groups. Random forest, gradient boosting, decision tree, SVC, logistic regression, and MLP models were trained on the genetic mutation data using five-fold cross-validation to predict response to immune checkpoint blockade, measured in overall survival (in months). Gradient boosting, a technique of ensemble learning, progressively constructs a robust predictive model by iteratively incorporating weak learners, typically decision trees, into the ensemble. The fundamental principle involves optimizing a loss function by iteratively fitting new models to the residual errors of the preceding ensemble. We employed the gradient boosting algorithm using the scikit-learn library in Python. Random forest, on the other hand, is an ensemble learning approach based on the creation of multiple decision trees. Each tree is built on a random subset of features and a bootstrapped sample of the data. Predictions are aggregated by averaging (for regression) or voting (for classification) across all trees. We also utilized the random forest algorithm with the scikit-learn library in Python. The mean ensemble method combines predictions from various models to yield a final prediction. In this investigation, we employed a mean ensemble of gradient boosting and random forest models to exploit their complementary strengths. Following the optimization of hyperparameters for both gradient boosting and random forest models, we merged their predictions by averaging them. The ensemble predictions are utilized as the ultimate output of our model. Parameter optimization was performed independently for the gradient boosting and random forest models using methods such as grid search or random search. Hyperparameters were fine-tuned to enhance model performance based on appropriate evaluation metrics.
3. Results
3.1. IF Ins Mutation Count Predicts Resistance to ICB
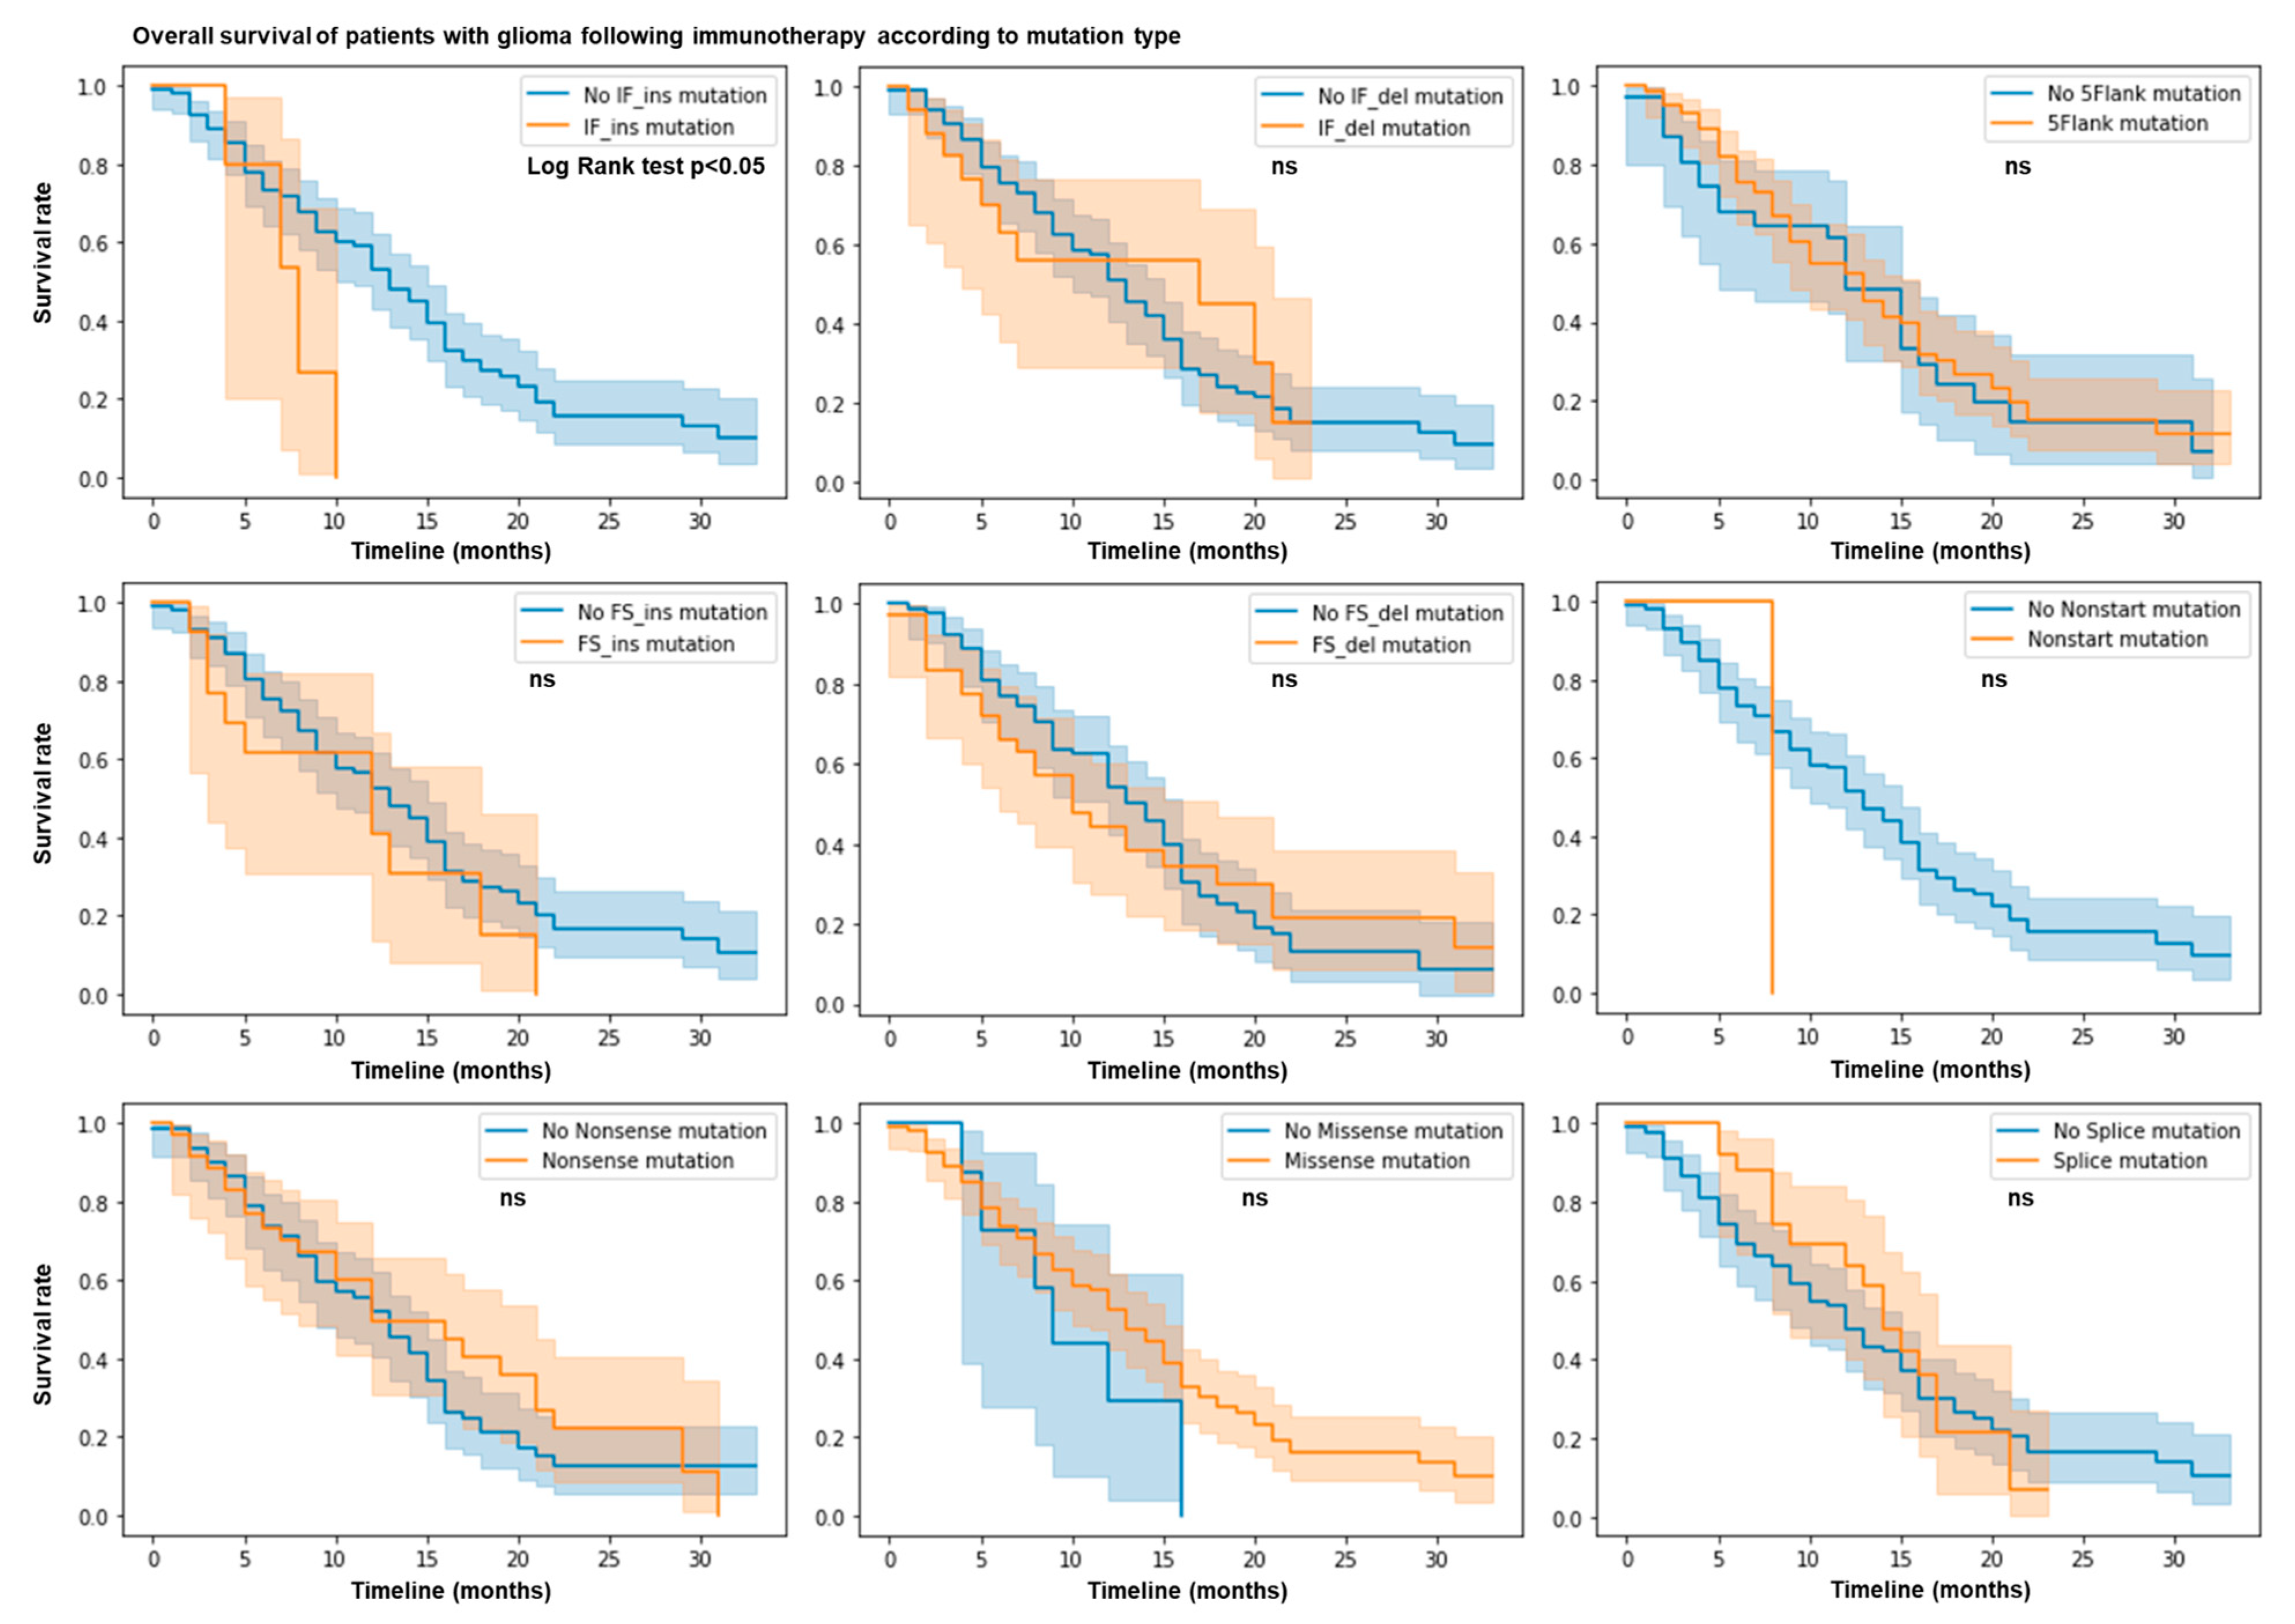
We hypothesized that the mutation profile of patients with glioma may predict their response or resistance to immunotherapy. We used the MSK Impact cohort dataset with 117 glioma patients treated with immune checkpoint blockade (ICB). We calculated the total number of nonsense, 5’flank, splice, nonstart, nonstop, missense, in frame (IF), and frameshift (FS) insertions and deletions of each patient. Using the log rank test and by plotting the survival rate according to each type of mutation, we observed that patients with IF ins mutations have a shorter overall survival and a lower survival rate (p value = 0.05) (Figure 1). No other mutation types (e.g., nonsense, 5’flank, splice, nonstart, monstop, missense, IF del, and FS indels) are associated with response or resistance in this cohort. Thus, IF ins mutations predict limited patient survival after ICB therapy.

Figure 1.
IF ins mutation count predicts resistance following ICB. N = 117 patients in MSK Impact cohort. Patient response or resistance to ICB according to mutation type. Kaplan–Meier survival curves. Log rank test; p value < 0.05.
3.2. Mutations in NF1, EGFR, PIK3R1, FAT1, PDGFRA, RB1, STAG2, and TP53 Genes Predict Response and Resistance to ICB
We hypothesized that the correlation between a shorter overall survival in glioma cancer and more IF ins mutations may be linked to the presence of specific mutations. We characterized the mutation profile of 117 glioma patients according to their overall survival in months and their status. We used a Cox proportional-hazards model, Spearman and Pearson correlations, and log rank tests to measure the association of mutations together with overall survival. However, no specific IF ins mutations in the MSK IMPACT panel were associated with a difference in survival. The global count of FS ins predicted survival but not the counts of individual FS ins mutations in a specific gene, probably due to the lack of patients with these mutations. This suggests that only the global count of IF ins mutations is associated with resistance in this cohort for this mutational panel, or that more patients would be needed to assess the importance of these rare mutations.
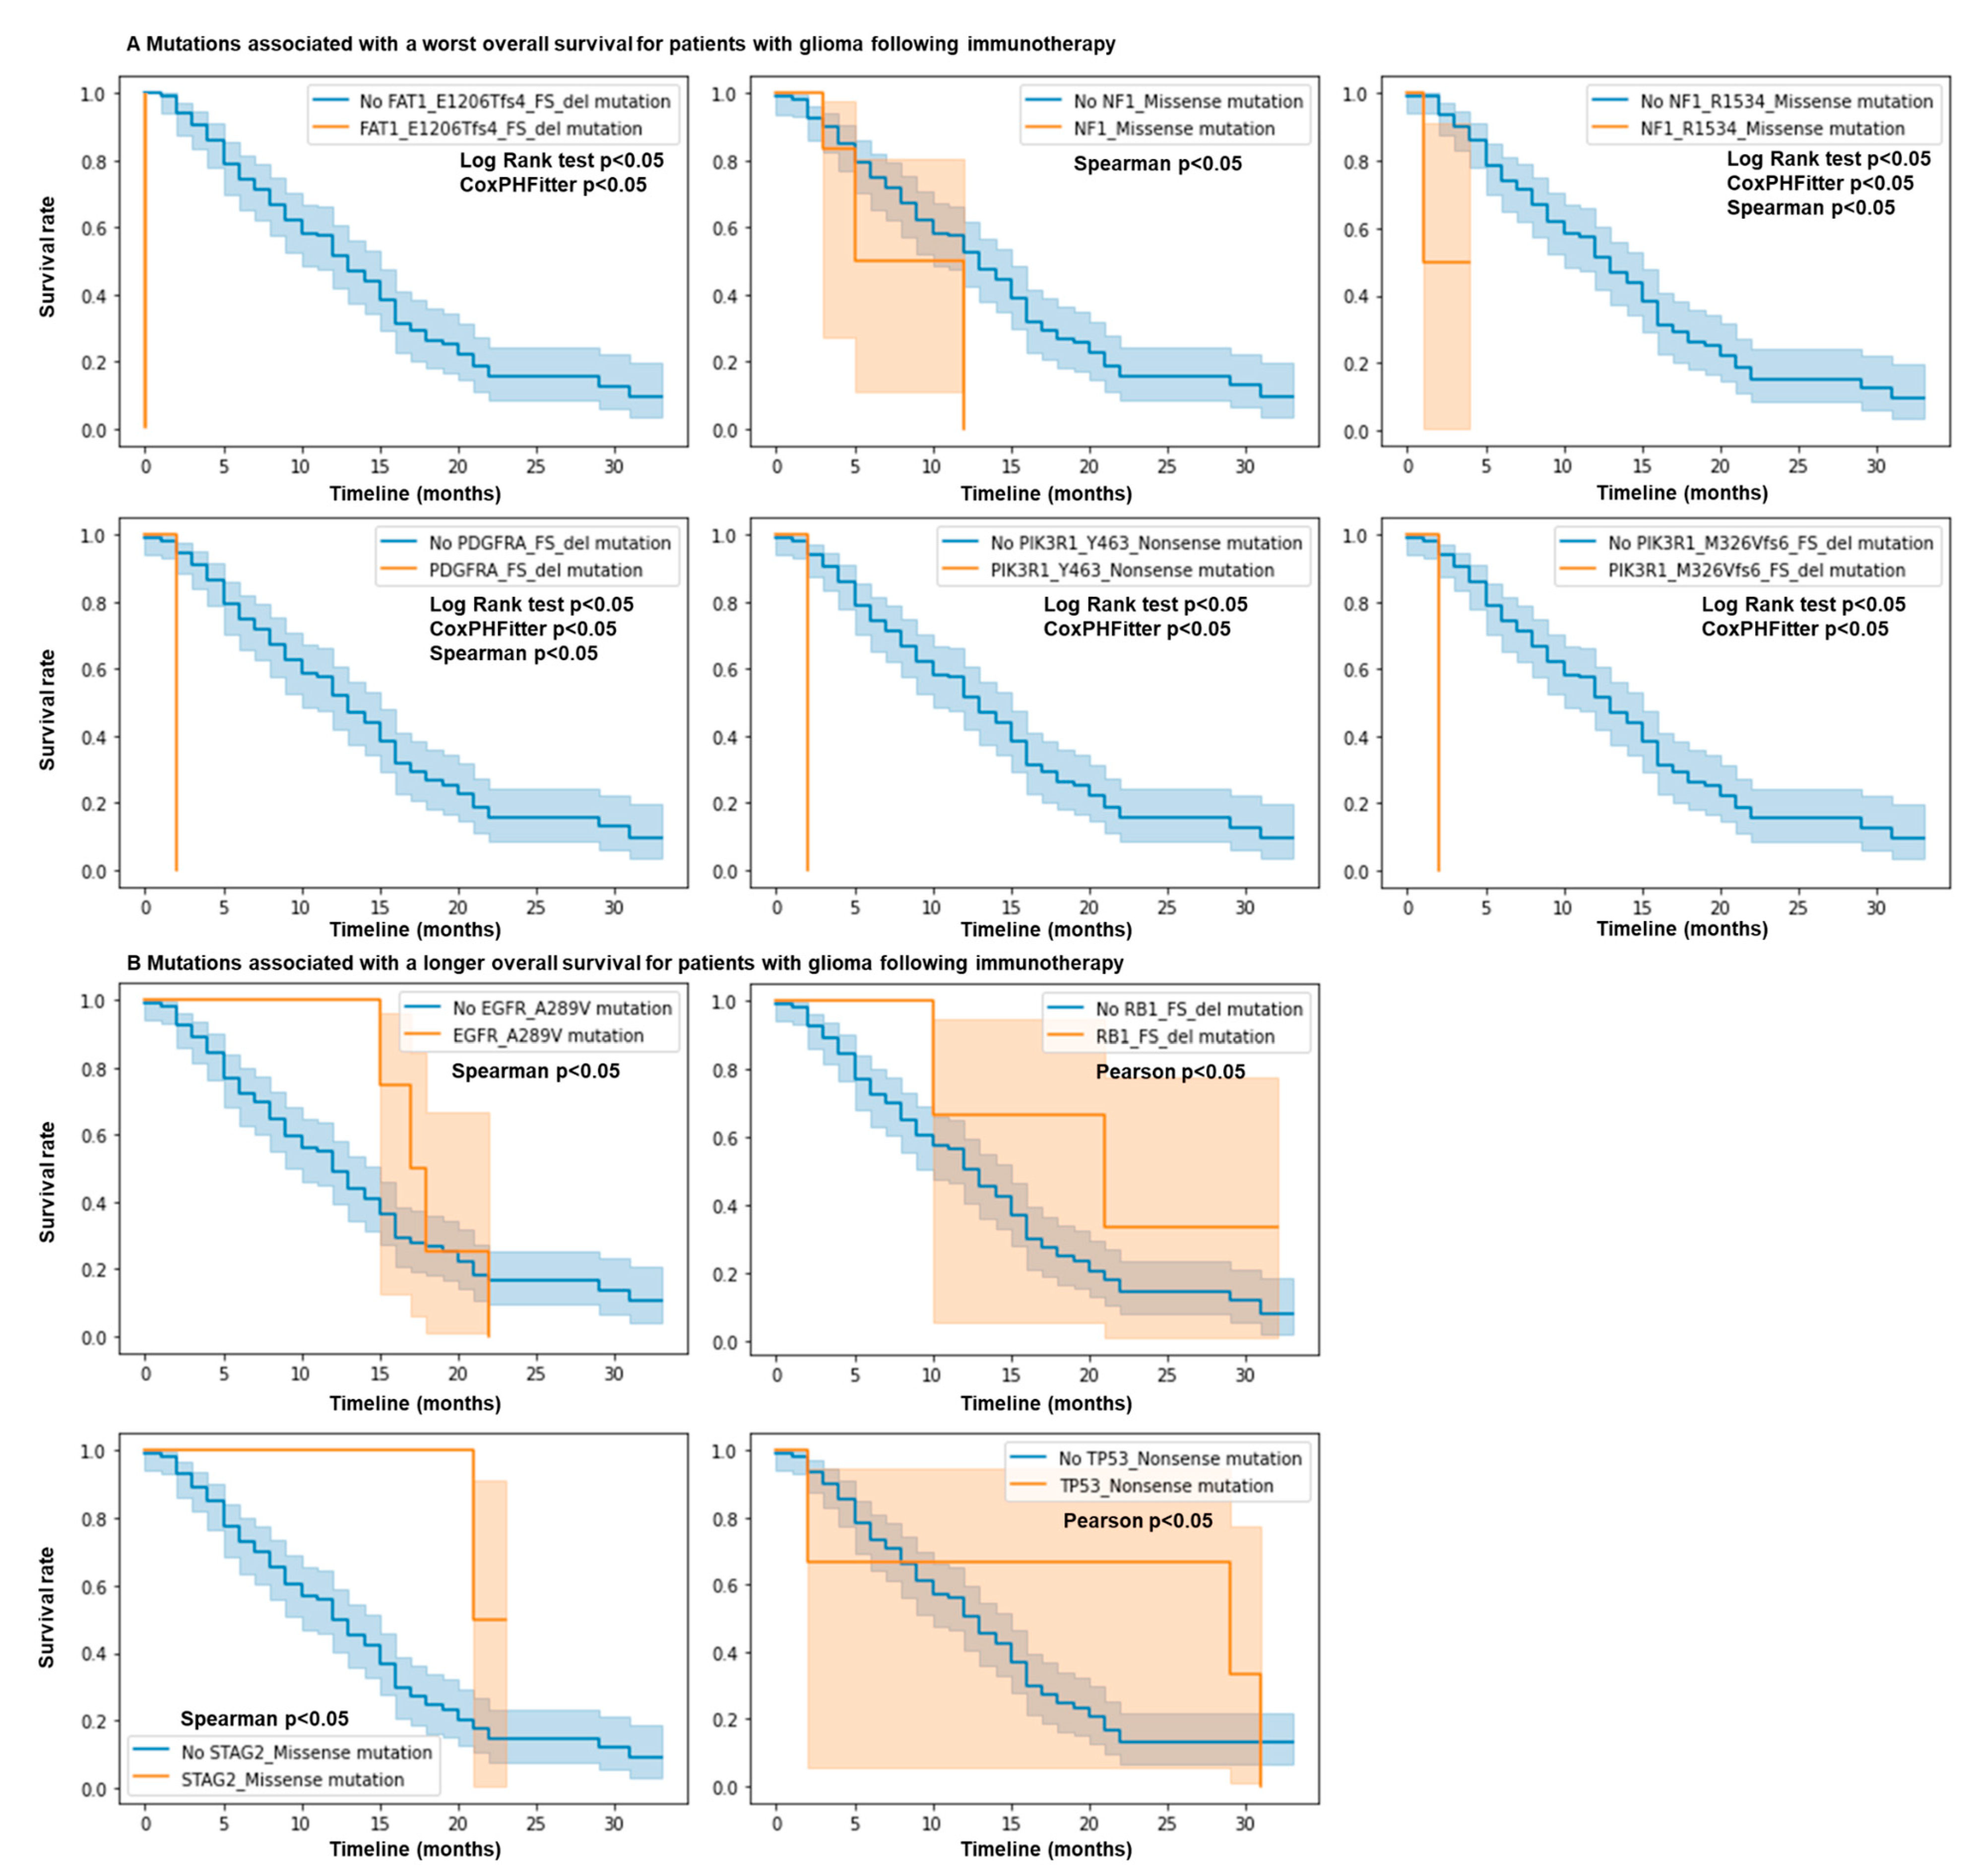
We investigated if more common specific mutations in this panel may be associated with response or resistance to ICB for glioma patients. Interestingly, we observed that for FAT1 E1206Tfs*4 FS del mutations (FAT atypical cadherin 1), the hazard ratio is 1867 (p < 0.005), meaning that individuals with this mutation have a very high hazard (risk of being dead) compared to those without it (Figure 2A). We also observed that for PDGFRA FS del (platelet-derived growth factor receptor alpha), PIK3R1 Y463* Nonsense (phosphoinositide-3-kinase regulatory subunit 1), PIK3R1 M326Vfs*6 FS del, and NF1 R1534* (neurofibromin 1) mutations, the hazard ratios are 123.0104, 562.3459, 562.3459, and 76.7553 (p < 0.005), respectively (Figure 2A). These mutations were also statistically associated with resistance using the log rank test. Using the Spearman and Pearson correlations, we observed that STAG2 Missense (STAG2 cohesin complex component), EGFR A289V Missense (epidermal growth factor receptor), TP53 Nonsense (tumor protein p53), and RB1 FS del (RB transcriptional corepressor 1) mutations were associated with a longer overall survival (Figure 2B), while NF1 Missense mutations were associated with a shorter overall survival (Figure 2A). No differences were observed for the other genes in this cohort. Overall, mutations in NF1, PIK3R1, FAT1, and PDGFRA predict resistance to ICB, while mutations in EGFR, RB1, STAG2, and TP53 genes predict response to ICB.
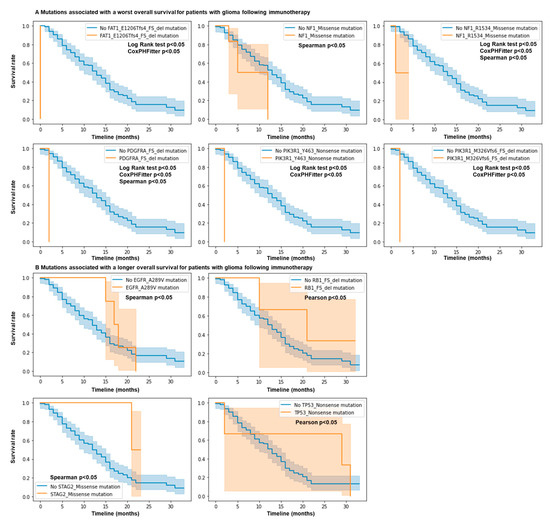
Figure 2.
Mutations in NF1, EGFR, PIK3R1, FAT1, PDGFRA, RB1, STAG2, and TP53 genes predict response and resistance to ICB. N = 117 glioma patients. Patient response or resistance to ICB according to mutation profile. Kaplan–Meier survival curves. Only mutations in the MSK IMPACT panel associated with statistical differences for survival are shown. Cox regression, log rank test, and Spearman and Pearson correlations; p values < 0.05. (A) mutations associated with a worst overall survival. (B) Mutations associated with a longer overall survival.
3.3. Mutation Profiling of Glioma Patients Allows Prediction of Overall Survival Following ICB
We hypothesized that the mutational signature correlating with patient overall survival that we identified (Figure 1 and Figure 2) may be used to better predict it using machine learning. We trained multiple machine learning algorithms with this signature to predict patient overall survival in months (Figure 3A). To do this, the dataset was split into five datasets, and divided into training (80%) and testing (20%) subsets. Random forest, gradient boosting, decision tree, SVC, logistic regression, and MLP models were trained on the mutational features on the training data using five-fold cross-validation to predict the overall survival in months following ICB. A mean ensemble combination model of the best random forest and gradient boosting models was also used to better predict the overall survival in months. The resulting trained models with the best hyperparameters were evaluated through performance metrics using the test sets.
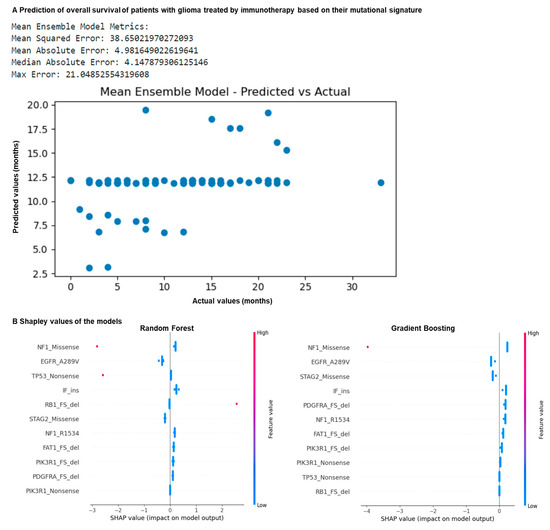
Figure 3.
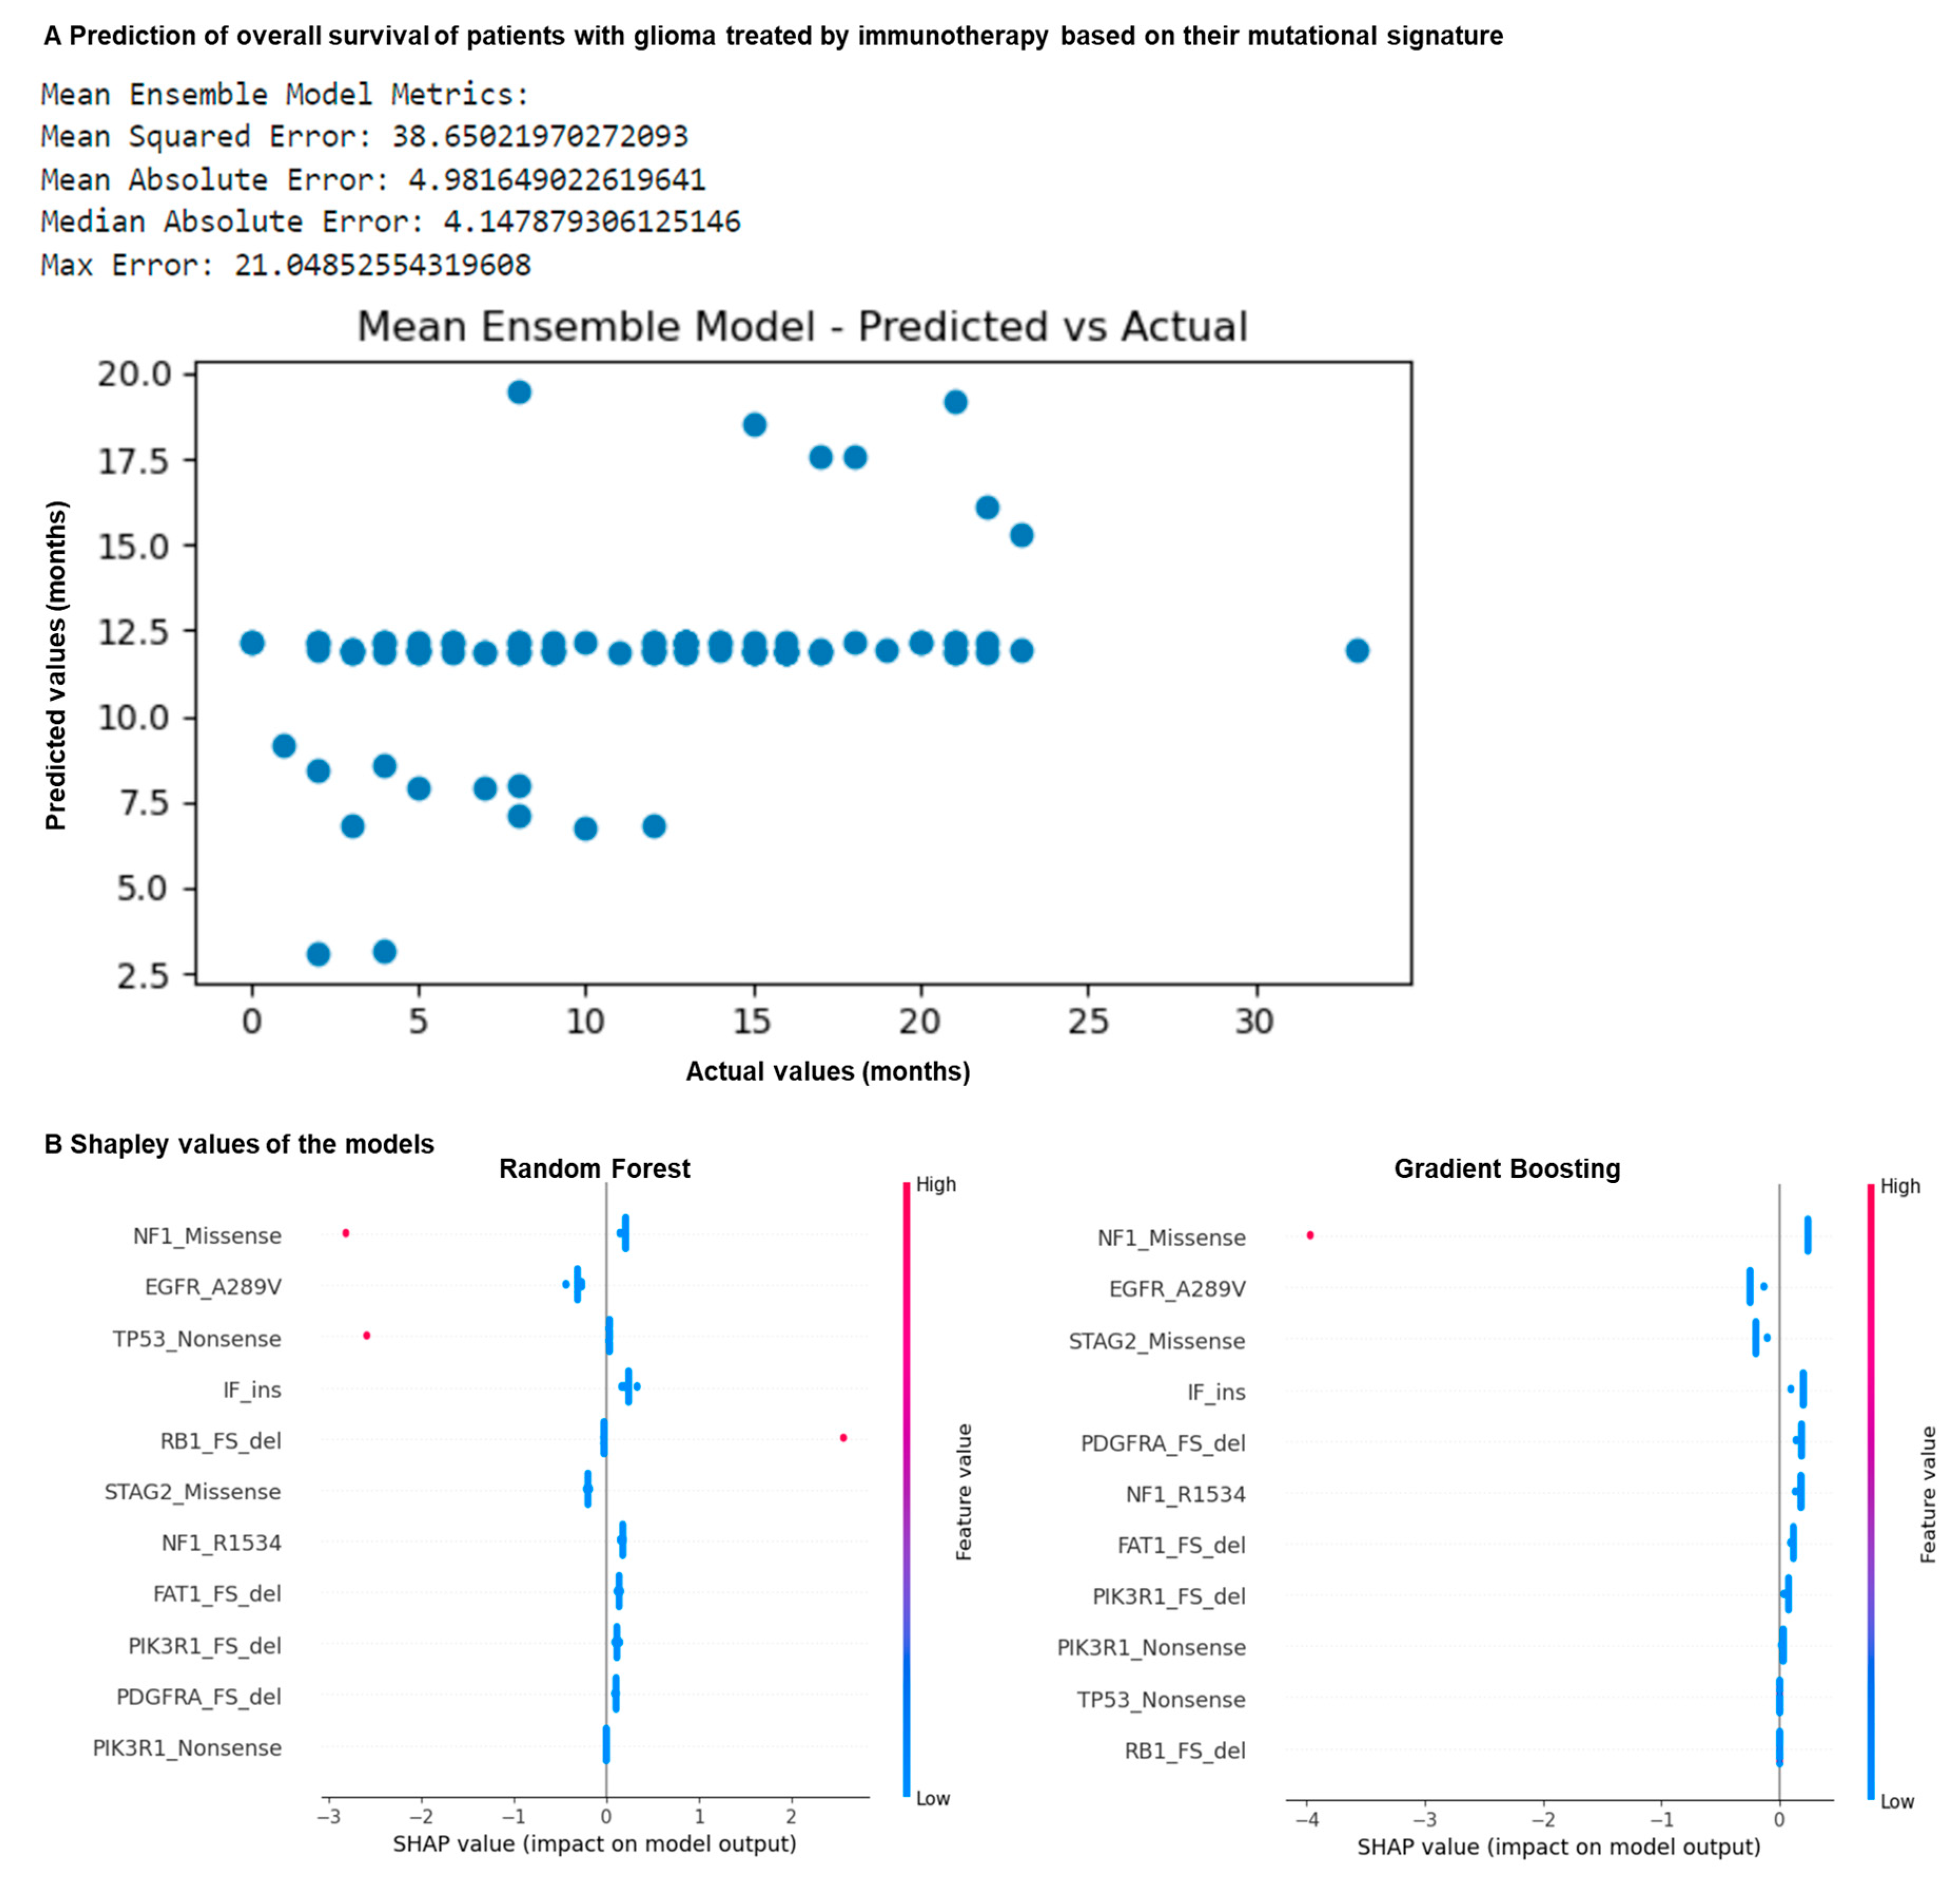
Mutation profiling of glioma patients allows prediction of overall survival following ICB. N = 117 glioma patients. (A) Machine learning prediction of patient overall survival in months following ICB using algorithms trained on the previously identified features. The dataset was split into five datasets, and divided into training (80%) and testing (20%) subsets. Random forest, gradient boosting, decision tree, SVC, logistic regression and MLP models were trained on the mutational features on the training data using five-fold cross-validation to predict overall survival in months following ICB. A mean ensemble combination model of the best random forest and gradient boosting models was also used to better predict the overall survival in months. The resulting trained models with the best hyperparameters were evaluated using performance metrics using the test sets. (B) Comparison of the Shapley values of gradient boosting and random forest models predicting patient response to ICB according to mutation profile.
By comparing the actual values with the predicted values, the best results were observed for the random forest, gradient boosting and mean ensemble combination models (Figure 3A). They are characterized by a mean square error of 38, a mean absolute error of 4 months, a maximum error of 21 months, and a median absolute error of 4 months (Figure 3A). By comparing their Shapley values, we observed that the NF1 Missense and the EGFR A289V Missense mutations are strong predictors of the response in these models (Figure 3B). Overall, our models correctly predicted patient overall survival in months based on their mutation signature, with an average error of 4 months. Overall, using machine learning together with our predictive mutational signature, we showed that it is possible to predict if a patient with glioma may benefit from immunotherapy.
4. Discussion
In the MSK IMPACT cohort, only 25.6% of the patients with glioma were alive following ICB. Therefore, it is key to develop alternative strategies for these patients who are characterized by resistance to ICB. To provide adequate therapy, it is necessary to be able to identify which patients may benefit from ICB, and which patients may benefit from another therapy. To do so, we identified mutational features associated with response or resistance to ICB in 117 patients with glioma. Patients with better survival following ICB are characterized by mutations in NF1, PIK3R1, FAT1, and PDGFRA genes, while patients with worse survival are characterized by mutations in EGFR, RB1, STAG2, and TP53 genes. In more detail, STAG2 Missense, EGFR A289V Missense, TP53 Nonsense, and RB1 FS del mutations were associated with a longer overall survival. On the other hand, patients with worse survival following ICB are characterized by FAT1 E1206Tfs*4 FS del, PDGFRA FS del, PIK3R1 M326Vfs*6 FS del and Y463* Nonsense, NF1 Missense, and R1534* mutations.
FAT1 is a tumor suppressor by binding β-catenin and antagonizing its nuclear localization. FAT1 E1206Tfs*4 FS del is a truncating mutation that may promote oncogenic WNT signaling and tumorigenesis [15], limited cell-to-cell adhesion, and reduced migration [16]. PIK3R1 is also a tumor suppressor gene, the regulatory subunit of PI3-kinase, which is frequently mutated in glioma, endometrial, and colorectal cancers. PIK3R1 Y463* Nonsense and M326Vfs*6 FS del are truncating mutations that lead to a loss of PIK3R1 function and thus PI3K pathway activation and cytokine-independent cell growth [17]. On the contrary, PDGFRA is an oncogene, a receptor tyrosine kinase, that may be altered by mutation, chromosomal rearrangement, or amplification in a diverse range of cancers [18]. NF1 is a tumor suppressor gene, a negative regulator of RAS, and may be inactivated by means of mutation or deletion in various solid and hematologic malignancies. NF1 R1534* is a truncating mutation and it may produce C-terminally truncated NF1 proteins that are unstable, resulting in a loss of protein expression [19]. Preclinical studies have identified NF1 mutations as likely resistance mutations to the tyrosine kinase inhibitor crizotinib and the ESR1 inhibitors tamoxifen and fulvestrant [20,21]. Cancer cells with loss-of-function alterations of NF1 may be sensitive to MEK1/2-targeted inhibitors such as trametinib, cobimetinib, and selumetinib [22,23,24]. Thus, it may be beneficial for glioma patients with this mutation to receive these alternative therapies.
To improve our ability to predict ICB responses in glioma patients, we developed machine learning approaches. Utilizing our mutational signature, an ensemble model trained on features identified as being differentially expressed between patients with resistance or response to PD-1/PD-L1 blockade achieved a notable success rate, accurately predicting the overall survival of the patients with an error of 4 months. To improve the accuracy of the prediction, it may be better to obtain more data from patients with response to ICB, to avoid the effect of class imbalance. It may also be interesting to combine the tumor mutational data with their matched immune features, as we previously showed that glioblastoma patients with resistance to ICB have compromised macrophage, monocyte, and T follicular helper responses, impaired antigen presentation, aberrant regulatory T cell (Tregs) responses, and a heightened expression of immunosuppressive molecules (TGFB, IL2RA, and CD276) [11].
Funding
This research received no external funding.
Institutional Review Board Statement
Not applicable.
Informed Consent Statement
Not applicable.
Data Availability Statement
All data are openly available on cBioPortal website [25]: https://www.cbioportal.org/study/summary?id=tmb_mskcc_2018, accessed on 1 January 2024. The code is available on Github: https://github.com/gmestrallet/Neuroglia_2024, accessed on 1 January 2024.
Conflicts of Interest
The author declares no conflicts of interest.
References
- Tamimi, A.F.; Juweid, M. Epidemiology and Outcome of Glioblastoma. In Glioblastoma; De Vleeschouwer, S., Ed.; Codon Publications: Brisbane, Australia, 2017; ISBN 978-0-9944381-2-6. [Google Scholar]
- Cloughesy, T.F.; Mochizuki, A.Y.; Orpilla, J.R.; Hugo, W.; Lee, A.H.; Davidson, T.B.; Wang, A.C.; Ellingson, B.M.; Rytlewski, J.A.; Sanders, C.M.; et al. Neoadjuvant Anti-PD-1 Immunotherapy Promotes a Survival Benefit with Intratumoral and Systemic Immune Responses in Recurrent Glioblastoma. Nat. Med. 2019, 25, 477–486. [Google Scholar] [CrossRef] [PubMed]
- Stupp, R.; Mason, W.P.; van den Bent, M.J.; Weller, M.; Fisher, B.; Taphoorn, M.J.B.; Belanger, K.; Brandes, A.A.; Marosi, C.; Bogdahn, U.; et al. Radiotherapy plus Concomitant and Adjuvant Temozolomide for Glioblastoma. N. Engl. J. Med. 2005, 352, 987–996. [Google Scholar] [CrossRef] [PubMed]
- Yang, T.; Kong, Z.; Ma, W. PD-1/PD-L1 Immune Checkpoint Inhibitors in Glioblastoma: Clinical Studies, Challenges and Potential. Hum. Vaccines Immunother. 2020, 17, 546–553. [Google Scholar] [CrossRef] [PubMed]
- Zhao, J.; Chen, A.X.; Gartrell, R.D.; Silverman, A.M.; Aparicio, L.; Chu, T.; Bordbar, D.; Shan, D.; Samanamud, J.; Mahajan, A.; et al. Immune and Genomic Correlates of Response to Anti-PD-1 Immunotherapy in Glioblastoma. Nat. Med. 2019, 25, 462–469. [Google Scholar] [CrossRef] [PubMed]
- Mestrallet, G.; Brown, M.; Bozkus, C.C.; Bhardwaj, N. Immune Escape and Resistance to Immunotherapy in Mismatch Repair Deficient Tumors. Front. Immunol. 2023, 14, 1210164. [Google Scholar] [CrossRef] [PubMed]
- Blumenthal, D.T.; Yalon, M.; Vainer, G.W.; Lossos, A.; Yust, S.; Tzach, L.; Cagnano, E.; Limon, D.; Bokstein, F. Pembrolizumab: First Experience with Recurrent Primary Central Nervous System (CNS) Tumors. J. Neurooncol. 2016, 129, 453–460. [Google Scholar] [CrossRef]
- Bouffet, E.; Larouche, V.; Campbell, B.B.; Merico, D.; de Borja, R.; Aronson, M.; Durno, C.; Krueger, J.; Cabric, V.; Ramaswamy, V.; et al. Immune Checkpoint Inhibition for Hypermutant Glioblastoma Multiforme Resulting from Germline Biallelic Mismatch Repair Deficiency. J. Clin. Oncol. 2016, 34, 2206–2211. [Google Scholar] [CrossRef] [PubMed]
- Reardon, D.A.; Omuro, A.; Brandes, A.A.; Rieger, J.; Wick, A.; Sepulveda, J.; Phuphanich, S.; de Souza, P.; Ahluwalia, M.S.; Lim, M.; et al. OS10.3 Randomized Phase 3 Study Evaluating the Efficacy and Safety of Nivolumab vs Bevacizumab in Patients with Recurrent Glioblastoma: CheckMate 143. Neuro-Oncol. 2017, 19, iii21. [Google Scholar] [CrossRef]
- Johanns, T.M.; Miller, C.A.; Dorward, I.G.; Tsien, C.; Chang, E.; Perry, A.; Uppaluri, R.; Ferguson, C.; Schmidt, R.E.; Dahiya, S.; et al. Immunogenomics of Hypermutated Glioblastoma: A Patient with Germline POLE Deficiency Treated with Checkpoint Blockade Immunotherapy. Cancer Discov. 2016, 6, 1230–1236. [Google Scholar] [CrossRef]
- Mestrallet, G. Predicting Immunotherapy Outcomes in Glioblastoma Patients through Machine Learning. Cancers 2024, 16, 408. [Google Scholar] [CrossRef]
- Sung, J.-Y.; Cheong, J.-H. Machine Learning Predictor of Immune Checkpoint Blockade Response in Gastric Cancer. Cancers 2022, 14, 3191. [Google Scholar] [CrossRef] [PubMed]
- Tonneau, M.; Phan, K.; Manem, V.S.K.; Low-Kam, C.; Dutil, F.; Kazandjian, S.; Vanderweyen, D.; Panasci, J.; Malo, J.; Coulombe, F.; et al. Generalization Optimizing Machine Learning to Improve CT Scan Radiomics and Assess Immune Checkpoint Inhibitors’ Response in Non-Small Cell Lung Cancer: A Multicenter Cohort Study. Front. Oncol. 2023, 13, 1196414. [Google Scholar] [CrossRef]
- Wiesweg, M.; Mairinger, F.; Reis, H.; Goetz, M.; Walter, R.F.H.; Hager, T.; Metzenmacher, M.; Eberhardt, W.E.E.; McCutcheon, A.; Köster, J.; et al. Machine Learning-Based Predictors for Immune Checkpoint Inhibitor Therapy of Non-Small-Cell Lung Cancer. Ann. Oncol. 2019, 30, 655–657. [Google Scholar] [CrossRef] [PubMed]
- Morris, L.G.T.; Kaufman, A.M.; Gong, Y.; Ramaswami, D.; Walsh, L.A.; Turcan, Ş.; Eng, S.; Kannan, K.; Zou, Y.; Peng, L.; et al. Recurrent Somatic Mutation of FAT1 in Multiple Human Cancers Leads to Aberrant Wnt Activation. Nat. Genet. 2013, 45, 253–261. [Google Scholar] [CrossRef] [PubMed]
- Gee, H.Y.; Sadowski, C.E.; Aggarwal, P.K.; Porath, J.D.; Yakulov, T.A.; Schueler, M.; Lovric, S.; Ashraf, S.; Braun, D.A.; Halbritter, J.; et al. FAT1 Mutations Cause a Glomerulotubular Nephropathy. Nat. Commun. 2016, 7, 10822. [Google Scholar] [CrossRef]
- Cheung, L.W.T.; Yu, S.; Zhang, D.; Li, J.; Ng, P.K.S.; Panupinthu, N.; Mitra, S.; Ju, Z.; Yu, Q.; Liang, H.; et al. Naturally Occurring Neomorphic PIK3R1 Mutations Activate the MAPK Pathway, Dictating Therapeutic Response to MAPK Pathway Inhibitors. Cancer Cell 2014, 26, 479–494. [Google Scholar] [CrossRef] [PubMed]
- Velghe, A.I.; Van Cauwenberghe, S.; Polyansky, A.A.; Chand, D.; Montano-Almendras, C.P.; Charni, S.; Hallberg, B.; Essaghir, A.; Demoulin, J.-B. PDGFRA Alterations in Cancer: Characterization of a Gain-of-Function V536E Transmembrane Mutant as Well as Loss-of-Function and Passenger Mutations. Oncogene 2014, 33, 2568–2576. [Google Scholar] [CrossRef]
- Osborn, M.J.; Upadhyaya, M. Evaluation of the Protein Truncation Test and Mutation Detection in the NF1 Gene: Mutational Analysis of 15 Known and 40 Unknown Mutations. Hum. Genet. 1999, 105, 327–332. [Google Scholar] [CrossRef] [PubMed]
- Rotow, J.K.; Gui, P.; Wu, W.; Raymond, V.M.; Lanman, R.B.; Kaye, F.J.; Peled, N.; Fece de la Cruz, F.; Nadres, B.; Corcoran, R.B.; et al. Co-Occurring Alterations in the RAS-MAPK Pathway Limit Response to MET Inhibitor Treatment in MET Exon 14 Skipping Mutation-Positive Lung Cancer. Clin. Cancer Res. Off. J. Am. Assoc. Cancer Res. 2020, 26, 439–449. [Google Scholar] [CrossRef]
- Pearson, A.; Proszek, P.; Pascual, J.; Fribbens, C.; Shamsher, M.K.; Kingston, B.; O’Leary, B.; Herrera-Abreu, M.T.; Cutts, R.J.; Garcia-Murillas, I.; et al. Inactivating NF1 Mutations Are Enriched in Advanced Breast Cancer and Contribute to Endocrine Therapy Resistance. Clin. Cancer Res. Off. J. Am. Assoc. Cancer Res. 2020, 26, 608–622. [Google Scholar] [CrossRef]
- Romo, C.G.; Slobogean, B.L.; Blair, L.K.; Blakeley, J.O. Trametinib for Aggressive Gliomas in Adults with Neurofibromatosis Type 1. J. Clin. Oncol. 2019, 37, e13562. [Google Scholar] [CrossRef]
- Fangusaro, J.; Onar-Thomas, A.; Young Poussaint, T.; Wu, S.; Ligon, A.H.; Lindeman, N.; Banerjee, A.; Packer, R.J.; Kilburn, L.B.; Goldman, S.; et al. Selumetinib in Paediatric Patients with BRAF-Aberrant or Neurofibromatosis Type 1-Associated Recurrent, Refractory, or Progressive Low-Grade Glioma: A Multicentre, Phase 2 Trial. Lancet Oncol. 2019, 20, 1011–1022. [Google Scholar] [CrossRef] [PubMed]
- Ameratunga, M.; McArthur, G.; Gan, H.; Cher, L. Prolonged Disease Control with MEK Inhibitor in Neurofibromatosis Type I-Associated Glioblastoma. J. Clin. Pharm. Ther. 2016, 41, 357–359. [Google Scholar] [CrossRef] [PubMed]
- Samstein, R.M.; Lee, C.-H.; Shoushtari, A.N.; Hellmann, M.D.; Shen, R.; Janjigian, Y.Y.; Barron, D.A.; Zehir, A.; Jordan, E.J.; Omuro, A.; et al. Tumor Mutational Load Predicts Survival after Immunotherapy across Multiple Cancer Types. Nat. Genet. 2019, 51, 202–206. [Google Scholar] [CrossRef] [PubMed]
Disclaimer/Publisher’s Note: The statements, opinions and data contained in all publications are solely those of the individual author(s) and contributor(s) and not of MDPI and/or the editor(s). MDPI and/or the editor(s) disclaim responsibility for any injury to people or property resulting from any ideas, methods, instructions or products referred to in the content. |
© 2024 by the author. Licensee MDPI, Basel, Switzerland. This article is an open access article distributed under the terms and conditions of the Creative Commons Attribution (CC BY) license (https://creativecommons.org/licenses/by/4.0/).