Article

Impacts of Electroconvulsive Therapy on the Neurometabolic Activity in a Mice Model of Depression: An Ex Vivo 1H-[13C]-NMR Spectroscopy Study

by
Ajay Sarawagi
1,2,
Pratishtha Wadnerkar
1,
Vrundika Keluskar
1,
Narra Sai Ram
1,
Jerald Mahesh Kumar
1 and
Anant Bahadur Patel
1,2,*
1
NMR Microimaging and Spectroscopy, CSIR-Centre for Cellular and Molecular Biology, Habsiguda, Uppal Road, Hyderabad 500007, India
2
Academy of Scientific and Innovative Research (AcSIR), Ghaziabad 201002, India
*
Author to whom correspondence should be addressed.
Neuroglia 2024, 5(3), 306-322; https://doi.org/10.3390/neuroglia5030021
Submission received: 19 July 2024 / Revised: 1 August 2024 / Accepted: 12 August 2024 / Published: 2 September 2024

Abstract

:
Electroconvulsive therapy (ECT) is an effective treatment for severe and drug-resistant depression, yet its mode of action remains poorly understood. This study aimed to evaluate the effects of ECT on neurometabolism using ex vivo 1H-[13C]-NMR spectroscopy in conjunction with intravenous infusion of [1,6-13C2]glucose in a chronic variable mild stress (CVMS) model of depression. Both CVMS and control mice were subjected to seven sessions of electroconvulsive shock under mild isoflurane anesthesia. The CVMS mice exhibited a reduction in sucrose preference (CVMS 67.1 ± 14.9%, n = 5; CON 86.5 ± 0.6%, n = 5; p = 0.007), and an increase in immobility duration (175.9 ± 22.6 vs. 92.0 ± 23.0 s, p < 0.001) in the forced-swim test. The cerebral metabolic rates of glucose oxidation in glutamatergic (CMRGlc(Glu)) (CVMS 0.134 ± 0.015 µmol/g/min, n = 5; CON 0.201 ± 0.045 µmol/g/min, n = 5; padj = 0.04) and GABAergic neurons (CMRGlc(GABA)) (0.030 ± 0.002 vs. 0.046 ± 0.011 µmol/g/min, padj = 0.04) were reduced in the prefrontal cortex (PFC) of CVMS mice. ECT treatment in CVMS mice normalized sucrose preference [F(1,27) = 0.0024, p = 0.961] and immobility duration [F(1,28) = 0.434, p = 0.515], but not the time spent in the center zone (CVMS + ECT 10.4 ± 5.5 s, CON + sham 22.3 ± 11.4 s, padj = 0.0006) in the open field test. The ECT-treated CVMS mice exhibited reduced (padj = 0.021) CMRGlc(Glu) in PFC (0.169 ± 0.026 µmol/g/min, n = 8) when compared with CVMS mice, which underwent the sham procedure (0.226 ± 0.030 µmol/g/min, n = 8). These observations are consistent with ECT’s anticonvulsant hypothesis for its anti-depressive action.

1. Introduction

Major depressive disorder (MDD) is a leading cause of global distress and disability, and it is characterized by low mood, anhedonia, cognitive impairment, and suicidal ideation [1,2]. The predominant hypothesis posits that depression originates due to a deficit in monoaminergic neurotransmission [3]. Hence, most antidepressants are targeted to modulate the levels of these neurotransmitters. However, these medications often have delayed positive effects, and many patients do not respond to them, and are categorized as treatment-resistant [4]. Electroconvulsive therapy (ECT) is considered as a rapid and effective treatment for drug-resistant depression [5]. Although the clinical efficacy of ECT is well-established, its mechanism of action is not very clear. Various mechanisms, including changes in neurotransmitter levels [6,7], increased levels of neurotrophic factors like brain derived neurotrophic factor (BDNF) and vascular endothelial growth factor in the hippocampus [8], and an improvement in functional connectivity and neuroplasticity have been proposed for the anti-depressive action of ECT [9].
Although the pathophysiology of depression is not fully understood [1], many studies suggest a crucial role of brain energy metabolism in psychiatric disorders, including depression [10,11]. Glutamatergic and GABAergic neurons, the major excitatory and inhibitory neurons in the mammalian central nervous system, respectively, account for 75–80% of the total brain energy demand [12]. Recent clinical and preclinical studies suggest the involvement of glutamatergic and GABAergic neurons in the pathophysiology of depression [13,14]. A 13C magnetic resonance spectroscopic (MRS) study has reported a reduced metabolic activity of glutamatergic neurons in the occipital cortex of depressed subjects [15]. Furthermore, reduced TCA cycle rates of glutamatergic and GABAergic neurons have been reported in the PFC of mice subjected to chronic unpredictable mild stress (CUMS) [16] and chronic social defeat stress (CSDS) models of depression [17].
Typical antidepressants such as paroxetine and fluoxetine were shown to restore the regional cerebral glucose metabolism to healthy levels in the prefrontal and parietal regions of the brain in depressed subjects assessed using positron emission tomography (PET) with [18F]fluorodeoxyglucose (18FDG) administration [18,19,20]. Moreover, the metabolic deficits of prefrontal glutamatergic and GABAergic neurons in depression were found to be normalized in clinical and preclinical studies involving fast-acting antidepressant interventions like ketamine [21,22]. The impacts of ECT on regional cerebral blood flow (rCBF) and cerebral metabolism are complex, and differ drastically in the brain regions and in a time-dependent manner [23,24,25]. The rCBF was reported to be reduced in the dorsolateral PFC after a week of ECT but increased in the left hippocampus [25]. Moreover, ECT was found to reduce glucose metabolism consistently in the frontal, parietal, and temporal brain regions in depressed subjects after 4–5 days of the last ECT session in PET studies [23,24]. Prefrontal hypometabolism post-ECT was found to be correlated with clinical improvement [23], indicating the association of anticonvulsive properties of ECT with the clinical effects [26,27]. However, there are reports of increased glucose metabolism after ECT in the basal ganglia, occipital and parietal regions, and hippocampus [28,29,30], confusing the understanding of ECT on brain metabolism. As PET measures cerebral glucose uptake, the impact of ECT on oxidative glucose metabolism, the major ATP-producing pathway in the brain, remains elusive. Most importantly, the impact of ECT on excitatory and inhibitory neuronal activity has not been evaluated quantitatively.
The use of proton-observed carbon-edited nuclear magnetic resonance (1H-[13C]-NMR) spectroscopy along with an intravenous infusion of 13C-labeled substrates offers a unique approach to monitor the energy requirement of glutamatergic and GABAergic neurons [31,32]. The metabolism of [1,6-13C2]glucose via the TCA cycle in glutamatergic and GABAergic neurons labels glutamate-C4 (GluC4) [33,34]. In GABAergic neurons, GluC4 is further decarboxylated to γ-aminobutyric acid-C2 (GABAC2) by glutamate decarboxylase. The labeling of glutamine-C4 (GlnC4) occurs through the release and uptake of GluC4 and GABAC2 in astrocytes, followed by transamination by glutamine synthetase (GS). Further metabolism of GluC4 and GABAC2 transfers the label into aspartate-C2/C3 (AspC2/C3). The incorporation of the 13C-label into different carbon positions of these neurometabolites provides a functional measure of neurometabolic activity [35]. In this study, we evaluated the impact of ECT on depression-like phenotypes and neurometabolic activity of glutamatergic and GABAergic neurons in the PFC and hippocampus in a chronic variable mild stress (CVMS) mouse model of depression using 1H-[13C]-NMR spectroscopy in conjunction with an intravenous infusion of [1,6-13C2]glucose.

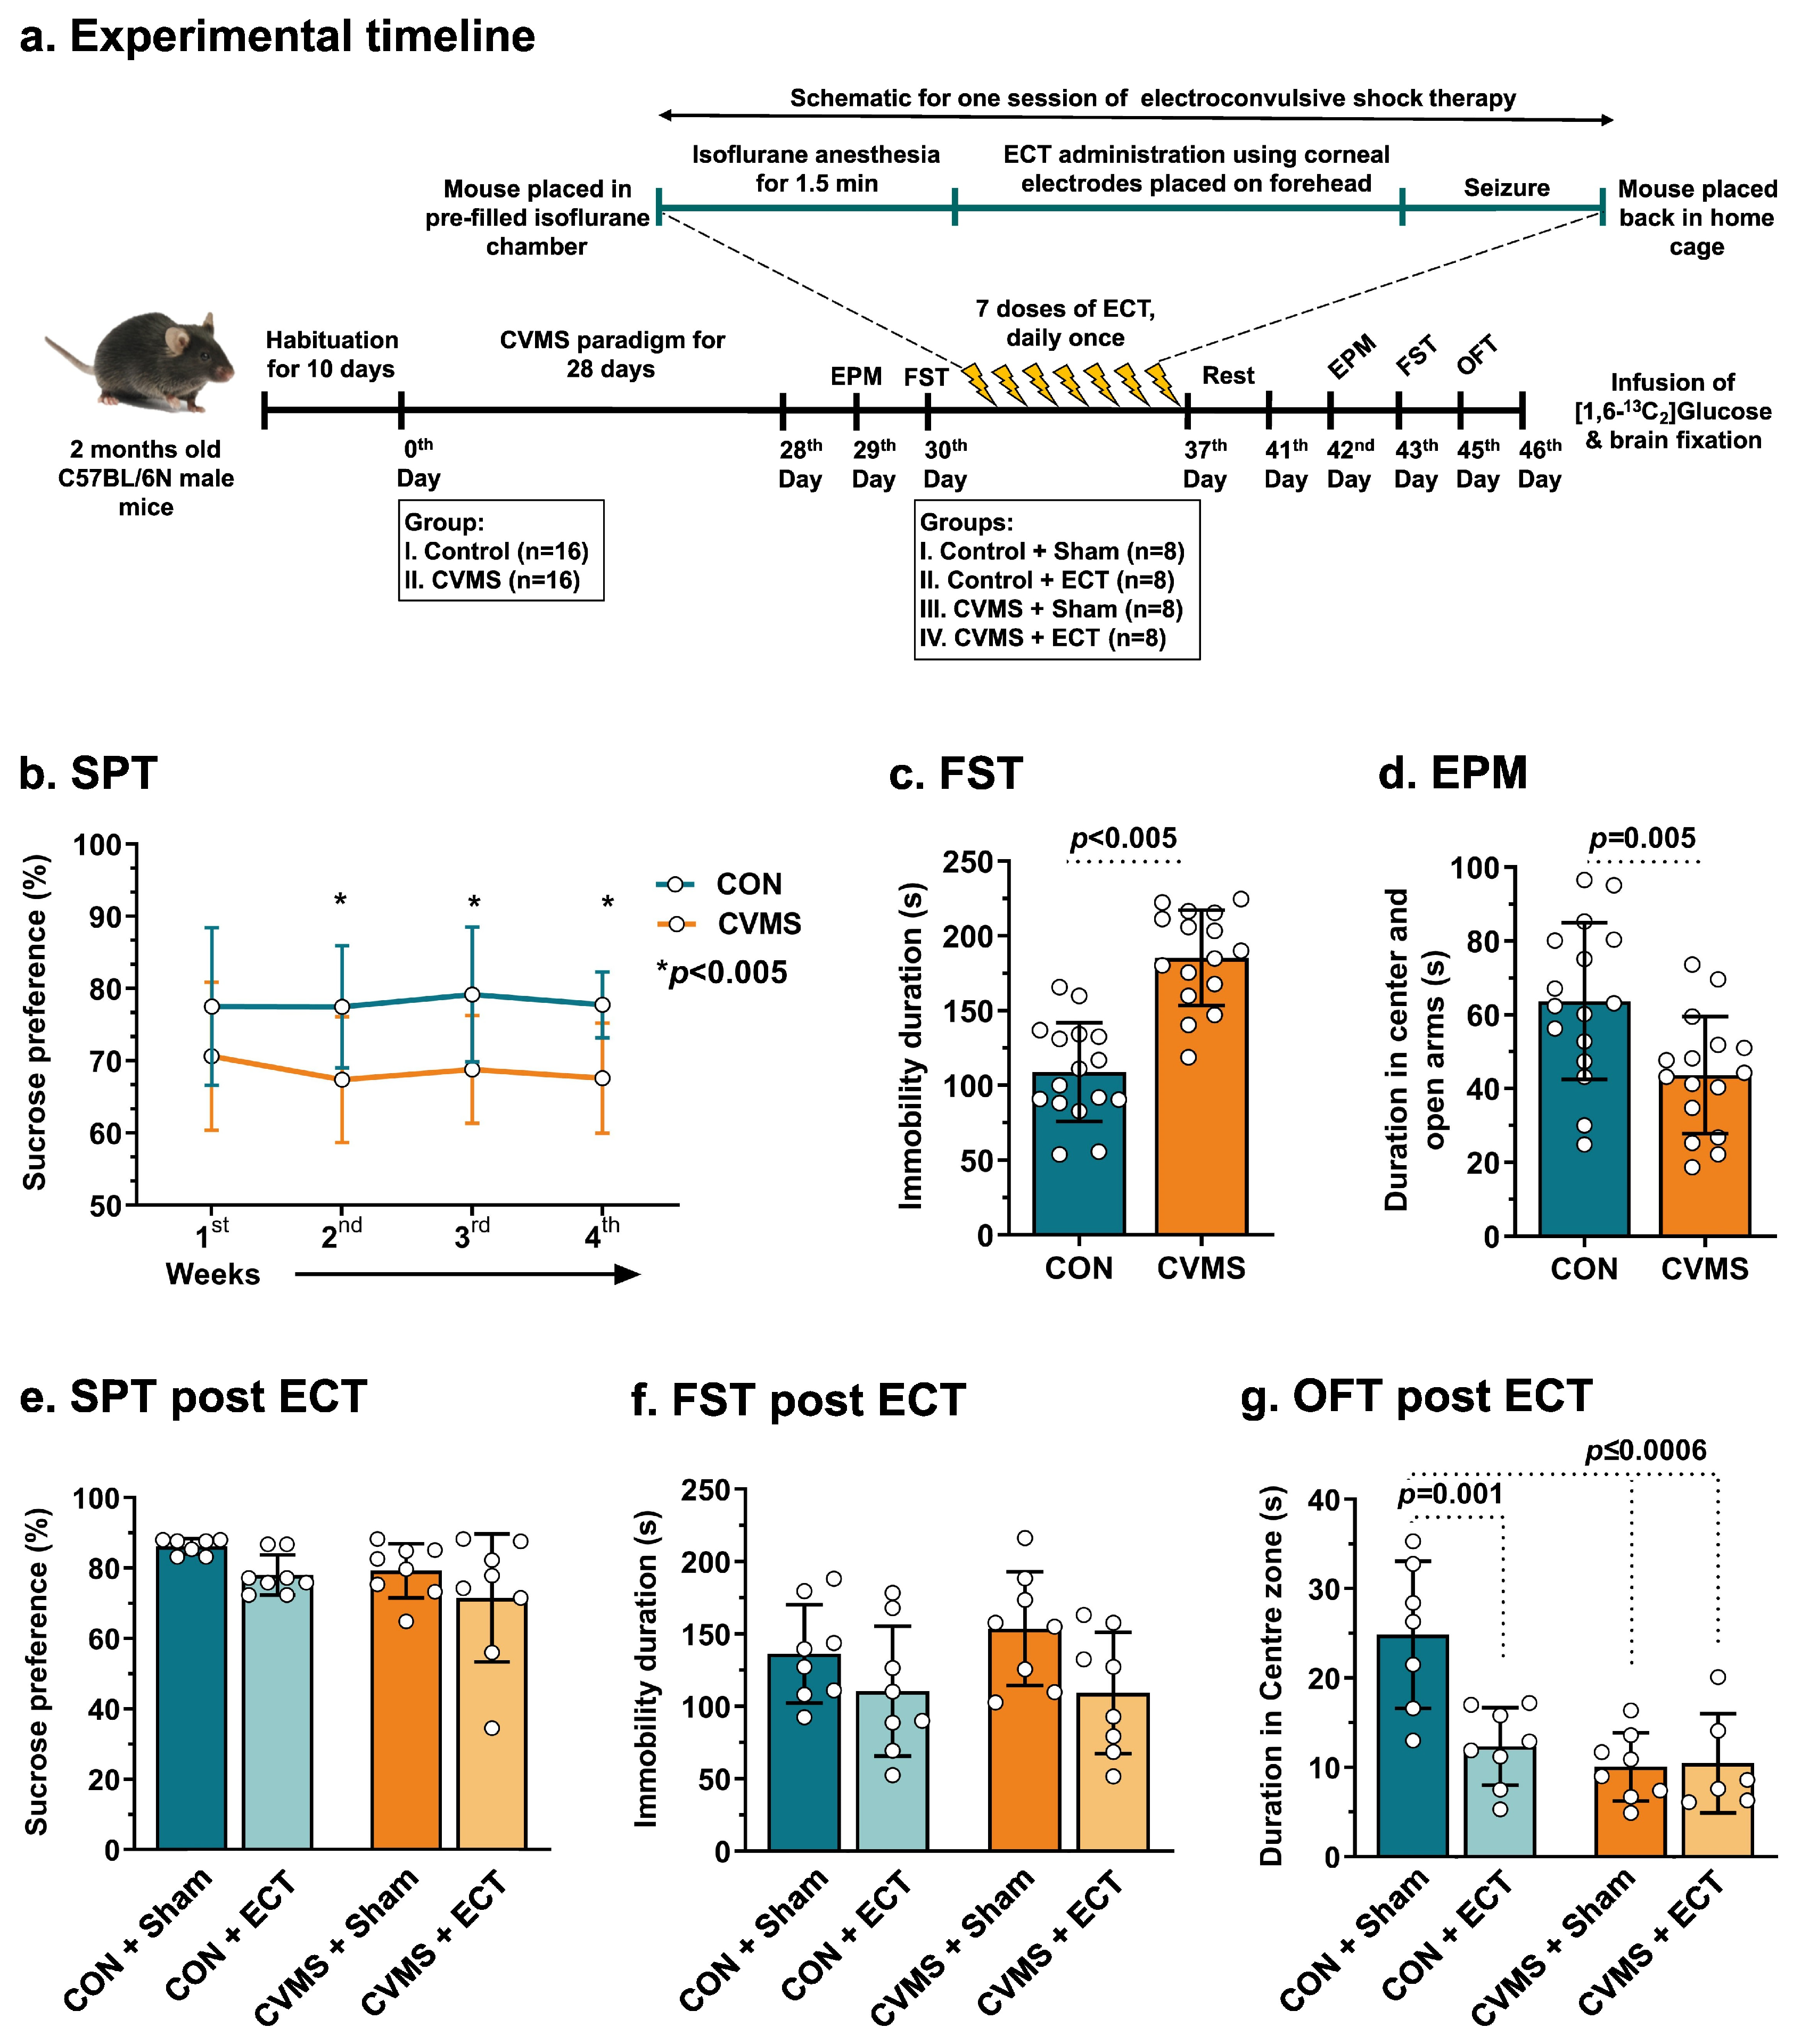
2. Materials and Methods

2.1. Animal Preparation

All procedures with animals were approved by the Institutional Animal Ethics Committee (IAEC #67/2022), Centre for Cellular and Molecular Biology (CCMB), Hyderabad. ARRIVE guidelines were followed in the preparation of the manuscript. Two-month-old C57BL/6N male mice were used for the study. Mice were maintained in open cages at ~23 °C with 50–70% humidity and a 12 h/12 h light/dark cycle that started at 6:00 am/6:00 pm, respectively, in the CCMB Animal House Facility. Mice were provided with a standard chow diet and water ad libitum.

2.2. Chronic Variable Mild Stress (CVMS) Paradigm

Two major experiments were carried out. In the first experiment, the impact of CVMS on behavioral phenotype and neurometabolism was evaluated. For this measurement, mice were divided into two groups: the control group (n = 5) and the CVMS (n = 5) group, using the chit-based randomization method. The sample size was based on previous studies from our laboratory in the CSDS and CUMS models of depression [16,17,21]. CVMS mice were kept socially isolated for the entire experimental period, while control mice were housed in groups. The CVMS group of mice was given mild stress for 21 days, while control mice were handled daily [16,36]. After 21 days of the CVMS paradigm, behavioral tests followed by an infusion of [1,6-13C2]glucose were carried out for neurometabolic analysis. Another group of animals was used to assess the therapeutic effects of ECT on depression-like phenotypes and neurometabolic activity. In this experiment, mice were divided into CVMS (n = 16) and control (n = 16) groups. The CVMS group of mice was subjected to mild stress for 28 days (Table S1). Mice were given the choice of 2% sucrose solution and water for drinking throughout the experiment to assess the sucrose preference with the progress of the CVMS paradigm.

2.3. Electroconvulsive Therapy (ECT) Procedure

To assess the impact of ECT on behavioral and metabolic activity in depression, CVMS and control groups of mice were randomly divided into four groups: Group I. CON + sham (n = 8); Group II. CON + ECT (n = 8); Group III. CVMS + sham (n = 8); Group IV. CVMS + ECT Group (n = 8). The mice in the ECT group received one electroconvulsive shock (ECS) daily for seven consecutive days using an ECS pulse generator (ECT Unit 57800 device, Ugo Basile, Comerio, Italy). For ECS, mice were anesthetized using isoflurane (~3.0% for 90 s) mixed in oxygen, and shock was delivered via corneal electrodes (model #57800-001, Ugo Basile, Comerio, Italy) using the following parameters: current 50 mA, shock duration 1 s, frequency 100 Hz, and pulse width 0.5 ms [8,37]. The sham mice were anesthetized, and electrodes were placed without any ECS.

2.4. Behavioral Analysis

The following behavioral tests were conducted to assess the depression-like phenotypes in mice before and after ECT.

2.4.1. Sucrose Preference Test (SPT)

In this test, animals were habituated to two bottles of 2% sucrose solution for 48 h. After the habituation period, one of the sucrose bottles was exchanged with a water bottle [17,38], and fluid consumption in each bottle was monitored daily by weighing. The position of the bottles was interchanged daily to eliminate positional preference. Sucrose preference, a measure for anhedonia, was calculated as 100 × {volume of sucrose consumed ÷ total (sucrose + water) volume of fluid consumed}.

2.4.2. Elevated-Plus Maze (EPM) Test

EPM was used to evaluate anxiety-like phenotypes in mice [39]. In brief, mice were placed in the center of a plus-shaped maze with two open and two closed arms (20 cm × 5 cm each) elevated 50 cm above the ground. The arena was thoroughly cleaned at the end of each trial using 70% ethanol. The movement of the animal was recorded for 5 min using an overhead camera, and the preference of animals staying in the open arms over the closed arms was used as a measure of the anxious phenotype.

2.4.3. Open Field Test (OFT)

This test was utilized to assess the basal locomotor activity and anxiety-like phenotypes in mice [40]. In brief, mice were placed in the center zone (20 × 20 cm) of a square-shaped box (40 × 40 × 40 cm) for 5 min under dim light conditions. The mouse activity was recorded using an overhead camera, and the video was analyzed with the help of the Ethovision-XT ver 17 (Noldus, Wageningen, the Netherlands) tracking system. The time spent in the center versus the periphery zone was measured for the anxiety phenotype.

2.4.4. Forced-Swim Test (FST)

In this test, mice were placed in a 10-liter glass beaker (20 cm diameter, 35 cm height) filled to 2/3rd volume with water (23 ± 2 °C) to assess behavioral despair [41]. The activity of mice was recorded for 5 min. The immobility duration of each mouse was determined by setting a threshold of 5% for the change in pixels between two adjacent frames of the recorded videos with the help of the Ethovision software.

2.5. Infusion of [1,6-13C2]Glucose

Mice were fasted for 4–5 h before metabolic measurement. Mice were anesthetized with urethane (1.5 g/kg, intraperitoneal), and the lateral tail vein was catheterized for the infusion of 13C-labeled glucose [42]. The body temperature was maintained at ~37 °C with a heating pad warmed by a temperature-regulated re-circulating water bath. Next, [1,6-13C2]glucose (99% atom, Cambridge Isotope Laboratories, Andover, MA, USA) dissolved in water (0.225 mol/L) was administered using a bolus variable rate infusion protocol schedule for 10 min using a programmable syringe pump (PHD 4400 Hpsi Syringe Pump, Harvard Apparatus Inc., Holliston, MA, USA). In brief, a bolus of 1012.5 μmol/kg of [1,6-13C2]glucose was administered for the initial 15 s; thereafter, the infusion rate was stepped down exponentially every 30 s to achieve 51 μmol/kg/min at 8.15 min [43]. The brain metabolism was arrested at the end of the 10 min of the infusion with a focused-beam microwave irradiation system (3 KW, 1.2 s; MMW-05, Muromachi Kikai Co., Ltd., Tokyo, Japan) [44]. The PFC and hippocampus were dissected immediately from the brain, snap-frozen in liquid nitrogen, and stored at −80 °C until further processing.

2.6. Preparation of Brain Sample for NMR Analysis

The brain metabolites were extracted from the PFC and hippocampus using the ethanol extraction protocol [45]. In brief, brain tissues were weighed, and homogenized in 0.1 N HCL in methanol (2:1 vol/wt) using a battery-operated tissue homogenizer. Next, [2-13C]glycine (50 μL, 2 mmol/L) (99% atom, Cambridge Isotope Laboratories, Andover, MA, USA) was added as an internal concentration reference. Tissues were further homogenized with 90% ethanol-phosphate buffer (6:1 vol/wt). The homogenate was centrifuged at 16,000× g for 45 min at 4 °C. The supernatant was collected, pH adjusted to 7, and lyophilized. The freeze-dried powder was dissolved in 550 µL in phosphate buffer (25 mmol/L, pH 7.0) prepared in 80% D2O containing 0.25 mmol/L sodium 3-(trimethylsilyl)propionate (TSP) (Sigma-Aldrich Inc., St. Louis, MO, USA) for NMR analysis.

2.7. NMR Analysis of Brain Samples

The concentration and 13C labeling of brain metabolites were measured using 1H-[13C]-NMR spectroscopy of brain tissue extracts at 600 MHz using an NMR micro-imager/spectrometer (Bruker Biospin, Ettlingen, Germany) [33,46]. The 1H-[13C]-NMR spectroscopy involves the acquisition of two spin-echo NMR spectra with and without 13C inversion pulse during spin echo. The 13C-edited NMR spectrum was obtained by subtracting the 13C inverted spectrum from those acquired without an inversion pulse. The concentrations of metabolites were determined relative to [2-13C]glycine added during the tissue extraction. The isotopic 13C enrichments of amino acids at different carbon positions were calculated from the ratio of the 13C resonances in the 1H-[13C]-NMR difference spectrum to the non-edited spectrum, and were corrected for natural abundance by subtracting 1.1% from the calculated value.

2.8. Determination of Rates of Glucose Oxidation

The cerebral metabolic rates of glucose oxidation (CMRGlc(Ox)) in the PFC and hippocampus were calculated using trapping pool approximation of 13C-label incorporated into different amino acids from the metabolism of [1,6-13C2]glucose in 10 min as described previously [21,47]. The total CMRGlc(Ox) was calculated as follows:
C M R G l c T o t a l = 1 10 × G l u C 4 + G A B A C 2 + G l n C 4 + 2 × ( G l u C 3 + G A B A C 4 + A s p C 3 }
where GluC4/C3, GABAC2/C4, and AspC3 represent the concentrations of 13C amino acids at a particular carbon position. The term ‘2’ before the parenthesis represents equal incorporation of 13C at carbon 2 and 3 for aspartate and glutamate. Similarly, the labeling of GABA at carbon 3 and 4 was assumed to be similar.
The rate of glucose oxidation in GABAergic neurons (CMRGlc(GABA)) was calculated as follows:
C M R G l c G A B A = 1 10 × 0.02 × G l u C 4 + 2 × G l u C 3 + ( G A B A C 2 + 2 × G A B A C 4 + 0.42 × ( 2 × A s p C 3 ) }
where 0.02 and 0.42 represent the glutamate and aspartate pool in GABAergic neurons.
Similarly, the rate of glucose oxidation in glutamatergic neurons (CMRGlc(Glu)) was estimated as follows:
C M R G l c G l u = 1 10 × { 0.82 × ( G l u C 4 + 2 × G l u C 3 ) + 0.42 × ( 2 × A s p C 3 )
The fractions 0.82 and 0.42 represent glutamate and aspartate pools in glutamatergic neurons [42].

2.9. Statistical Analysis

All the statistical analyses were carried out using GraphPad Prism software (ver 8.0.2, San Diego, CA, USA). The normal distribution of each data set was evaluated using the Shapiro–Wilk and Kolmogorov–Smirnov test. The significance of the difference of normally distributed datasets was evaluated using Student’s t-tests along with the Holm–Sidak method to correct for multiple comparisons. For a few datasets that do not follow a normal distribution, the Mann–Whitney test was used to assess the statistical significance of differences between groups. The two-way ANOVA with Tukey’s corrections for multiple comparisons was utilized to understand the statistical significance of the impact of ECS on various behavioral and metabolic measures. The analysis resulting in an adjusted p-value less than 0.05 was considered statistically significant. All values are presented as mean ± standard deviation (SD).

3. Results and Discussion

3.1. Impact of CVMS on Behavior and Metabolite Homeostasis

The CVMS mice were subjected to 21 days of stress paradigm (Figure 1a). These mice showed significantly (p = 0.007) reduced sucrose preference (67.1 ± 14.9%, n = 5) as compared to controls (86.5 ± 0.6%, n = 5), suggesting the development of anhedonia (Figure 1b), a clinical hallmark of depression [36]. Moreover, CVMS mice exhibited a significant (p < 0.001) increase in immobility duration (175.9 ± 22.6 s) as compared to controls (92.0 ± 23.0 s) in FST (Figure 1c). The increased immobility duration in CVMS mice represents a behavioral despair-like symptom, commonly seen in depressed subjects [48]. Furthermore, CVMS mice (25.6 ± 14.4 s) exhibited a trend (p = 0.07) of reduction for the time spent in the open arms of EPM as compared with CON mice (44.9 ± 15.8 s) (Figure 1d). These behavioral measures suggest a depression-like phenotype in CVMS mice.
The typical 1H-[13C]-NMR spectra from PFC extracts are presented in Figure 2a,b. The upper panel of these spectra represents the total concentration of the neurometabolites, while the lower depicts the level of 13C-labeled amino acids. The levels of neurometabolites were measured in the non-edited 1H-[13C]-NMR spectra (top panel Figure 2a,b). There was no significant (p ≥ 0.45) change in the levels of neurometabolites in the PFC and hippocampus of CVMS mice when compared with controls (Table S2). Previous 1H-MRS studies on neurometabolite levels in depression have shown inconsistent results [13]. Some reports suggested a decrease in the levels of glutamate [49,50] and GABA [21,51] in the PFC of depressed subjects, while others reported no significant change [52,53]. It is noteworthy that 1H-MRS measures the sum of intracellular and extracellular pools of glutamate and GABA within neurons and glia. Additionally, the intracellular neurotransmitter pool overwhelmingly dominates the extracellular with a ratio of 2000–5000:1 [54]. Consequently, changes in glutamate and GABA levels detected by 1H-MRS may not accurately represent abnormalities in synaptic activity.

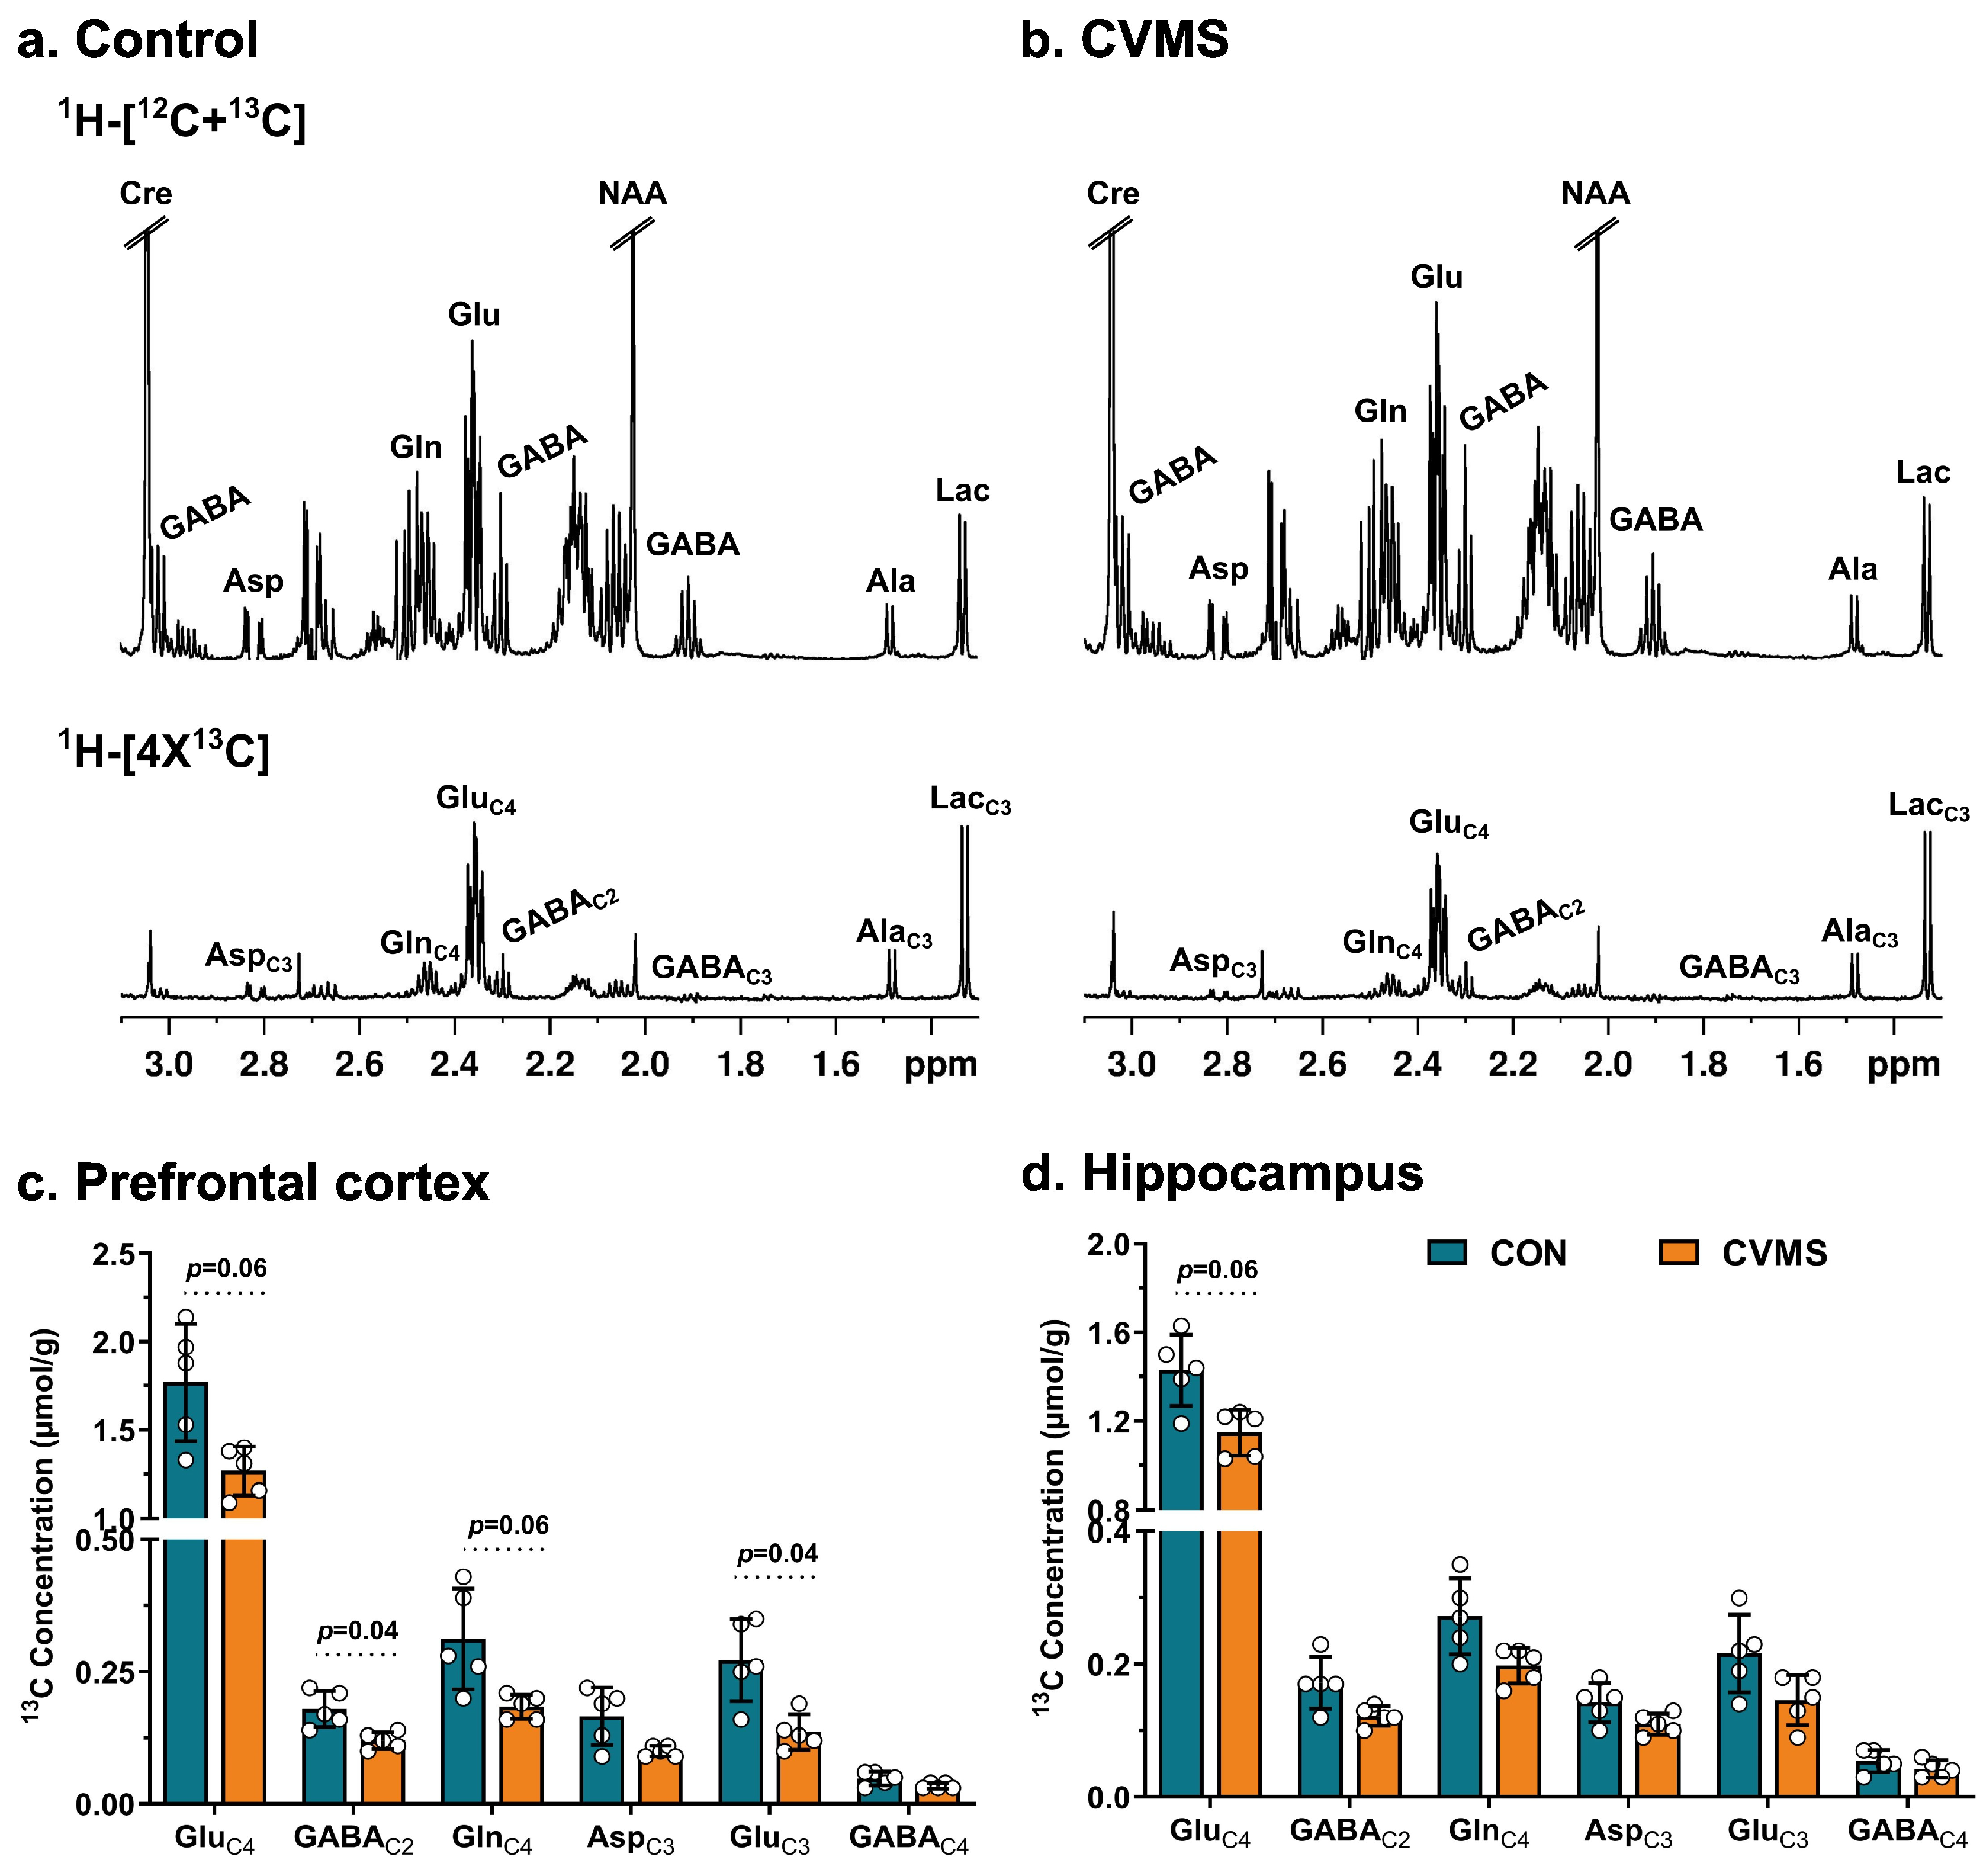
3.2. Labeling of Neurometabolites from [1,6-13C2]Glucose in CVMS Mice

The labeling of different amino acids is seen in the 13C-edited spectra presented in the lower panel of Figure 2a,b. The percent 13C enrichment of glucoseC1 in the brain was not significantly (p = 0.43) different between the CVMS (39.2 ± 1.8%) and control mice (40.7 ± 3.2%). The concentration of 13C-labeled neurometabolites was measured in the 1H-[13C]-NMR spectra from PFC (lower panel Figure 2a,b) and hippocampal tissue extracts. The analysis of 13C-labeled metabolites indicated a significant (padj = 0.040) reduction in the concentrations of GABAC2 (CVMS 0.12 ± 0.02 µmol/g, n = 5; CON 0.18 ± 0.03 µmol/g, n = 5), and GluC3 (0.14 ± 0.03 vs. 0.27 ± 0.08 µmol/g, padj = 0.040) in PFC of CVMS mice when compared with controls (Figure 2c). Although there was a reduction in the concentrations of GluC4, GlnC4, and AspC3 in PFC of CVMC mice, it did not reach statistical significance (padj ≥ 0.06) (Figure 2c). Similarly, while the concentrations of 13C-labeled amino acids were lower in the hippocampus (Figure 2d), they did not reach statistical significance (padj ≥ 0.06), potentially due to the small sample size. The decreased 13C-labeling of TCA cycle-linked amino acids from [1,6-13C2]glucose suggests reduced glucose oxidation in the TCA cycle of glutamatergic and GABAergic neurons in the PFC of CVMS mice [17].

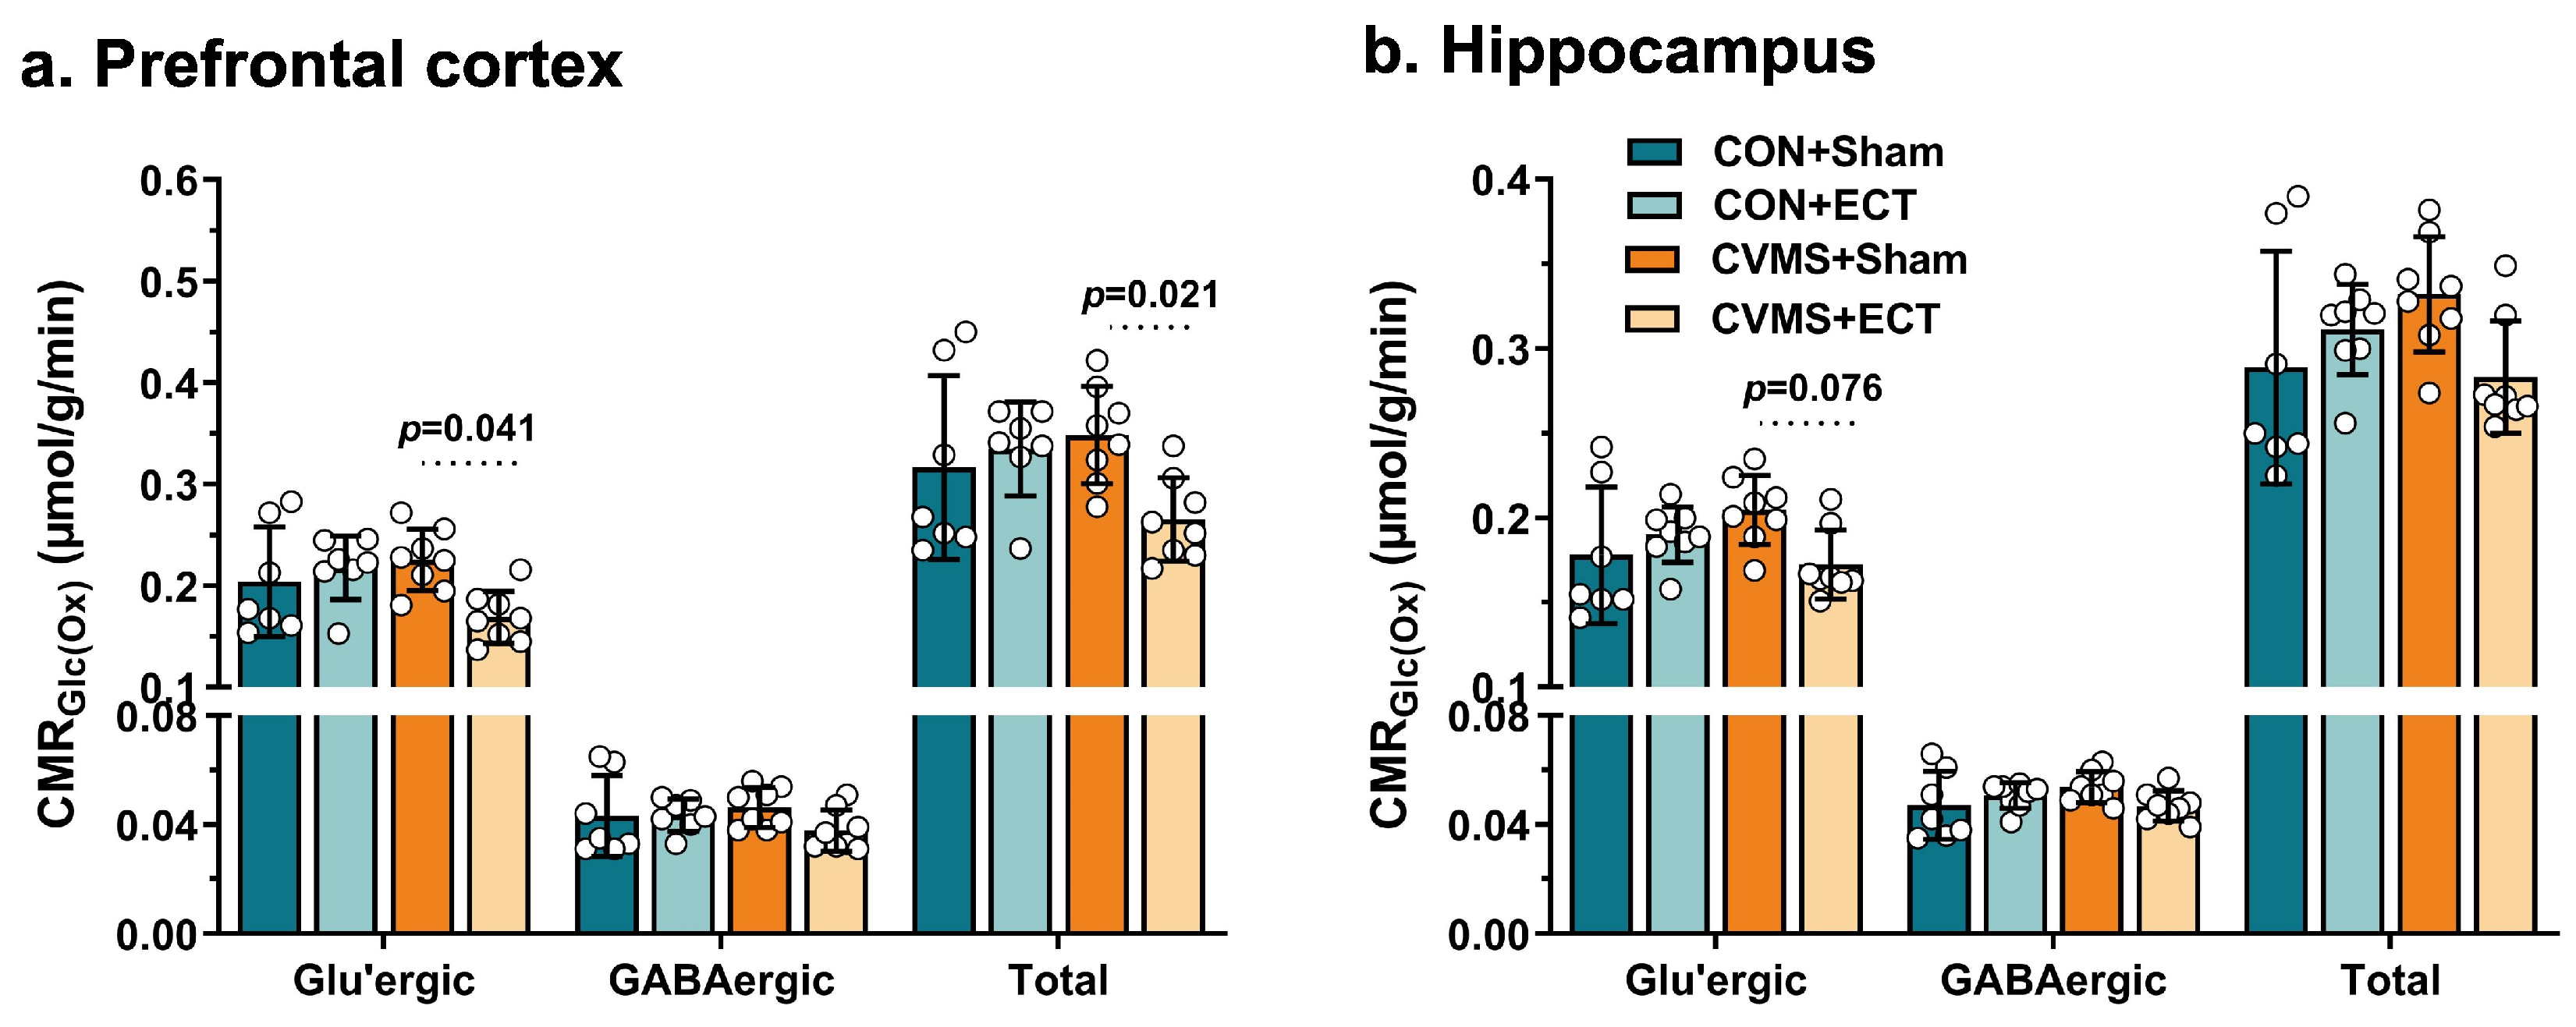
3.3. Oxidative Glucose Metabolism in Glutamatergic and GABAergic Neurons in CVMS Mice

Cerebral metabolic rates of glucose oxidation (CMRGlc(Ox)) were calculated from concentrations of 13C-labeledamino acids using Equations (1)–(3). The rate of total glucose oxidation (CMRGlc(Total)) was reduced significantly (padj = 0.04) in the PFC of CVMS mice (0.210 ± 0.022 µmol/g/min, n = 5) when compared with controls (0.319 ± 0.075 µmol/g/min, n = 5) (Figure 3a). Although there was a reduction in CMRGlc(Total) in the hippocampus of CVMS mice (0.206 ± 0.024 vs. 0.265 ± 0.046 µmol/g/min, padj = 0.078) (Figure 3b), it did not reach statistical significance.
The metabolic analysis at the sub-neuronal level indicated a significant (padj = 0.04) reduction in CMRGlc(Glu) in the PFC of CVMS mice (0.134 ± 0.015 µmol/g/min, n = 5) when compared with controls (0.201 ± 0.045 µmol/g/min, n = 5) (Figure 3a). Moreover, the CMRGlc(GABA) showed a significant (padj = 0.04) reduction in the PFC (0.030 ± 0.002 vs. 0.046 ± 0.011 µmol/g/min) (Figure 3a) of CVMS mice. There was no significant change in CMRGlc(Ox) for glutamatergic and GABAergic neurons in the hippocampus of CVMS mice (Figure 3b). The findings of hypo-glucose metabolism in PFC are in agreement with previous studies from our laboratory, reporting the reduced glucose oxidation in glutamatergic and GABAergic neurons in the PFC of the CSDS rodent model of depression [17,21]. Moreover, the reduced metabolic activity of prefrontal glutamatergic and GABAergic neurons was found to be positively correlated with the reduced sucrose preference in social interaction in CSDS mice [21]. Glucose metabolism assessed using PET with [18F]fluorodeoxyglucose (18FDG) has shown a reduction in the rates of glucose consumption in different brain regions, including the PFC, parietal cortex, and dorsal anterior cingulate in depressed subjects [10,11,19]. Additionally, regional cerebral blood flood (rCBF), a surrogate measure of brain activity, was found to be reduced in the gray matter of depressed subjects [55,56]. Most importantly, the dynamic 13C MRS measurement revealed a 26% reduction in mitochondrial energy production of glutamatergic neurons in the occipital cortex of depressed human subjects [15].
Previous 13C MRS measurements have revealed a stoichiometric (1:1) coupling between rates of neuronal oxidative glucose metabolism and neurotransmitter cycling [57,58]. Hence, the finding of reduced glucose oxidation rates in glutamatergic and GABAergic neurons in PFC of CVMS mice suggests decreased synaptic transmission in depression. The impaired synaptic transmission has been suggested in several previous studies reporting reduced expression of excitatory amino acid transporter (EAAT2) and glial glutamine synthetase (GS) transcripts in preclinical studies [17,59]. Our data, together with previous reports, suggest that impairment in glutamatergic and GABAergic transmission plays a significant role in the pathophysiology of depression.

3.4. Effects of ECT on Depression- and Anxiety-like Phenotypes

To understand the impact of ECT on depression-like phenotypes, a new cohort of animals was subjected to a 28-day CVMS paradigm (Figure 4a). The two-way ANOVA analysis of sucrose preference revealed a significant difference [F(1,120) = 37.88, p < 0.0001] between CVMS and control mice (Figure 4b). The sucrose preference in CVMS mice was significantly (padj = 0.0048) reduced (67.4 ± 8.4%, n = 16) compared to controls (77.5 ± 8.2%, n = 16) from the second week of the CVMS, and remained lower until the fourth week (67.6 ± 7.4 vs. 77.8 ± 4.4%, padj = 0.0045) of the stress paradigm (Figure 4b). Additionally, CVMS mice exhibited a significant increase in immobility duration (CVMS 185.3 ± 31.9 s, CON 108.9 ± 33.0 s, p < 0.001) in FST (Figure 4c), and reduced time in the open arms plus center zone (CVMS 43.7 ± 15.9 s, CON 63.7 ± 21.2 s, p = 0.0049) in the EPM test as compared to controls (Figure 4d).
The CVMS and control groups of mice were subjected to seven ECS sessions, and its impact on depression-like phenotypes was assessed four days after the last ECT session. The two-way ANOVA analysis indicated no significant difference for the sucrose preference [F(1,27) = 0.0024, p = 0.961] (Figure 4e), and immobility duration [F(1,28) = 0.434, p = 0.515] in FST among different groups of mice (Figure 4f). However, a significant stress x ECT interaction was seen for the time spent in the center zone [F(1,25) = 9.327, p = 0.005] in OFT. The post hoc analysis indicated that the time spent in the center zone by the CVMS + sham group of mice (10.1 ± 3.8 s) was significantly (padj = 0.002) lower compared to the CON + sham group (22.3 ± 11.4 s). ECT intervention in CVMS mice (10.4 ± 5.5 s, padj = 0.0006) failed to restore the time spent in the center zone to the CON + sham level (Figure 4g). It is noteworthy that there is no significant difference (padj ≥ 0.85) among CON + ECT, CVMS + sham, and CVMS + ECT groups of mice.
The finding of no significant (padj = 0.99) difference for sucrose preference between CVMS + sham mice (79.3 ± 7.7%) and CON + sham (81.0 ± 13.1%) group of mice (Figure 4e) could be due to the putative antidepressive properties of isoflurane, given seven days for the sham procedure (Figure 4a). Recent studies have indicated that isoflurane produces antidepressant-like behavioral effects by restoring BDNF levels and activating TrKB signaling in PFC and hippocampus [60], and restoring the synaptic density in the CA1, CA3, and dentate gyrus region of CUMS mice [61]. Rapid antidepressant effects of isoflurane have been reported in clinical settings as well [62], possibly linked to its ability to induce a cortical burst suppression phase [63].

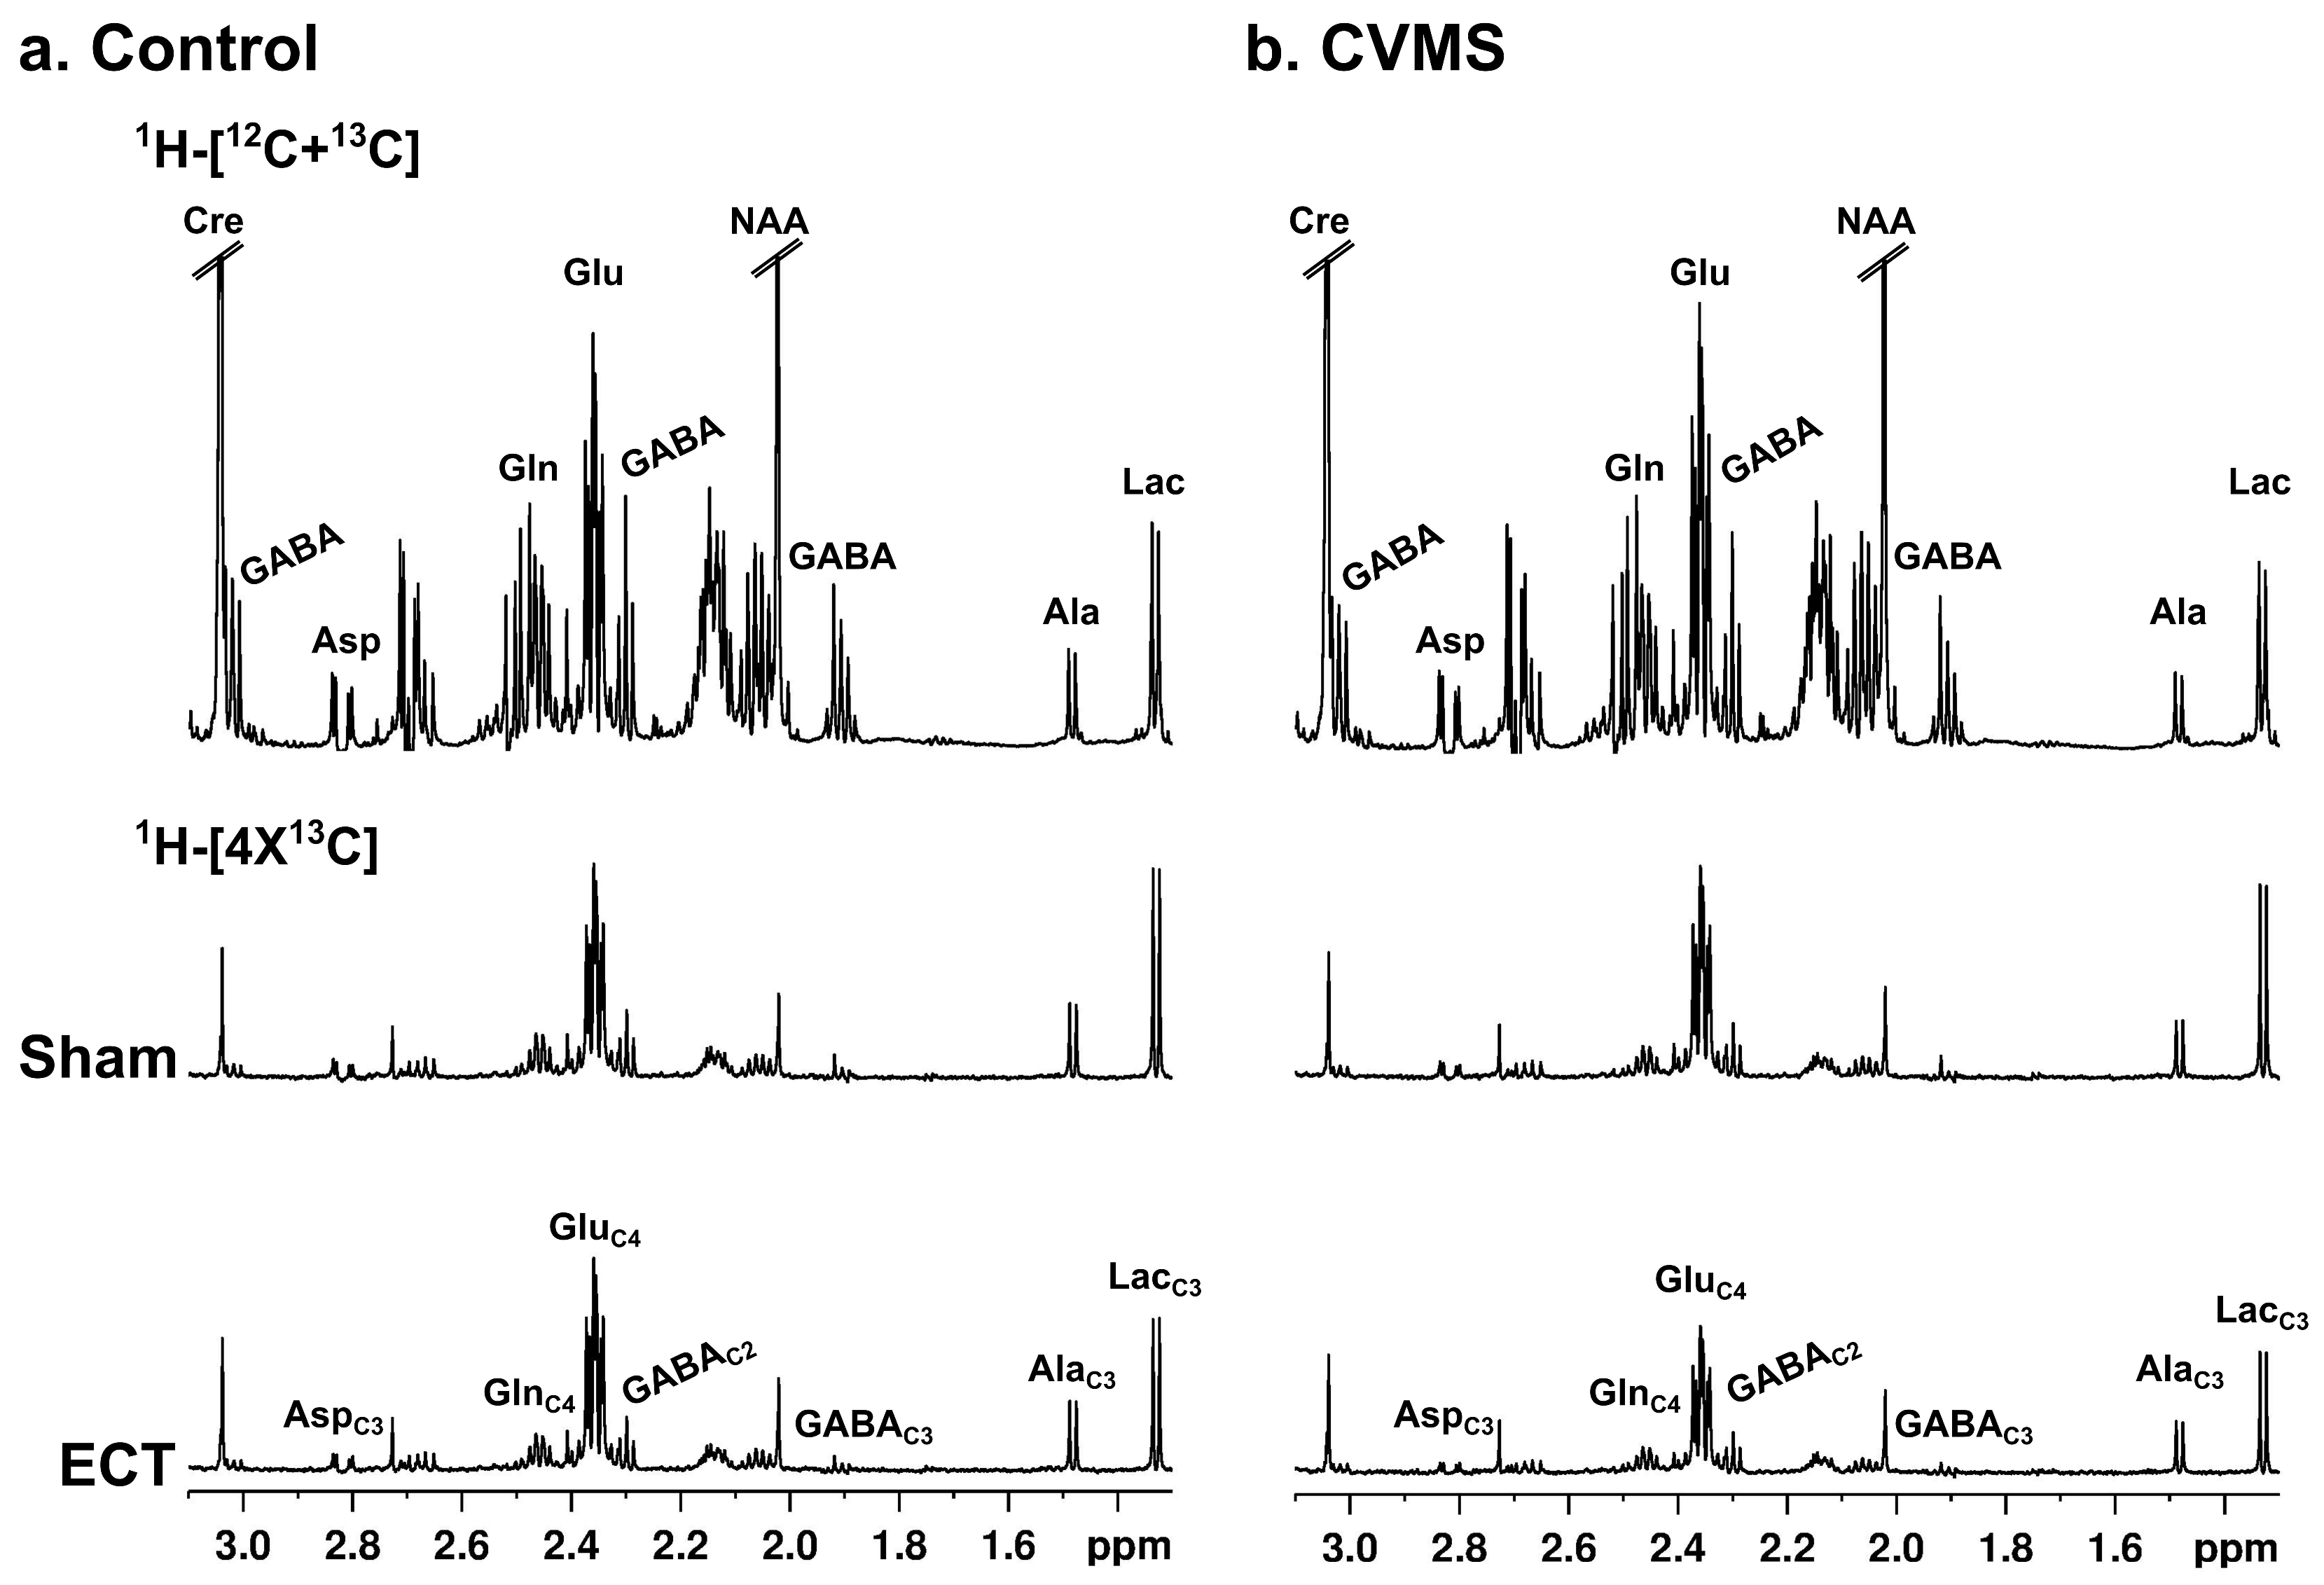
3.5. Impact of ECT on Neurometabolites Homeostasis

The levels of neurometabolites were measured in the non-edited 1H-[13C]-NMR spectra of PFC extracts (Figure 5). The two-way ANOVA revealed significant differences [F(1,27) = 10.67, p = 0.0030] for glutamate levels among different groups in PFC. The post hoc Tukey honest analysis indicated a significant (padj = 0.009) reduction in the level of glutamate in CVMS + ECT mice (11.7 ± 0.9 µmol/g, n = 8) when compared with the CON + ECT (13.5 ± 1.2 µmol/g, n = 8) group of mice (Table 1). The effects of ECT on glutamate levels are unclear. A few reports suggest a decrease in the levels of glutamate [64], while others show an increase [6,65,66] in the different brain areas of depressed subjects after ECT treatment. There was no significant change [F(1,27) ≤ 3.42, p ≥ 0.076] in the levels of other PFC neurometabolites. Moreover, there was a significant reduction in the levels of GABA (CVMS + sham 3.2 ± 0.1 µmol/g, n = 8; CON + sham 3.6 ± 0.2 µmol/g, n = 7; padj = 0.008) and myo-inositol (9.1 ± 0.4 vs. 9.8 ± 0.7 µmol/g, padj = 0.037) in the hippocampus of CVMS + sham mice when compared with CON + sham mice (Table 1). Interestingly, the deficits in the levels of GABA (padj = 0.999) and myo-inositol (padj = 0.254) were restored to the control levels following ECT treatment in CVMS mice (Table 1).
The findings of the restoration of GABA and myo-inositol in the current study are consistent with the previous studies reporting ECT-induced increases in GABA in the occipital cortex after 1–5 days [67], and myo-inositol in the fronto-limbic regions [68] in post-ECT measurements in depressed subjects. The increased GABA levels following ECT reinforce the anticonvulsant hypothesis of its mechanism of action [26], while an increased myo-inositol level indicates the role of gliogenesis in ECT’s mechanism of action [68]. An ECT-induced increase in the microglial population in the dentate gyrus region of chronic unpredictable stressed mice has been reported recently [69], strengthening the role of glial cells in the mechanism of ECT.
There was a significant (padj = 0.01) reduction in the level of hippocampal lactate in CVMS + ECT mice (1.3 ± 0.2 µmol/g) when compared with the CON + ECT group (1.6 ± 0.2 µmol/g). The ECT-induced decrease in the level of hippocampal lactate is a novel finding of the current study. There was no significant change in the levels of NAA in PFC (CVMS + ECT 6.8 ± 0.4 µmol/g, CVMS + sham 7.1 ± 0.5 µmol/g, padj = 0.59) and hippocampus (6.8 ± 0.3 vs. 6.5 ± 0.3 µmol/g, padj = 0.67) of CVMS mice after ECT treatment. These results contradict a large number of earlier studies reporting ECT-induced reduction in NAA levels [6,70] but align with others depicting no significant impact of ECT on the NAA [66,71].

3.6. Effects of ECT on 13C-Labeling of Neurometabolites from [1,6-13C2]Glucose

The concentrations of 13C-labeled metabolites were calculated from the 13C-edited NMR spectra (shown in the lower panels of Figure 5) in different groups of mice. The two-way ANOVA revealed a significant CVMS × ECT interaction for 13C-labeled GluC4 [F(1,27) = 8.601, p = 0.0068] and LacC3 [F(1,25) = 8.454, p = 0.008] in PFC. The post hoc analysis revealed that prefrontal GluC4 level was significantly (padj = 0.022) reduced in the CVMS + ECT mice (1.59 ± 0.20 µmol/g, n = 8) when compared with CON + ECT (2.08 ± 0.40 µmol/g, n = 8), and CVMS + sham mice (2.06 ± 0.27 µmol/g, n = 8, padj = 0.031) (Table 2). Additionally, the concentration of LacC3 was significantly reduced in the PFC (0.23 ± 0.11 vs. 0.44 ± 0.14 µmol/g, padj = 0.027) and hippocampus (0.26 ± 0.05 vs. 0.39 ± 0.09 µmol/g µmol/g, padj = 0.0035) of ECT-treated CVMS mice when compared with controls subjected to ECT (Table 2). A decrease in the labeling of GluC4 in CVMS + ECT mice indicates reduced glucose oxidation in the TCA cycle of glutamatergic neurons [31]. The reduced labeling of LacC3 from [1,6-13C2]glucose metabolism in PFC and hippocampus suggests a reduction in lactate dehydrogenase activity post-ECT in CVMS mice. Hence, reduced oxidative glucose metabolism in CVMS mice following ECT may be linked with reduced glycolytic flux as reported in PET studies [23,24].

3.7. Effects of ECT on Metabolic Activity of Glutamatergic and GABAergic Neurons

There was a significant CVMS x ECT interaction for total glucose oxidation (CMRGlc(Total)) [F(1,26) = 5.543, p = 0.0264] in PFC. The post hoc analysis revealed a significant (padj = 0.0418) reduction in the CVMS + ECT mice (0.265 ± 0.041 µmol/g/min, n = 8) when compared with CVMS + sham mice (0.348 ± 0.048 µmol/g/min; n = 8) PFC (Figure 6a). These results are in agreement with previous studies reporting reduced glucose metabolism in the frontal and parietal cortex [24], and decreased CBF in the dorsolateral-prefrontal regions [25,72] in depressed subjects following ECT. Our results, along with these reports, support the anticonvulsant hypothesis of ECT that posits that a postictal GABAergic inhibitory surge in the brain mediates the antidepressant effects of ECT [27]. The anticonvulsive hypothesis is supported by the increased seizure threshold [73] and increased aperiodic activity in EEG acquired after ECT treatment [74] in depressed subjects.
We further analyzed the metabolic activity of excitatory and inhibitory neurons individually post-ECT in CVMS mice. The two-way ANOVA showed a significant CVMS × ECT interaction [F(1,26) = 7.008, p = 0.0136] for glucose oxidation in glutamatergic neurons (CMRGlc(Glu)) of PFC. The post hoc analysis revealed a significant (padj = 0.021) reduction in CMRGlc(Glu) of CVMS + ECT mice (0.169 ± 0.026 µmol/g/min, n = 8) when compared with CVMS + sham mice (0.226 ± 0.030 µmol/g/min; n = 8) (Figure 6a). Additionally, there was a reduction in CMRGlc(Glu) of CVMS + ECT mice (0.173 ± 0.020 vs. 0.205 ± 0.021 µmol/g/min, n = 8) in the hippocampus (Figure 6b). However, it could not reach the level of statistical significance (padj = 0.076). There was no significant change in the glucose oxidation in GABAergic neurons (CMRGlc(GABA)) in PFC [F(1,26) = 1.616, p = 0.214] and hippocampus [F(1,26) = 4.010, p = 0.056] among different groups of mice (Figure 6). To the best of our knowledge, this is the first quantitative study to assess the impact of ECT on the neurometabolic activity of glutamatergic and GABAergic neurons. The finding of reduced CMRGlc(Glu) after ECT is consistent with the previous reports describing a reduction in glucose consumption in the bilateral anterior and posterior frontal areas in depressed subjects following ECT treatment [75]. These findings, together with established stoichiometric coupling between neuronal glucose oxidation and neurotransmitter cycling fluxes [57], suggest reduced glutamatergic neurotransmission with ECT in the PFC of CVMS mice.
It is noteworthy that CMRGlc(Glu) in CVMS + sham mice (0.226 ± 0.030 µmol/g/min, n = 8) was not significantly (padj = 0.66) different than CON + sham mice (0.204 ± 0.054 µmol/g/min, n = 7) in PFC (Figure 6a). Similarly, there was no difference in CMRGlc(GABA) (0.046 ± 0.007 vs. 0.043 ± 0.015 µmol/g/min; padj = 0.99) in PFC. The restoration in the neurometabolic activity in CVMS + sham mice might be due to the anticipated antidepressive action of isoflurane [61,63] that was provided during the sham procedure or due to a progressive dilution of depression-like phenotypes with time. This could be tested by including an additional group of mice without isoflurane or ECT intervention in future studies.

4. Summary

In summary, the current study showed that the CVMS paradigm induced depression-like phenotypes and hypometabolic activity of glutamatergic and GABAergic neurons in the PFC of CVMS mice. There was no difference in the depression-like phenotypes between CVMS and control mice after ECT treatment; however, the anxiety measure persisted post-ECT. Moreover, ECT intervention in CVMS mice restored the GABA and myo-inositol levels to the control values in the hippocampus, while it imparted a negative impact on hippocampal lactate and PFC glutamate levels. Furthermore, ECT-induced reductions in the levels of GluC4 and LacC3 in PFC suggest a glucose metabolic deficit in CVMS mice after ECT intervention, supporting the anticonvulsant hypothesis of ECT’s mechanism of action.

Supplementary Materials

The following supporting information can be downloaded at: https://www.mdpi.com/article/10.3390/neuroglia5030021/s1, Table S1: chronic variable mild stress paradigm; Table S2: Concentration (µmol/g) of neurometabolites in the prefrontal cortex and hippocampus of control and CVMS mice.

Author Contributions

A.S.: Animal experiment, data acquisition, analysis and interpretation of results, manuscript writing; P.W., V.K. and N.S.R.: animal experiment; J.M.K.: reagent; A.B.P.: conceptualization and experimental design, funding acquisition, reagents, analytic tools, analysis and interpretation of results, manuscript writing, supervised and directed the overall project. All authors have read and agreed to the published version of the manuscript.

Funding

This study was supported by funding from the Council for Scientific and Industrial Research, Government of India (Health Care Theme FBR/MLP0150). A.S. thanks the Department of Biotechnology for the award of Senior Research fellowship.

Institutional Review Board Statement

The animal study protocol was approved by the Institutional Animal Ethics Committee (IAEC 67/2022), Centre for Cellular and Molecular Biology (CCMB), Hyderabad, and conducted in accordance with the guidelines established by the Committee for the Purpose of Control and Supervision of Experiments on Animals, Ministry of Environment and Forests, Government of India.

Informed Consent Statement

Not applicable.

Data Availability Statement

The raw data related to this study are available on request from the corresponding author.

Acknowledgments

The authors wish to thank Robin de Graff at Yale University for providing the POCE pulse sequence and K. S. Varadarajan for helping to record the NMR spectra. All NMR experiments were carried out in the NMR Microimaging and Spectroscopy Facility, CSIR-CCMB, Hyderabad, India.

Conflicts of Interest

The author(s) declared no potential conflicts of interest with respect to the research, authorship, and/or publication of this article.

References

  1. Herrman, H.; Patel, V.; Kieling, C.; Berk, M.; Buchweitz, C.; Cuijpers, P.; Furukawa, T.A.; Kessler, R.C.; Kohrt, B.A.; Maj, M.; et al. Time for United Action on Depression: A Lancet–World Psychiatric Association Commission. Lancet 2022, 399, 957–1022. [Google Scholar] [CrossRef] [PubMed]
  2. Otte, C.; Gold, S.M.; Penninx, B.W.; Pariante, C.M.; Etkin, A.; Fava, M.; Mohr, D.C.; Schatzberg, A.F. Major Depressive Disorder. Nat. Rev. Dis. Prim. 2016, 2, 16065. [Google Scholar] [CrossRef]
  3. Perez-Caballero, L.; Torres-Sanchez, S.; Romero-Lopez-Alberca, C.; Gonzalez-Saiz, F.; Mico, J.A.; Berrocoso, E. Monoaminergic System and Depression. Cell Tissue Res. 2019, 377, 107–113. [Google Scholar] [CrossRef]
  4. Voineskos, D.; Daskalakis, Z.J.; Blumberger, D.M. Management of Treatment-Resistant Depression: Challenges and Strategies. NDT 2020, 16, 221–234. [Google Scholar] [CrossRef] [PubMed]
  5. Espinoza, R.T.; Kellner, C.H. Electroconvulsive Therapy. N. Engl. J. Med. 2022, 386, 667–672. [Google Scholar] [CrossRef] [PubMed]
  6. Cano, M.; Martínez-Zalacaín, I.; Bernabéu-Sanz, Á.; Contreras-Rodríguez, O.; Hernández-Ribas, R.; Via, E.; De Arriba-Arnau, A.; Gálvez, V.; Urretavizcaya, M.; Pujol, J.; et al. Brain Volumetric and Metabolic Correlates of Electroconvulsive Therapy for Treatment-Resistant Depression: A Longitudinal Neuroimaging Study. Transl. Psychiatry 2017, 7, e1023. [Google Scholar] [CrossRef] [PubMed]
  7. Erchinger, V.J.; Ersland, L.; Aukland, S.M.; Abbott, C.C.; Oltedal, L. Magnetic Resonance Spectroscopy in Depressed Subjects Treated with Electroconvulsive Therapy—A Systematic Review of Literature. Front. Psychiatry 2021, 12, 608857. [Google Scholar] [CrossRef]
  8. Maynard, K.R.; Hobbs, J.W.; Rajpurohit, S.K.; Martinowich, K. Electroconvulsive Seizures Influence Dendritic Spine Morphology and BDNF Expression in a Neuroendocrine Model of Depression. Brain Stimul. 2018, 11, 856–859. [Google Scholar] [CrossRef]
  9. Dukart, J.; Regen, F.; Kherif, F.; Colla, M.; Bajbouj, M.; Heuser, I.; Frackowiak, R.S.; Draganski, B. Electroconvulsive Therapy-Induced Brain Plasticity Determines Therapeutic Outcome in Mood Disorders. Proc. Natl. Acad. Sci. USA 2014, 111, 1156–1161. [Google Scholar] [CrossRef]
  10. Hosokawa, T.; Momose, T.; Kasai, K. Brain Glucose Metabolism Difference between Bipolar and Unipolar Mood Disorders in Depressed and Euthymic States. Prog. Neuro-Psychopharmacol. Biol. Psychiatry 2009, 33, 243–250. [Google Scholar] [CrossRef]
  11. Li, C.-T.; Su, T.-P.; Wang, S.-J.; Tu, P.-C.; Hsieh, J.-C. Prefrontal Glucose Metabolism in Medication-Resistant Major Depression. Br. J. Psychiatry 2015, 206, 316–323. [Google Scholar] [CrossRef]
  12. Howarth, C.; Gleeson, P.; Attwell, D. Updated Energy Budgets for Neural Computation in the Neocortex and Cerebellum. J. Cereb. Blood Flow Metab. 2012, 32, 1222–1232. [Google Scholar] [CrossRef]
  13. Godfrey, K.E.M.; Gardner, A.C.; Kwon, S.; Chea, W.; Muthukumaraswamy, S.D. Differences in Excitatory and Inhibitory Neurotransmitter Levels between Depressed Patients and Healthy Controls: A Systematic Review and Meta-Analysis. J. Psychiatr. Res. 2018, 105, 33–44. [Google Scholar] [CrossRef]
  14. Sarawagi, A.; Soni, N.D.; Patel, A.B. Glutamate and GABA Homeostasis and Neurometabolism in Major Depressive Disorder. Front. Psychiatry 2021, 12, 637863. [Google Scholar] [CrossRef]
  15. Abdallah, C.G.; Jiang, L.; De Feyter, H.M.; Fasula, M.; Krystal, J.H.; Rothman, D.L.; Mason, G.F.; Sanacora, G. Glutamate Metabolism in Major Depressive Disorder. AJP 2014, 171, 1320–1327. [Google Scholar] [CrossRef] [PubMed]
  16. Mishra, P.K.; Adusumilli, M.; Deolal, P.; Mason, G.F.; Kumar, A.; Patel, A.B. Impaired Neuronal and Astroglial Metabolic Activity in Chronic Unpredictable Mild Stress Model of Depression: Reversal of Behavioral and Metabolic Deficit with Lanicemine. Neurochem. Int. 2020, 137, 104750. [Google Scholar] [CrossRef] [PubMed]
  17. Veeraiah, P.; Noronha, J.M.; Maitra, S.; Bagga, P.; Khandelwal, N.; Chakravarty, S.; Kumar, A.; Patel, A.B. Dysfunctional Glutamatergic and γ-Aminobutyric Acidergic Activities in Prefrontal Cortex of Mice in Social Defeat Model of Depression. Biol. Psychiatry 2014, 76, 231–238. [Google Scholar] [CrossRef]
  18. Brody, A.L.; Saxena, S.; Silverman, D.H.S.; Fairbanks, L.A.; Phelps, M.E.; Huang, S.-C.; Wu, H.-M.; Maidment, K.; Baxter, L.R.; Alborzian, S. Brain Metabolic Changes in Major Depressive Disorder from Pre- to Post-Treatment with Paroxetine. Psychiatry Res. Neuroimaging 1999, 91, 127–139. [Google Scholar] [CrossRef] [PubMed]
  19. Kennedy, S.H. Changes in Regional Brain Glucose Metabolism Measured with Positron Emission Tomography after Paroxetine Treatment of Major Depression. Am. J. Psychiatry 2001, 158, 899–905. [Google Scholar] [CrossRef]
  20. Mayberg, H.S.; Brannan, S.K.; Tekell, J.L.; Silva, J.A.; Mahurin, R.K.; McGinnis, S.; Jerabek, P.A. Regional Metabolic Effects of Fluoxetine in Major Depression: Serial Changes and Relationship to Clinical Response. Biol. Psychiatry 2000, 48, 830–843. [Google Scholar] [CrossRef]
  21. Mishra, P.K.; Kumar, A.; Behar, K.L.; Patel, A.B. Subanesthetic Ketamine Reverses Neuronal and Astroglial Metabolic Activity Deficits in a Social Defeat Model of Depression. J. Neurochem. 2018, 146, 722–734. [Google Scholar] [CrossRef] [PubMed]
  22. Abdallah, C.G.; De Feyter, H.M.; Averill, L.A.; Jiang, L.; Averill, C.L.; Chowdhury, G.M.I.; Purohit, P.; De Graaf, R.A.; Esterlis, I.; Juchem, C.; et al. The Effects of Ketamine on Prefrontal Glutamate Neurotransmission in Healthy and Depressed Subjects. Neuropsychopharmacol 2018, 43, 2154–2160. [Google Scholar] [CrossRef] [PubMed]
  23. Henry, M.E.; Schmidt, M.E.; Matochik, J.A.; Stoddard, E.P.; Potter, W.Z. The Effects of ECT on Brain Glucose: A Pilot FDG PET Study. J. ECT 2001, 17, 33–40. [Google Scholar] [CrossRef] [PubMed]
  24. Nobler, M.S.; Oquendo, M.A.; Kegeles, L.S.; Malone, K.M.; Campbell, C.; Sackeim, H.A.; Mann, J.J. Decreased Regional Brain Metabolism After ECT. AJP 2001, 158, 305–308. [Google Scholar] [CrossRef] [PubMed]
  25. Gbyl, K.; Lindberg, U.; Wiberg Larsson, H.B.; Rostrup, E.; Videbech, P. Cerebral Perfusion Is Related to Antidepressant Effect and Cognitive Side Effects of Electroconvulsive Therapy. Brain Stimul. 2022, 15, 1486–1494. [Google Scholar] [CrossRef] [PubMed]
  26. Duthie, A.C.; Perrin, J.S.; Bennett, D.M.; Currie, J.; Reid, I.C. Anticonvulsant Mechanisms of Electroconvulsive Therapy and Relation to Therapeutic Efficacy. J. ECT 2015, 31, 173–178. [Google Scholar] [CrossRef]
  27. Sackeim, H.A. The Anticonvulsant Hypothesis of the Mechanisms of Action of ECT: Current Status. J. ECT 1999, 15, 5–26. [Google Scholar] [CrossRef]
  28. McCormick, L.M.; Boles Ponto, L.L.; Pierson, R.K.; Johnson, H.J.; Magnotta, V.; Brumm, M.C. Metabolic Correlates of Antidepressant and Antipsychotic Response in Patients with Psychotic Depression Undergoing Electroconvulsive Therapy. J. ECT 2007, 23, 265–273. [Google Scholar] [CrossRef]
  29. Suwa, T.; Namiki, C.; Takaya, S.; Oshita, A.; Ishizu, K.; Fukuyama, H.; Suga, H.; Murai, T. Corticolimbic Balance Shift of Regional Glucose Metabolism in Depressed Patients Treated with ECT. J. Affect. Disord. 2012, 136, 1039–1046. [Google Scholar] [CrossRef]
  30. Yuuki, N.; Ida, I.; Oshima, A.; Kumano, H.; Takahashi, K.; Fukuda, M.; Oriuchi, N.; Endo, K.; Matsuda, H.; Mikuni, M. HPA Axis Normalization, Estimated by DEX/CRH Test, but Less Alteration on Cerebral Glucose Metabolism in Depressed Patients Receiving ECT after Medication Treatment Failures. Acta Psychiatr. Scand. 2005, 112, 257–265. [Google Scholar] [CrossRef]
  31. Fitzpatrick, S.M.; Hetherington, H.P.; Behar, K.L.; Shulman, R.G. The Flux from Glucose to Glutamate in the Rat Brain in Vivo as Determined by 1-Observed, 13C-Edited NMR Spectroscopy. J. Cereb. Blood Flow Metab. 1990, 10, 170–179. [Google Scholar] [CrossRef] [PubMed]
  32. de Graaf, R.A.; Brown, P.B.; Mason, G.F.; Rothman, D.L.; Behar, K.L. Detection of [1,6-13C2]-Glucose Metabolism in Rat Brain by in Vivo 1H-[13C]-NMR Spectroscopy. Magn. Reson. Med. 2003, 49, 37–46. [Google Scholar] [CrossRef]
  33. De Graaf, R.A.; Mason, G.F.; Patel, A.B.; Behar, K.L.; Rothman, D.L. In vivo1H-[13C]-NMR Spectroscopy of Cerebral Metabolism. NMR Biomed. 2003, 16, 339–357. [Google Scholar] [CrossRef]
  34. Patel, A.B.; Tiwari, V.; Veeraiah, P.; Saba, K. Increased Astroglial Activity and Reduced Neuronal Function across Brain in AβPP-PS1 Mouse Model of Alzheimer’s Disease. J. Cereb. Blood Flow Metab. 2018, 38, 1213–1226. [Google Scholar] [CrossRef]
  35. Rothman, D.L.; Graaf, R.A.; Hyder, F.; Mason, G.F.; Behar, K.L.; De Feyter, H.M. In Vivo 13C and 1H-[13C] MRS Studies of Neuroenergetics and Neurotransmitter Cycling, Applications to Neurological and Psychiatric Disease and Brain Cancer. NMR Biomed. 2019, 32, e4172. [Google Scholar] [CrossRef] [PubMed]
  36. Willner, P.; Muscat, R.; Papp, M. Chronic Mild Stress-Induced Anhedonia: A Realistic Animal Model of Depression. Neurosci. Biobehav. Rev. 1992, 16, 525–534. [Google Scholar] [CrossRef] [PubMed]
  37. Theilmann, W.; Löscher, W.; Socala, K.; Frieling, H.; Bleich, S.; Brandt, C. A New Method to Model Electroconvulsive Therapy in Rats with Increased Construct Validity and Enhanced Translational Value. J. Psychiatr. Res. 2014, 53, 94–98. [Google Scholar] [CrossRef]
  38. Liu, M.-Y.; Yin, C.-Y.; Zhu, L.-J.; Zhu, X.-H.; Xu, C.; Luo, C.-X.; Chen, H.; Zhu, D.-Y.; Zhou, Q.-G. Sucrose Preference Test for Measurement of Stress-Induced Anhedonia in Mice. Nat. Protoc. 2018, 13, 1686–1698. [Google Scholar] [CrossRef]
  39. Walf, A.A.; Frye, C.A. The Use of the Elevated plus Maze as an Assay of Anxiety-Related Behavior in Rodents. Nat. Protoc. 2007, 2, 322–328. [Google Scholar] [CrossRef]
  40. Gould, T.D.; Dao, D.T.; Kovacsics, C.E. The Open Field Test. In Mood and Anxiety Related Phenotypes in Mice; Gould, T.D., Ed.; Neuromethods; Humana Press: Totowa, NJ, USA, 2009; Volume 42, pp. 1–20. ISBN 978-1-60761-302-2. [Google Scholar]
  41. Juszczak, G.R.; Lisowski, P.; Śliwa, A.T.; Swiergiel, A.H. Computer Assisted Video Analysis of Swimming Performance in a Forced Swim Test: Simultaneous Assessment of Duration of Immobility and Swimming Style in Mice Selected for High and Low Swim-Stress Induced Analgesia. Physiol. Behav. 2008, 95, 400–407. [Google Scholar] [CrossRef]
  42. Tiwari, V.; Ambadipudi, S.; Patel, A.B. Glutamatergic and GABAergic TCA Cycle and Neurotransmitter Cycling Fluxes in Different Regions of Mouse Brain. J. Cereb. Blood Flow Metab. 2013, 33, 1523–1531. [Google Scholar] [CrossRef]
  43. Roy, D.; Puvvada, M.; Kapanaiah, S.K.T.; Patel, A.B. Enhanced Cortical Metabolic Activity in Females and Males of a Slow Progressing Mouse Model of Amyotrophic Lateral Sclerosis. Neurochem. Res. 2022, 47, 1765–1777. [Google Scholar] [CrossRef] [PubMed]
  44. de Graaf, R.A.; Chowdhury, G.M.I.; Brown, P.B.; Rothman, D.L.; Behar, K.L. In Situ 3D Magnetic Resonance Metabolic Imaging of Microwave-Irradiated Rodent Brain: A New Tool for Metabolomics Research. J. Neurochem. 2009, 109, 494–501. [Google Scholar] [CrossRef]
  45. Patel, A.B.; Rothman, D.L.; Cline, G.W.; Behar, K.L. Glutamine Is the Major Precursor for GABA Synthesis in Rat Neocortex in Vivo Following Acute GABA-Transaminase Inhibition. Brain Res. 2001, 919, 207–220. [Google Scholar] [CrossRef] [PubMed]
  46. Bagga, P.; Behar, K.L.; Mason, G.F.; De Feyter, H.M.; Rothman, D.L.; Patel, A.B. Characterization of Cerebral Glutamine Uptake from Blood in the Mouse Brain: Implications for Metabolic Modeling of 13 C NMR Data. J. Cereb. Blood Flow Metab. 2014, 34, 1666–1672. [Google Scholar] [CrossRef] [PubMed]
  47. Patel, A.B.; De Graaf, R.A.; Mason, G.F.; Rothman, D.L.; Shulman, R.G.; Behar, K.L. The Contribution of GABA to Glutamate/Glutamine Cycling and Energy Metabolism in the Rat Cortex in Vivo. Proc. Natl. Acad. Sci. USA 2005, 102, 5588–5593. [Google Scholar] [CrossRef] [PubMed]
  48. Unal, G.; Canbeyli, R. Psychomotor Retardation in Depression: A Critical Measure of the Forced Swim Test. Behav. Brain Res. 2019, 372, 112047. [Google Scholar] [CrossRef]
  49. Draganov, M.; Vives-Gilabert, Y.; De Diego-Adeliño, J.; Vicent-Gil, M.; Puigdemont, D.; Portella, M.J. Glutamatergic and GABA-Ergic Abnormalities in First-Episode Depression. A 1-Year Follow-up 1H-MR Spectroscopic Study. J. Affect. Disord. 2020, 266, 572–577. [Google Scholar] [CrossRef]
  50. Portella, M.J.; de Diego-Adelino, J.; Gomez-Anson, B.; Morgan-Ferrando, R.; Vives, Y.; Puigdemont, D.; Perez-Egea, R.; Ruscalleda, J.; Enric, A.; Perez, V. Ventromedial Prefrontal Spectroscopic Abnormalities over the Course of Depression: A Comparison among First Episode, Remitted Recurrent and Chronic Patients. J. Psychiatr. Res. 2011, 45, 427–434. [Google Scholar] [CrossRef]
  51. Hasler, G.; Meyers, N.; Shen, J.; Drevets, W.C. Reduced Prefrontal Glutamate/Glutamine and γ-Aminobutyric Acid Levels in Major Depression Determined Using Proton Magnetic Resonance Spectroscopy. Arch. Gen. Psychiatry 2007, 64, 193–200. [Google Scholar] [CrossRef]
  52. Jollant, F.; Richard-Devantoy, S.; Ding, Y.; Turecki, G.; Bechara, A.; Near, J. Prefrontal Inositol Levels and Implicit Decision-Making in Healthy Individuals and Depressed Patients. Eur. Neuropsychopharmacol. 2016, 26, 1255–1263. [Google Scholar] [CrossRef] [PubMed]
  53. Knudsen, M.K.; Near, J.; Blicher, A.B.; Videbech, P.; Blicher, J.U. Magnetic Resonance (MR) Spectroscopic Measurement of γ-Aminobutyric Acid (GABA) in Major Depression before and after Electroconvulsive Therapy. Acta Neuropsychiatr. 2019, 31, 17–26. [Google Scholar] [CrossRef] [PubMed]
  54. Moussawi, K.; Riegel, A.; Nair, S.; Kalivas, P.W. Extracellular Glutamate: Functional Compartments Operate in Different Concentration Ranges. Front. Syst. Neurosci. 2011, 5, 94. [Google Scholar] [CrossRef] [PubMed]
  55. Chiappelli, J.; Adhikari, B.M.; Kvarta, M.D.; Bruce, H.A.; Goldwaser, E.L.; Ma, Y.; Chen, S.; Ament, S.; Shuldiner, A.R.; Mitchell, B.D.; et al. Depression, Stress and Regional Cerebral Blood Flow. J. Cereb. Blood Flow Metab. 2023, 43, 791–800. [Google Scholar] [CrossRef]
  56. Monkul, E.S.; Silva, L.A.P.; Narayana, S.; Peluso, M.A.M.; Zamarripa, F.; Nery, F.G.; Najt, P.; Li, J.; Lancaster, J.L.; Fox, P.T.; et al. Abnormal Resting State Corticolimbic Blood Flow in Depressed Unmedicated Patients with Major Depression: A 15O-H2O PET Study. Hum. Brain Mapp. 2012, 33, 272–279. [Google Scholar] [CrossRef]
  57. Hyder, F.; Patel, A.B.; Gjedde, A.; Rothman, D.L.; Behar, K.L.; Shulman, R.G. Neuronal–Glial Glucose Oxidation and Glutamatergic–GABAergic Function. J. Cereb. Blood Flow Metab. 2006, 26, 865–877. [Google Scholar] [CrossRef]
  58. Rothman, D.L.; Behar, K.L.; Dienel, G.A. Mechanistic Stoichiometric Relationship between the Rates of Neurotransmission and Neuronal Glucose Oxidation: Reevaluation of and Alternatives to the Pseudo-malate-aspartate Shuttle Model. J. Neurochem. 2024, 168, 555–591. [Google Scholar] [CrossRef]
  59. Zhu, X.; Ye, G.; Wang, Z.; Luo, J.; Hao, X. Sub-Anesthetic Doses of Ketamine Exert Antidepressant-like Effects and Upregulate the Expression of Glutamate Transporters in the Hippocampus of Rats. Neurosci. Lett. 2017, 639, 132–137. [Google Scholar] [CrossRef]
  60. Antila, H.; Ryazantseva, M.; Popova, D.; Sipilä, P.; Guirado, R.; Kohtala, S.; Yalcin, I.; Lindholm, J.; Vesa, L.; Sato, V.; et al. Isoflurane Produces Antidepressant Effects and Induces TrkB Signaling in Rodents. Sci. Rep. 2017, 7, 7811. [Google Scholar] [CrossRef]
  61. Zhang, S.-S.; Tian, Y.-H.; Jin, S.-J.; Wang, W.-C.; Zhao, J.-X.; Si, X.-M.; Zhang, L.; Xu, H.; Jin, J.-Y. Isoflurane Produces Antidepressant Effects Inducing BDNF-TrkB Signaling in CUMS Mice. Psychopharmacology 2019, 236, 3301–3315. [Google Scholar] [CrossRef]
  62. Weeks, H.R.; Tadler, S.C.; Smith, K.W.; Iacob, E.; Saccoman, M.; White, A.T.; Landvatter, J.D.; Chelune, G.J.; Suchy, Y.; Clark, E.; et al. Antidepressant and Neurocognitive Effects of Isoflurane Anesthesia versus Electroconvulsive Therapy in Refractory Depression. PLoS ONE 2013, 8, e69809. [Google Scholar] [CrossRef] [PubMed]
  63. Brown, P.L.; Zanos, P.; Wang, L.; Elmer, G.I.; Gould, T.D.; Shepard, P.D. Isoflurane but Not Halothane Prevents and Reverses Helpless Behavior: A Role for EEG Burst Suppression? Int. J. Neuropsychopharmacol. 2018, 21, 777–785. [Google Scholar] [CrossRef] [PubMed]
  64. Michael, N.; Erfurth, A.; Ohrmann, P.; Arolt, V.; Heindel, W.; Pfleiderer, B. Neurotrophic Effects of Electroconvulsive Therapy: A Proton Magnetic Resonance Study of the Left Amygdalar Region in Patients with Treatment-Resistant Depression. Neuropsychopharmacology 2003, 28, 720–725. [Google Scholar] [CrossRef] [PubMed]
  65. Michael, N.; Erfurth, A.; Ohrmann, P.; Arolt, V.; Heindel, W.; Pfleiderer, B. Metabolic Changes within the Left Dorsolateral Prefrontal Cortex Occurring with Electroconvulsive Therapy in Patients with Treatment Resistant Unipolar Depression. Psychol. Med. 2003, 33, 1277–1284. [Google Scholar] [CrossRef]
  66. Pfleiderer, B.; Michael, N.; Erfurth, A.; Ohrmann, P.; Hohmann, U.; Wolgast, M.; Fiebich, M.; Arolt, V.; Heindel, W. Effective Electroconvulsive Therapy Reverses Glutamate/Glutamine Deficit in the Left Anterior Cingulum of Unipolar Depressed Patients. Psychiatry Res. Neuroimaging 2003, 122, 185–192. [Google Scholar] [CrossRef]
  67. Sanacora, G.; Mason, G.F.; Rothman, D.L.; Hyder, F.; Ciarcia, J.J.; Ostroff, R.B.; Berman, R.M.; Krystal, J.H. Increased Cortical GABA Concentrations in Depressed Patients Receiving ECT. AJP 2003, 160, 577–579. [Google Scholar] [CrossRef] [PubMed]
  68. Njau, S.; Joshi, S.H.; Leaver, A.M.; Vasavada, M.; Van Fleet, J.; Espinoza, R.; Narr, K.L. Variations in Myo-Inositol in Fronto-Limbic Regions and Clinical Response to Electroconvulsive Therapy in Major Depression. J. Psychiatr. Res. 2016, 80, 45–51. [Google Scholar] [CrossRef]
  69. Rimmerman, N.; Verdiger, H.; Goldenberg, H.; Naggan, L.; Robinson, E.; Kozela, E.; Gelb, S.; Reshef, R.; Ryan, K.M.; Ayoun, L.; et al. Microglia and Their LAG3 Checkpoint Underlie the Antidepressant and Neurogenesis-Enhancing Effects of Electroconvulsive Stimulation. Mol. Psychiatry 2022, 27, 1120–1135. [Google Scholar] [CrossRef]
  70. Zhang, J.; Narr, K.L.; Woods, R.P.; Phillips, O.R.; Alger, J.R.; Espinoza, R.T. Glutamate Normalization with ECT Treatment Response in Major Depression. Mol. Psychiatry 2013, 18, 268–270. [Google Scholar] [CrossRef] [PubMed]
  71. Ende, G.; Braus, D.F.; Walter, S.; Weber-Fahr, W.; Henn, F.A. The Hippocampus in Patients Treated With Electroconvulsive Therapy: A Proton Magnetic Resonance Spectroscopic Imaging Study. Arch. Gen. Psychiatry 2000, 57, 937. [Google Scholar] [CrossRef]
  72. Leaver, A.M.; Vasavada, M.; Joshi, S.H.; Wade, B.; Woods, R.P.; Espinoza, R.; Narr, K.L. Mechanisms of Antidepressant Response to Electroconvulsive Therapy Studied with Perfusion Magnetic Resonance Imaging. Biol. Psychiatry 2019, 85, 466–476. [Google Scholar] [CrossRef] [PubMed]
  73. Gálvez, V.; Hadzi-Pavlovic, D.; Waite, S.; Loo, C.K. Seizure Threshold Increases Can Be Predicted by EEG Quality in Right Unilateral Ultrabrief ECT. Eur. Arch. Psychiatry Clin. Neurosci. 2017, 267, 795–801. [Google Scholar] [CrossRef] [PubMed]
  74. Smith, S.E.; Ma, V.; Gonzalez, C.; Chapman, A.; Printz, D.; Voytek, B.; Soltani, M. Clinical EEG Slowing Induced by Electroconvulsive Therapy Is Better Described by Increased Frontal Aperiodic Activity. Transl. Psychiatry 2023, 13, 348. [Google Scholar] [CrossRef] [PubMed]
  75. Schmidt, E.Z.; Reininghaus, B.; Enzinger, C.; Ebner, C.; Hofmann, P.; Kapfhammer, H.P. Changes in Brain Metabolism after ECT–Positron Emission Tomography in the Assessment of Changes in Glucose Metabolism Subsequent to Electroconvulsive Therapy—Lessons, Limitations and Future Applications. J. Affect. Disord. 2008, 106, 203–208. [Google Scholar] [CrossRef]
Figure 1. Experimental paradigm and behavioral measures in CVMS mice. (a) Timeline depicting different interventions and assessment of depression phenotype. (b) Sucrose preference, (c) Immobility duration in the forced-swim test (FST), and (d) Time spent in the open arms of the elevated-plus maze (EPM) test. The vertical bar represents the mean ± SD of the group, while the symbols depict individual values.
Neuroglia 05 00021 g001
Figure 2. Measurement of 13C labeling of brain metabolites. Representative 1H-[13C]-NMR spectra from prefrontal cortex (PFC) extracts of (a) Control, and (b) CVMS mice. Concentrations of 13C-labeled metabolites in (c) PFC, and (d) Hippocampus of CVMS and control mice. The [1,6-13C2]glucose was administered in mice for 10 min, and 1H-[13C]-NMR spectra were recorded in the brain tissue extracts. The spectra in the topmost panel 1H-[12C+13C] represent the total concentration of neurometabolites, whereas the lower panel depicts 13C-labeled neurometabolites. The concentrations of 13C-labeled neurometabolites were measured in 1H-[13C]-NMR spectra using [2-13C]glycine. Abbreviations: AlaC3, alanine-C3; AspC3, aspartate-C3; Cre, creatine; GABAC2, γ-aminobutyric acid-C2; GABAC4, γ-aminobutyric acid-C4; GluC4, glutamate-C4; GluC3, glutamate-C3; GlnC4, glutamine-C4; LacC3, lactate-C3; NAA, N-acetyl aspartate.
Neuroglia 05 00021 g002
Figure 3. Cerebral metabolic rates of glucose oxidation in the (a) Prefrontal cortex, and (b) Hippocampus of CVMS and control mice. The rates of glucose oxidation (CMRGlc(Ox)) were calculated using Equations (1)–(3). The vertical bar represents the mean ± SD of the group, while the symbols depict individual values.
Neuroglia 05 00021 g003
Figure 4. Assessment of ECT’s impact on depression-like phenotypes. (a) Experimental timeline, (b) Sucrose preference during CVMS paradigm, (c) Time spent in the immobile state in forced-swim test (FST), (d) Duration in the center plus open arms of the elevated plus maze (EPM) after CVMS. CVMS mice were subjected to a combination of variable stressors for 28 days and were given the choice of 2% sucrose solution and water throughout the experiment to measure the sucrose preference. EPM and FST were conducted after the completion of the CVMS paradigm. The impact of ECT on (e) Sucrose preference, (f) Immobility duration, and (g) Time spent in the center zone of OFT in CVMS and control mice. The ECT group of mice was given one electroconvulsive shock daily for seven consecutive days under mild isoflurane anesthesia, while the sham mice were subjected to isoflurane anesthesia but no electric shock. The unpaired two-tailed T-test was performed to assess the statistical significance of the difference for FST and EPM tests following CVMS. The statistical analysis for other measures was carried out using a Two-Way ANOVA along with Tukey’s method for multiple comparisons.
Neuroglia 05 00021 g004
Figure 5. Representative 1H-[13C]-NMR spectra from PFC extract of (a) Control, and (b) CVMS mice. Mice were anesthetized using urethane and infused with [1,6-13C2]glucose using tail-vein for 10 min, and 1H-[13C]-NMR spectra were recorded in brain tissue extracts at 600 MHz NMR spectrometer. The spectra in the uppermost panel (1H-[12C+13C]) represent the total concentration of neurometabolites, while those in the lower panel depict the level of 13C-labeled neurometabolites. Abbreviations: AlaC3, alanine-C3; AspC3, aspartate-C3; Cre, creatine; GABAC2, γ-aminobutyric acid-C2; GABAC4, γ-aminobutyric acid-C4; GluC4, glutamate-C4; GluC3, glutamate-C3; GlnC4, glutamine-C4; LacC3, lactate-C3; NAA, N-acetyl aspartate.
Neuroglia 05 00021 g005
Figure 6. The impact of ECT on the rates of glucose oxidation (CMRGlc(Ox)) in (a) Prefrontal cortex and (b) Hippocampus. The CMRGlc(Ox) was calculated using Equations (1)–(3), based on the 13C-label trapped into different neurometabolites. The vertical bar represents the mean ± SD of the group, while the symbols depict individual values.
Neuroglia 05 00021 g006
Table 1. Concentration (µmol/g) of neurometabolites in the prefrontal cortex and hippocampus of control and CVMS mice.
GluGABAGlnAspNAALacm-InoTauGPCCre
PFCCONSham (n = 7)13.2 ± 0.83.6 ± 0.36.3 ± 0.33.0 ± 0.27.4 ± 0.41.8 ± 0.58.4 ± 0.412.9 ± 0.71.4 ± 0.114.0 ± 0.7
ECT (n = 8)13.5 ± 1.23.6 ± 0.26.2 ± 0.62.9 ± 0.37.4 ± 0.61.9 ± 0.48.7 ± 0.512.9 ± 0.91.4 ± 0.014.2 ± 1.0
CVMSSham (n = 8)12.5 ± 1.13.5 ± 0.15.8 ± 0.42.9 ± 0.27.1 ± 0.51.8 ± 0.68.2 ± 0.312.9 ± 0.41.4 ± 0.113.5 ± 0.6
ECT (n = 8)11.7 ± 0.9 ##3.6 ± 0.25.8 ± 0.32.7 ± 0.26.8 ± 0.41.3 ± 0.18.4 ± 0.612.9 ± 0.61.4 ± 0.113.3 ± 0.6
HIPCONSham (n = 7)12.2 ± 0.73.6 ± 0.25.7 ± 0.52.8 ± 0.26.7 ± 0.51.6 ± 0.29.8 ± 0.710.0 ± 0.61.4 ± 0.115.3 ± 0.6
ECT (n = 8)12.5 ± 0.53.4 ± 0.15.7 ± 0.42.6 ± 0.16.6 ± 0.21.6 ± 0.210.0 ± 0.49.9 ± 0.41.4 ± 0.115.2 ± 0.6
CVMSSham (n = 8)12.1 ± 0.53.2 ± 0.1 *5.5 ± 0.42.8 ± 0.26.5 ± 0.31.5 ± 0.19.1 ± 0.4 *10.1 ± 0.21.4 ± 0.114.9 ± 0.4
ECT (n = 8)11.8 ± 0.63.4 ± 0.35.6 ± 0.22.7 ± 0.26.8 ± 0.31.3 ± 0.2 #9.6 ± 0.510.0 ± 0.41.4 ± 0.115.2 ± 0.8
The concentration of metabolites was calculated from non-edited 1H-[13C]-NMR spectra using [2-13C]glycine added during extraction as an internal concentration reference. Values are presented as mean ± SD. * padj < 0.05 when CVMS + sham mice were compared with CON + sham mice, # padj < 0.05, ## padj < 0.01 when CVMS + ECT mice were compared with CON + ECT. Abbreviations: Asp, aspartate; Cre, creatine, GABA, γ-aminobutyric acid; Gln, glutamine; Glu, glutamate; GPC, glycerophosphocholine; HIP, hippocampus; Lac, lactate; m-Ino, myo-inositol; NAA, N-acetyl aspartate; PFC, prefrontal cortex; Tau, taurine.
Table 2. Concentration (µmol/g) of 13C-labeled neurometabolites in the prefrontal cortex and hippocampus of control and CVMS mice.
GluC4GABAC2GlnC4AspC3GluC3GABAC4AlaC3LacC3
PFCCONSham (n = 7)1.88 ± 0.380.17 ± 0.060.27 ± 0.110.16 ± 0.060.25 ± 0.120.04 ± 0.020.16 ± 0.050.38 ± 0.20
ECT (n = 8)2.08 ± 0.400.20 ± 0.040.29 ± 0.040.18 ± 0.050.28 ± 0.060.03 ± 0.010.16 ± 0.020.44 ± 0.14
CVMSSham (n = 8)2.06 ± 0.270.18 ± 0.030.30 ± 0.050.17 ± 0.030.28 ± 0.060.05 ± 0.010.13 ± 0.020.40 ± 0.12
ECT (n = 8)1.59 ± 0.20 #$0.15 ± 0.010.24 ± 0.040.13 ± 0.030.20 ± 0.050.04 ± 0.010.11 ± 0.050.23 ± 0.11 #
HIPCONSham (n = 7)1.58 ± 0.300.21 ± 0.060.27 ± 0.080.16 ± 0.050.23 ± 0.080.05 ± 0.010.13 ± 0.010.30 ± 0.08
ECT (n = 8)1.72 ± 0.200.23 ± 0.030.31 ± 0.050.18 ± 0.030.25 ± 0.030.05 ± 0.010.15 ± 0.010.39 ± 0.09
CVMSSham (n = 8)1.77 ± 0.160.24 ± 0.030.31 ± 0.050.18 ± 0.020.28 ± 0.050.05 ± 0.010.13 ± 0.010.34 ± 0.05
ECT (n = 8)1.53 ± 0.200.20 ± 0.010.28 ± 0.040.16 ± 0.040.23 ± 0.020.06 ± 0.040.13 ± 0.020.26 ± 0.05 ##
Mice were infused with [1,6-13C2]glucose, and the 13C concentrations of neurometabolites were measured in the brain tissue extracts from edited 1H-[13C]-NMR spectrum using [2-13C]glycine as a reference. Values are presented as mean ± SD. # padj < 0.05 and ## padj < 0.005 when CVMS + ECT mice were compared with CON + ECT mice, $ padj < 0.05 when CVMS + ECT mice were compared with CVMS + sham. Abbreviations: AspC3, aspartate-C3; GABAC2, γ-aminobutyric acid-C2; GABAC4, γ-aminobutyric acid-C4; GluC4, glutamate-C4; GluC3, glutamate-C3; GlnC4, glutamine-C4; HIP, hippocampus; LacC3, lactate-C3; PFC, prefrontal cortex.
Disclaimer/Publisher’s Note: The statements, opinions and data contained in all publications are solely those of the individual author(s) and contributor(s) and not of MDPI and/or the editor(s). MDPI and/or the editor(s) disclaim responsibility for any injury to people or property resulting from any ideas, methods, instructions or products referred to in the content.

