Article

Nitrogen Dynamics in an Established Alfalfa Field under Low Biochar Application Rates

by
Katherine S. Rocci
1,2,3,*,
Steven J. Fonte
1,3,
Joseph C. von Fischer
3,4 and
M. Francesca Cotrufo
1,2,3
1
Department of Soil and Crop Sciences, Colorado State University, 307 University Avenue, Fort Collins, CO 80523, USA
2
Natural Resource Ecology Laboratory, Colorado State University, 1231 Libbie Coy Way, Fort Collins, CO 80523, USA
3
Graduate Degree Program in Ecology, Colorado State University, 950 East Avenue, Fort Collins, CO 80523, USA
4
Department of Biology, Colorado State University, 251 West Pitkin Street, Fort Collins, CO 80523, USA
*
Author to whom correspondence should be addressed.
Soil Syst. 2019, 3(4), 77; https://doi.org/10.3390/soilsystems3040077
Submission received: 28 September 2019 / Revised: 22 November 2019 / Accepted: 23 November 2019 / Published: 26 November 2019

Abstract

:
Sustainable nitrogen (N) management in agroecosystems is crucial for supporting crop production and reducing deleterious N losses. Biochar application with N-fixing legumes offers promise for increasing soil N retention and input. Strategic, low application rates (112 kg ha−1) of pine and coconut feedstock biochars were tested in an established alfalfa (Medicago sativa) field. Soil inorganic N and plant growth, N concentrations, and δ15N were monitored over a growing season to follow mineral N availability, and plant N uptake and sourcing. Microbial and gene abundance and enzyme activity were measured to assess the potential for N cycling processes to occur. Biochar application had minimal effects on measured parameters. However, significant temporal dynamics in N cycling and correlations between alfalfa δ15N and soil N availability indicate differing plant N sourcing over time. Our findings indicate that low application rates of biochar in established alfalfa fields do not significantly affect N cycling, and that managing alfalfa to maximize N fixation, for example by intercropping, may be a better solution to increase N stocks and retention in this system. To determine when biochar can be beneficial for alfalfa N cycling, we need additional research to assess various economically-feasible biochar application rates at different alfalfa growth stages.

1. Introduction

A key facet of soil health and sustainable agriculture is supporting the ability of soils to retain and cycle nutrients, especially nitrogen (N) [1]. Nitrogen is crucial for crop growth, but over-application of fertilizers and adverse environmental conditions can lead to large losses of N from agroecosystems with important implications for greenhouse gas (GHG) emissions, water quality, and overall resource use efficiency [2]. While there are many proposed solutions for enhancing N retention and cycling in agricultural systems, the use of N-fixing legumes and the application of biochar have both shown promising results [3,4].
Diversifying cropping systems by adding a legume in rotation has been shown to enhance microbial biomass and bioavailable N, while reducing GHG emissions and external inputs [5,6], making legume addition a widely accepted practice for sustainable agriculture [7]. Alfalfa, the most prominent forage legume in the US [8], is typically grown for multiple years as an alternative N source in extended rotations with non-leguminous crops (e.g., [9,10]). High rates of biological N fixation (BNF) by alfalfa and other legumes are generally associated with low soil inorganic N (SIN), high phosphorus availability, and adequate availability of micronutrients needed as co-factors of the nitrogenase enzyme that is responsible for catalyzing BNF [11]. Application of biochar, a soil amendment created by pyrolyzing biomass at a range of temperatures (350–1000 °C), resulting in a carbon-rich, recalcitrant material that can persist in the soil for centuries [12,13], has been shown to reduce SIN [3], potentially forcing alfalfa to rely more on BNF for N requirements and thus leading to increased input of biologically-fixed N. The pathways for lower SIN with biochar addition include both biotic and abiotic mechanisms. Biochar-induced increases in microbial activity [3] and in the bacterial to fungal ratio, which is more often found in high pH soils and with low biochar application rates [14], may lead to higher immobilization of inorganic N, due to greater N requirements by larger microbial communities, and by bacteria relative to fungi due to bacteria’s lower biomass C:N ratio. Additionally, the high surface area and porous nature of biochar allows for chemi- and physi-sorption of N compounds, respectively [3,12]. Further, biochar may also limit mineralization of organic matter through suppression of enzymatic activity via direct sorption of enzymes to the biochar surface [15], which could also contribute to lower mineral N availability through reduced breakdown of nitrogenous compounds. Notably, biochar-induced SIN reductions have been shown to be associated with reduced crop yield [16], and thus biochar-induced increases in N fixation during the alfalfa phase of a crop rotation may provide an alternative N source to support overall productivity. This may be especially important early in the growing season as biochar-induced reductions in nitrate (NO3) were found for the short term (<5 weeks [16,17]). Since alfalfa undergoes multiple harvests each year, it is important to ensure adequate N availability, via soil available N or N fixation, throughout the growing season.
Previous studies assessing the effect of biochar application on N fixation have shown promising results [18,19,20,21,22,23,24], although the number of field studies is limited [24,25] and the majority of studies have evaluated relatively high application rates (≥10 Mg ha−1). Importantly, these high application rates are not economically feasible for farmers in many regions [26], suggesting the need to test the effectiveness of lower biochar application rates. For example, relatively low rates of biochar applications (0.8 Mg ha−1), added in-row, in close proximity to the seed, have shown increased yields in an irrigated maize system [27]. Further, Rajkovich et al. [28] found significantly increased tissue N and N uptake on average with decreasing biochar application rates (from 91 to 2.6 Mg ha−1), such that there may be multiple agronomic benefits of lower biochar application rates. Additionally, the effects of biochar application in reducing SIN and enhancing N fixation are often more pronounced in coarse texture soils relative to other soil types [3,29], suggesting that low rates of biochar application in sandy soils is a promising agricultural option for increased N fixation.
While biochar shows clear potential, its effects are highly dependent on biochar feedstock and production conditions (i.e., [3,30,31]). Thus, an interest has emerged in post-pyrolysis treatments to provide more consistent “engineered” or “designer” biochar products [32], although this work has mostly focused on pollution removal in wastewater [33,34]. These biochar products may lead to differential effects on soil N cycling as compared to traditional biochar and thus warrant greater study in soil systems. Variation in the physio-chemical properties in these products due to feedstock may allow for finer parsing of the mechanisms for potential SIN reduction, suggesting the need to evaluate a variety of biochar products.
Biochar effects on N fixation do not occur in isolation, making it relevant to understand effects of biochar amendment on broader N cycling processes, in addition to N fixation. Ecological tools can be used to directly quantify nutrient fluxes or to gain broader characterizations of the biological system. The difference in 15N natural abundance between a non-fixing reference plant and an N-fixing legume can indicate relative differences in N fixation between treatments and over time, as well as transfer of fixed N from the N-fixing plant to the reference plant [35,36]. Since it is challenging to measure N fixation directly, it is important to employ multiple lines of evidence to measure changes in N fixation [37]. In addition to isotopic measurements, soil microbial functional genes can give ecosystem-level insights into key N transformations within the soil–plant–atmosphere system [38]. Quantifying the abundance of genes associated with N fixation, as well as N loss, can indicate potential for these processes to occur. The potential for N loss is particularly important for our system because, while addition of biochar generally reduces N loss as N2O [39], this effect may be reduced in field studies [40], and legumes have been shown to increase N2O emissions relative to non-N-fixing cover crops [41]. Thus, understanding the effects of low rates of biochar application on both N fixation and potential N loss in alfalfa is important for a holistic view of N cycling over the growing season that attempts to balance agronomic, environmental, and economic benefits of biochar application.
To better understand how low application rates of engineered biochar products can affect N cycling in alfalfa, we examined the effect of two different biochars on N cycling over the growing season in an established alfalfa field on a sandy soil. We used natural abundance 15N of alfalfa and dandelions, our reference plant, in combination with N gene abundance, enzymatic activity, and SIN availability, to assess N fixation, soil–plant N dynamics, and potential N loss. We hypothesized that biochar would increase N fixation and soil nifH abundance and reduce soil microbial gene abundance associated with N loss through decreased SIN availability. We expected this effect to be stronger for biochar with higher surface area and C:N due to increased sorption of SIN and enzymes and immobilization of SIN as evidenced by increased microbial abundance and B:F ratios, respectively. We also hypothesized that biochar amendment would reduce SIN, especially NO3 concentrations, within the first month of the growing season, leading to increased BNF in biochar treatments during the early growing season, and similar biomass production regardless of biochar addition over the entire growing season. Based on the above expectations, we would also anticipate a negative relationship between SIN availability and BNF or potential N loss that would be more prominent in our biochar treatments, which we expect to reduce SIN availability.

2. Materials and Methods

2.1. Study Site

The experiment was conducted in a commercial alfalfa (Medicago sativa cv. Pioneer 5010) field near Roggen, Colorado (40°13′17.75″ N, 104°19′28.35″ W), between May and September, 2018. This area experiences semi-arid climate with an average annual precipitation of 353 mm, with the majority occurring as rain between May and July (climate-data.org, accessed August 2019). Minimum and maximum monthly temperatures for May through September on average (based on a 30-year average) vary between 5.9–14.4 °C and 22.6–32.3 °C, respectively. At the time of sampling, the field had been in alfalfa for five years and was maintained with organic amendments of compost or chicken litter applied each year before the growing season in winter or early spring. Since 1990, the field has been in a rotation with corn, sugar beets, and beans. Soils are mixed, mesic Ustic Torripsamments, part of the Valent sand series, and are classified as sandy (89% sand, 3% silt, 8% clay) using particle size distribution determined by the hydrometer method [42]. Before the start of the experiment, soils (0–20 cm) contained 5.8 g kg−1 C, 0.66 g kg−1 N, and had an average pH of 7.9 (see below for baseline sampling analyses). In early March 2018, before alfalfa began to reinitiate growth, compost sourced from feed lot manure (C:N ≈ 5; δ15N = 14.8‰ ± 0.05‰) was surface applied at a rate of 7.5 Mg ha−1. Harrowing was done in the last week of March to gently incorporate this material with minimal disturbance to the dormant alfalfa. The field was irrigated by sprinkler (center-pivot system) continuously over the growing season for a total application of 715.5 mm of water between April and September 2018.

2.2. Biochars

Two biochars were assessed in this study: An engineered pelletized pine biochar product (PBC) and an engineered coconut biochar (CBC). Biochars were created through continuous pyrolysis at maximum temperatures below 650 °C and produced from pine and coconut husk feedstocks, respectively. Engineering of biochars was accomplished through post-processing (proprietary information; Cool Planet, Inc., Camarillo, CA, USA) to provide more uniform physio-chemical properties. PBC is an agglomerate product that is 38–40% biochar (proprietary information; Cool Planet, Inc., Camarillo, CA, USA). PBC is a pelletized product that can be applied using common farm machinery, potentially overcoming lack of on-farm biochar application due to application methodology. PBC was compared to CBC to evaluate whether it would perform equally as well as a more traditional biochar product, and to evaluate effects of physio-chemical differences in the biochars on N cycling in our system. Biochar products were characterized by ultimate analyses (C, H, N, ash; ASTM D3176–15, 2015) performed by Wyoming Analytical Labs, Inc. (Laramie, WY, USA) and all other properties were determined by Cool Planet, Inc. (pH, surface area, Ece; Camarillo, CA, USA; Table 1), with the exception of moisture, which was determined by mass difference of biochar as applied and biochar oven-dried for 48 h at 105.

2.3. Experimental Design

The experiment consisted of three biochar treatments: (1) Application of the PBC, (2) application of the CBC, and (3) no biochar application, as a control (C), each randomly allocated to three plots (2 × 2 m each) within six replicate blocks. All blocks were located to ensure the presence of dandelions (our reference plant; Taraxacum officinale) within each of the block areas and were within a radius of 15 m. Treatments were established approximately two weeks after harrowing, on 18 April 2018. Biochar was incorporated by hand at plot establishment, at a rate of 112 kg ha−1 (45 g plot−1) by replicating a no-till drill with minimal soil disturbance to ensure proximity to alfalfa roots. Biochar was applied based on recommended broadcast rates for row crops and application methods for perennial crops provided by Cool Planet [43]. Biochar was applied to a depth of 3 cm in rows spaced approximately 22 cm apart to replicate no-till drill application. Soil was quickly covered to prevent biochar loss. While we acknowledge that this application rate is quite low compared to those used in most academic biochar field studies, these lower rates are required for commercial acceptance and have been successfully employed in other field studies [27]. Impact from these lower application rates is feasible due to the application of the biochar in close proximity to the roots, which creates a locally higher application rate. Thus, when considering the biochar concentration in the rhizosphere only, the application rate applied in this study is similar to 1.5 Mg ha−1 (9 g biochar applied over 200 × 3 cm row), which is comparable with other academic studies of biochar. Baseline soil samples were taken to a depth of 20 cm with a 1.9 cm diameter corer to assess any differences between blocks in soil pH, soil C and N content, and soil texture and no significant differences were found (data reported above in the site description).

2.4. Plant and Soil Samples Collection

Alfalfa was harvested four times during the growing season, on 30 May, 4 July, 6 August, and 21 September, which will be further referred to as H1 (Harvest 1), H2, H3, and H4, respectively. We note that the harvests were relatively regularly spaced and represent similar growth stages of alfalfa (i.e., flowering). Hand cutting of the alfalfa in each plot was conducted a few days before the harvest of the whole field for hay production. At each harvest, biomass was cut to a height of approximately 4 cm and was collected from only the inner 1 m2 of each plot to minimize potential edge effects. At each cutting, fresh alfalfa biomass was weighed in the field and a representative sub-sample was taken and stored in paper bags for determination of dry weight and further analyses in the lab. Additionally, for H2–H4, aboveground biomass of several dandelions located within 2 m of each block were collected and stored in paper bags separately from alfalfa. At each harvest, five soil cores were taken with a 1.9 cm diameter corer to 20 cm depth to assess soil processes in the topsoil. These were randomly located within each 1 m2 subplot and pooled to make one composite soil sample per plot for further analyses. Plant and soil samples were kept in a cooler until being returned to Colorado State University where soil samples were stored at 4 °C until analysis and plants were oven-dried at 60 °C. Sub-samples of soils collected at H4 were promptly sieved to 2 mm and stored at −80 °C for measurement of extracellular enzyme activity (5 g) and gene abundance (5 g).

2.5. Plant and Soil Analyses

Oven-dried aboveground biomass for alfalfa from each treatment plot and dandelions from each block at each harvest (only H2–H4 for dandelions) were ground to powder, and sub-samples were then measured for N concentration and δ15N isotopic composition on an elemental analyzer (Costech Analytical Technologies, Inc., Valencia, CA) coupled to an isotope ratio mass spectrometer (Delta V Advantage, Thermo Fisher Scientific Inc., Waltham, MA). Alfalfa aboveground N stocks at each harvest were estimated by multiplying N concentrations by aboveground dry biomass.
The differential isotopic values of an N-fixer (alfalfa) and a reference plant (dandelion) can indicate relative amounts of N fixation using the assumption that all dandelion N is derived from the soil which has a specific δ15N value, whereas alfalfa will obtain N from both soil pools and atmospheric N2 [36,44]. Generally, reference plants are assumed to have access to the same soil N pools as the N-fixing plant. Since dandelions are perennials and can have very deep tap roots (generally ~1 m but up to 4.6 m; [45,46]), comparable to root depths of > 3 m seen in mature alfalfa [47], they may be considered an appropriate reference plant for alfalfa and their N isotopic values can be used to represent plant-available soil N. Thus, greater difference between alfalfa and dandelion δ15N will indicate greater contribution of atmospheric N to alfalfa N stocks.
Within a week of sampling, soil ammonium (NH4+) and NO3 concentrations were determined by extracting a sub-sample of field-moist bulk soil using 2 M KCl (5:1 soil/KCl ratio by mass), shaking for 1 h, filtering, (Whatman #40 ashless filter paper), and analyzing the extraction colorimetrically (Alpkem Flow Solution IV Automated wet chemistry system; O.I. Analytical, College Station, TX) [48]. Data was corrected for soil moisture and is presented on a dry weight basis. Due to the sandy and homogenous nature of the soil, sieving was not necessary, but all roots were removed before performing these analyses. With these data we are able to characterize mineral N through analysis of soil NH4+ and NO3 concentrations and also total SIN and percent of SIN as NO3. This latter metric reveals the degree to which soil N transformations are partitioning inorganic N into more or less mobile forms in the soil.

2.6. Enzyme Analyses

We assessed activities of two common extracellular enzymes that are associated with the degradation of nitrogenous compounds (LAP and NAG), to assess biochar effects on N mineralization processes. Specifically, we assessed L-leucine aminopeptidase (LAP) and β-1,4-N-acetylglucosaminidase (NAG) activities, which catalyze protein and chitin degradation, respectively. These were analyzed using a high throughput fluorometric assay, described by Bell et al. [49]. Bailey et al. [50] found that fluorometric assays account for potential biochar sorption of enzymes better than colorimetric assays. Briefly, standard plates were prepared by creating a series of 16 dilutions (0.4–100 μM) of 4-methlumbelliferone and 7-amino-4-methylcoumarium stock solutions. To assess the quenching of fluorescence due to floating soil or organic particles, these stock solutions were combined with 800 μL of sample (H4 soil) and read as described for the substrate-sample mixtures, below. To assess enzyme activity, 1 g of soil was combined with 30 mL of Tris buffer and shaken for 20 min. A combination of 800 μL of the soil solution and 200 μL of the substrates was shaken for 3 h. Standard-sample and substrate-sample solutions were transferred to black plates and read at 365 nm excitation and 450 nm emission on an Infinite M200 Microplate Reader (Tecan Trading AG, Switzerland).

2.7. DNA Analyses

Abundances of microbial markers (bacteria and fungi) and N cycling genes (nifH, nirK, and nosZ) were determined using qPCR, to estimate microbial abundance and potential for N cycling, respectively. Microbial abundance and the bacterial to fungal ratio were used to infer the potential N immobilization and potential microbial N need, respectively. The genes encoding nitrite reductase (nirK) and nitrous-oxide reductase (nosZ) contribute to the process of denitrification. Since nirK catalyzes the reduction of nitrite to nitric oxide, it represents an environmentally harmful gaseous loss pathway of N, whereas nosZ, which catalyzes the transformation of N2O to N2, represents a loss pathway that does not have harmful climate effects. Thus, relative abundances of nirK and nosZ can be representative of potential for greater N loss as NO/N2O or N2, respectively. Additionally, because the abundance of the nitrogenase reductase gene (nifH), which catalyzes reduction of N2 to ammonia (NH3), is correlated with N fixation in soil [51], it represents a proxy for relative amount of N fixation.
Extraction and qPCR followed the methods of Hallin et al. [52]. Briefly, DNA was extracted from H4 soils using a Powersoil® DNA Isolation Kit (Mo Bio Laboratories, Carlsbad, CA, USA) following the manufacturer’s instructions. Standard curves with eight ten-fold dilutions were prepared using plasmids for each gene and extracted DNA was combined with respective primers for measurement of DNA copy numbers on a real-time PCR detection system (Bio-Rad Laboratories, Inc., Hercules, CA, USA). Melt curve analyses were conducted to verify the specificity of the amplification products, and the PCR efficiency ranged between 92–98%. Negative controls consisting of nuclease-free water were used to ensure no contamination occurred. Primers and conditions used for each measured gene are reported in Supplementary Materials (Table S1).

2.8. Data Analyses

Statistical analyses were carried out using the R statistical software (R Core Team, 2017). Repeated measures analysis was used to assess patterns of alfalfa aboveground biomass production, N uptake, alfalfa and dandelion δ15N, and SIN between harvests and in response to different biochar types, with block considered as a random effect (lme4; [53]). One-way ANOVA with block as a random effect was used to examine the influence of biochar on enzyme activity and gene and microbial abundance. Pairwise comparisons (emmeans; [54]) were used to determine differences between individual biochar types. When response variables did not fit the assumptions of the linear model, natural log and Box–Cox power transformations were assessed and applied for data analysis [55]. Correlations were used to examine relationships between alfalfa δ15N and SIN parameters across the entire growing season and all treatments, in order to identify overarching drivers for change. Correlations between gene abundance and SIN parameters used data only from H4 but for all treatments. For correlations between alfalfa δ15N and percent of SIN as NO3, the latter was log transformed to meet the assumptions of normality for the residuals. All other data fit the assumptions of the normal model. Significance for treatment differences and correlations were determined where p < 0.05.

3. Results

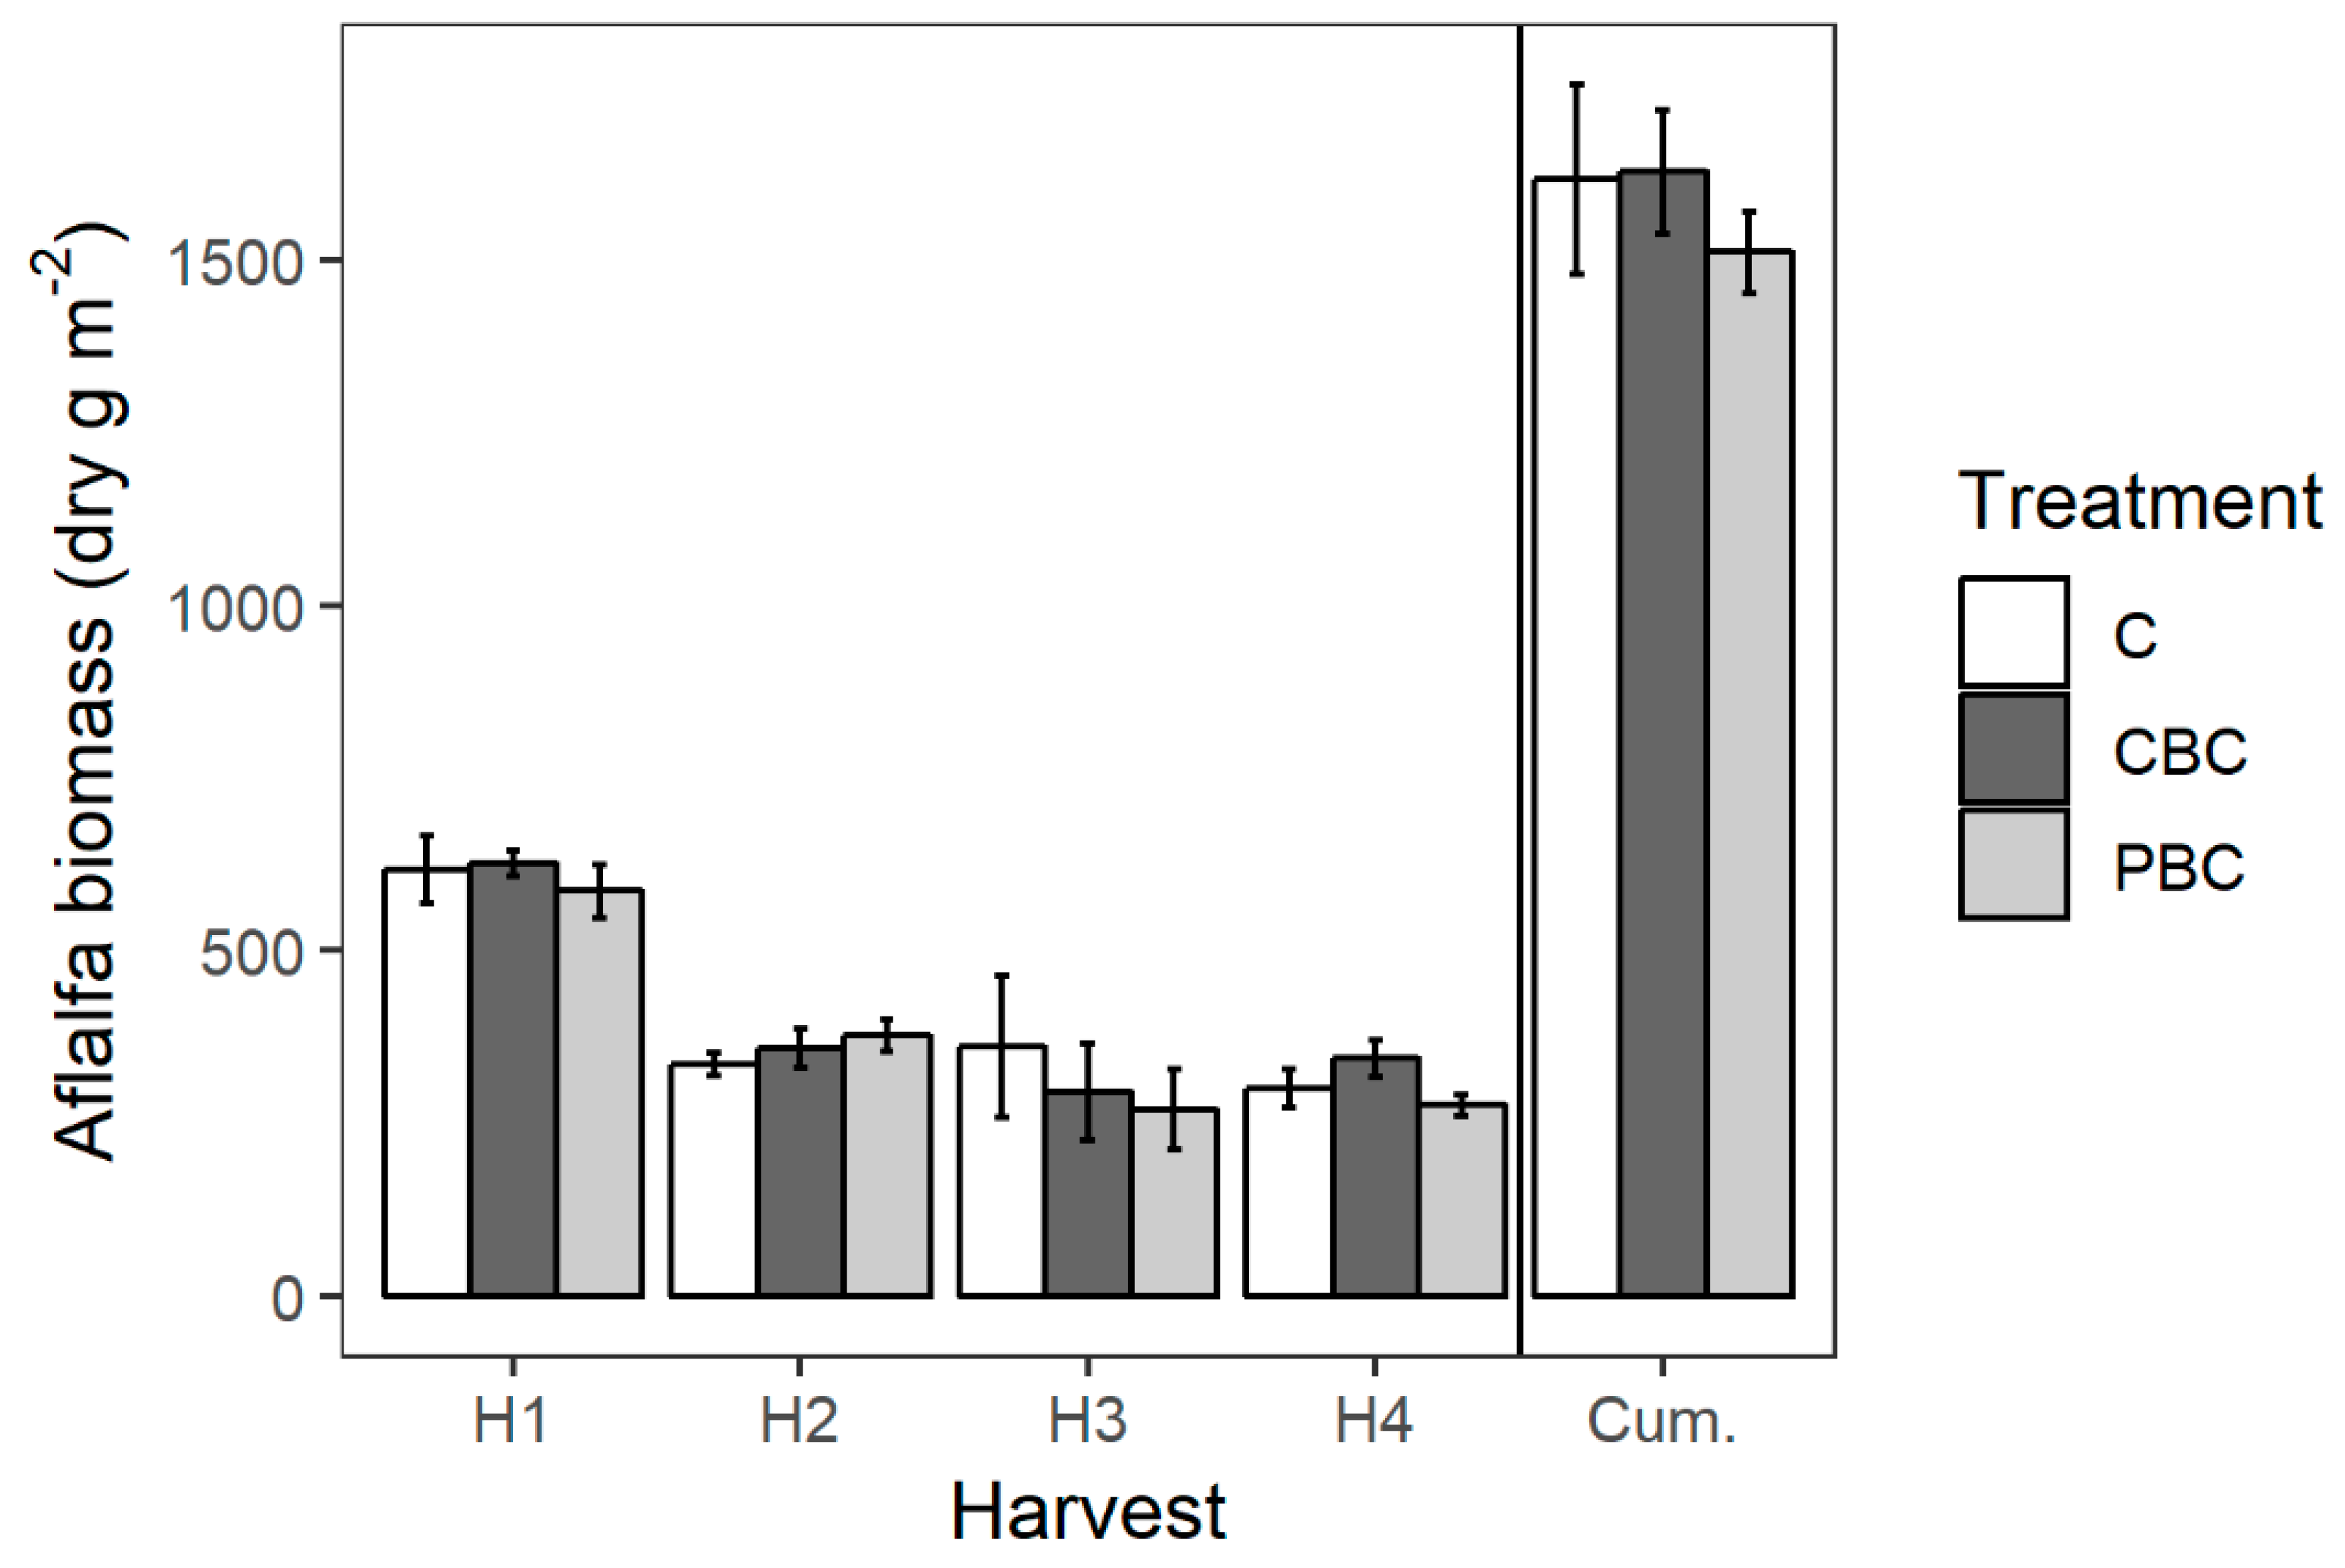
3.1. Plant and Soil N Dynamics

The low rate of biochar addition tested here had minimal effects on the measured plant and soil N parameters. Biochar type was not a significant predictor for alfalfa biomass, total N content, N concentration, alfalfa or dandelion δ15N, or SIN. However, we observed interesting temporal dynamics over the growing season, such that harvest date was significant for all of these variables with the exception of alfalfa N concentration. The largest alfalfa harvest was at the beginning of the season; alfalfa biomass for H1 was around 600 g m−2 for all treatments, 1.5–2 times higher than all other harvests (p < 0.001; Figure 1).
Alfalfa N concentrations were on average 3.2% and this was the only variable to not change significantly over time. In contrast, N content of the alfalfa followed the pattern of biomass over time with highest uptake at H1 (p < 0.001) and ranged from 2.82 to 3.68 mg N g−1 biomass across biochar treatments.
Similar to the aboveground biomass, soil NO3 was relatively high for H1 as compared to the other harvests (p < 0.001), as well as for H2 compared to H4 (p = 0.01; Figure 2). In contrast, NH4+ was relatively low at the beginning of the growing season and increased through H3, such that H1 was significantly lower than all other dates (p < 0.001) and H3 was significantly higher than H4 (p = 0.001 Figure 2). Patterns in NH4+ dominated the total SIN pattern at the end of the growing season such that, similar to NH4+, H2 and H3 had significantly higher SIN than H4 (p < 0.01; Figure 2). These temporal patterns in mineral N led to a significant decrease in the percent of SIN as NO3 from H1 to H3 (p < 0.04). Additionally, the interaction between harvest date and biochar type was significant for the percent of SIN as NO3—the control had significantly greater SIN as NO3 as compared to the treatments with biochar at H1 (p < 0.006; Figure 2).
Isotopic values of alfalfa and dandelions exhibited a relatively small range, and both increased over time. Alfalfa δ15N values ranged from −0.93‰ to 1.15‰ and followed a similar pattern as NH4+ values over time, such that at H1 alfalfa δ15N was significantly lower than at all other harvests (p < 0.001) and at H2 it was significantly lower than at H3 and H4 (p < 0.001; Figure 3). Dandelion δ15N values (range: −2.21‰ to 1.44‰) also increased over time (p < 0.04) and were significantly different from alfalfa δ15N values for H2 (p < 0.001) and H3 (p < 0.04), but not H4 (Figure 3).

3.2. Microbial Measurements

There were no significant differences between biochar treatments for any microbial measurements. There was a trend towards higher nirK and nosZ abundance in PBC treatments at H4, such that PBC had twice the average nirK DNA copy numbers as compared to CBC (p = 0.064; Figure 4). Similarly, PBC had approximately double the average nosZ DNA copy numbers than those of CBC and the control, but this was not significant due to high variability (p > 0.3; Figure 4). In contrast, mean nifH copy numbers were ~1.5 times higher in the control relative to the biochar treatments, although these data were also highly variable (p > 0.2; Figure 4). The biochar type was not a significant predictor for fungal and bacterial abundance, the bacterial to fungal ratio, nor enzyme activity, largely due to high variability (Table 2). Note that NAG activity in biochar treatments is, on average, about half that in the control, but is non-significant. We note one potential outlier in the control, but when this value is removed, the biochar type is still not a significant predictor for NAG activity.

3.3. Correlations between Measurements

Alfalfa δ15N and N gene abundance were differentially related to measures of SIN—alfalfa δ15N correlated more strongly with different types of SIN whereas abundance of N genes associated with denitrification correlated with total SIN (Figure 5). Soil NO3 and NH4+ both correlated with alfalfa δ15N (NO3: r = −0.533; p < 0.001, NH4+: r = 0.445; p < 0.001), but total SIN did not. The strongest correlation with alfalfa δ15N was for percent of SIN as NO3 (r = −0.606; p < 0.001), which, similar to NO3, was negatively related to alfalfa δ15N. In contrast, nirK correlated with total SIN (r = 0.546; p = 0.019) and NH4+ (r = 0.569; p = 0.014), but not NO3 nor percent of SIN as NO3. Similarly, nosZ gene abundance was somewhat related to total SIN (r = 0.451; p = 0.060), but not NO3, NH4+, nor percent of SIN as NO3. The abundance of nifH was not significantly correlated with any measure of SIN.

4. Discussion

We observed minimal effects of biochar on N cycling, microbial activity, and plant growth in our system and rather found that time over the growing season was a more important predictor of N dynamics in this established alfalfa field. Additionally, we found that proxies for N fixation and denitrification were differentially related to measures of SIN, which may have important implications for agricultural N management.

4.1. Lack of Biochar Addition Effects

Beyond minimal effects of our low biochar application rates on measured parameters, we also found no differences between the two types of biochar applied. The only biochar effect we observed was significantly higher SIN as NO3 in the control compared to the biochar treatments at H1. Short-term reduced NO3 following biochar addition has been observed by others and has been attributed to abiotic sorption [17], which potentially occurred in our experiment, although we did not measure NO3 sorption. Further, Nelissen et al. [17] also showed increased short-term NH4+ availability, attributed to biochar-induced increases in mineralization, potentially leading to more even distributions of each SIN type in our biochar treatments compared to the control. However, given that there were no significant differences in NO3 or NH4+ concentrations between biochar and control treatments, biochar-mediated NO3 sorption, which is often negligible, and mineralization, do not appear to be important in our study.
The lack of biochar effects, as well as differential effects between our biochar types, was likely due to our very low application rate, that was an order of magnitude lower than most biochar studies (112 kg ha−1 vs. rates in Mg ha−1). The literature supports weaker effects at low application rates— reductions in N2O emissions and NO3 leaching are minimized to non-significance at low application rates [39,56], likely due to reduced chemico-physical effects of biochar. Additionally, our data indicate lack of effects of biochar on soil microbial activity as there were no biochar effects on microbial abundance, the bacterial to fungal ratio, nor enzymatic activity, thus negating SIN reduction mechanisms of increased microbial N demand and physical sorption of N mineralizing enzymes, respectively. Several biochar studies have found lack of changes in SIN concentration, N2O, and MBN [40,57,58], even with higher application rates (15–30 Mg ha−1), indicating that biochar may not affect these pools in certain systems, regardless of application rate. Beyond application rates, depth of biochar application and application type are important considerations for interpreting results from field trials of biochar. As we continue to advance on-farm study of biochar, application methods need to be better integrated into frameworks of potential mechanisms and scientific sampling designs.
Our findings support the idea that low application rates of biochar are likely not sufficient to enhance N fixation. Since biochar application did not lead to reduced SIN, which was our expected mechanism for increased N fixation, it is not surprising to see non-significant effects of biochar on our proxies for N fixation (δ15N and nifH). Our low application rate could also explain these results—Mia et al. [20] found increased biomass, percent N derived from the atmosphere, and N fixed per pot at 10 Mg ha−1 but not at 1 Mg ha−1, which is still an order of magnitude higher than the rate used in our study, albeit being similar to our rhizosphere rate (~1.5 Mg ha−1). Alternatively, the non-significant differences in nifH gene abundance in our study may be due to the short time response of nifH gene to biochar addition. Other studies have found increased nifH gene abundance in soils with biochar addition [59,60], but this effect diminished after 22 days [60], and a longer-term study found no significant differences in nifH gene abundance between biochar-amended and control soils after six and twelve months [61]. Since we measured gene abundance on soils collected ~5 months after biochar application, any positive effects of biochar on nifH abundance may have already been reduced to comparable levels with the control.

4.2. Seasonal Trends in N Cycling

While we expected a decrease in SIN immediately following the biochar addition to affect N cycling, lack of treatment effects and changes in individual SIN species over time led to a complex pattern in mineral N availability. Regardless of biochar addition, there was a shift from approximately 60% of SIN as NO3 (at H1) to less than 20% of SIN as NO3 (at H4) over the growing season that was correlated with alfalfa δ15N. This correlation could be interpreted in multiple ways.
We could assume higher (more enriched) δ15N values are associated with greater BNF because dandelion δ15N values were significantly more negative than alfalfa early in the season. Thus, negative values likely represent available soil N pools. The significant negative correlation between the percent of SIN as NO3 and δ15N could suggest that early in the growing season plants derived their N from relatively high NO3 in the soil, and as plants reduced soil NO3 via uptake, BNF would no longer be inhibited [62] and could contribute additional N for the plant. N fixed by BNF can enter the soil as rapidly mineralizing organic N or directly as NH4+ through rhizodeposition [63] which could explain the shift to NH4+ in the late growing season. These patterns are further supported by the lack of correlation between total SIN and δ15N, which indicates that the extent of N fixation is not dependent on the total amount of mineral N in the system but rather a specific form of inorganic N. If alfalfa was truly delaying N fixation due to relatively high soil NO3 availability, alfalfa may provide greater sustainable (i.e., BNF) N input when grown in concert with other non-leguminous crops, either in a rotation or through intercropping, due to their soil N uptake. In the scenario outlined above, the convergence of dandelion δ15N values on alfalfa δ15N values over the growing season may indicate an uptake of biologically fixed N by dandelions. Although N transfer is largely outside of the scope of this study, it may be important to consider when choosing reference plants for N fixation studies using isotopic methods.
Alternative interpretations of the correlation between alfalfa δ15N and percent SIN as NO3 could attribute this relationship to the plant uptake of compost N or to changes in acquisition depth of N. However, these interpretations have less support from our data given that the compost had an enriched signal (δ15N = 14.8‰ ± 0.05‰) that was not portrayed in the plant δ15N signal and that NH4+ is relatively immobile and thus would not be expected to leach down the soil profile where it would be taken up later in the season [64]. The lack of significant correlations between nifH abundance and SIN measurements do not seem to support relationships between BNF and measures of SIN. However, nifH was only measured for H4 and in the bulk soil, which, in managed systems, has been shown to be similar to the rhizosphere soil [65], but may capture free-living N-fixers in addition to those associated with legume-associated BNF, potentially leading to our differential findings for our indicators of N fixation (δ15N and nifH).

4.3. N Cycling Genes and SIN Availability

Across all treatments, availability of SIN was an important predictor for genes representative of N loss but not for nifH. Total SIN, rather than a specific SIN species, was a better predictor for nirK and nosZ gene abundance, regardless of biochar application. The positive correlation of total SIN with nirK and nosZ gene abundance observed here likely indicates the requirement of N, regardless of form, for microbial metabolism [66,67]. However, this is in opposition to our findings for nifH, which was not correlated with any measure of SIN. The lack of correlation was especially surprising for nifH given significant associations between δ15N and the other N genes, but this could be due to the time of measurement, associated with seasonal dynamics of N mentioned above. Taken all together, findings related to N dynamics imply that reducing mineral N availability, particularly by reducing soil NO3 availability, may stimulate N fixation and reduce N losses as N2O or N2 via reduced abundance of denitrifying bacteria.
While previous studies have found biochar to be a promising tool for increasing N fixation, our field study found no effects of low application rates of biochar to a sandy soil on N cycling. Further study on application rates of biochar that are agronomically, environmentally, and economically effective and the conditions under which these are effective are needed to better realize the potential benefits of biochar in agriculture. Our findings suggest seasonal patterns in N cycling that may represent a shift from plant dependence on soil NO3 to biologically fixed N towards the end of the growing season. Additionally, total SIN, rather than a specific inorganic N species, was a better predictor of nosZ and nirK gene abundance. Taken together, these results could have management implications for soil N availability. Rather than applying biochar to increase N fixation and reduce N losses, a better solution for this system may be to grow alfalfa as an intercrop with other, non-leguminous forages or to rotate alfalfa more frequently with other crops under low N rates, which could reduce soil N availability and thus spur N fixation, while also potentially reducing N losses through denitrification.

Supplementary Materials

The following are available online at https://www.mdpi.com/2571-8789/3/4/77/s1. Table S1: Primers and PCR conditions used for gene analysis.

Author Contributions

Conceptualization, K.S.R., M.F.C., and S.J.F.; Formal analysis, K.S.R. and J.C.v.F.; Investigation, K.S.R.; Writing—original draft preparation, K.S.R.; Writing—review and editing, M.F.C., S.J.F., and J.C.v.F.; Supervision, M.F.C. and S.J.F.; Funding acquisition, M.F.C.

Funding

This research was funded by a donation from Cool Planet Energy Systems, Inc.

Acknowledgments

We thank Carolita Landers, Rebecca Even, and Bo Collins for field and lab support. We thank Pankaj Trivedi, Chanda Trivedi, Kylie Brice, Meagan Schipanski, and Kristen Otto for intellectual and technical support. We thank the commercial farm staff, especially Chris Malek, for working with us to perform this experiment on their farm, and for providing management information.

Conflicts of Interest

The authors declare no conflict of interest. This work was supported by a donation from Cool Planet Energy Systems, Inc. Cool Planet provided suggestions on biochar application rate and materials used in the experiment but had no other input on data analysis and interpretation.

References

  1. Galloway, J.N.; Aber, J.D.; Erisman, J.W.; Seitzinger, S.P.; Howarth, R.W.; Cowling, E.B.; Cosby, B.J. The Nitrogen Cascade. Bioscience 2003, 53, 341–356. [Google Scholar] [CrossRef]
  2. Fowler, D.; Coyle, M.; Skiba, U.; Sutton, M.A.; Cape, J.N.; Reis, S.; Sheppard, L.J.; Jenkins, A.; Grizzetti, B.; Galloway, J.N.; et al. The global nitrogen cycle in the twenty-first century. Philos. Trans. R. Soc. B Biol. Sci. 2013, 368, 20130164. [Google Scholar] [CrossRef] [PubMed]
  3. Nguyen, T.T.N.; Xu, C.Y.; Tahmasbian, I.; Che, R.; Xu, Z.; Zhou, X.; Wallace, H.M.; Bai, S.H. Effects of biochar on soil available inorganic nitrogen: A review and meta-analysis. Geoderma 2017, 288, 79–96. [Google Scholar] [CrossRef]
  4. Tonitto, C.; David, M.B.; Drinkwater, L.E. Replacing bare fallows with cover crops in fertilizer-intensive cropping systems: A meta-analysis of crop yield and N dynamics. Agric. Ecosyst. Environ. 2006, 112, 58–72. [Google Scholar] [CrossRef]
  5. King, A.E.; Hofmockel, K.S. Diversified cropping systems support greater microbial cycling and retention of carbon and nitrogen. Agric. Ecosyst. Environ. 2017, 240, 66–76. [Google Scholar] [CrossRef]
  6. Stagnari, F.; Maggio, A.; Galieni, A.; Pisante, M. Multiple benefits of legumes for agriculture sustainability: An overview. Chem. Biol. Technol. Agric. 2017, 4, 2. [Google Scholar] [CrossRef]
  7. Earles, R. Sustainable Agriculture: An Introduction; National Sustainable Agriculture Information Service: Washington, DC, USA, 2005; pp. 1–8. [Google Scholar]
  8. Forge Legumes, University of Minnesota Extension. Available online: https://extension.umn.edu/forage-variety-selection/forage-legumes (accessed on 27 September 2019).
  9. Davis, A.S.; Hill, J.D.; Chase, C.A.; Johanns, A.M.; Liebman, M. Increasing Cropping System Diversity Balances Productivity, Profitability and Environmental Health. PLoS ONE 2012, 7, e47149. [Google Scholar] [CrossRef]
  10. Spargo, J.T.; Cavigelli, M.A.; Mirsky, S.B.; Maul, J.E.; Meisinger, J.J. Mineralizable soil nitrogen and labile soil organic matter in diverse long-term cropping systems. Nutr. Cycl. Agroecosyst. 2011, 90, 253–266. [Google Scholar] [CrossRef]
  11. Rubio, L.M.; Ludden, P.W. Biosynthesis of the Cofactor of Nitrogenase. Annu. Rev. Microbiol. 2008, 62, 93–111. [Google Scholar] [CrossRef]
  12. Lehmann, J.; Joseph, S. Biochar for Environmental Management Science, Technology and Implementation; Routledge: New York, NY, USA, 2015. [Google Scholar]
  13. Wang, J.; Xiong, Z.; Kuzyakov, Y. Biochar stability in soil: Meta-analysis of decomposition and priming effects. GCB Bioenergy 2016, 8, 512–523. [Google Scholar] [CrossRef]
  14. Zhang, L.; Jing, Y.; Xiang, Y.; Zhang, R.; Lu, H. Responses of soil microbial community strucutre changes and activities to biochar addition: A meta-analysis. Sci. Total Environ. 2018, 643, 926–935. [Google Scholar] [CrossRef] [PubMed]
  15. Foster, E.J.; Fogle, E.J.; Cotrufo, M.F. Sorption to Biochar Impacts β-Glucosidase and Phosphatase Enzyme Activities. Agricuture 2018, 8, 158. [Google Scholar] [CrossRef]
  16. Nelissen, V.; Ruysschaert, G.; Muller-Stover, D.; Bodé, S.; Cook, J.; Ronsse, F.; Shackley, S.; Boeckx, P.; Hauggaard-Nielsen, H. Short-Term Effect of Feedstock and Pyrolysis Temperature on Biochar Characteristics, Soil and Crop Response in Temperate Soils. Agronomy 2014, 4, 52–73. [Google Scholar] [CrossRef]
  17. Nelissen, V.; Rutting, T.; Huygens, D.; Staelens, J.; Ruysschaert, G.; Boeckx, P. Maize biochars accelerate short-term soil nitrogen dynamics in a loamy sand soil. Soil Biol. Biochem. 2012, 55, 20–27. [Google Scholar] [CrossRef]
  18. Güereña, D.T.; Lehmann, J.; Thies, J.E.; Enders, A.; Karanja, N.; Neufeldt, H. Partitioning the contributions of biochar properties to enhanced biological nitrogen fixation in common bean (Phaseolus vulgaris). Biol. Fertil. Soils 2015, 51, 479–491. [Google Scholar] [CrossRef]
  19. Liu, L.; Wang, Y.; Yan, X.; Li, J.; Jiao, N.; Hu, S. Biochar amendments increase the yield advantage of legume-based intercropping systems over monoculture. Agric. Ecosyst. Environ. 2017, 237, 16–23. [Google Scholar] [CrossRef]
  20. Mia, S.; van Groenigen, J.W.; van de Voorde, T.F.J.; Oram, N.J.; Bezemer, T.M.; Mommer, L.; Jeffery, S. Biochar application rate affects biological nitrogen fixation in red clover conditional on potassium availability. Agric. Ecosyst. Environ. 2014, 191, 83–91. [Google Scholar] [CrossRef]
  21. Oram, N.J.; Van de Voorde, T.F.J.; Ouwehand, G.J.; Bezemer, T.M.; Mommer, L.; Jeffery, S.; Van Groenigen, J.W. Soil amendment with biochar increases the competitive ability of legumes via increased potassium availability. Agric. Ecosyst. Environ. 2014, 191, 92–98. [Google Scholar] [CrossRef]
  22. Quilliam, R.S.; DeLuca, T.H.; Jones, D.L. Biochar application reduces nodulation but increases nitrogenase activity in clover. Plant Soil 2013, 366, 83–92. [Google Scholar] [CrossRef]
  23. Rondon, M.A.; Lehmann, J.; Ramírez, J.; Hurtado, M. Biological nitrogen fixation by common beans (Phaseolus vulgaris L.) increases with bio-char additions. Biol. Fertil. Soils 2007, 43, 699–708. [Google Scholar] [CrossRef]
  24. Van Zwieten, L.; Rose, T.; Herridge, D.; Kimber, S.; Rust, J.; Cowie, A. Enhanced biological N2 fixation and yield of faba bean (Vicia faba L.) in an acid soil following biochar addition: Dissection of causal mechanisms. Plant Soil 2015, 395, 7–20. [Google Scholar] [CrossRef]
  25. Mia, S.; Dijkstra, F.A.; Singh, B. Enhanced biological nitrogen fixation and competitive advantage of legumes in mixed pastures diminish with biochar aging. Plant Soil 2018, 424, 639–651. [Google Scholar] [CrossRef]
  26. Galinato, S.P.; Yoder, J.K.; Granatstein, D. The economic value of biochar in crop production and carbon sequestration. Energy Policy 2011, 39, 6344–6350. [Google Scholar] [CrossRef]
  27. Foster, E.J.; Baas, P.; Wallenstein, M.D.; Cotrufo, M.F. Prescision biochar and innoculum applications shift bacterial community structure and increase specific nutrient availability and maize yield. Appl. Soil Ecol. 2019. in revision. [Google Scholar]
  28. Rajkovich, S.; Enders, A.; Hanley, K.; Hyland, C.; Zimmerman, A.R.; Lehmann, J. Corn growth and nitrogen nutrition after additions of biochars with varying properties to a temperate soil. Biol. Fertil. Soils 2012, 48, 271–284. [Google Scholar] [CrossRef]
  29. Schipanski, M.E.; Drinkwater, L.E.; Russelle, M.P. Understanding the variability in soybean nitrogen fixation across agroecosystems. Plant Soil 2010, 329, 379–397. [Google Scholar] [CrossRef]
  30. Crane-Droesch, A.; Abiven, S.; Jeffery, S.; Torn, M.S. Heterogeneous global crop yield response to biochar: A meta-regression analysis. Environ. Res. Lett. 2013, 8, 044049. [Google Scholar] [CrossRef]
  31. Gul, S.; Whalen, J.K. Biochemical cycling of nitrogen and phosphorus in biochar-amended soils. Soil Biol. Biochem. 2016, 103, 1–15. [Google Scholar] [CrossRef]
  32. Rajapaksha, A.U.; Chen, S.S.; Tsang, D.C.W.; Zhang, M.; Vithanage, M.; Mandal, S.; Gao, B.; Bolan, N.S.; Ok, Y.S. Engineered/designer biochar for contaminant removal/immobilization from soil and water: Potential and implication of biochar modi fi cation. Chemosphere 2016, 148, 276–291. [Google Scholar] [CrossRef]
  33. Mayer, Z.A.; Eltom, Y.; Stennett, D.; Schr, E.; Apfelbacher, A. Characterization of Engineered Biochar for Soil Management. Environ. Prog. Sustain. Energy 2014, 33, 490–496. [Google Scholar] [CrossRef]
  34. Yao, Y.; Gao, B.; Chen, J.; Yang, L. Engineered Biochar Reclaiming Phosphate from Aqueous Solutions: Mechanisms and Potential Application as a Slow-Release Fertilizer. Environ. Sci. Technol. 2013, 47, 8700–8708. [Google Scholar] [CrossRef]
  35. Chalk, P.M. Dynamics of biologically fixed N in legume-cereal rotations: A review. Aust. J. Agric. Res. 1998, 49, 303–316. [Google Scholar] [CrossRef]
  36. Malik, K.A.; Bilal, R.; Rasul, G.; Mahmood, K.; Sajjad, M.I. Associative N2-fixation in plants growing in saline sodic soils and its relative quantification based on 15N natural abundance. Plant Soil 1991, 137, 67–74. [Google Scholar] [CrossRef]
  37. Vitousek, P.M.; Menge, D.N.L.; Reed, S.C.; Cleveland, C.C. Biological nitrogen fixation: Rates, patterns and ecological controls in terrestrial ecosystems. Philos. Trans. R. Soc. B Biol. Sci. 2013, 368, 20130119. [Google Scholar] [CrossRef] [PubMed] [Green Version]
  38. Wallenstein, M.D.; Vilgalys, R.J. Quantitative analyses of nitrogen cycling genes in soils. Pedobiologia 2005, 49, 665–672. [Google Scholar] [CrossRef]
  39. Cayuela, M.L.; van Zwieten, L.; Singh, B.P.; Jeffery, S.; Roig, A.; Sánchez-Monedero, M.A. Biochar’s role in mitigating soil nitrous oxide emissions: A review and meta-analysis. Agric. Ecosyst. Environ. 2014, 191, 5–16. [Google Scholar] [CrossRef]
  40. Ramlow, M.; Foster, E.J.; del Grosso, S.J.; Cotrufo, M.F. Broadcast woody biochar provides limited benefits to deficit irrigation maize in Colorado. Agric. Ecosyst. Environ. 2019, 269, 71–81. [Google Scholar] [CrossRef]
  41. Rochette, P.; Janzen, H.H. Towards a revised coefficient for estimating N2O emissions from legumes. Nutr. Cycl. Agroecosyst. 2005, 73, 171–179. [Google Scholar] [CrossRef]
  42. Soil Science Division Staff. Soil Science Division Staff. Soil survey manual. In USDA Handbook 18; Ditzler, C., Scheffe, K., Monger, H.C., Eds.; Government Printing Office: Washington, DC, USA, 1993. [Google Scholar]
  43. Cool Terra, Cool Planet. Available online: https://www.coolplanet.com/cool-terra/types-of-use/ (accessed on 27 September 2019).
  44. Chalk, P.M. Estimation of N2 fixation by isotope dilution. Soil Biol. Biochem. 1985, 17, 389–410. [Google Scholar] [CrossRef]
  45. Longyear, B.O. The Dandelion in Colorado; The Agricultural Experiment Station: Fort Collins, CO, USA, 1918. [Google Scholar]
  46. Rodriguez, A. Will Cutting Dandelion Root Off an Inch Below the Surface of the Ground Kill It? Home Guides, SF Gate. Available online: http://homeguides.sfgate.com/cutting-dandelion-root-off-inch-below-surface-ground-kill-it-81173.html (accessed on 22 April 2019).
  47. Weaver, J.E. Root Development of Field Crops; McGraw-Hill: New York, NY, USA, 1926. [Google Scholar]
  48. McTaggart, I.P.; Smith, K.A. Estimation of potentially mineralisable nitrogen in soil by KCI extraction. Plant Soil 1992, 157, 175–184. [Google Scholar] [CrossRef]
  49. Bell, C.W.; Fricks, B.E.; Rocca, J.D.; Steinweg, J.M.; Mcmahon, S.K.; Wallenstein, M.D. High-throughput Fluorometric Measurement of Potential Soil Extracellular Enzyme Activities. J. Vis. Exp. 2013, 81, 1–16. [Google Scholar] [CrossRef] [PubMed]
  50. Bailey, V.L.; Fansler, S.J.; Smith, J.L.; Bolton, H. Reconciling apparent variability in effects of biochar amendment on soil enzyme activities by assay optimization. Soil Biol. Biochem. 2011, 43, 296–301. [Google Scholar] [CrossRef]
  51. Terakado-Tonooka, J.; Ando, S.; Ohwaki, Y.; Yoneyama, T. NifH gene expression and nitrogen fixation by diazotrophic endophytes in sugarcane and sweet potatoes. In Molecular Microbial Ecology of the Rhizosphere; de Bruijn, F.J., Ed.; John Wiley & Sons, Inc.: Hoboken, NJ, USA, 2013; pp. 437–444. [Google Scholar]
  52. Hallin, S.; Jones, C.M.; Schloter, M.; Philippot, L. Relationship between N-cycling communities and ecosystem functioning in a 50-year-old fertilization experiment. ISME J. 2009, 3, 597–605. [Google Scholar] [CrossRef] [PubMed]
  53. Bates, D.; Maechler, M.; Bolker, B.; Walker, S. Fitting linear mixed-effects models using lme4. J. Stat. Softw. 2015, 67, 1–48. [Google Scholar] [CrossRef]
  54. Lenth, R. Emmeans: Estimated Marginal Means, Aka Least-Squares Means; R Package Version 1.1, Russell Lenth; Iowa City, IA, USA, 2018; Available online: https://CRAN.R-project.org/package=emmeans (accessed on 27 September 2019).
  55. Box, G.E.P.; Cox, D.R. An analysis of transforamtions. J. R. Stat. Soc. 1964, 26, 211–243. [Google Scholar]
  56. Borchard, N.; Schirrmann, M.; Luz, M.; Kammann, C.; Wrage-Mönnig, N.; Estavillo, J.M.; Fuertes-Mendizábal, T.; Sigua, G.; Spokas, K.; Ippolito, J.A.; et al. Biochar, soil and land-use interactions that reduce nitrate leaching and N2O emissions: A meta-analysis. Sci. Total Environ. 2019, 651, 2354–2364. [Google Scholar] [CrossRef] [PubMed]
  57. Foster, E.J.; Hansen, N.; Wallenstein, M.; Cotrufo, M.F. Biochar and manure amendments impact soil nutrients and microbial enzymatic activities in a semi-arid irrigated maize cropping system. Agric. Ecosyst. Environ. 2016, 233, 404–414. [Google Scholar] [CrossRef] [Green Version]
  58. Verhoeven, E.; Six, J. Biochar does not mitigate field-scale N2O emissions in a Northern California vineyard: An assessment across two years. Agric. Ecosyst. Environ. 2014, 191, 27–38. [Google Scholar] [CrossRef]
  59. Ducey, T.F.; Ippolito, J.A.; Cantrell, K.B.; Novak, J.M.; Lentz, R.D. Addition of activated switchgrass biochar to an aridic subsoil increases microbial nitrogen cycling gene abundances. Appl. Soil Ecol. 2013, 65, 65–72. [Google Scholar] [CrossRef]
  60. Harter, J.; Krause, H.-M.; Schuettler, S.; Ruser, R.; Fromme, M.; Scholten, T.; Kappler, A.; Behrens, S. Linking N2O emissions from biochar-amended soil to the structure and function of the N-cycling microbial community. ISME J. 2014, 8, 660–674. [Google Scholar] [CrossRef]
  61. Bai, S.H.; Reverchon, F.; Xu, C.Y.; Xu, Z.; Blumfield, T.J.; Zhao, H.; Van Zwieten, L.; Wallace, H.M. Wood biochar increases nitrogen retention in field settings mainly through abiotic processes. Soil Biol. Biochem. 2015, 90, 232–240. [Google Scholar] [CrossRef]
  62. Peoples, M.B.; Herridge, D.F.; Alves, B.R.; Urquiaga, S.; Boddey, R.M.; Dakora, F.D.; Bhattarai, S.; Maskey, S.L.; Sampet, C.; Rerkasem, B.; et al. The contributions of nitrogen-fixing crop legumes to the productivity of agricultural systems. Symbiosis 2009, 48, 1–17. [Google Scholar] [CrossRef]
  63. Joëlle, F.; Fabien, L.; Stéphanie, M.; Jean-Bernard, C. Nitrogen rhizodeposition of legumes. A review. Agron. Sustain. Dev. 2010, 30, 57–58. [Google Scholar]
  64. Huang, Y.; Rickerl, D.H.; Kephart, K.D. Recovery of Deep-Point Injected Soil Nitrogen-15 by Switchgrass, Alfalfa, Ineffective Alfalfa, and Corn. J. Environ. Qual. 1996, 25, 1394–1400. [Google Scholar] [CrossRef]
  65. Wartiainen, I.; Eriksson, T.; Zheng, W.; Rasmussen, U. Variation in the active diazotrophic community in rice paddy nifH PCR-DGGE analysis of rhizophere and bulk soil. Appl. Soil Ecol. 2008, 39, 65–75. [Google Scholar] [CrossRef]
  66. Clark, I.M.; Buchkina, N.; Jhurreea, D.; Goulding, K.W.T.; Hirsch, P.R. Impacts of nitrogen application rates on the activity and diversity of denitrifying bacteria in the Broadbalk Wheat Experiment. Philos. Trans. R. Soc. B Biol. Sci. 2012, 367, 1235–1244. [Google Scholar] [CrossRef] [Green Version]
  67. Kaiser, E.-A.; Mueller, T.; Joergensen, R.G.; Insam, H.; Heinemeyer, O. Evaluation of methods to estimate the soil microbial biomass and the relationship with soil texture and organic matter. Soil Biol. Biochem. 1992, 24, 675–683. [Google Scholar] [CrossRef]
Figure 1. Alfalfa biomass production from a field study with three biochar treatments in an irrigated, commercial alfalfa field sampled in 2018 near Roggen, CO. Means are presented for each treatment at four harvest dates, along with cumulative biomass (Cum.) produced over the growing season. Error bars represent the standard error (n = 6). Biochar treatments are represented as control (C; white), coconut shell biochar (CBC; dark grey), and pine biochar product (PBC; light grey). The date was a significant predictor for alfalfa biomass (p < 0.001), which was not predicted by biochar type nor the biochar by date interaction.
Soilsystems 03 00077 g001
Figure 2. Average soil inorganic nitrogen (SIN) concentration over time for soils (0–20 cm) under three biochar treatments applied to an irrigated, commercial alfalfa field sampled in 2018 near Roggen, CO. Bars are broken into NH4+ (light gray) and NO3 (dark gray). Error bars represent the standard error (n = 6). There were no significant differences between biochar types nor significant interactions for total SIN or individual inorganic nitrogen (N) species. The date was a significant predictor for total SIN (p < 0.001) and individual inorganic N species (p < 0.001). The interaction was significant for percent of SIN as NO3, which was significantly higher in the control for Harvest 1 (H1) (p < 0.006). Biochar types are represented as control (C), coconut shell biochar (CBC), and pine biochar product (PBC).
Soilsystems 03 00077 g002
Figure 3. Average plant δ15N over time for alfalfa under three biochar treatments and for dandelions within an irrigated, commercial alfalfa field sampled in 2018 near Roggen, CO. Error bars represent one standard error (n = 6). There were no significant differences between biochar types for alfalfa δ15N. The date was a significant predictor for alfalfa (p < 0.001) and dandelion (p = 0.042) δ15N. Treatments are represented as alfalfa under control (C), coconut shell biochar (CBC), pine biochar product (PBC), and dandelions averaged across treatments (D).
Soilsystems 03 00077 g003
Figure 4. Average gene abundance for three N functional genes in soils (0–20 cm) under three biochar treatments sampled on 21 September 2019 within an irrigated alfalfa field near Roggen, CO. Please note the different y-axes for each gene. Error bars represent the standard error (n = 6). There were no significant differences between biochar types for any functional genes. Biochar types are represented as control (C; white), coconut shell biochar (CBC; light grey), and pine biochar product (PBC; dark grey).
Soilsystems 03 00077 g004
Figure 5. Correlations between total SIN or relative abundance of a given N species and metrics explicitly associated with N cycling (alfalfa δ15N, nirK, nosZ, and nifH) in soils (0–20 cm) from an irrigated alfalfa field sampled in 2018 near Roggen, CO. Points in the δ15N plots (top panels) are colored by the harvest date because this was a significant predictor of these metrics. The x-axis of the top left plot was log transformed to meet normality assumptions. R2 and p-values for each correlation are provided in the corner of each plot.
Soilsystems 03 00077 g005
Table 1. Selected properties for the two biochars used in the experiment: Pine biochar product (PBC) and coconut shell biochar (CBC). Asterisks indicate values for the PBC biochar base material. All other values were measured for the agglomerate product. Electrical conductivity (Ece) is an indicator of salinity.
BiocharOrganic C (%)H:Corg (Molar Ratio)C:N (Mass Ratio)Ash (%)pHSurface Area (m2/g)Moisture (%)Ece (mmhos/cm)
PBC72.07*0.659*30*1.02*6.1397–1102.251.88
CBC62.250.4181481.887.61200–3004.291.92
Table 2. Microbial analyses of soils (0–20 cm) from an alfalfa field near sampled Roggen, CO in 2018. Values presented as mean ± standard error (n = 6) for each biochar type: control (C), coconut shell biochar (CBC), and pine biochar product (PBC). All microbial analyses were done for the H4 (21 September) sampling date. Biochar type was not a significant predictor for any of these measurements.
MeasurementUnitsBiochar Type
CCBCPBC
Bacterial DNA abundancecopies g−1 soil7.95 × 109 ±
3.91 × 10⁹
1.49 × 10⁹ ±
3.24 × 10⁸
3.57 × 10⁹ ±
7.92 × 10⁸
Fungal DNA abundancecopies g−1 soil2.33 × 1011 ±
1.03 × 10¹¹
3.52 × 10¹¹ ±
1.62 × 10¹¹
1.78 × 10¹¹ ±
9.77 × 10¹⁰
LAPmmol g−1 soil4.70 ± 0.812.87 ± 1.075.54 ± 1.50
NAGmmol g−1 soil7.93 ± 4.283.65 ± 0.833.55 ± 1.17

