Article

Rapid Recent Recovery from Acidic Deposition in Central Ontario Lakes

by
Shaun A. Watmough
* and
M. Catherine Eimers
Trent School of the Environment, Trent University, Peterborough, ON K9L 0G2, Canada
*
Author to whom correspondence should be addressed.
Soil Syst. 2020, 4(1), 10; https://doi.org/10.3390/soilsystems4010010
Submission received: 16 November 2019 / Revised: 8 January 2020 / Accepted: 4 February 2020 / Published: 7 February 2020

Abstract

:
In many regions, chemical recovery in lakes from acidic deposition has been generally slower than expected due to a variety of factors, including continued soil acidification, climate-induced sulphate (SO4) loading to lakes and increases in organic acidity. In central Ontario, Canada, atmospheric sulphur (S) deposition decreased by approximately two-thirds between 1982 and 2015, with half of this reduction occurring between 2005 and 2015. Chemical recovery in the seven lakes was limited prior to 2005, with only small increases in pH, Gran alkalinity and charge-balance ANC (acid-neutralizing capacity). This was because lake SO4 concentrations closely followed changes in S deposition, and decreases in base cation concentration closely matched declines in SO4. However, decreases in S deposition and lake SO4 were more pronounced post-2005, and much smaller decreases in lake base cation concentrations relative to SO4 resulted in large and rapid increases in pH, alkalinity and ANC. Dissolved organic carbon concentrations in lakes increased over the study period, but had a limited effect on lake recovery. Clear chemical recovery of these lakes only occurred after 2005, coinciding with a period of dramatic declines in S deposition.

1. Introduction

Chemical recovery in lakes from the large reductions in acidic deposition that occurred in eastern North America and Europe over the past 40 years or so has been mixed [1,2]. While sulphate (SO4) and nitrate (NO3) are the main components of acidic deposition, SO4 has traditionally been the primary contributor to aquatic acidification because NO3 inputs in deposition are retained in terrestrial ecosystems [3]. In some cases, such as in regions near smelters, rapid and large reductions in atmospheric S deposition have occurred, which have resulted in strong recovery responses [4]. In other areas, chemical recovery has been less than expected, owing to a number of confounding factors, including S release from upland and organic soils, depletion of exchangeable base cation pools and increases in organic acidity that have offset declines in mineral acids [5,6,7].
Reductions in atmospheric sulphur (S) deposition have generally led to decreases in SO4 concentrations in lakes, however, in some regions, the net release of S from soils from historical S deposition has resulted in a slower response than expected [8]. Similarly, climate-induced SO4 release from organic soils in catchments can lead to higher SO4 loadings to lakes than would be expected from deposition alone [9]. In other studies, decreases in base cation (primarily calcium (Ca) and magnesium (Mg)) concentrations in lakes have approximately matched decreases in SO4 concentrations, which also contribute to delayed chemical recovery [10]. The decrease in base cation concentration is largely attributable to continued soil acidification [11]. Chemical recovery from acidification in lakes has also been affected by increases in organic acidity caused by higher dissolved organic carbon (DOC) export from catchments [12]. It is important to recognize that three different metrics typically are used to describe chemical recovery: pH, owing to its biological relevance, charge-balance ANC (acid-neutralizing capacity), because of its direct connection to geochemical models, and Gran or titratable alkalinity, which takes into account other chemical species that contribute to alkalinity such as DOC and aluminum (Al). In regions where substantial increases in DOC have occurred, there is often a limited increase in alkalinity (or organic acid adjusted ANC), even though there is an increase in charge balance ANC, due to the increasing importance of organic acidity [6].
Widespread lake acidification in central Ontario was first documented in the 1970s [13,14]. Since then, large reductions in SO2 (and NOx) emissions in North America have occurred [15]. However, despite these large declines, only a limited chemical response was observed in lakes prior to 2000 [16,17]. More recently, Palmer et al. [18] re-evaluated lake chemistry in central Ontario between 1982 and 2005 and showed that chemical recovery remained slow. Palmer et al. [18] found that even though the median decrease in SO4 concentration in eight intensively monitored lakes was 1.84 µeq L−1 yr−1, the median increase in alkalinity over this period was just 0.19 µeq L−1 yr−1, and the median increase in pH was just 0.01 pH units yr−1. This lack of chemical recovery was attributed to a decline in Ca and Mg concentrations that approximately matched the decrease in SO4. Regional increases in lake DOC concentrations have also been reported in central Ontario between 1982 and 2010, and although the cause of this increase is debated [19], an increase in DOC will lead to an increase in organic acidity that may further delay chemical recovery from acidic deposition.
More recently, Watmough et al. [11] reported that recovery from acidification in central Ontario, prior to 2010, was restricted by soil acidification and drought-related SO4 release from soils. However, mass balance studies indicated that net losses of base cations from soils became smaller between 1982 and 2010, and input–output budgets were almost in balance, suggesting the possibility of a more rapid recovery from acidification in the future [11]. Further, since 2005, SO2 emissions in North America have decreased substantially [20], which could enhance chemical recovery in lakes. In light of these observations, the objective of this study was to re-assess seven intensively monitored lakes in central Ontario that are regionally representative [18], to evaluate whether recent reductions in SO2 emissions have led to a substantial chemical recovery from acidic deposition.

2. Materials and Methods

2.1. Study Area

The seven small (<550 ha) headwater lakes have been monitored intensively by the Ontario Ministry of Environment, Conservation and Parks (OMECP) since the mid-1970s, and are considered representative of lakes in the broader region [18]. The study’s lakes are located within a 30 km radius of one another in the Muskoka–Haliburton region of Ontario, on a southern extension of the Precambrian Shield in the Great Lakes–St. Lawrence ecozone (Figure 1). They have minimal lakeshore development, and their watersheds are almost entirely forested, with little-to-no agriculture. Sugar maple (Acer saccharum) is the dominant deciduous tree species in the region, along with American beech (Fagus grandifolia) and yellow birch (Betula allegheniensis). White pine (Pinus strobus) and eastern Hemlock (Tsuga canadensis) are the dominant coniferous species. Bedrock is dominated by slowly weathering metamorphic and igneous rock, and soils are typically shallow (<0.5 m) Podzols or Brunisols [21]. Exchangeable soil Ca pools are low (113–1300 kg ha−1) and were shown to decrease between 1983 and 1999 [3]. According to the Köppen Climatic Classification System, the climate is humid continental, with long cool summers (Dfb), [22].
Total annual precipitation averaged 101 cm over the 34-year study period, with approximately 30% falling as snow. The mean annual temperature over the same period was 4.9 °C (range 3.3–6.7 °C).

2.2. Lake and Bulk Precipitation Sampling

Lakes were sampled approximately monthly over the ice-free season (May–October) between 1982 and 2015, at a single station situated above the deepest part of the lake, which is common for limnological studies on relatively small lakes. For each lake, volume-weighted water samples (whole-lake samples during overturn periods and separate epi-, meta- and hypolimnetic samples during thermal stratification) were collected for chemical analysis. Specifically, during the summer months of thermal stratification, water samples were collected at the midpoint of every 2 m stratum, using a peristaltic pump fitted with a polyvinyl chloride hose, and samples were immediately filtered through 80 µm mesh, to remove zooplankton. Water samples from the epilimnion, metalimnion and hypolimnion were analysed separately, and the resultant concentration values were multiplied by the volume of water in each stratum, summed and then divided by total lake volume, to create monthly volume-weighted values. During periods of lake overturn (spring and fall months), whole-lake integrated samples of the entire water column were analyzed. Monthly volume-weighted concentrations were then averaged over the entire ice-free season (May–October), to create ice-free means. Between seven and eight monthly volume-weighted samples per lake were collected in each year of the 34-year period.
Bulk deposition was collected typically weekly, using continuously open, lined plastic buckets at open areas at three locations in the region: Plastic and Heney Lakes and at the Dorset Environmental Science Centre (DESC; Figure 1). Each bulk collector is 1.7 m above the ground and topped with a funnel covered with a Nitex screen (10 cm × 10 cm; 500 µm mesh), to limit entry of coarse particles and insects [23]. During each sampling event, deposition samples were removed and buckets were refitted with clean food-grade plastic bag liners and Nitex screens. Similar to lake samples, bulk deposition samples were coarse filtered (80 µm) prior to transport to the laboratory in insulated coolers.

2.3. Chemical Analyses

All chemical analyses were conducted at the DESC, which is part of the OMECP (Ontario Ministry of Environment, Conservation and Parks), located in Dorset Ontario. Analytical methods have been generally consistent over the 34-year period and are described in detail by the Ontario Ministry of the Environment [24]. In brief, total inflection end-point alkalinity was measured by titration and determined by using the Gran method, and is expressed in equivalence units of CaCO3. Dissolved organic carbon was measured colourimetrically with phenolphthalein after first acidifying samples and flushing with nitrogen gas, to remove inorganic C, and then oxidizing organic carbon to CO2 by exposure to UV light in acid-persulfate media. Water samples for C determination were not filtered (0.45 µm) prior to analysis, because previous studies have shown that the majority of total organic carbon present in lakes and deposition is dissolved, and so TOC is assumed to by synonymous with DOC [25]. Charge balance Acid Neutralizing Capacity (CB_ANC) was computed as the sum of positive charges associated with base cations minus the sum of negative charges associated with acid anions.
CB_ANC = [Ca2+ + Mg2+ + K+ + Na+] − [SO42− + NO3 + Cl]
Similar to Futter et al. [2], an organic acid adjusted ANC was further computed based on the concentration of DOC and strong acid fraction of DOC as follows:
OAA_ANC = CB_ANC − (1/3)*[DOC]*SD
where a site density (SD) of 10.2 µeq L−1 is used for DOC (mg C L−1), assuming one-third of these charged sites are permanently dissociated.
Organic acidity (OAA) was calculated by following the method described in Oliver et al. [26], as follows:
OAA = (K*[CT])/(K + [H+])
where CT is the organic acid concentration estimated by multiplying the DOC concentration in mg L−1 by 10 µeq mg−1, and the mass action quotient, K, is estimated from pK = 0.96 + 0.90 pH − 0.039 (pH)2.

2.4. Statistical Analyses

Long-term trends in annual volume-weighted bulk deposition and lake chemistry over the 34-year period were assessed by using the Mann–Kendall test, and trend slopes were calculated by using Sen’s slope [27].

3. Results

3.1. Bulk Deposition
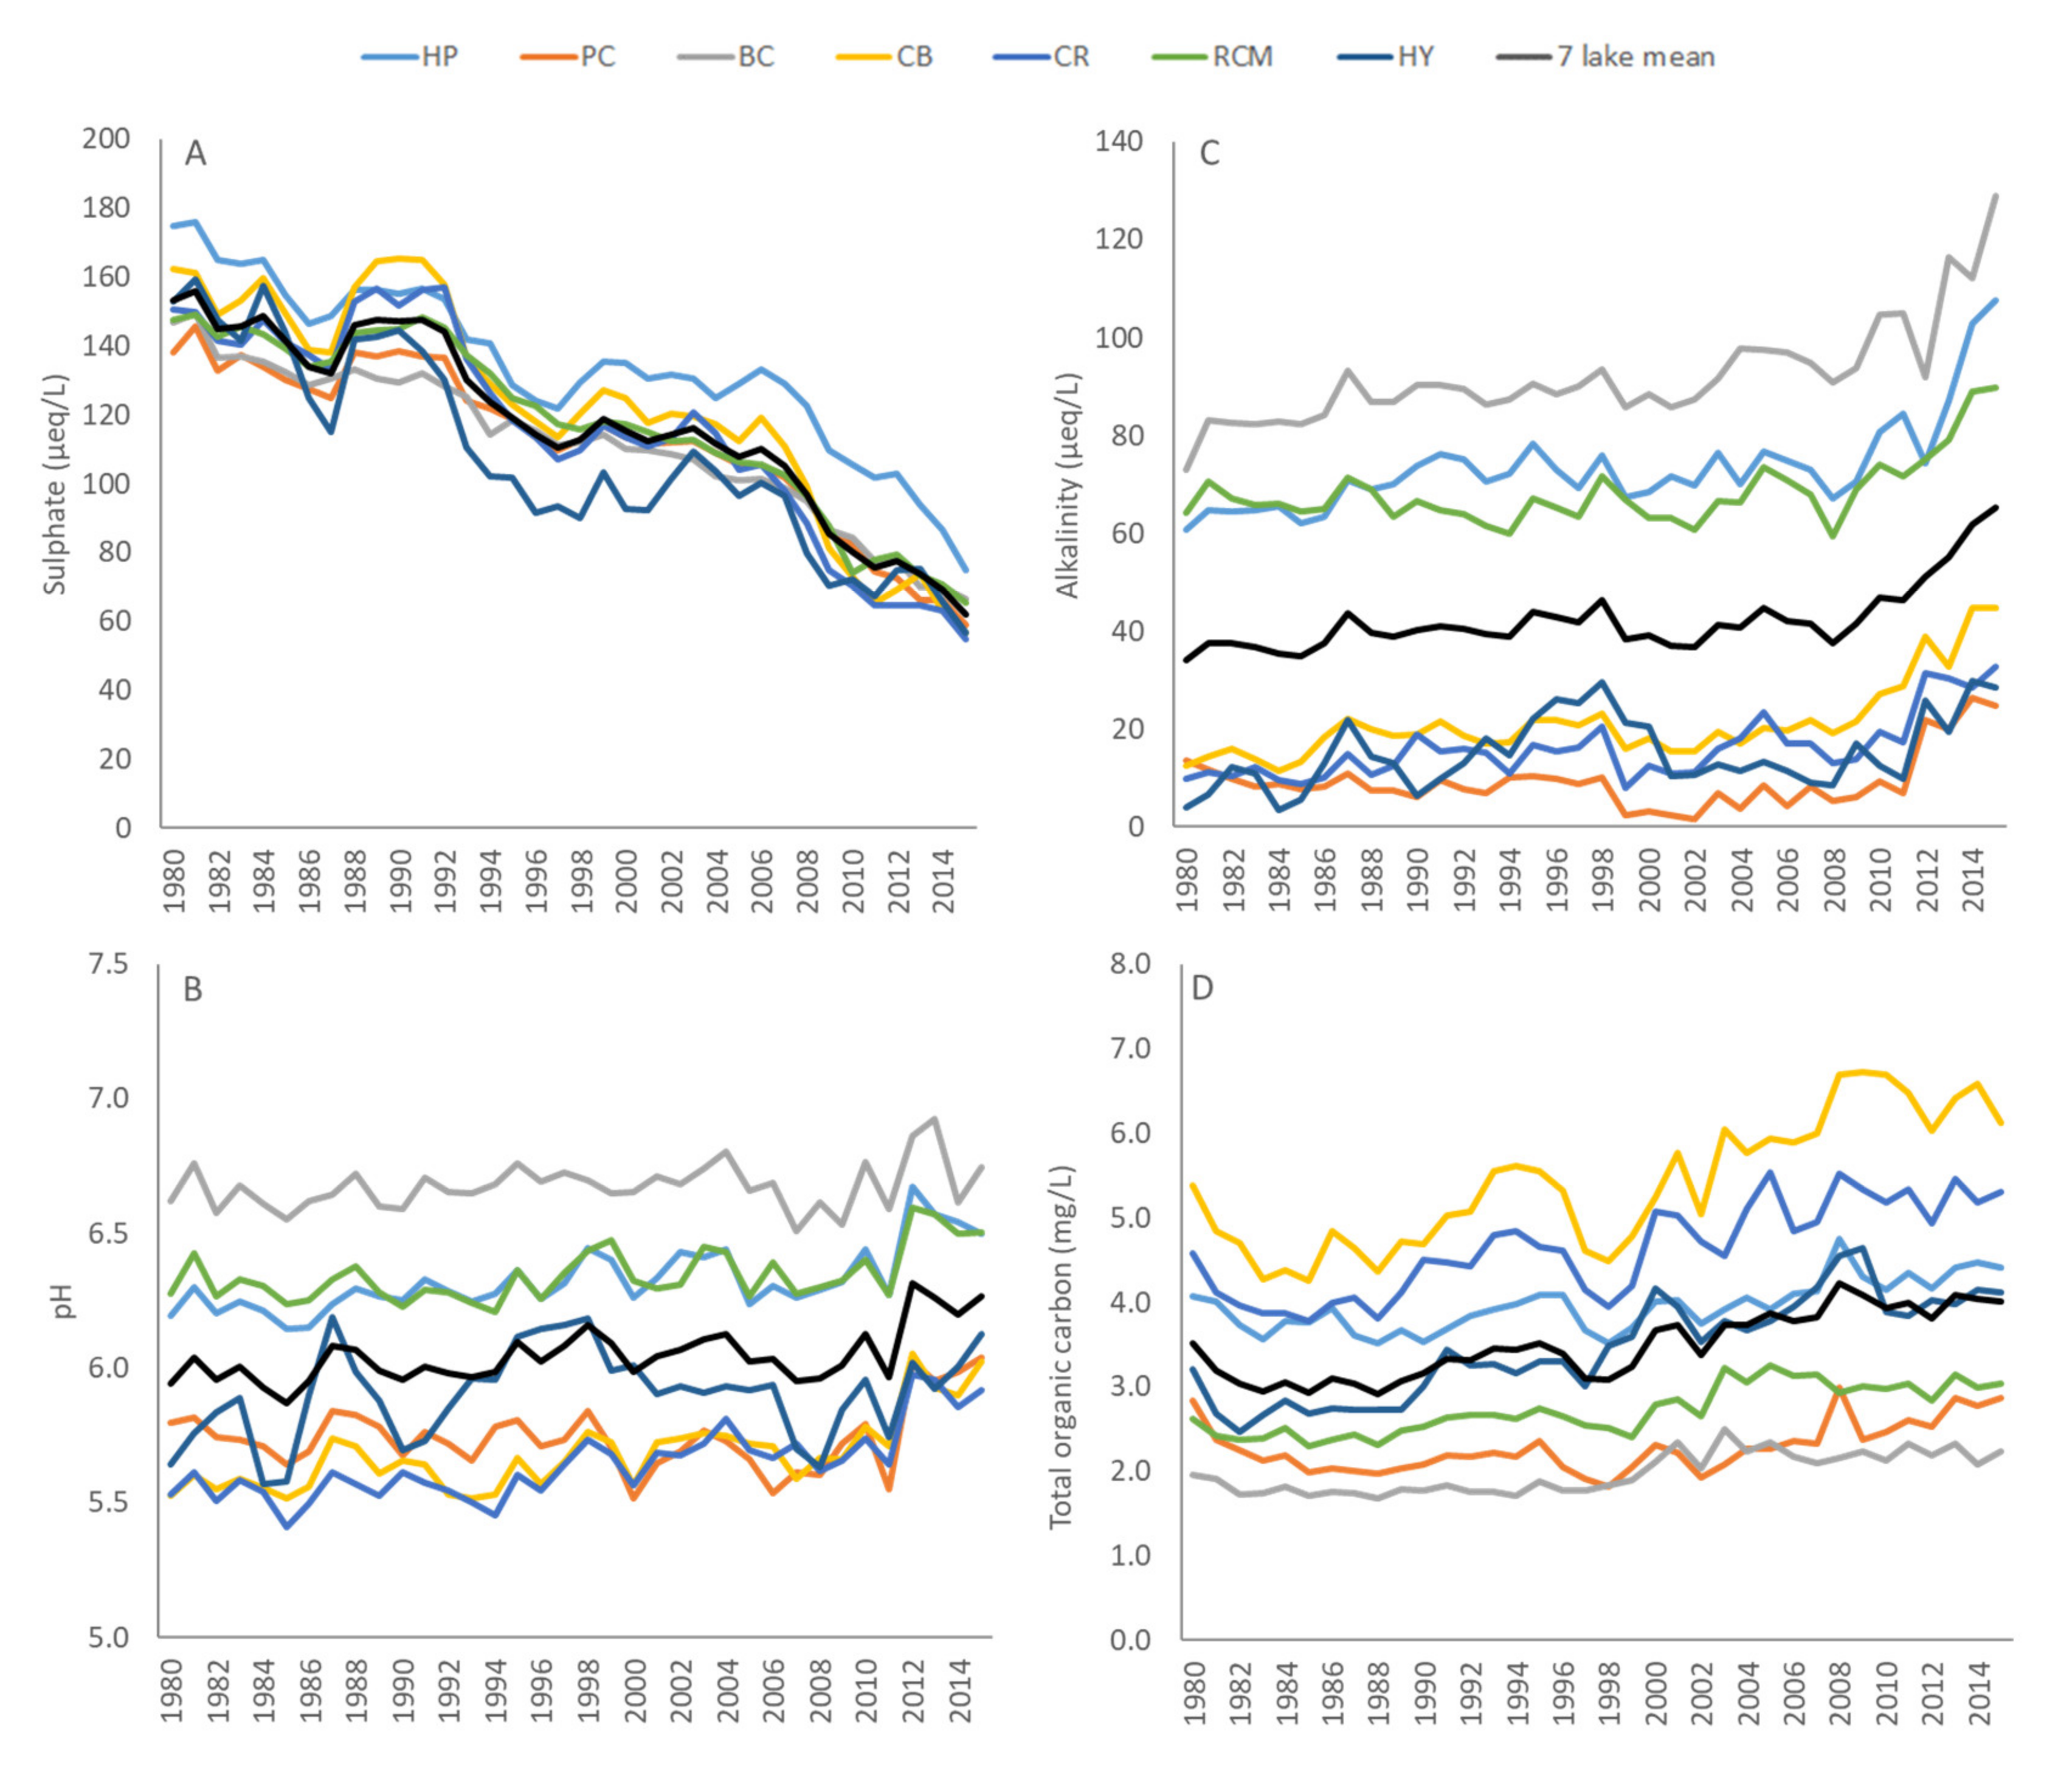
Bulk deposition of SO4 and NO3 decreased significantly, and pH increased over the 34-year period of record (Figure 2; Table 1). The decline in SO4 deposition was particularly large (~2/3; 40 meq/m2 over 34 years); however, half of this decline occurred in the final 10 years of record (2005–2015), and deposition fell below 20 meq m−2 yr−1 by 2015 (Figure 2). Nitrate deposition also decreased significantly over the study period (Table 1), but the pattern in NO3 deposition differed from that of SO4 (Figure 2). Nitrate deposition exhibited little change between 1982 and the early 2000s, averaging 40 meq m−2 yr−1, but subsequently dropped substantially by approximately 50%, reaching 20 meq m−2 yr−1 by 2015. There was no significant trend in base cation deposition over the entire study period, but base cation deposition decreased slightly between 1982 and 2005 and increased between 2005 and 2015 (Figure 2; Table 1). Base cation deposition was generally between 10 and 20 meq m−2 yr−1, although it was highest (~25 meq m−2 yr−1) at the end of the study period (Figure 2). Consequently, the pH of bulk deposition increased steadily from around 4.4 to just over 5.0 over the entire period of record (Figure 2).

3.2. Lake Chemistry

The seven lakes exhibited generally consistent patterns in water chemistry over the study period (Table 2; Figure 3). Sulphate concentrations were between 140 and 160 µeq L−1 in the early 1980s and fell to around 100 to 130 µeq L−1 by 2005, a decrease of approximately 30%, which is consistent with changes in bulk SO4 deposition. In contrast to bulk deposition, however, SO4 concentrations in all lakes increased slightly between 1987 and 1991 (Figure 3A). After 2005, SO4 concentrations in lakes decreased more rapidly, averaging between 50 and 60 µeq L−1 by 2015 (Figure 3A).
Between 2005 and 2015, the median annual rate of decrease in SO4 concentration across the seven lakes was 5.0 µeq L−1 yr−1, compared with 1.7 µeq L−1 yr−1 between 1982 and 2005 (Table 2). Concentrations of NO3-N in the seven lakes were very low (<10 µeq L−1), and although several lakes exhibited decreases in NO3-N concentration (Table 2), NO3-N was only a small contributor to the strong acid concentration of the lakes (average <6%).
Between 1982 and 2005, there were modest increases in the pH (+0.007 units yr−1), Gran alkalinity (0.26 µeq L−1 yr−1) and charge balance ANC (0.46 µeq L−1 yr−1) of lake water (Figure 3B,C and Figure 4; Table 2), but there were also large decreases in the sum of base cation concentrations (Figure 4; Table 2). Median base cation concentrations fell from around 190 µeq L−1 in 1982 to around 170 µeq L−1 in 2005, which is a median decrease of 1.5 µeq L−1 yr−1 (Figure 4; Table 2). Calcium is the dominant base cation in lake water and is primarily responsible for these trends (Table 2). In contrast, changes in alkalinity, charge balance ANC and pH post-2005 were much more dramatic (Figure 3B,C and Figure 4; Table 2). Between 2005 and 2015, base cation concentrations continued to fall, with a median decrease of 2.7 µeq L−1 yr−1, but this decrease was only about half of the median decline in SO4 (Table 2). As a consequence, median alkalinity, pH and charge balance ANC of the seven lakes increased by 2.1 µeq L−1 yr−1, 0.028 pH units yr−1 and 2.5 µeq L−1 yr−1, respectively (Table 2).
Dissolved organic carbon concentrations were between 2.0 and 6.0 mg L−1 in the seven lakes and increased significantly over the study period (Figure 3d). The increase in DOC, however, was quite modest (<0.03 mg L−1 yr−1; Table 2), and changes in organic acid adjusted-ANC mirrored changes in charge balance ANC, changing very little between 1982 and 2005 (0.25 µeq L−1 yr−1), but increasing dramatically post-2005, from around 45 to 65 µeq L−1, an increase of 2.3 µeq L−1 yr−1 (Figure 4; Table 2).

4. Discussion

Numerous surface waters in eastern North America and Western Europe have shown a less-than-expected chemical response to declines in acidic deposition, and this has generated substantial discussion of potential causes of delayed recovery, although it is generally recognized that soil processes are important [1,2,5,7,11]. This paper utilizes a 34-year-long dataset from seven regionally representative lakes, to provide further insight into the factors contributing to this variable response. Specifically, lakes in south–central Ontario showed minimal improvement in pH, alkalinity or charge balance ANC prior to 2005, despite a ~40% decline in SO4 deposition between 1982 and 2005. Only after further substantial declines in SO4 deposition post-2005 did all lakes exhibit a large and rapid chemical recovery. A similar recent acceleration of chemical recovery has been reported in the northeastern United States [15].
The lack of recovery from acidic deposition over the earlier period has been attributed to both climatically induced SO4 loadings to lakes [9] and continued soil acidification [11]. Specifically, all seven lakes exhibited a slight increase in SO4 concentration between 1988 and 1991 that was caused by extended back-to-back periods of summer drought that led to declines in water table height in wetlands within the region [28]. During summer droughts, S that is stored in wetland sediment is oxidized to SO4, which is flushed to lakes when streamflow resumes in the fall [29]. High SO4 export following droughts leads to a decrease in pH in streams draining into lakes, and this decrease can persist through the subsequent winter season [30]. While these acidic pulses may have an immediate impact on biota in streams, the overall impact of these droughts on the chemical recovery of lakes appears to be temporary. Sulphate concentrations in lakes decreased more rapidly after 1991, such that, between 1982 and 2005, the median decrease in SO4 concentrations in lakes was consistent with measured changes in bulk SO4 deposition (median ~ 30%). Nitrate deposition also decreased over the study period, but although some lakes exhibited a significant decrease in NO3 concentration, it contributed little to lake acidity, because the majority of deposited N is retained within terrestrial catchments in this region [3].
While drought-induced SO4 release slowed the lake response to deposition declines, decreases in base cation concentrations that more or less compensated for decreases in strong acids (i.e., SO4) were the primary driver of limited chemical recovery between 1982 and 2005. Calcium is the dominant base cation in lake water, and decreases in base cations are largely attributed to declines in lake Ca concentration. Several studies have suggested that Ca levels in lakes are approaching, or have passed, critical biological thresholds in many lakes in the region [31,32,33]. Studies in Europe and North America have similarly found that recovery from acidic deposition has been less than expected, because of a sharp decline in surface-water base cation concentrations [10]. The decrease in lake cation concentrations is largely attributable to soil acidification [11], and mass balance studies in the region have indicated that the net export of Ca relative to inputs in deposition and mineral weathering has resulted in soil acidification [3]. Over time, however, the estimated base cation deficit has decreased, and recent studies indicate that base cation budgets are approximately in balance and that soils are no longer acidifying [11]. This suggests that further declines in acid inputs to the region should result in a more rapid and immediate chemical response in lake water, as soils start to recover and base cation pools increase.
Indeed, over the 11-year period between 2005 and 2015, SO4 deposition decreased by a further 20 meq m−2, which is similar to the magnitude of S deposition decline that occurred over the previous 23 years. These deposition changes led to a much more rapid reduction in SO4 concentration in lakes. Over the same period, base cation concentrations in lakes also fell, but, whereas declines before 2005 were comparable to declines in lake SO4, the median decrease in base cations post-2005 was only half of the observed change in lake SO4 concentration. This suggests that past declines in lake base cation concentrations, and Ca in particular, effectively retarded the chemical recovery of lakes from acidification. In contrast, large increases in alkalinity, charge balance ANC and pH post-2005 are due to smaller declines in base cations relative to SO4. Similarly, Strock et al. [34] reported more dramatic declines in SO4 relative to base cations in lakes in the northeastern USA after 2002. The rate of chemical recovery measured post-2005 is greater than has typically been observed in regional studies remote from point emission sources [10,35] and is more consistent with changes observed close to smelters where substantial reductions in S deposition have occurred [4].
The reason for the much lower relative decline in base cations after 2005, compared with the previous two decades, is unclear. Base cation mass balance studies in the region indicate soils are no longer acidifying [11], and Lawrence et al. [36] reported that pH and Al mobility in upper soil horizons at many sites in eastern North America are starting to recover from past acidification. Kirchner et al. [37] showed that base cation export relative to strong acids is associated with the size of the soil exchangeable base cation pool. An increase in exchangeable soil base cations would therefore lead to greater chemical recovery in lakes. Even so, an increase in soil base cation pools alone is unlikely to fully account for the much smaller decrease in base cation concentrations relative to strong acids that was observed in the seven lakes after 2005 because soil recovery from acidification is slow. Treating soils as a single homogeneous “box” may also be too simplistic. Even though soils are generally shallow in this region, all catchments have some areas of deeper till that can contribute groundwater that is more enriched in base cations, and groundwater has been shown to neutralize acidic precipitation in the region [38]. As a consequence, the relative importance of base cation contributions to lakes from groundwater may have increased as base cation losses from upper soil horizons have stabilized.
An additional explanation is that an increase in organic acidity can lead to a disconnect between strong acid and base cation concentrations in lakes [12]. Futter et al. [2], for example, found that chemical recovery from acidic deposition in Swedish lakes between 1987 and 2012 was slow because of several factors, including a decrease in base cation concentration, an increase in sea salt deposition and an increase in DOC. In our study, sea salt deposition is not relevant, but there was a significant increase in DOC concentration in the study lakes. The increase in DOC concentration was quite modest, however, and the organic acid adjusted ANC exhibited a similar recovery pattern to that of charge balance ANC or alkalinity, indicating that, in contrast to other studies [6], increases in lake DOC are having a limited impact on chemical recovery from acidic deposition in this region.
Other studies have suggested that increases in temperature could positively affect base cation levels by stimulating decomposition [39,40] or weathering processes [41], thereby resulting in greater base cation availability in soils. Another factor to consider is that base cation deposition, while generally low, also increased after 2005, which may have contributed to the chemical recovery in lakes. In some regions, a decline in base cation deposition has contributed to a delay in recovery [42], and other studies have shown that atmospheric base cation deposition can play an important role in preventing acidification. The reason for higher base cation deposition after 2005 is unknown, but may be linked to a variety of factors, including greater dust emissions or long-range transport from forest fires [43]. None of the lakes in this analysis are surrounded by unpaved roads, but other studies in the region have documented large increases in lake Ca concentrations caused by the application of Ca-containing dust suppressants (e.g., calcium chloride; [43]). While dust suppressants are not directly affecting lakes considered in this study, it is possible that regional increases in dust suppressant use could have contributed to higher atmospheric base cation levels that were observed in bulk deposition. Hence, while rapid chemical recovery in lakes occurred post-2005, due to a much greater decline in lake SO4 concentrations relative to base cations, the mechanisms driving base cation behavior remain unclear and warrant further study. This is especially important in light of model forecasts that predict Ca levels in many lakes will continue to fall below critical thresholds in regions experiencing timber harvesting [44].

5. Conclusions

Between 1982 and 2015, bulk deposition of SO4 decreased by approximately 70%, with half of this decrease occurring prior to 2005, and a more rapid decrease in SO4 bulk deposition occurred between 2005 and 2015. Patterns in lake SO4 concentrations were generally coherent, with changes in bulk deposition; however, back-to-back droughts in the late 1980s temporarily increased lake SO4 and decoupled lake and deposition trends. Very limited chemical recovery occurred prior to 2005 because decreases in base cation concentration approximately matched declines in lake SO4. In contrast, SO4 concentrations in lakes declined more rapidly after 2005, and the decrease in base cation concentrations over the same period was only about half as great, leading to large and rapid increases in lake pH, measured alkalinity and charge balance ANC. Dissolved organic carbon concentrations increased over the entire study period but had a minimal impact on lake chemical recovery. Importantly, these results suggest that lags in chemical recovery may be temporary, and that greater chemical recovery is likely if declines in acidic deposition continue. Nevertheless, the specific mechanisms responsible for the lower decline in lake base cation concentrations relative to acidic anions require further study.

Author Contributions

S.A.W. conceived of the idea, M.C.E. processed the data and S.A.W. and M.C.E. interpreted the results and co-wrote the paper. All authors have read and agreed to the published version of the manuscript.

Funding

This research was funded by Natural Sciences and Engineering Research Council of Canada grant number 311790-2011 to S.A.W.

Acknowledgments

The authors would like to thank the staff at the Dorset Environmental Research Centre for the provision of data and, in particular, Andrew Paterson and Huaxia Yao for ongoing collaboration on various projects related to surface-water quality and quantity in the Muskoka–Haliburton region.

Conflicts of Interest

The authors declare no conflict of interest.

References

  1. Driscoll, C.T.; Driscoll, K.M.; Fakhraei, H.; Civerolo, K. Long-term temporal trends and spatial patterns in the acid-base chemistry of lakes of the Adirondacks region of New York in response to decreases in acid deposition. Atmos. Environ. 2016, 146, 5–14. [Google Scholar] [CrossRef] [Green Version]
  2. Futter, M.N.; Valinia, S.; Löfgren, S.; Köhler, S.J.; Fölster, J. Long-term trends in water chemistry of acid-sensitive Swedish lakes show slow recovery from historic acidification. Ambio 2015, 43, 77–90. [Google Scholar] [CrossRef] [Green Version]
  3. Watmough, S.A.; Dillon, P.J. Base cation and nitrogen budgets for seven forested catchments in central Ontario, 1983–1999. For. Ecol. Manag. 2003, 177, 155–177. [Google Scholar] [CrossRef]
  4. Keller, W.; Heneberry, J.; Edwards, B.A. Recovery of acidified Sudbury, Ontario, Canada, lakes: A multi-decade synthesis and update. Environ. Rev. 2019, 27, 1–16. [Google Scholar] [CrossRef]
  5. Garmo, O.G.; Skjelkvåle, B.L.; de Wit, H.A.; Colombo, L.; Curtis, C.; Fölster, J.; Hoffmann, A.; Hruška, J.; Høgåsen, T.; Jeffries, D.S.; et al. Trends in surface water chemistry in acidified areas in Europe and North America from 1990 to 2008. Wat. Air Soil Pollut. 2014, 225, 1880. [Google Scholar] [CrossRef] [Green Version]
  6. Monteith, D.T.; Stoddard, J.L.; Evans, C.D.; de Wit, H.A.; Forsius, M.; Høgåsen, T.; Vesely, J. Dissolved organic carbon trends resulting from changes in atmospheric deposition chemistry. Nature 2007, 450, 537–540. [Google Scholar] [CrossRef] [PubMed]
  7. Skjelkvåle, B.L.; Stoddard, J.L.; Jeffries, D.S.; Tørseth, K.; Høgåsen, T.; Bowman, J.; Mannio, J.; Monteith, D.T.; Mosello, R.; Rogora, M.; et al. Regional scale evidence for improvements in surface water chemistry 1990–2001. Environ. Pollut. 2005, 137, 165–176. [Google Scholar] [CrossRef] [Green Version]
  8. Mitchell, M.J.; Lovett, G.; Bailey, S.; Beall, F.; Burns, D.; Buso, D.; Clair, T.A.; Courchesne, F.; Duchesne, L.; Eimers, C.; et al. Comparisons of Watershed Sulfur Budgets in Southeast Canada and Northeast Us: New Approaches and Implications. Biogeochemistry 2011, 103, 181–207. [Google Scholar] [CrossRef]
  9. Eimers, M.C.; Dillon, P.J. Climate effects on sulphate flux from forested catchments in south-central Ontario. Biogeochemistry 2002, 61, 337–355. [Google Scholar] [CrossRef]
  10. Stoddard, J.L.; Jeffries, D.S.; Lukewille, A.; Clair, T.A.; Dillon, P.J.; Driscoll, C.T.; Forsius, M.; Johnannessen, M.; Kahl, J.S.; Kellogg, J.H.; et al. Regional trends in aquatic recovery from acidification in North America and Europe. Nature 1999, 401, 575–578. [Google Scholar] [CrossRef]
  11. Watmough, S.A.; Eimers, M.C.; Baker, S. Impediments to recovery from acid deposition. Atmos. Environ. 2016, 146, 15–27. [Google Scholar] [CrossRef] [Green Version]
  12. Evans, C.D.; Chapman, P.J.; Clark, J.M.; Monteith, D.T.; Cresser, M.S. Alternative explanations for rising dissolved organic carbon export from organic soils. Glob. Chang. Biol. 2006, 12, 2044–2053. [Google Scholar] [CrossRef]
  13. Beamish, R.J.; Harvey, H.H. Acidification of the La Cloche Mountain lakes, Ontario and resulting fish mortalities. J. Fish. Res. Board Can. 1972, 29, 1131–1143. [Google Scholar] [CrossRef]
  14. Dillon, P.J.; Reid, R.A.; de Grosbois, E. The rate of acidification of aquatic ecosystems in Ontario, Canada. Nature 1987, 329, 45–48. [Google Scholar] [CrossRef]
  15. Vet, R.; Artz, R.S.; Carou, S.; Shaw, M.; Ro, C.; Aas, W.; Baker, A.; Bowersox, V.; Dentener, F.; Galy-Lacaux, C.; et al. A global assessment of precipitation chemistry and deposition of sulfur, nitrogen, sea salt, base cations, organic acids, acidity and pH, and phosphorus. Atmos. Environ. 2014, 93, 3–100. [Google Scholar] [CrossRef]
  16. Dillon, P.J.; Evans, R.D. Long-term changes in the chemistry of a soft-water lake under changing acid deposition rates and climatic fluctuations. Verh. Internat. Veren. Limnol. 2000, 27, 2615–2619. [Google Scholar]
  17. Jeffries, D.S.; Clair, T.C.; Couture, S.; Dillon, P.J.; Dupont, J.; Keller, W.; McNicol, D.K.; Turner, M.A.; Vet, R.; Weeber, R. Assessing the recovery of lakes in southeastern Canada from the effects of acid deposition. Ambio 2003, 32, 176–182. [Google Scholar] [CrossRef] [PubMed]
  18. Palmer, M.E.; Yan, N.D.; Paterson, A.M.; Girard, R.D. Water quality changes in south-central Ontario lakes and the role of local factors in regulating lake response to regional stressors. Can. J. Fish. Aquat. Sci. 2011, 68, 1038–1050. [Google Scholar] [CrossRef]
  19. Eimers, M.C.; Watmough, S.A.; Buttle, J.M.; Dillon, P.J. Examination of the potential relationship between droughts, sulphate and dissolved organic carbon at a wetland-draining stream. Glob. Chang. Biol. 2008, 14, 938–948. [Google Scholar] [CrossRef]
  20. Aas, W.; Mortier, A.; Bowersox, V.; Cherian, R.; Faluvegi, G.; Fagerli, H.; Hand, J.; Klimont, Z.; Galy-Lacaux, C.; Lehmann, C.M.B.; et al. Global and regional trends of atmospheric sulfur. Sci. Rep. 2019, 9, 953. [Google Scholar] [CrossRef]
  21. Soil Classification Working Group. The Canadian System of Soil Classification, 3rd ed.; NRC Research Press: Ottawa, ON, Canada, 1998; pp. 53–60. [Google Scholar]
  22. Ahrens, C.D. Meteorology Today: An Introduction to Weather, Climate, and the Environment; West Publishing Company: St. Paul, MN, USA, 1991; ISBN 0314809058. [Google Scholar]
  23. Scheider, W.A.; Snyder, W.R.; Clark, B. Deposition of nutrients and major ions by precipitation in south-central Ontario. Wat. Air Soil Pollut. 1979, 12, 171–185. [Google Scholar] [CrossRef]
  24. Ontario Ministry of Environment. Handbook of Analytical Methods for Environmental Samples; Ontario Ministry of Environment, Lab Services Branch: Toronto, ON, Canada, 1983; p. 682. [Google Scholar]
  25. Dillon, P.J.; Molot, L.A. Dissolved organic and inorganic carbon mass balances in central Ontario lakes. Biogeochemistry 1997, 36, 29–42. [Google Scholar] [CrossRef]
  26. Oliver, B.G.; Thurman, E.M.; Malcolm, R.L. The contribution of humic substances to the acidity of colored natural waters. Geochim. Cosmochim. Acta 1983, 47, 2031–2035. [Google Scholar] [CrossRef]
  27. Hirsch, R.M.; Slack, J.R. A nonparametric trend test for seasonal data with serial dependence. Water Resour. Res. 1984, 20, 727–732. [Google Scholar] [CrossRef] [Green Version]
  28. Dillon, P.J.; Somers, K.M.; Findeis, J.; Eimers, M.C. Coherent response of lakes in Ontario, Canada to reductions in sulphur deposition: The effects of climate on sulphate concentrations. Hydrol. Earth Syst. Sci. 2003, 7, 583–595. [Google Scholar] [CrossRef]
  29. Kerr, J.G.; Eimers, M.C.; Creed, I.F.; Adams, M.B.; Beall, F.; Burns, D.; Campbell, J.L.; Christopher, S.F.; Clair, T.A.; Courchesne, F.; et al. The effect of seasonal drying on sulphate dynamics in streams across southeastern Canada and the northeastern USA. Biogeochemistry 2012, 111, 393–409. [Google Scholar] [CrossRef]
  30. Laudon, H.; Dillon, P.J.; Eimers, M.C.; Semkin, R.G.; Jeffries, D.S. Climate-induced episodic acidification of streams in central Ontario. Environ. Sci. Technol. 2004, 38, 5015–6009. [Google Scholar] [CrossRef]
  31. Ashforth, D.; Yan, N.D. The interactive effects of Ca concentration and temperature on the survival and reproduction of Daphnia pulex at low and high food concentrations. Limnol. Oceanogr. 2008, 53, 420–432. [Google Scholar] [CrossRef] [Green Version]
  32. Jeziorski, A.; Tanentzap, A.J.; Yan, N.D.; Paterson, A.M.; Palmer, M.E.; Korosi, J.B.; Rusak, J.A.; Arts, M.T.; Keller, W.B.; Ingram, R.; et al. The jellification of north temperate lakes. Proc. R. Soc. B Biol. Sci. 2014, 282, 20142449. [Google Scholar] [CrossRef]
  33. Tan, Q.; Wang, W. Interspecies differences in calcium content and requirement in four freshwater cladocerans explained by biokinetic parameters. Limnol. Oceanogr. 2010, 55, 1426–1434. [Google Scholar] [CrossRef]
  34. Strock, K.E.; Nelson, S.J.; Kahl, J.S.; Saros, J.E.; McDowell, W.H. Decadal trends reveal recent acceleration in the rate of recovery from acidification in the northeastern US. Environ. Sci. Tech. 2015, 48, 4681–4689. [Google Scholar] [CrossRef]
  35. Clair, T.A.; Dennis, I.F.; Vet, R. Water chemistry and dissolved organic carbon trends in lakes from Canada’s Atlantic Provinces: No recovery from acidification measured after 25 years of lake monitoring. Can. J. Fish. Aquat. Sci. 2011, 68, 663–674. [Google Scholar] [CrossRef]
  36. Lawrence, G.B.; Hazlett, P.W.; Fernandez, I.J.; Ouimet, R.; Bailey, S.W.; Shortle, W.C.; Smith, K.T.; Antidormi, M.R. Declining acidic deposition begins reversal of forest-soil acidification in the northeastern US and eastern Canada. Environ. Sci. Technol. 2015, 49, 13103–13111. [Google Scholar] [CrossRef] [PubMed]
  37. Kirchner, J.W.; Dillon, P.J.; LaZerte, B.D. Predicted response of stream chemistry to acid loading tested in Canadian catchments. Nature 1992, 358, 478–482. [Google Scholar] [CrossRef]
  38. Bottomley, D.J.; Craig, D.; Johnston, L.M. Neutralization of acid runoff by groundwater discharge to streams in Canadian Precambrian Shield watersheds. J. Hydrol. 1984, 75, 1–26. [Google Scholar] [CrossRef]
  39. Kirschbaum, M.U.F. The temperature-dependence of soil organic matter decomposition, and the effect of global warming on soil organic C storage. Soil Biol. Biochem. 1995, 27, 753–760. [Google Scholar] [CrossRef]
  40. Knorr, W.; Prentice, I.C.; House, J.I.; Holland, E.A. Long-term sensitivity of soil carbon turnover to warming. Nature 2005, 433, 298–301. [Google Scholar] [CrossRef]
  41. Klaminder, J.; Grip, H.; Morth, C.M.; Laudon, H. Carbon mineralization and pyrite oxidation in groundwater: Importance for silicate weathering in boreal forest soils and stream base-flow chemistry. Appl. Geochem. 2011, 26, 319–324. [Google Scholar] [CrossRef]
  42. Hedin, L.O.; Granat, L.; Likens, G.E.; Buishand, T.A.; Galloway, J.N.; Butler, T.J.; Rodhe, H. Steep declines in atmospheric base cations in regions of Europe and North America. Nature 1994, 367, 351–354. [Google Scholar] [CrossRef]
  43. Yao, H.; McConnell, C.; Somers, K.M.; Yan, N.D.; Watmough, S.; Scheider, W. Nearshore human interventions reverse patterns of decline in lake calcium budgets in central Ontario as demonstrated by mass-balance analyses. Water Resour. Res. 2011, 47, 1–13. [Google Scholar] [CrossRef] [Green Version]
  44. Reid, C.; Watmough, S.A. Spatial patterns, trends and the potential long-term impacts of tree harvesting on lake calcium levels in the Muskoka River Watershed, Ontario, Canada. Can. J. Fish. Aquat. Sci. 2016, 73, 382–393. [Google Scholar] [CrossRef]
Figure 1. Location of the seven study lakes in south–central Ontario. Stars indicate the location of the three bulk deposition monitoring stations.
Soilsystems 04 00010 g001
Figure 2. Bulk deposition of nitrate-N, sulphate, sum of base cations (Ca + Mg + K + Na) and pH between 1980 and 2017 in the study region.
Soilsystems 04 00010 g002
Figure 3. Change in volume-weighted sulphate (A), pH (B), alkalinity (C) and total organic carbon (D) in the seven study lakes between 1982 and 2015. The mean value of the seven lakes is shown as a solid black line.
Soilsystems 04 00010 g003
Figure 4. Mean values of the sum of strong acid anions (SO4 + NO3 + Cl), base cations and calculated organic acidity in the seven study lakes (A), and mean Gran alkalinity, charge balance acid neutralizing capacity (ANC) and organic acid adjusted ANC (B), between 1982 and 2015, in the seven study lakes.
Soilsystems 04 00010 g004
Table 1. Trends in bulk deposition chemistry. Asterisks indicate significance; *** < 0.001 ** < 0.05 * <0.1.
1982–2015 (n = 34)1982–2005 (n = 24)2005–2015 (n = 11)
SO4 (meq m−2 yr−1)− 1.32 ***− 1.35 ***− 2.08 **
NO3 (meq m−2 yr−1)− 0.64 ***− 0.42 **− 0.58 (not sig)
pH+ 0.03 ***+ 0.01 ***+ 0.04 ***
Sum of base cations (meq m−2 yr−1)No trend− 0.22 *+ 2.02 **
Table 2. Sen’s slopes—medians of the seven lakes, ranges of slopes (in parentheses) and number of lakes with significant trends at p < 0.05.
Sen’s Slopes1982–2015 (n = 34)1982–2005 (n = 24)2005–2015 (n = 11)
SO4 (µeq L−1 yr−1)−2.4 (−2.0 to −2.9) 7/7−1.7 (−1.3 to −2.6) 7/7−5.0 (−3.8 to −6.5) 7/7
Gran Alk (µeq L−1 yr−1)0.38 (0.01 to 0.59) 5/70.26 (−0.17 to 0.43) 3/72.1 (1.5 to 2.9) 5/7
NO3-N (µeq L−1 yr−1)−0.03 (−0.04 to 0.07) 3/70.002 (−0.1 to 0.05) 0/70.09 (−0.01 to 0.16) 1/7
ANC (µeq L−1 yr−1)0.70 (0.23 to 1.0) 6/70.46 (−0.39 to 0.94) 4/72.3 (1.1 to 3.4) 5/7
pH (pH units yr−1)0.005 (0 to 0.01) 5/70.007 (0 to 0.01) 4/70.028 (0.02 to 0.05) 4/7
DOC (mg L−1 yr−1)0.025 (0.02 to 0.07) 7/70.027 (0 to 0.06) 6/70.020 (−0.02 to 0.06) 2/7
Org acid adj ANC (µeq L−1 yr−1)0.55 (0.17 to 0.97) 6/70.25 (−0.36 to 0.88) 4/72.3 (1.2 to 3.1) 5/7
Ca (µeq L−1 yr−1)−1.4 (−1.6 to −0.60) 7/7−1.0 (−1.3 to −0.38) 6/7−2.0 (−2.5 to −1.1) 5/7
SBC (µeq L−1 yr−1)−1.9 (−2.2 to −1.0) 7/7−1.5 (−1.8 to −0.6) 7/7−2.7 (−3.6 to −1.8) 6/7

