Impact of Drought and Changing Water Sources on Water Use and Soil Salinity of Almond and Pistachio Orchards: 1. Observations
Abstract
:1. Introduction
2. Materials and Methods
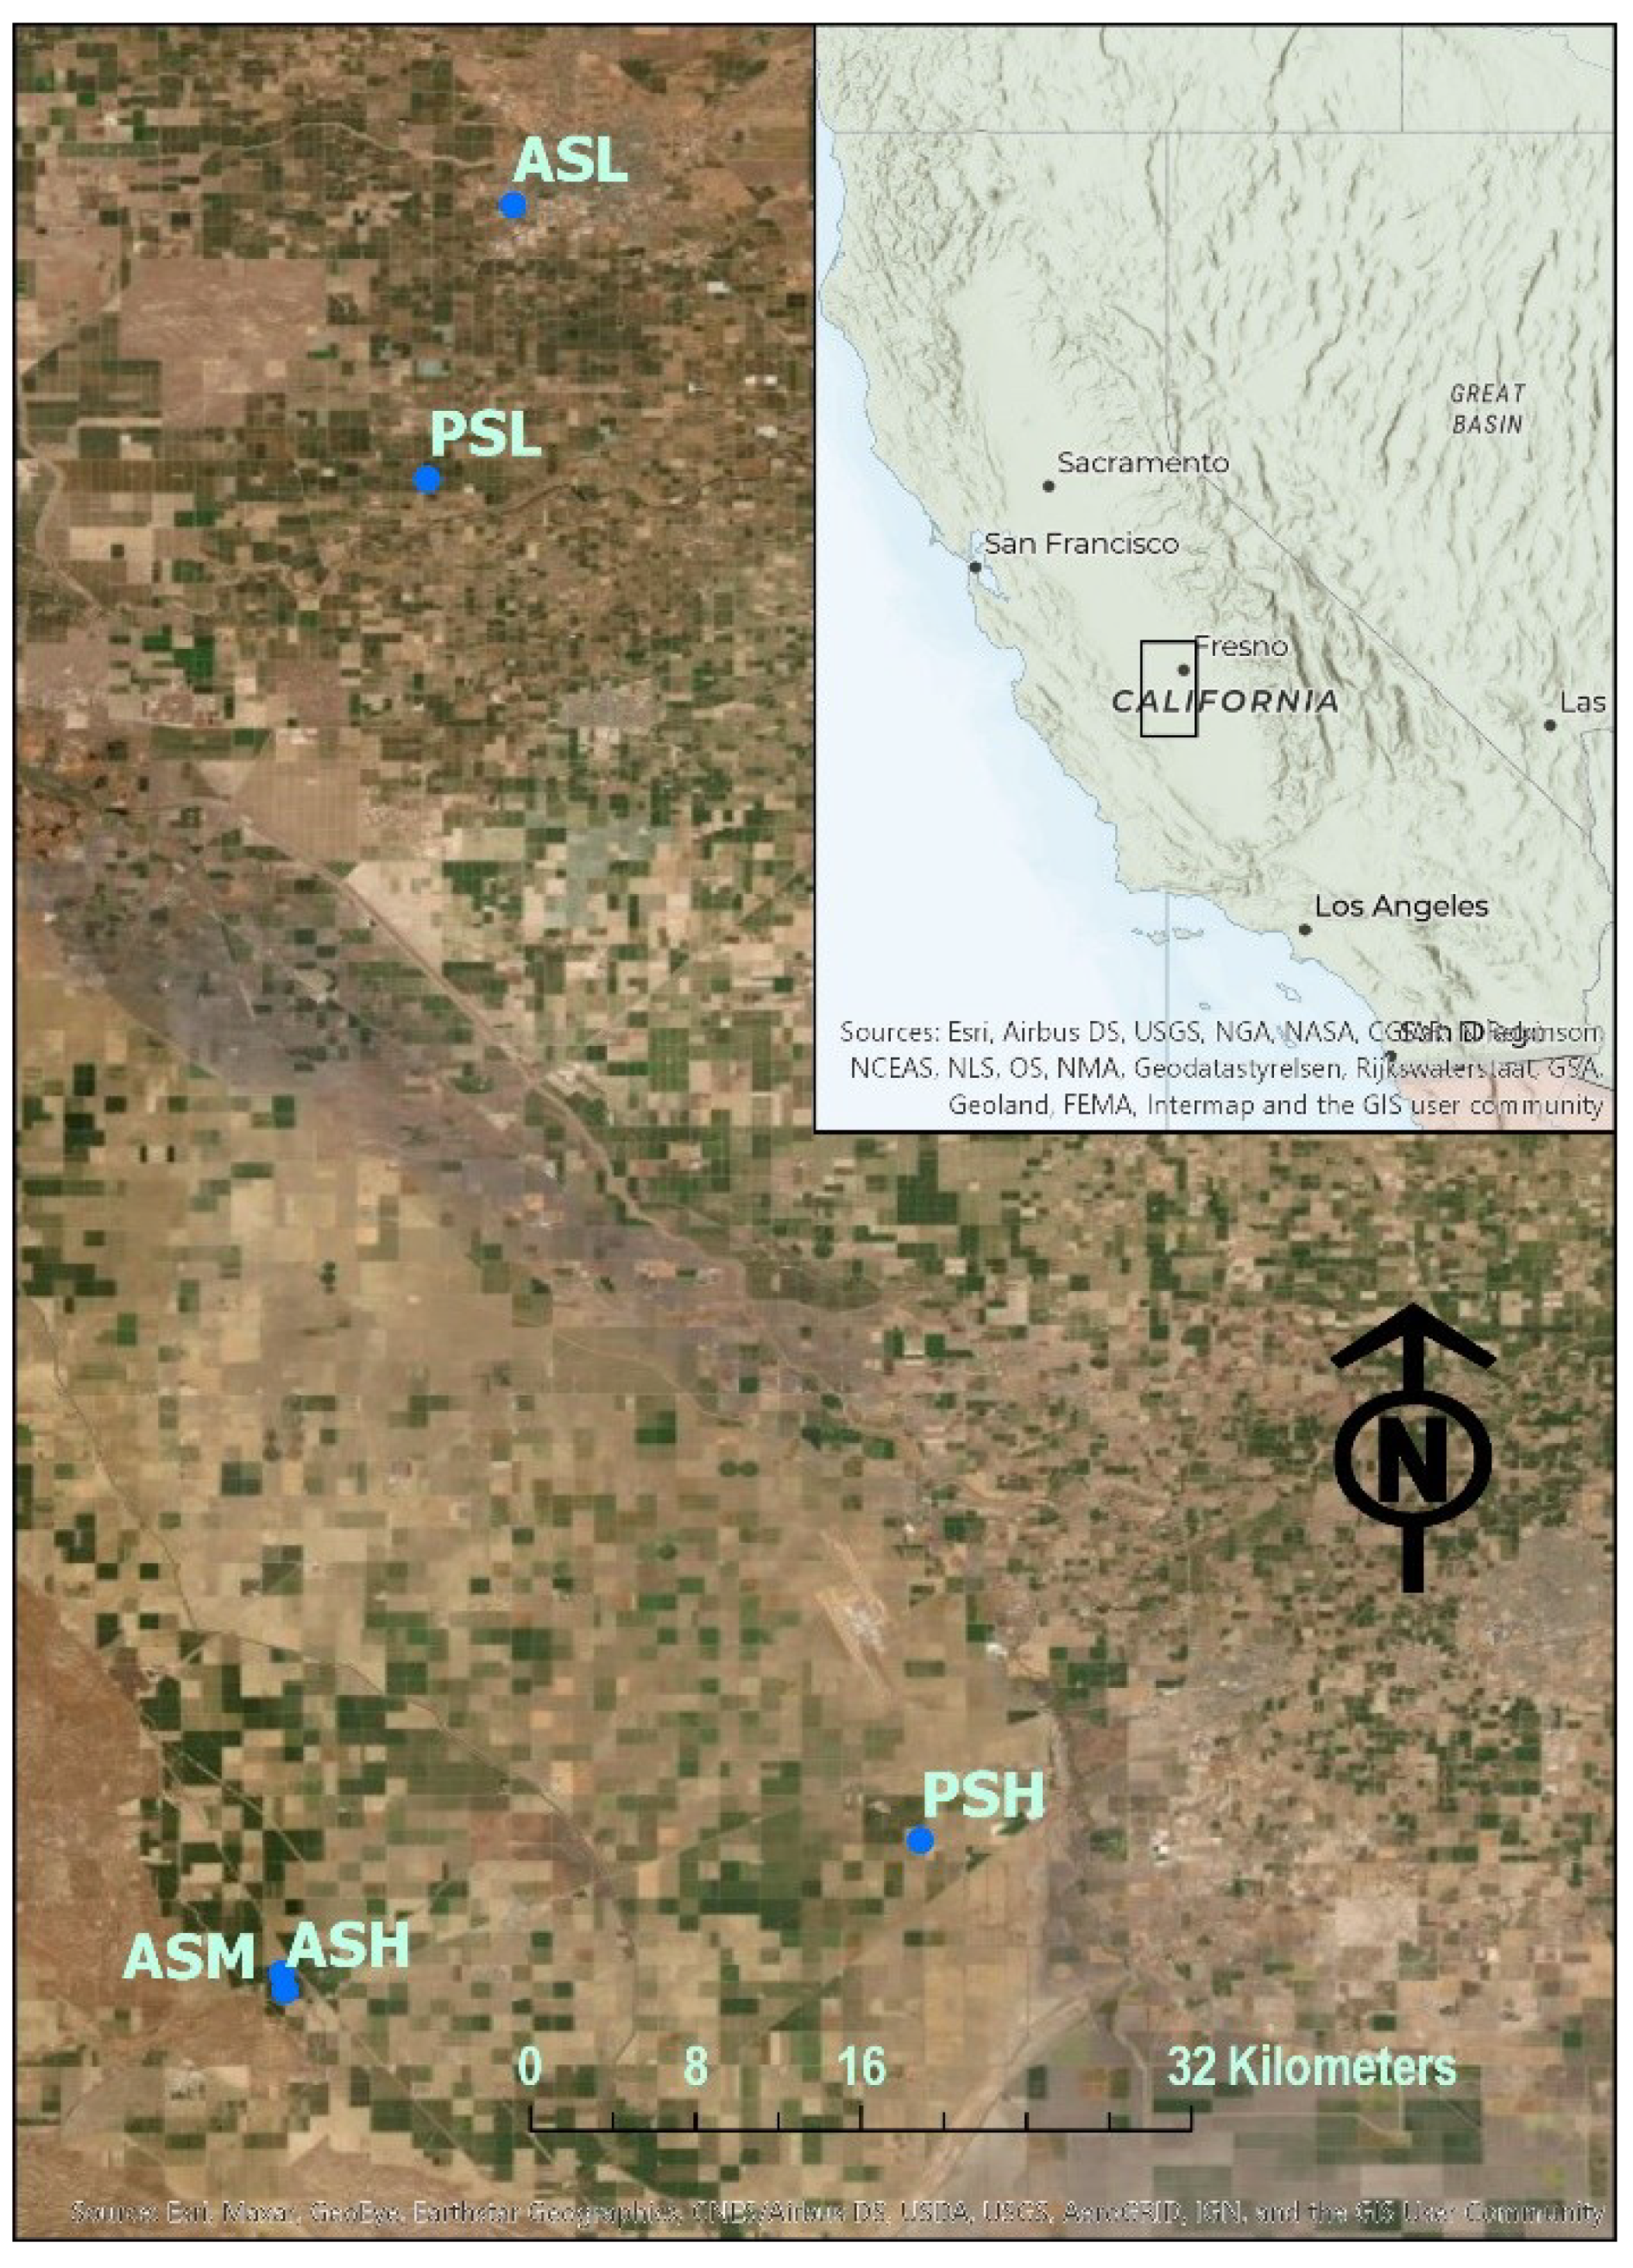
2.1. Field Sites
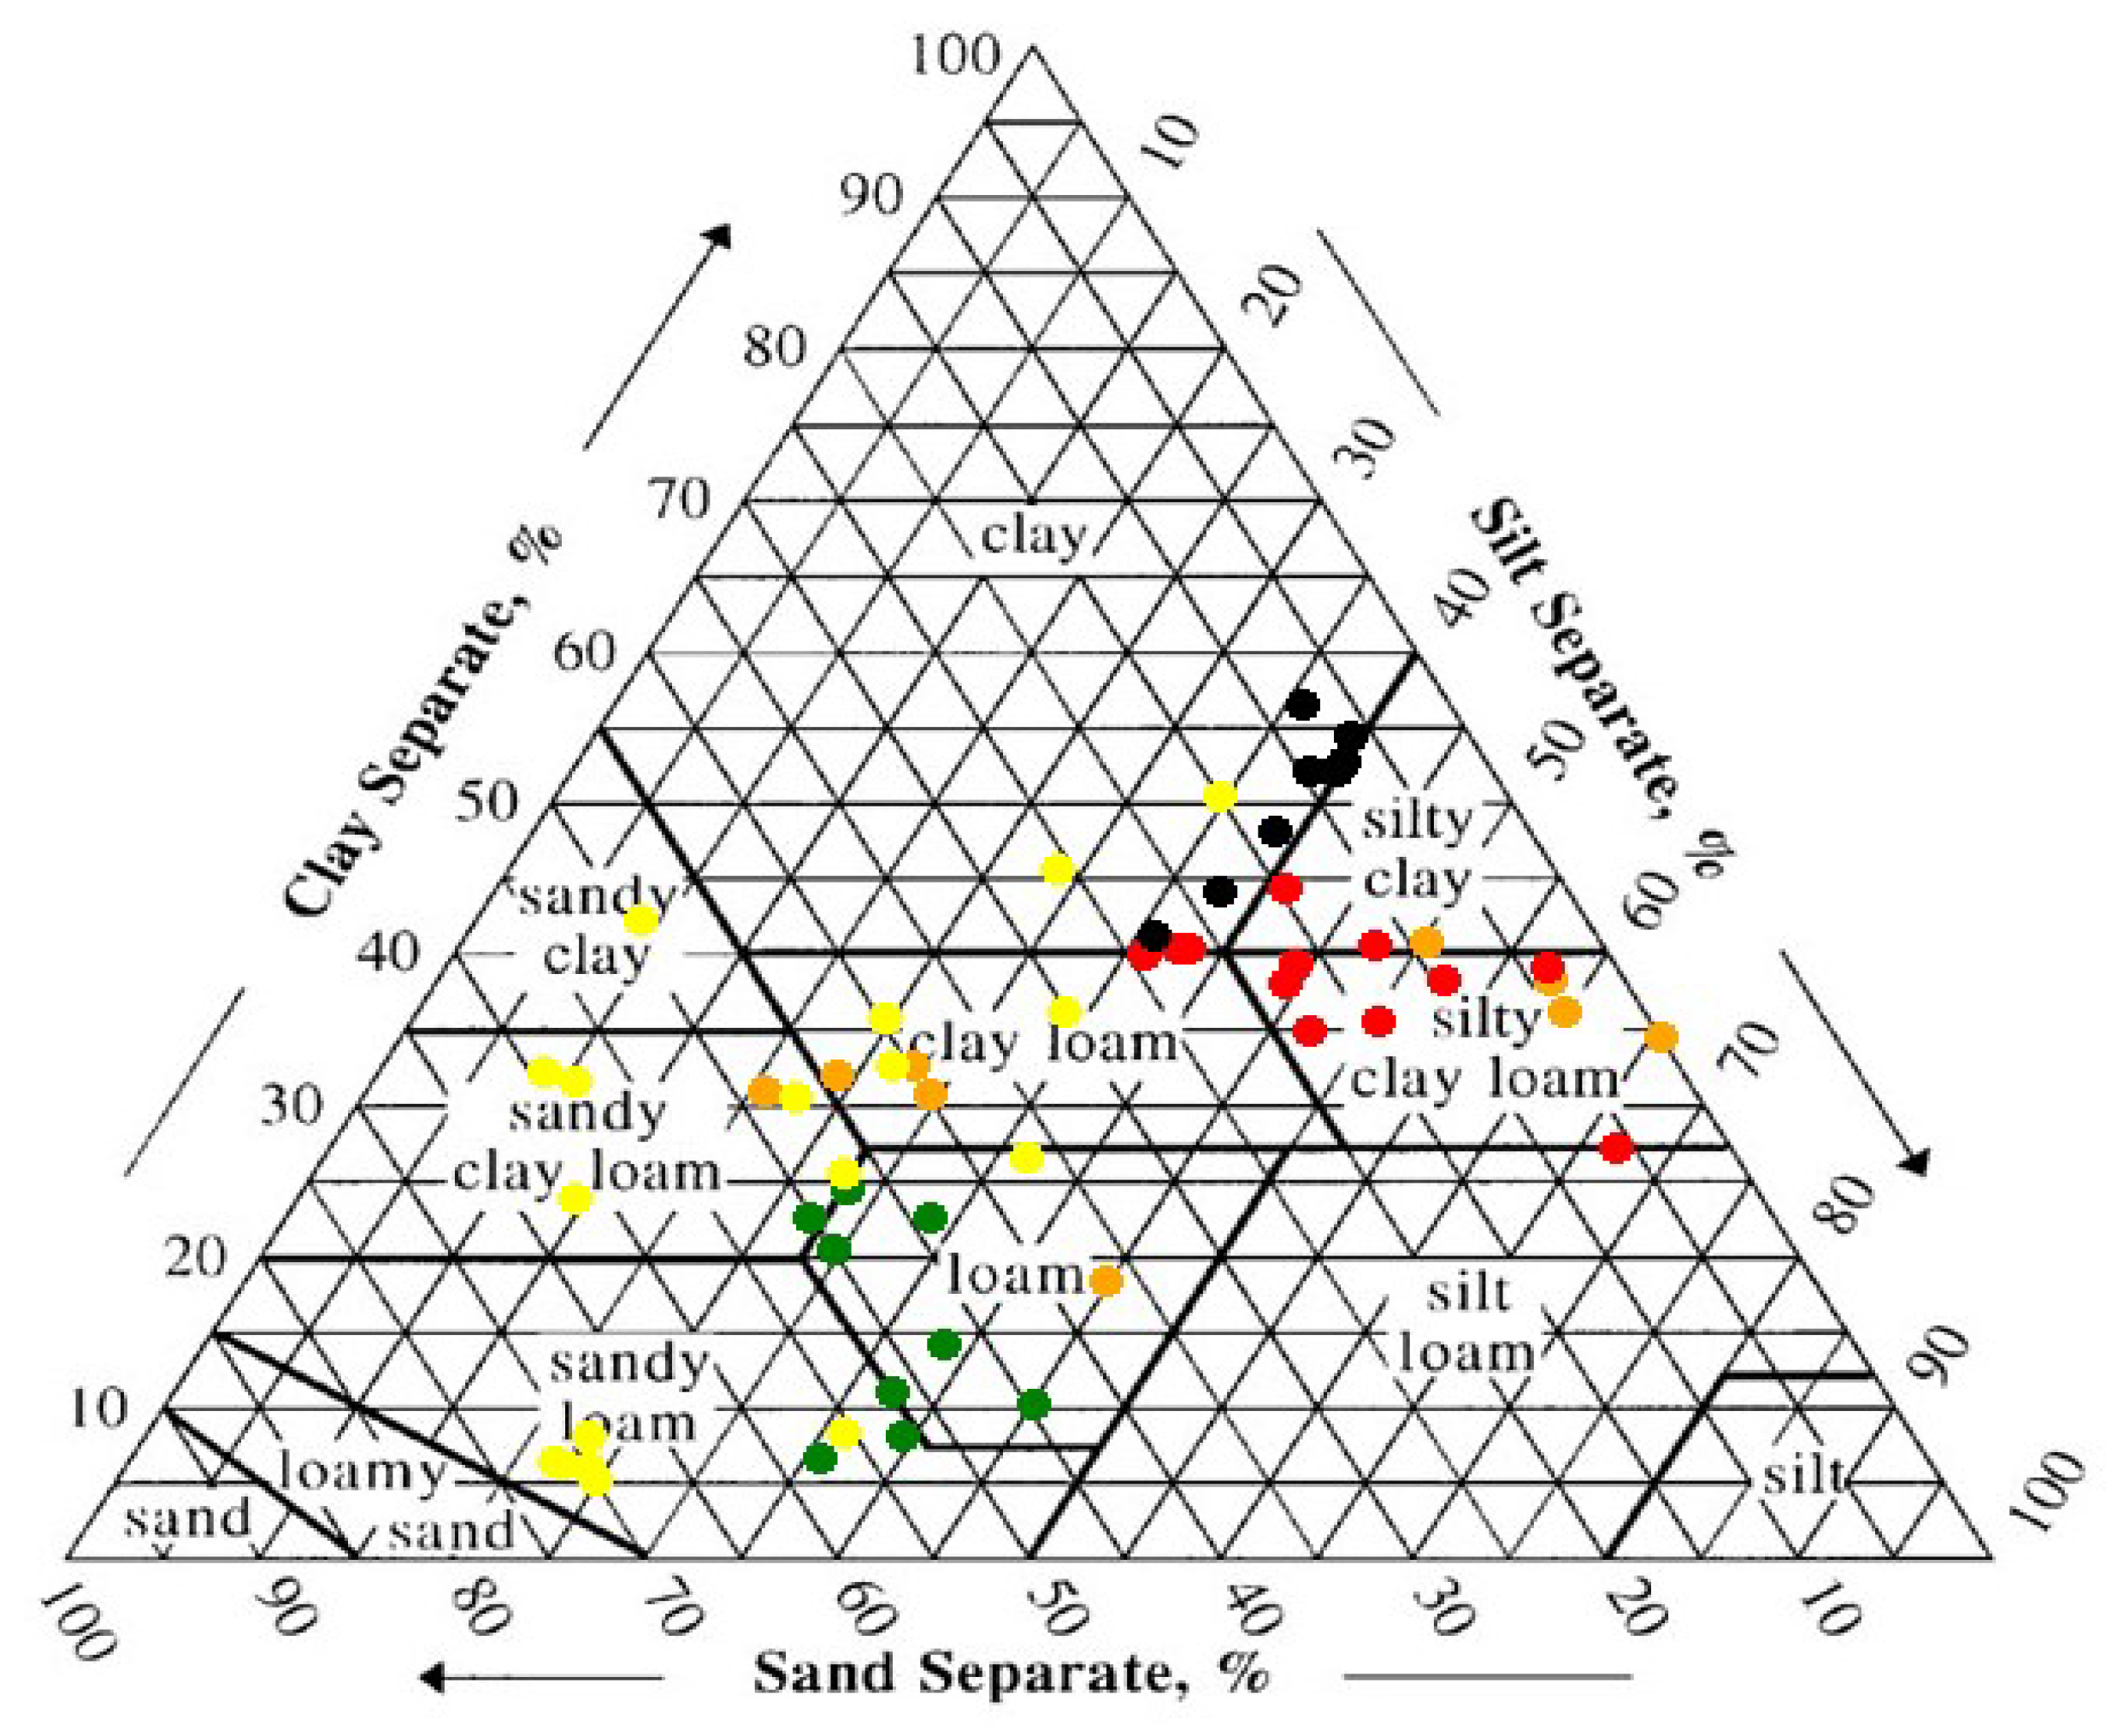
2.2. Soil Properties
2.3. Meteorological, Evapotranspiration, and Irrigation Data
2.4. Soil Moisture, Salinity, and Statistical Analysis
3. Results
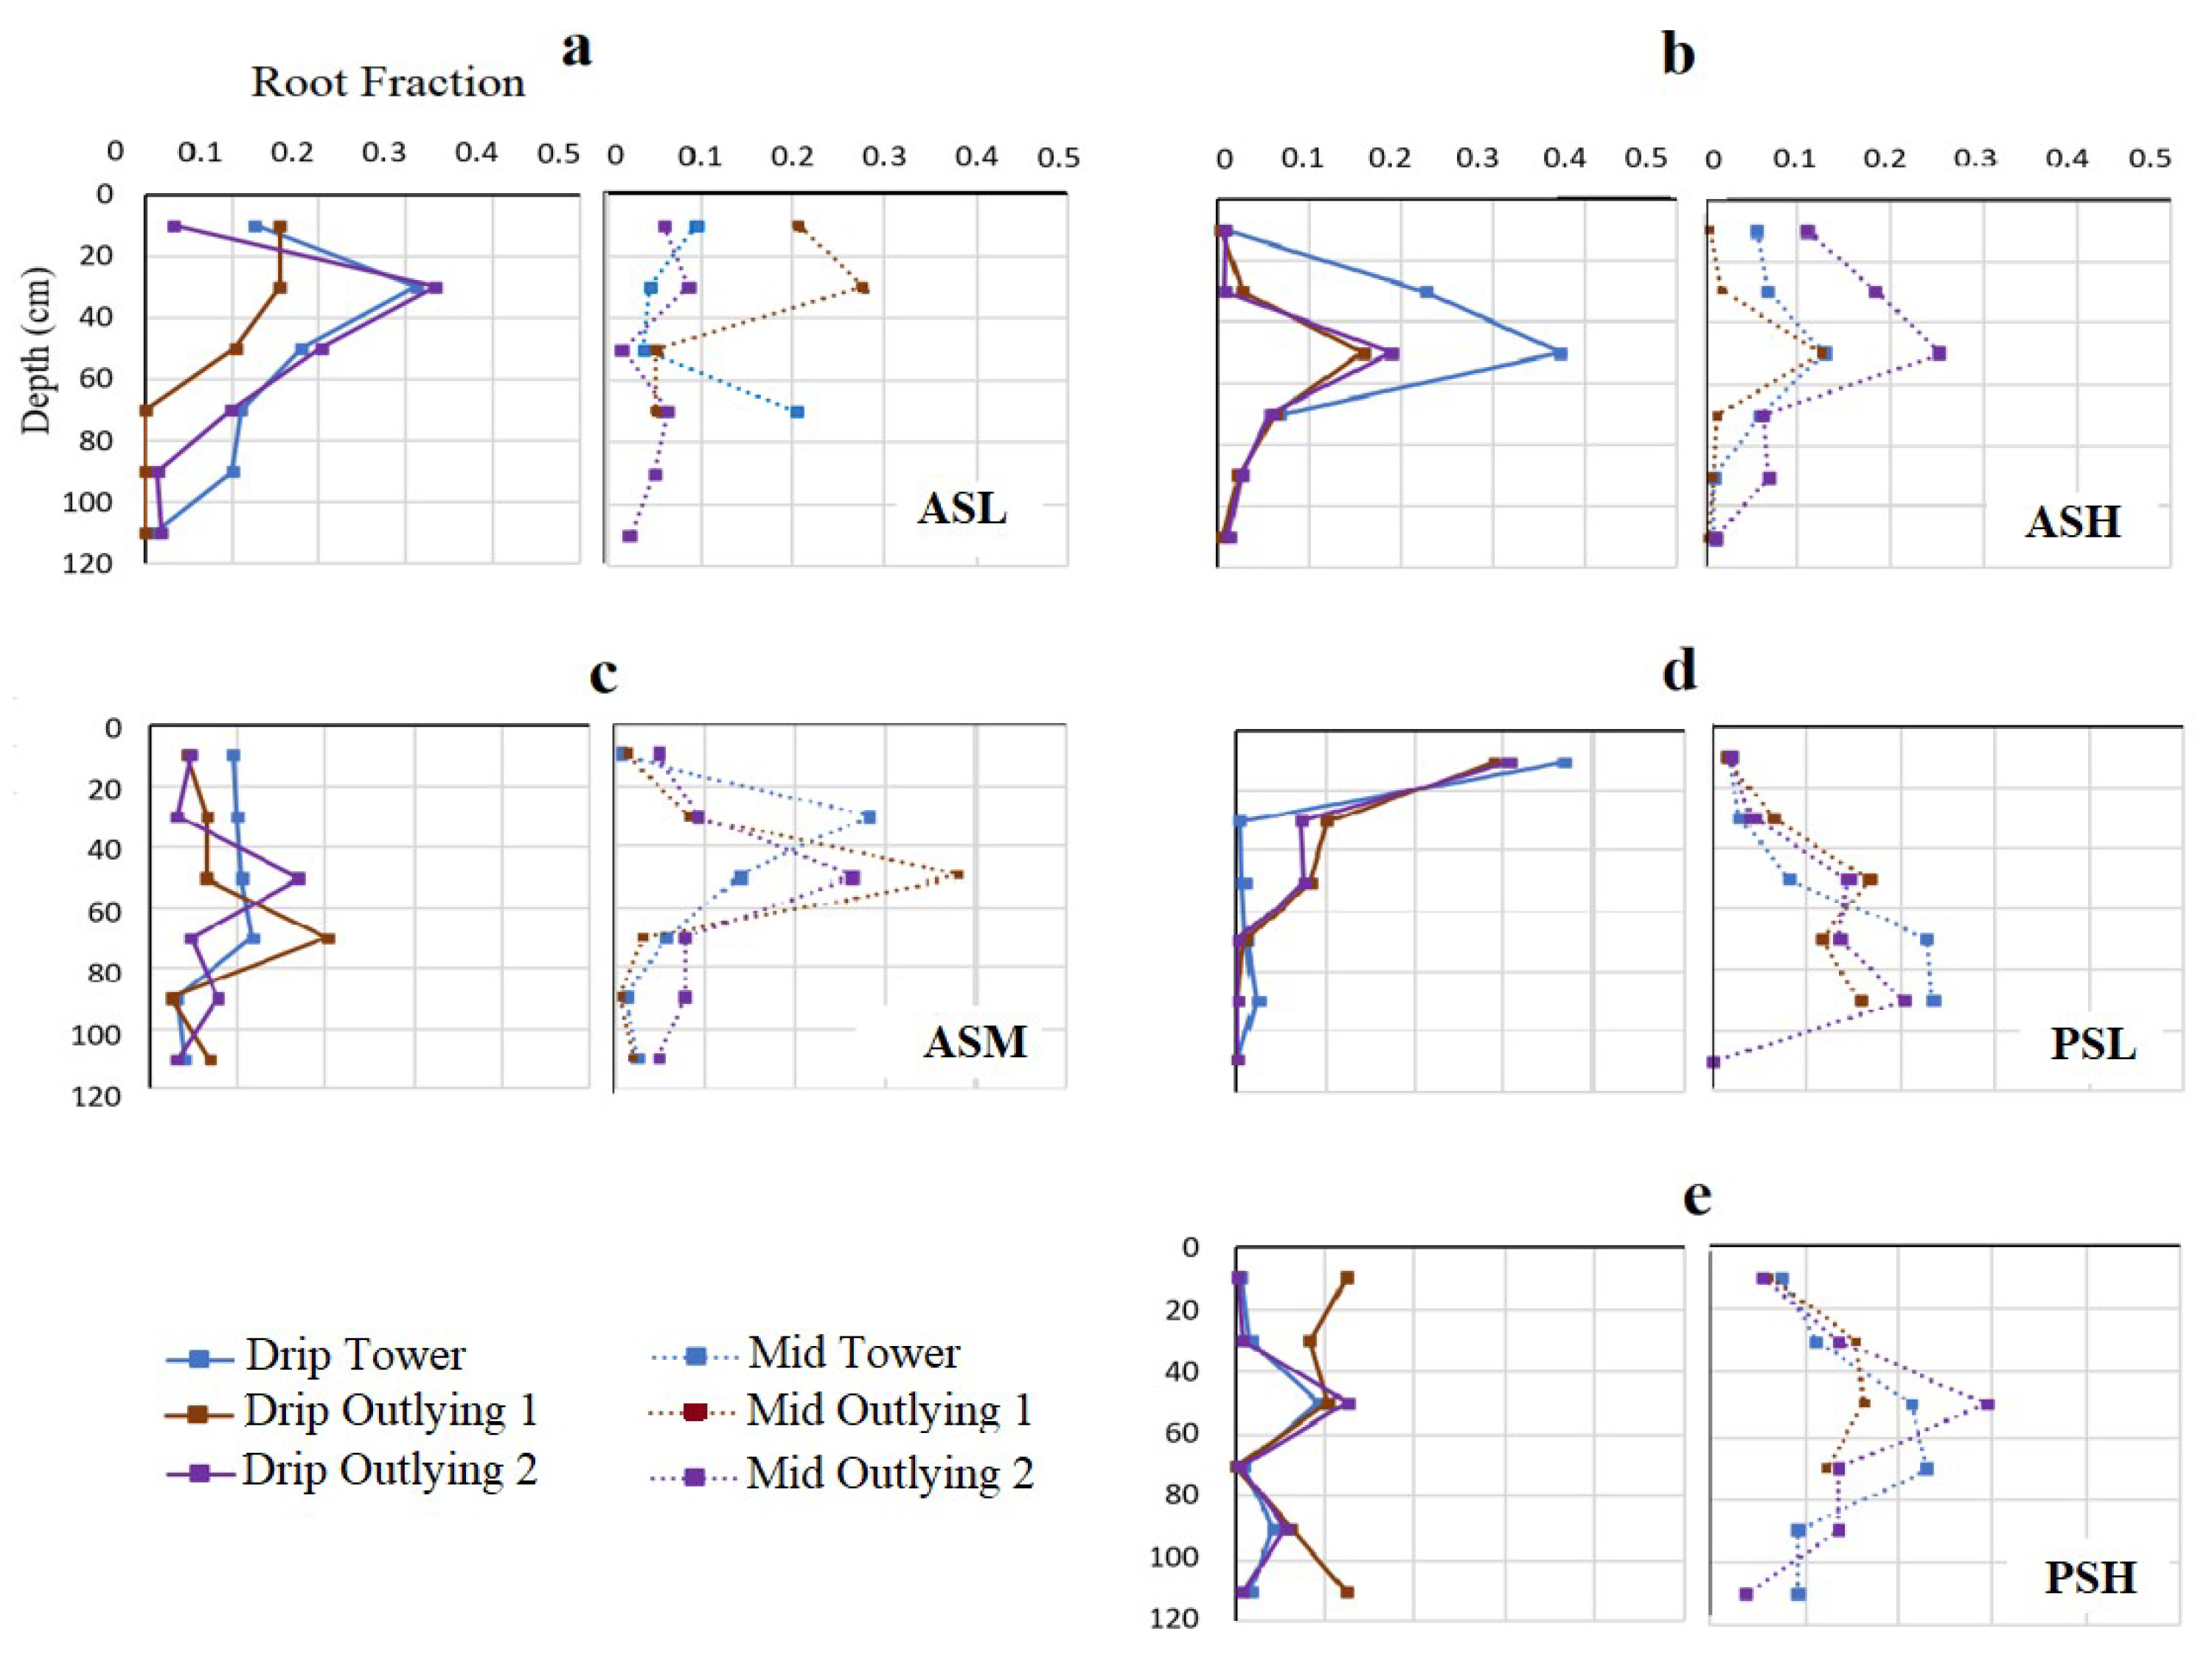
3.1. Soil Properties and Root Distribution
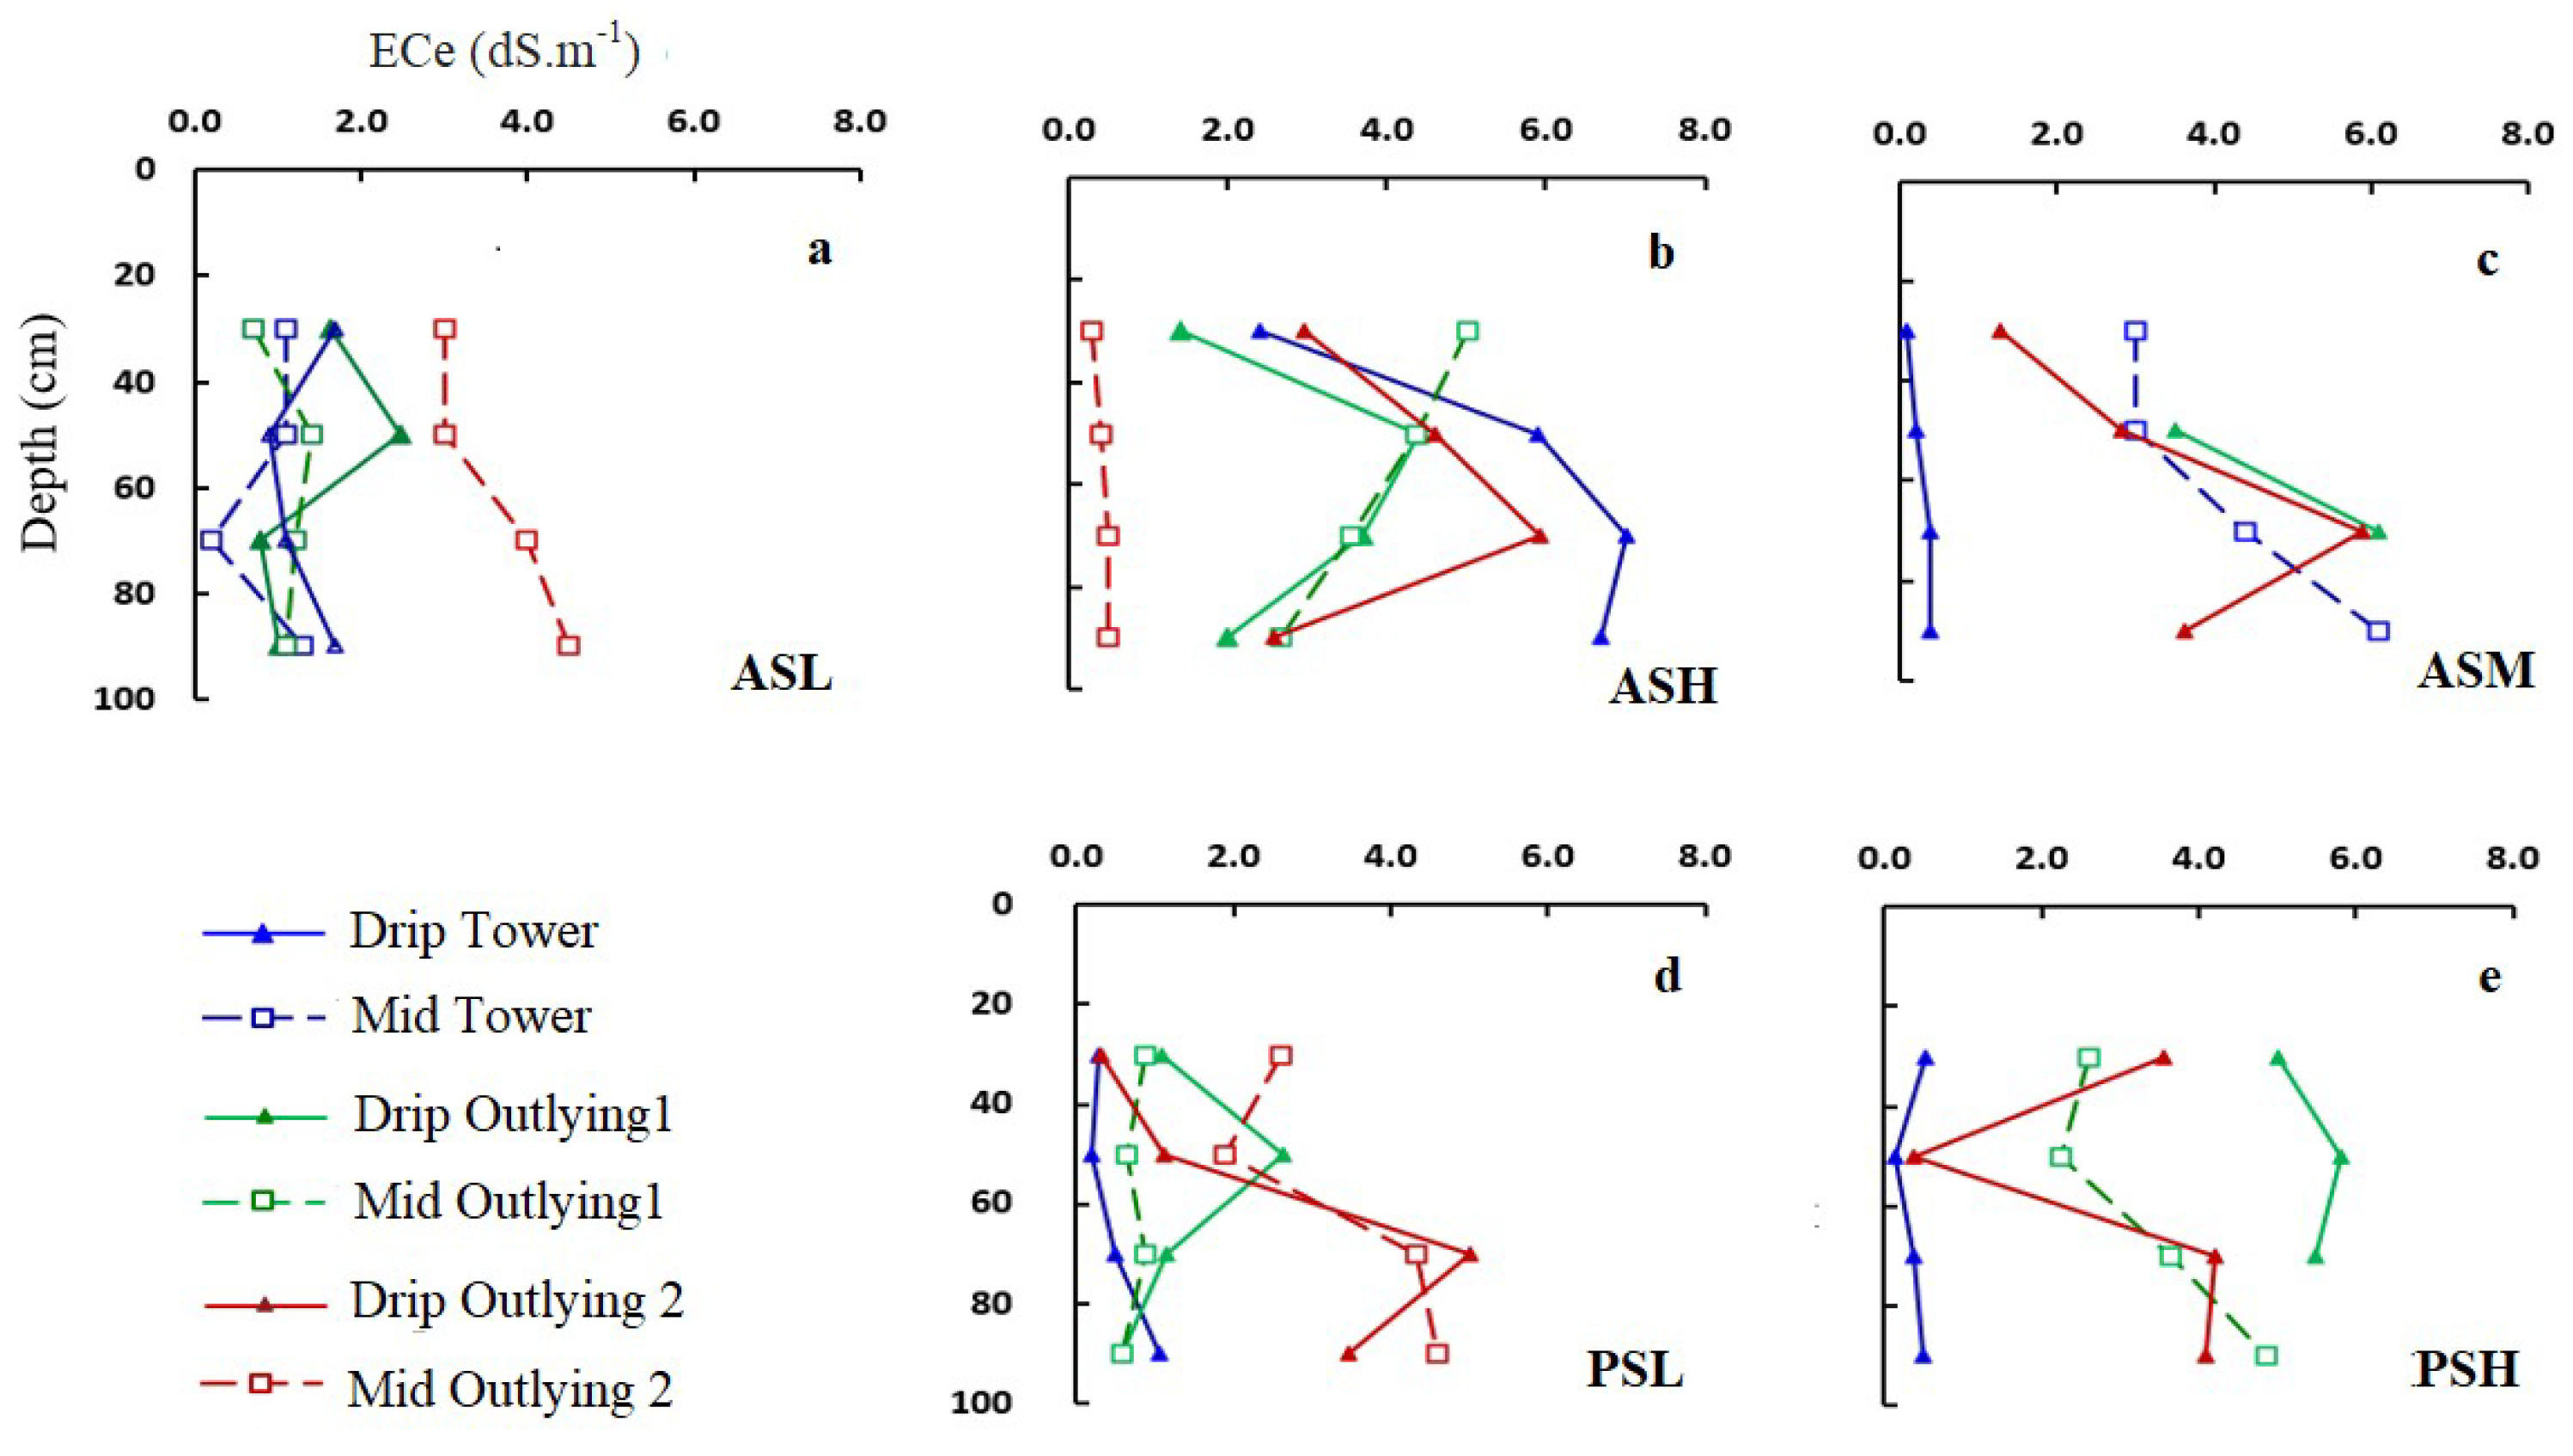
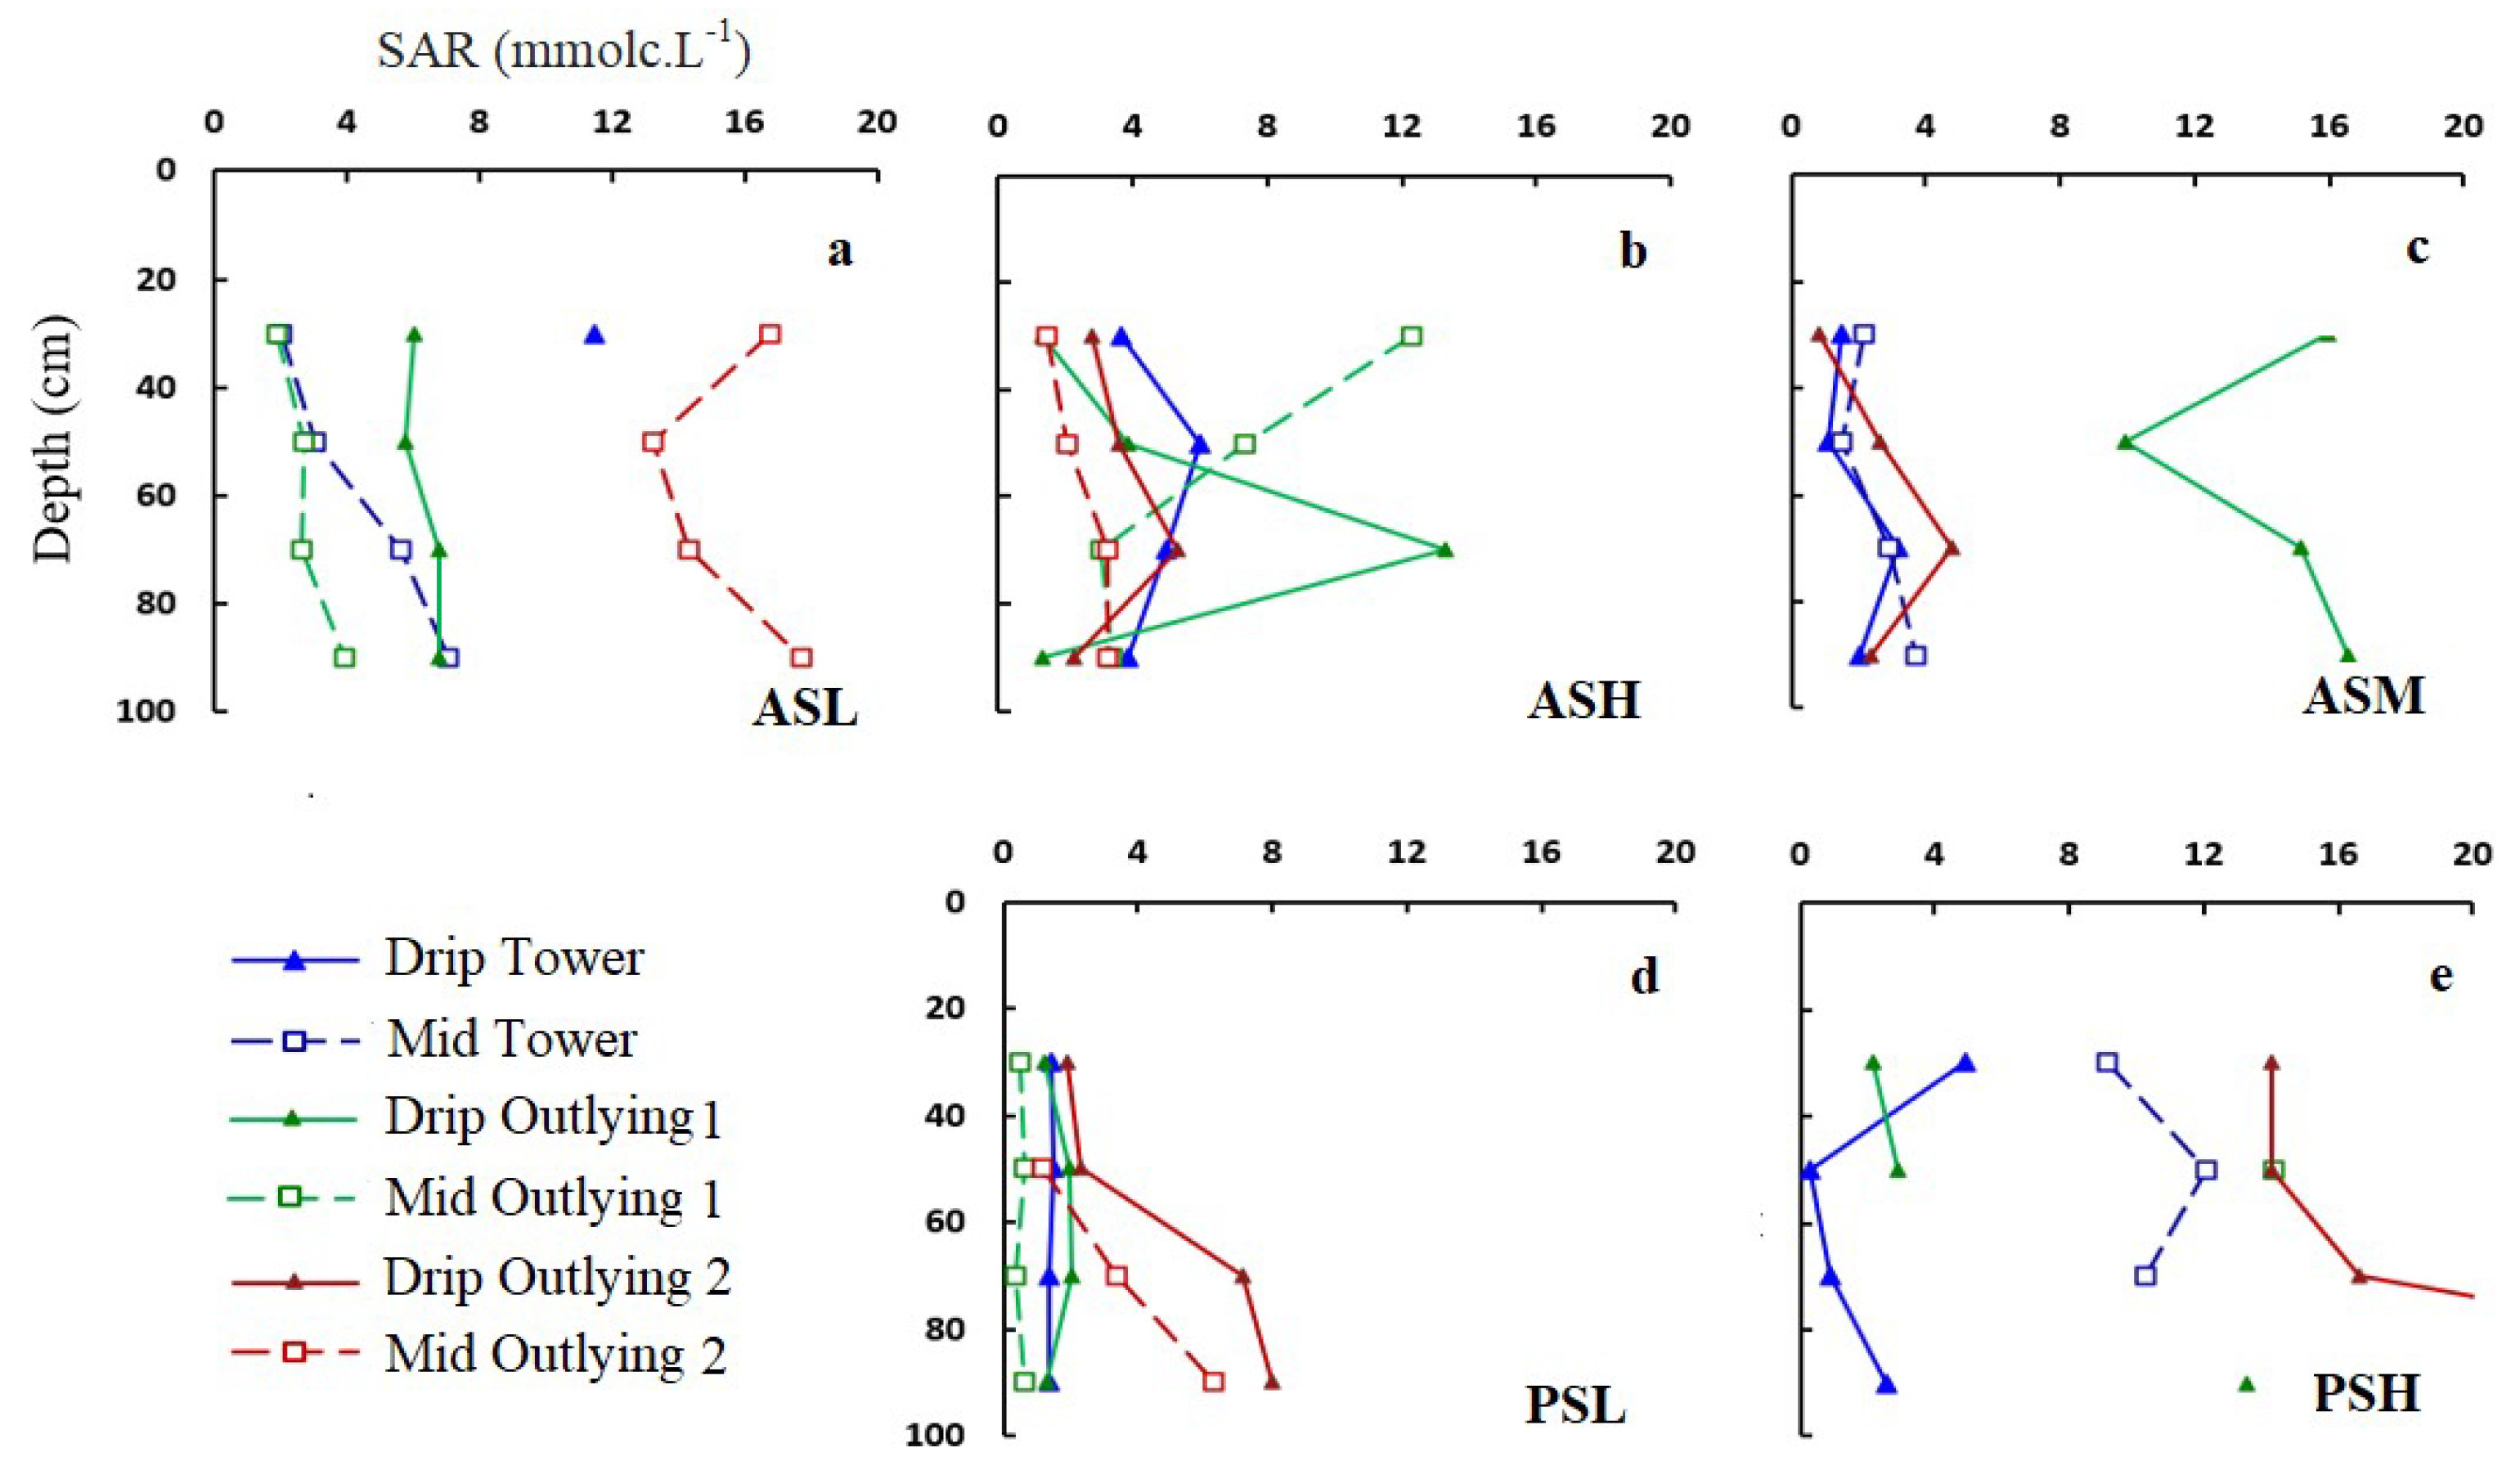
3.2. Soil Salinity and Root Distribution
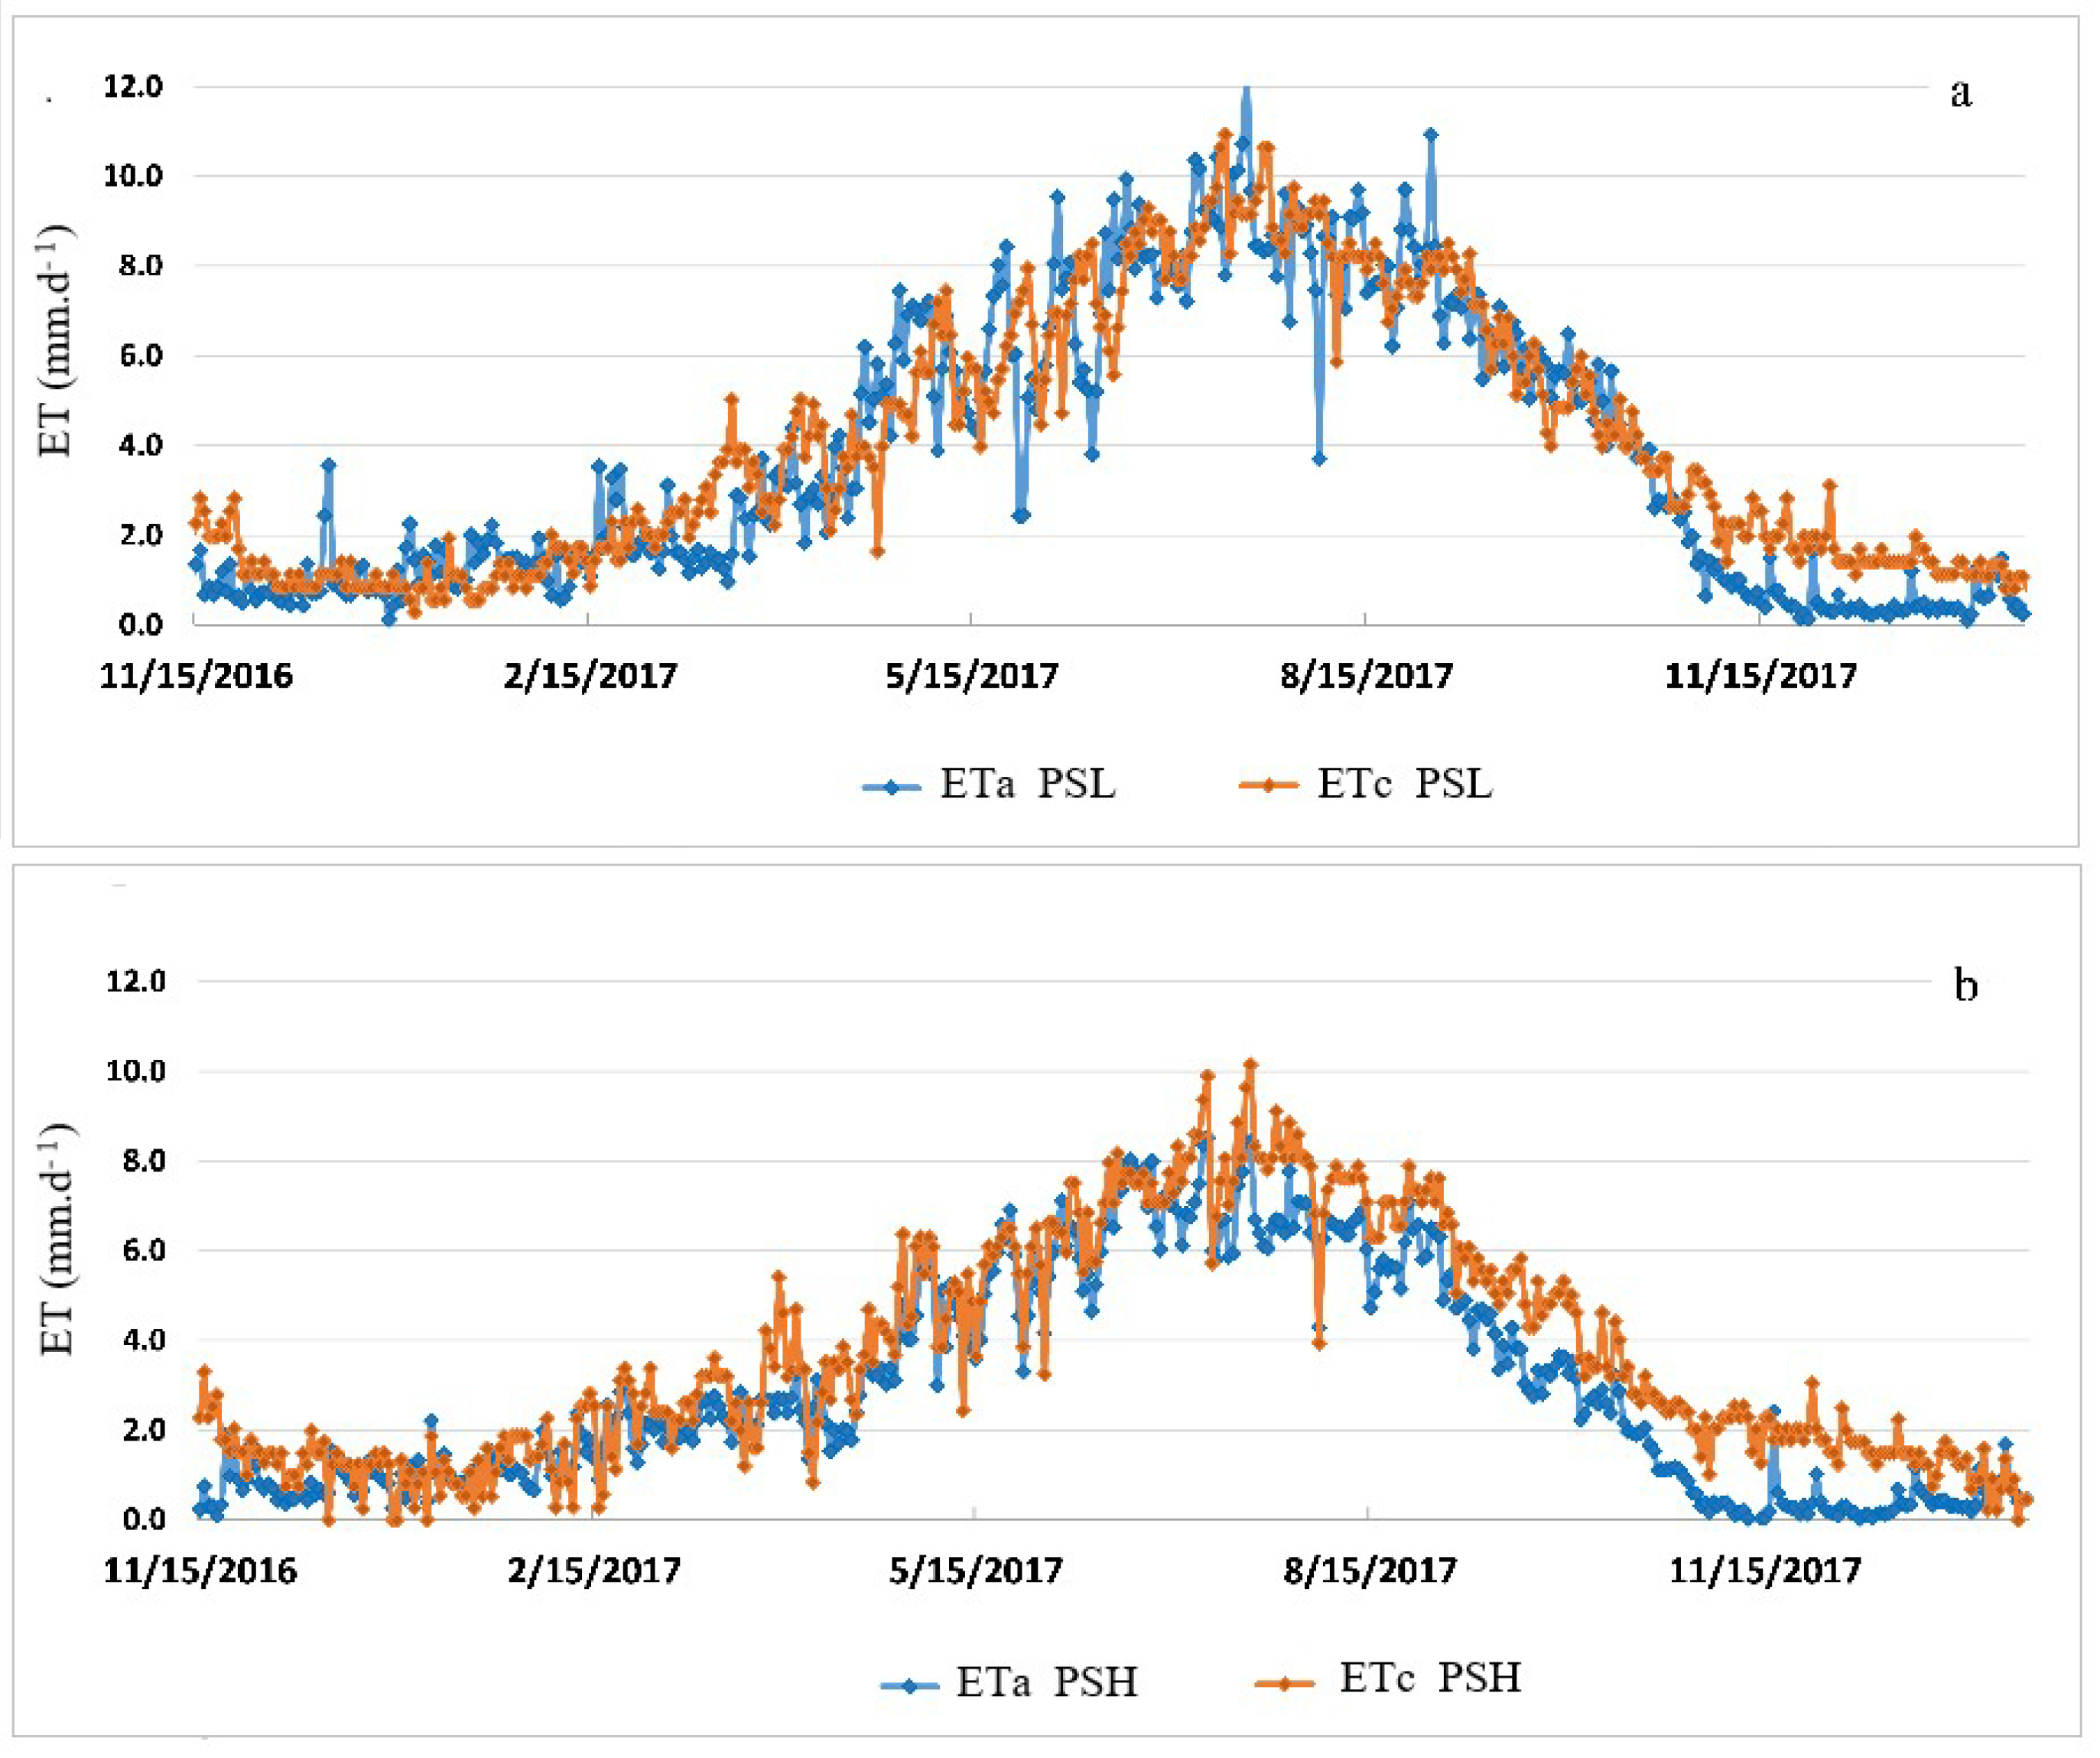
3.3. Evapotranspiration and Water Balances
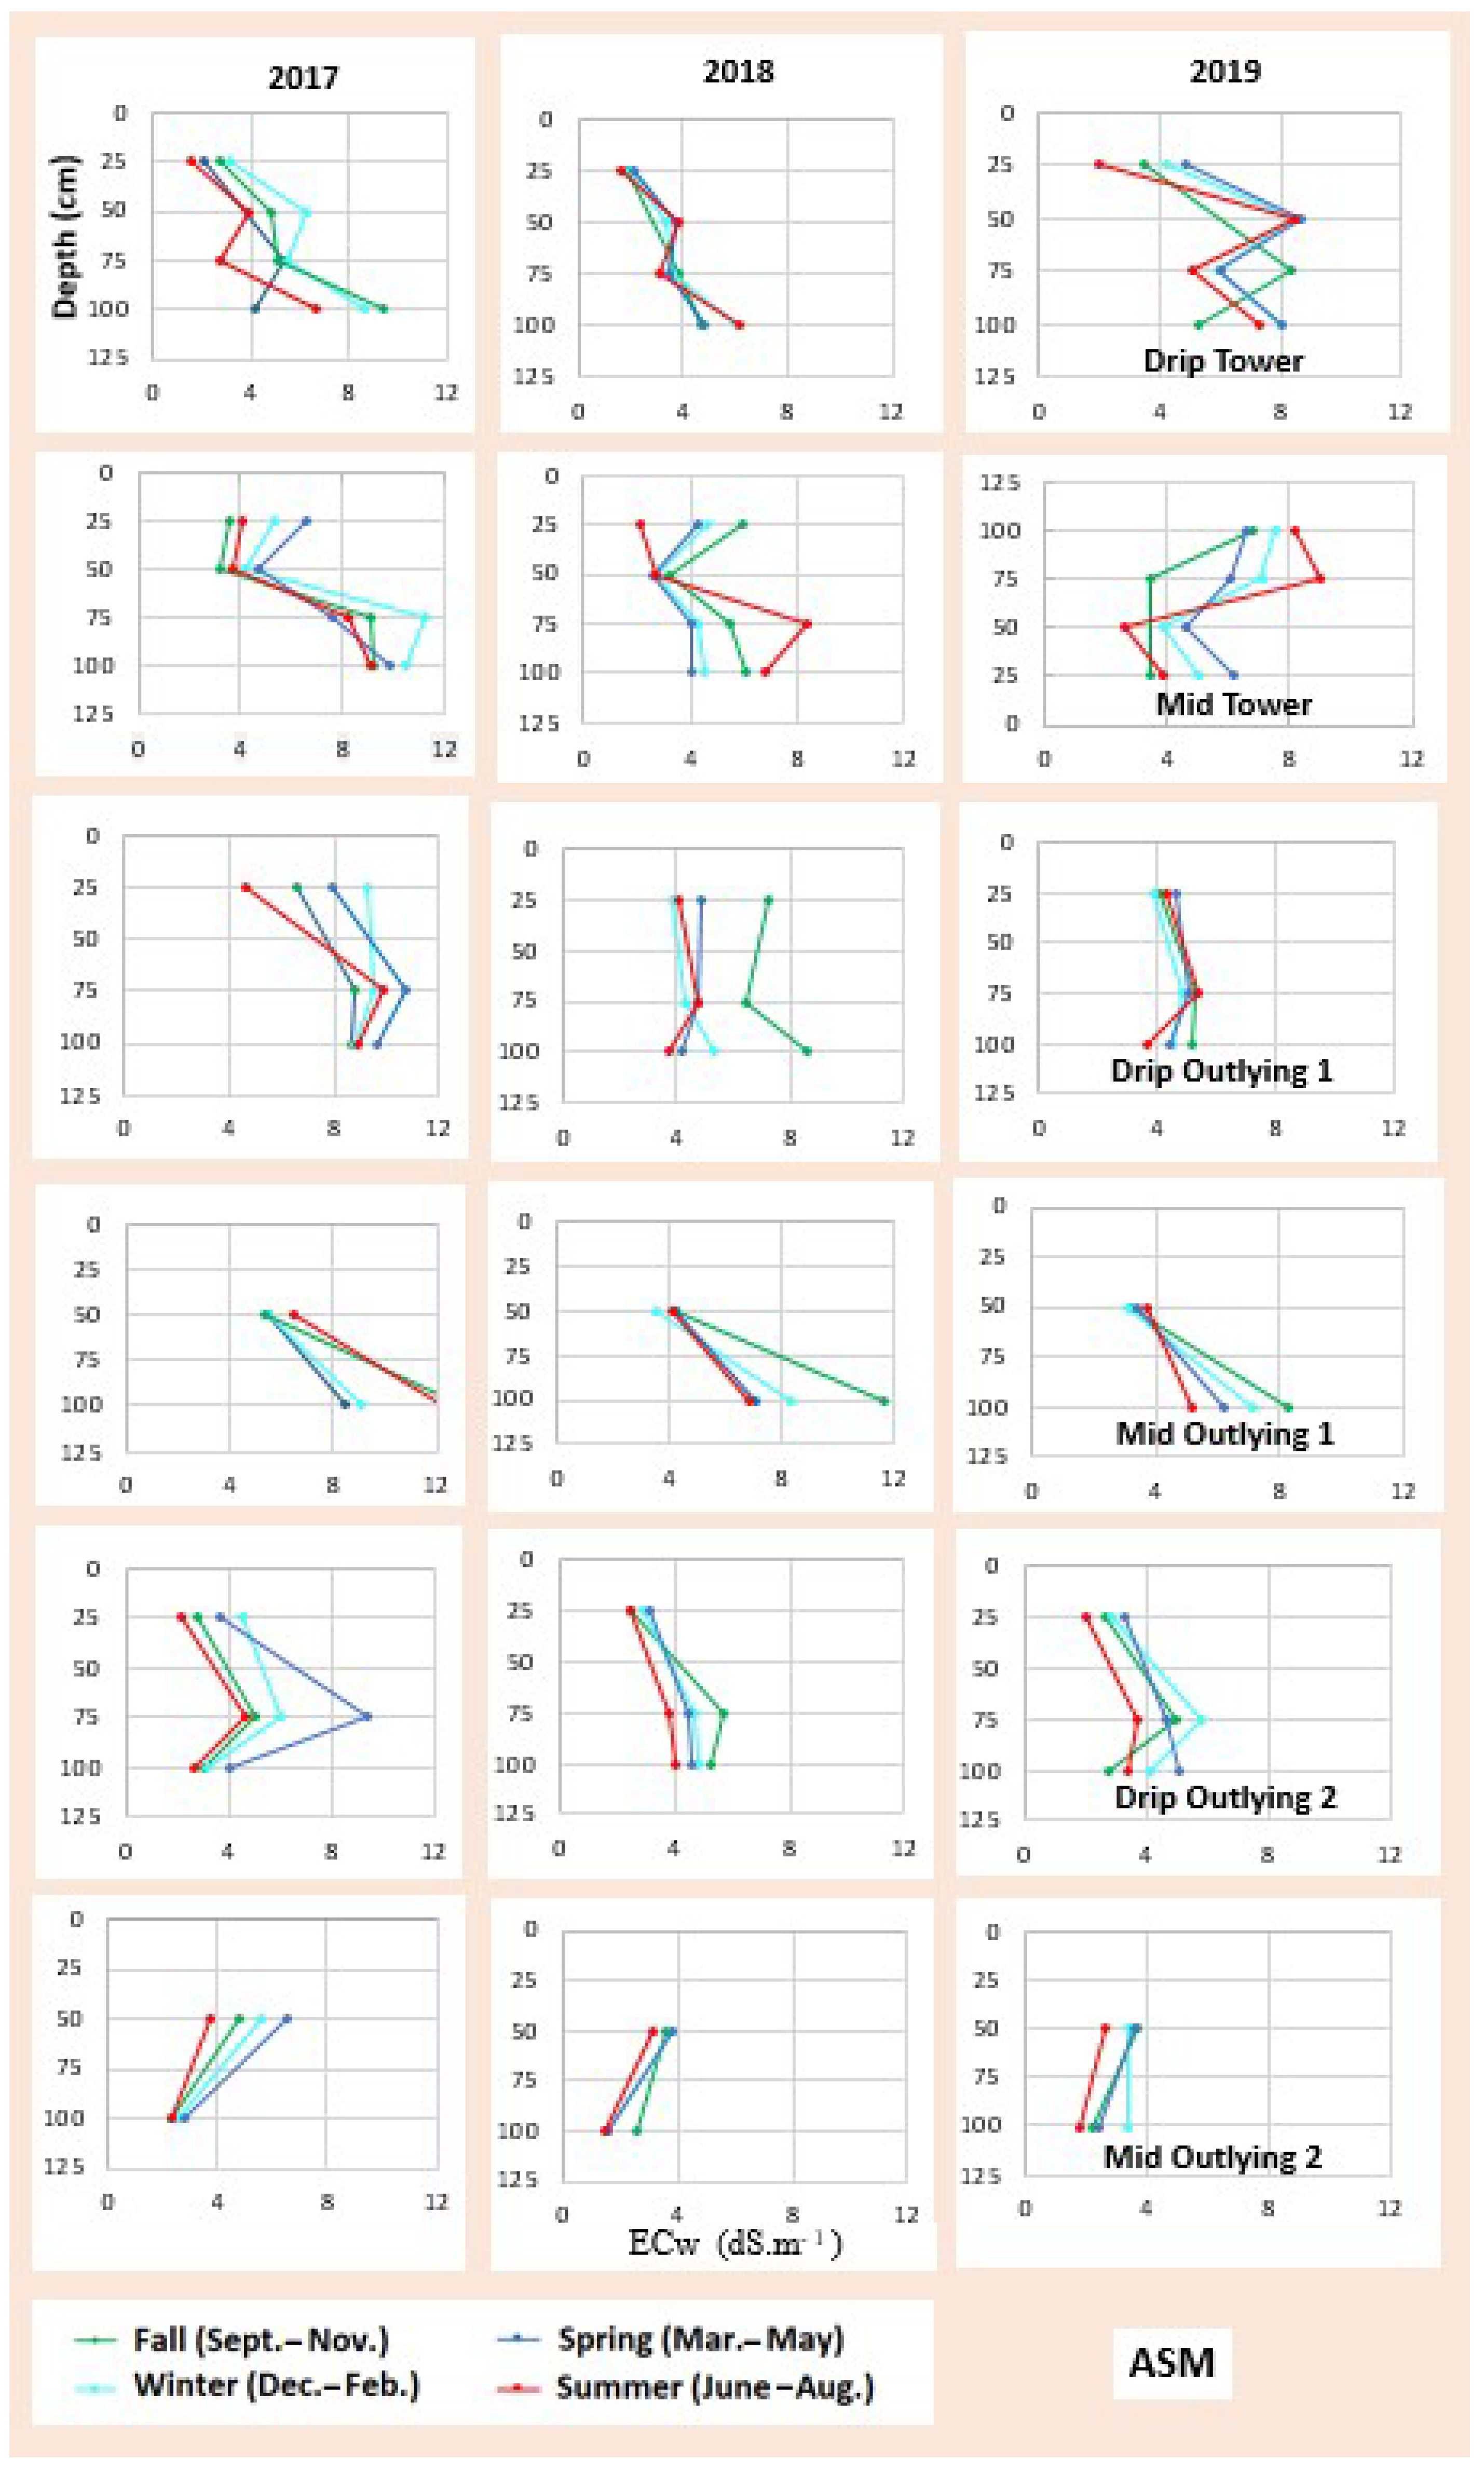
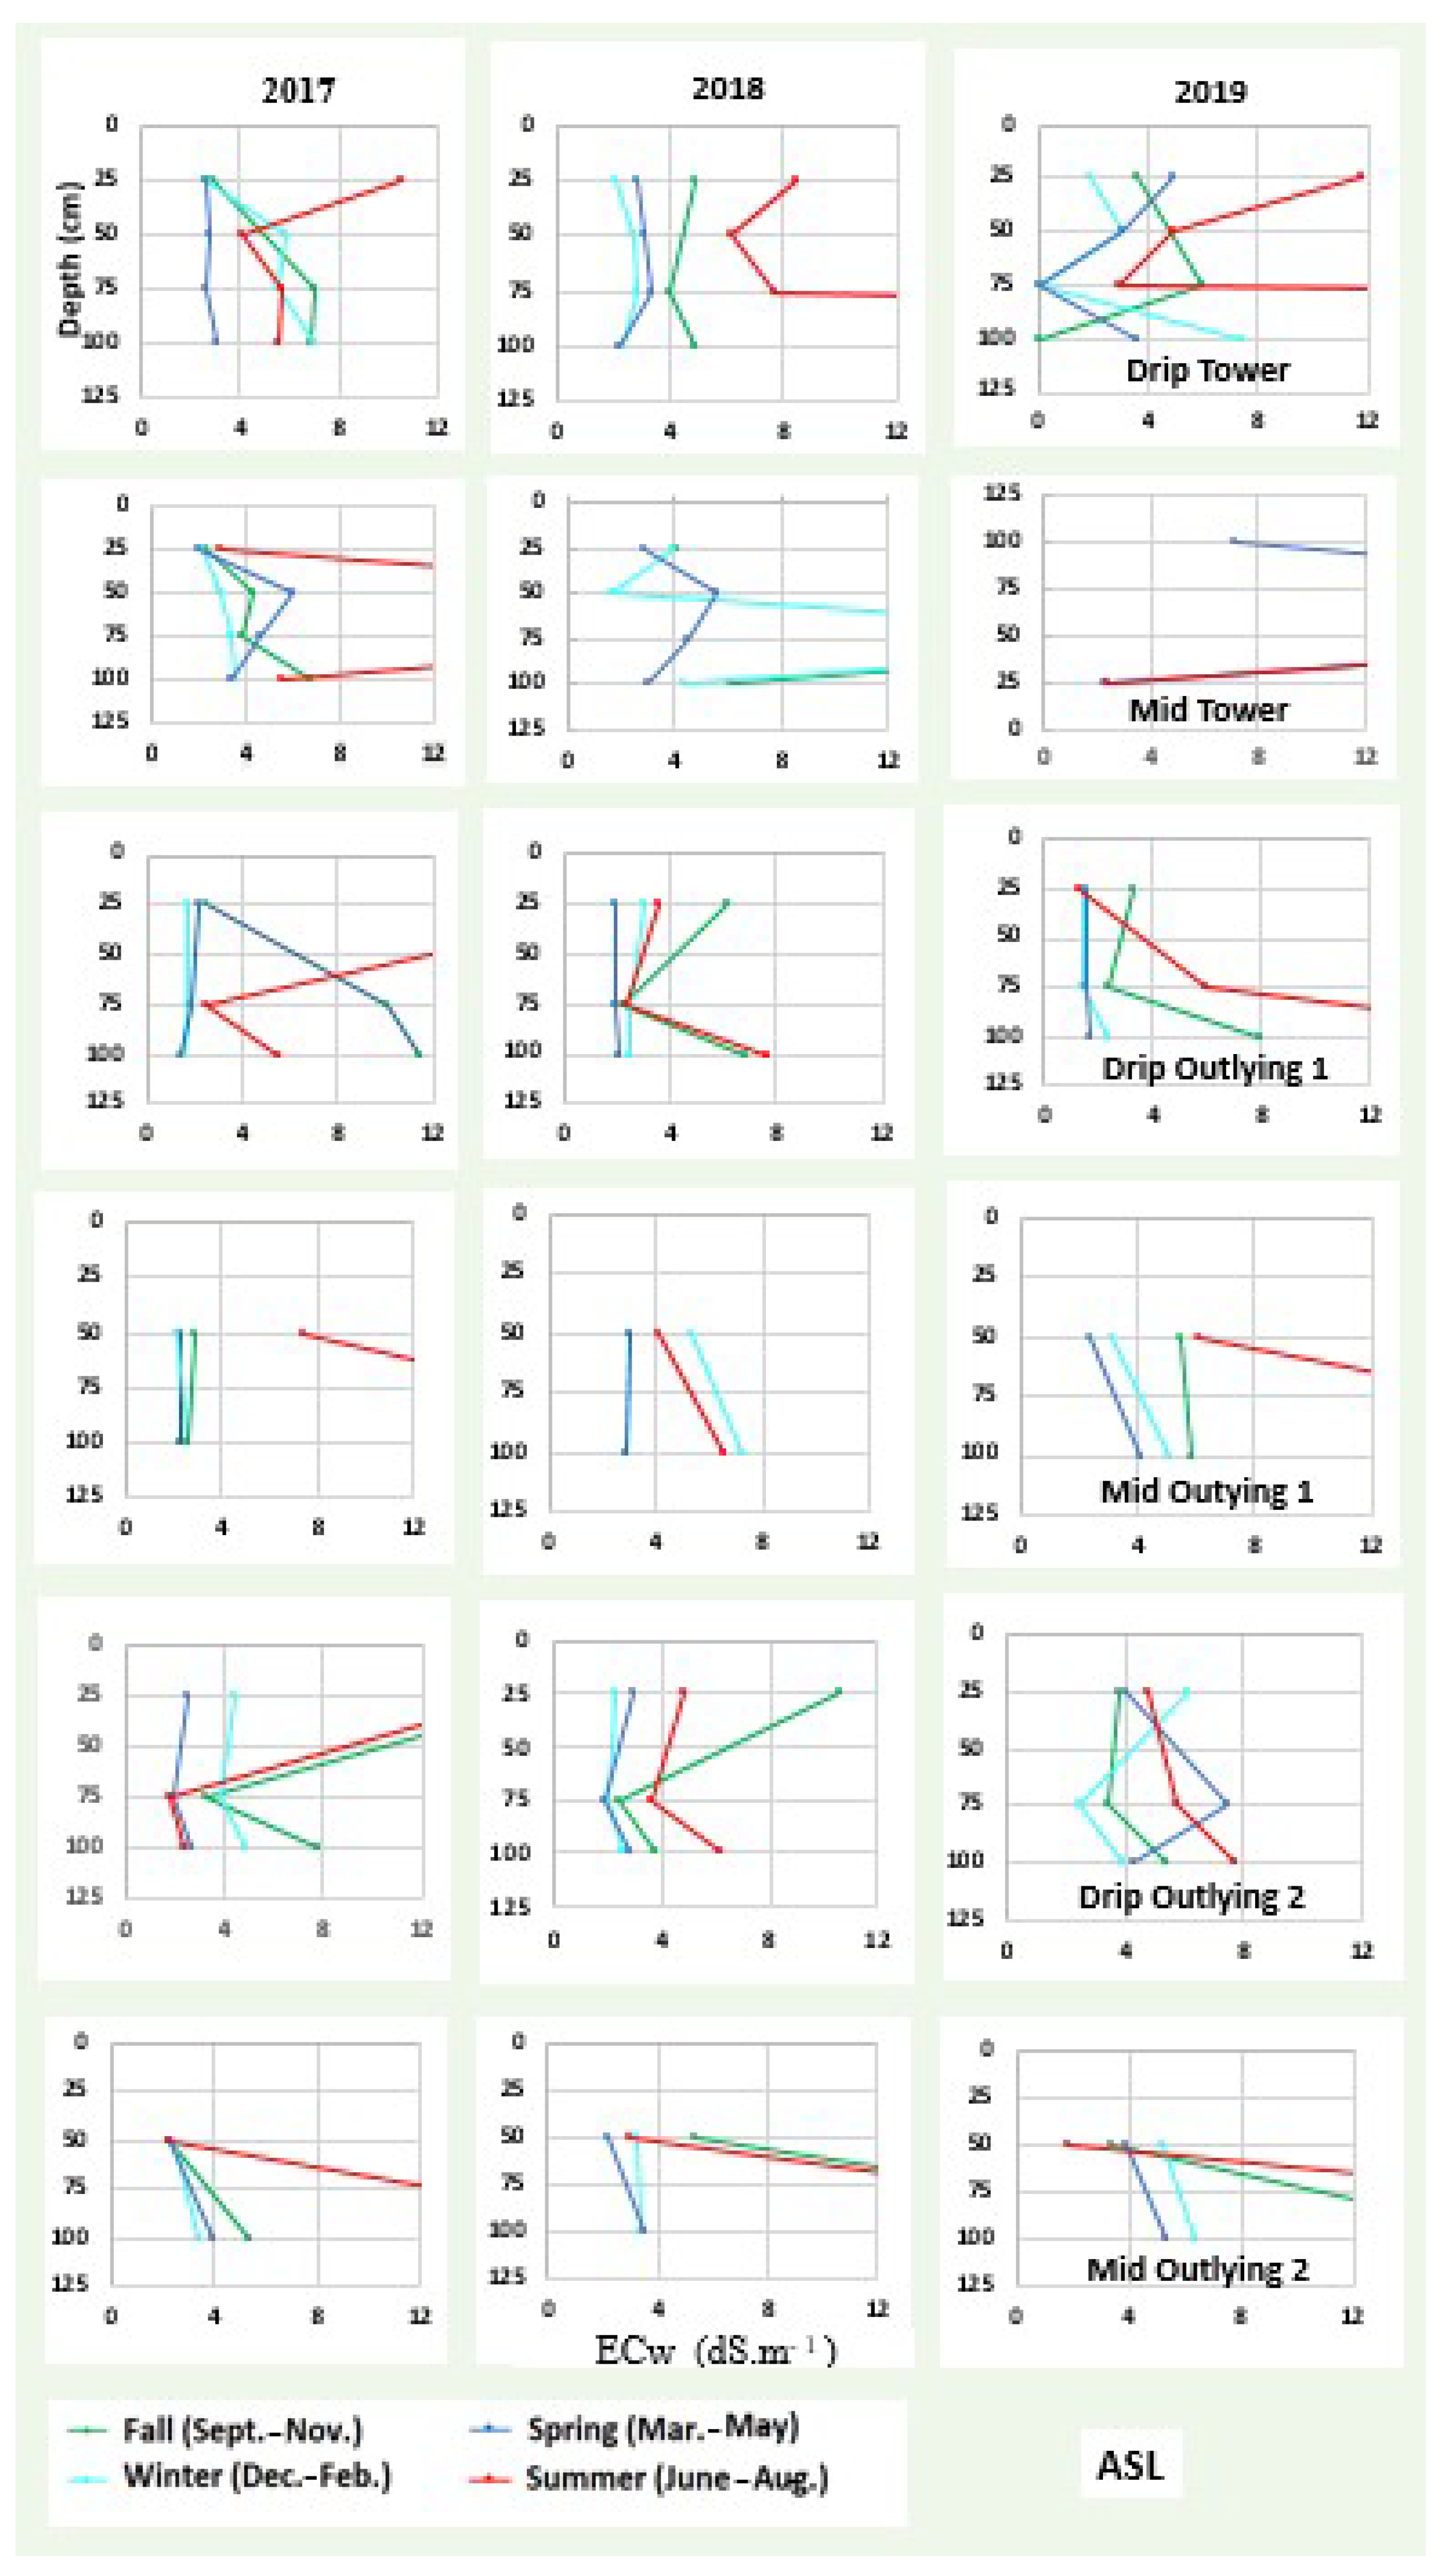
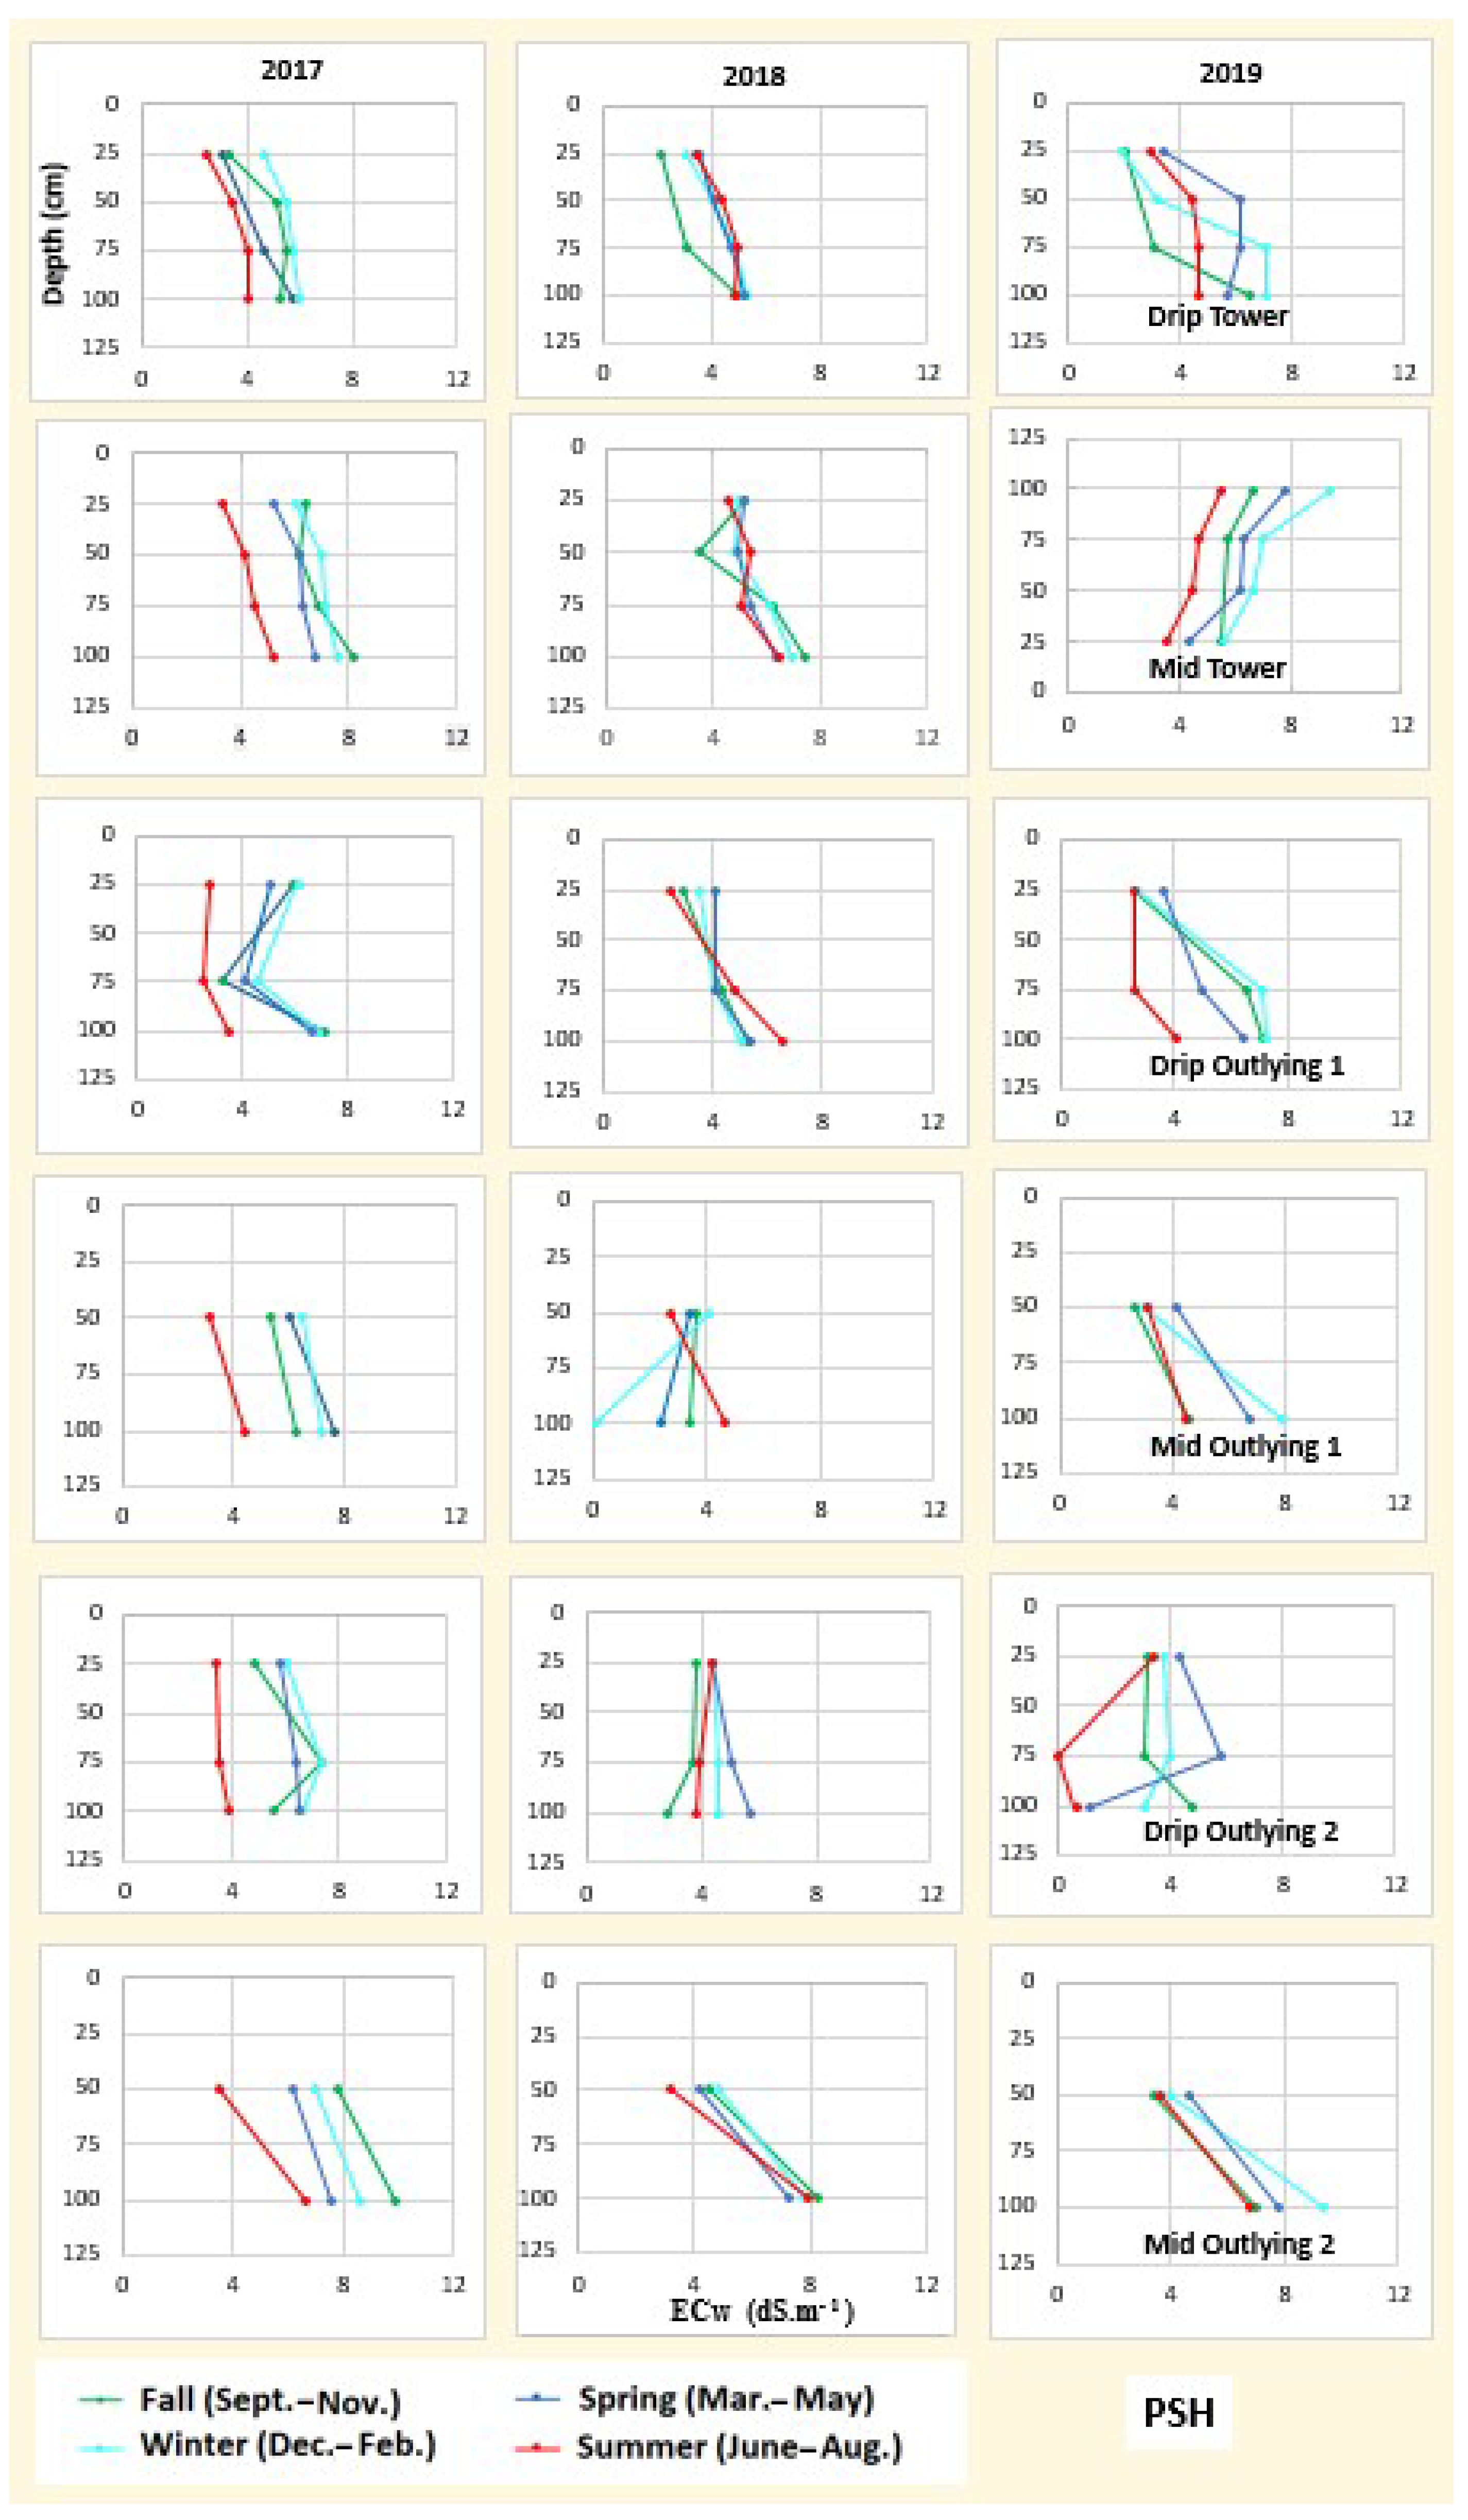
3.4. Soil Water and Salinity
4. Discussion and Conclusions
Author Contributions
Funding
Institutional Review Board Statement
Informed Consent Statement
Data Availability Statement
Acknowledgments
Conflicts of Interest
Appendix A


| Location | Position | Depth | CEC | Exchangeable Sodium Percentage | Sodium Adsorption Ratio | ECe | pH | Sand | Silt | Clay | Saturated Hydraulic Conductivity |
|---|---|---|---|---|---|---|---|---|---|---|---|
| cm | mmolc/kg | % | (mmolc/L)0.5 | dS/m | % | % | % | cm d−1 | |||
| Tower | Drip | 0–20 | 49.5 | 20.1 | 30.4 | ||||||
| 20–40 | 62.57 | 22.15 | 3.6 | 2.4 | 6.7 | 40.9 | 28.9 | 30.2 | 16.15 | ||
| 40–60 | 130.64 | 34.79 | 6.0 | 5.9 | 8.0 | 5.62 | |||||
| 60–80 | 151.47 | 32.02 | 5.0 | 7.0 | 8.0 | 5.2 | 59.2 | 35.6 | 0.5 | ||
| 100–120 | 138.13 | 33.24 | 3.8 | 6.7 | 8.0 | 4.9 | 57.3 | 37.8 | 2.05 | ||
| Mid | 0–20 | ||||||||||
| 20–40 | 7.79 | 22.40 | |||||||||
| 40–60 | 8.51 | 16.32 | |||||||||
| 60–80 | 56.41 | 1.21 | |||||||||
| 100–120 | 47.71 | 1.47 | |||||||||
| Outlying 1 | Drip | 0–20 | |||||||||
| 20–40 | 1.33 | 1.4 | 6.6 | ||||||||
| 40–60 | 3.86 | 4.4 | 8.1 | ||||||||
| 60–80 | 13.31 | 3.7 | 8.2 | 1.0 | 65.0 | 34.0 | |||||
| 100–120 | 1.34 | 2.0 | 7.8 | ||||||||
| Mid | 0–20 | ||||||||||
| 20–40 | 12.3 | 5.0 | 7.9 | ||||||||
| 40–60 | 7.3 | 4.4 | 8.1 | ||||||||
| 60–80 | 3.1 | 3.6 | 8.1 | ||||||||
| 100–120 | 3.4 | 2.7 | 7.7 | ||||||||
| Outlying 2 | Drip | 0–20 | 45.2 | 23.4 | 31.4 | ||||||
| 20–40 | 63.24 | 23.88 | 2.8 | 3.0 | 8.4 | 40.8 | 27.0 | 32.2 | 10.83 | ||
| 40–60 | 112.14 | 21.97 | 3.6 | 4.6 | 8.5 | 6.33 | |||||
| 60–80 | 134.43 | 22.72 | 5.3 | 5.9 | 8.4 | 10.2 | 49.6 | 40.2 | 2.87 | ||
| 100–120 | 78.30 | 22.60 | 2.3 | 2.6 | 8.2 | 38.0 | 44.2 | 17.8 | 26.59 | ||
| Mid | 0–20 | ||||||||||
| 20–40 | 73.43 | 22.36 | 1.5 | 0.3 | 8.1 | ||||||
| 40–60 | 109.50 | 20.44 | 2.0 | - | - | ||||||
| 60–80 | 113.17 | 22.50 | 3.2 | 0.5 | 8.3 | ||||||
| 100–120 | 99.94 | 27.34 | 3.3 | 0.5 |
| Location | Position | Depth | CEC | Exchangeable Sodium Percentage | Sodium Adsorption Ratio | ECe | pH | Sand | Silt | Clay | Saturated Hydraulic Conductivity |
|---|---|---|---|---|---|---|---|---|---|---|---|
| cm | mmolc/kg | % | (mmolc/L)0.5 | dS·m−1 | % | % | % | cm/d−1 | |||
| Tower | Drip | 0–20 | 18.8 | 43.6 | 37.6 | 9.37 | |||||
| 20–40 | 124.49 | 5.17 | 1.5 | 1.3 | 8.5 | 17.7 | 43.5 | 38.8 | 3.38 | ||
| 40–60 | 75.78 | 6.46 | 1.1 | 2.2 | 8.6 | ||||||
| 60–80 | 133.11 | 3.87 | 3.2 | 4.5 | 8.2 | 4.6 | 56.8 | 38.6 | 1.01 | ||
| 100–120 | 115.22 | 4.95 | 2.0 | 3.9 | 8.2 | 7.0 | 66.4 | 26.6 | 8.72 | ||
| Mid | 0–20 | ||||||||||
| 20–40 | 2.1 | 3.0 | 8.3 | ||||||||
| 40–60 | 1.5 | 3.0 | 8.1 | ||||||||
| 60–80 | 2.9 | 4.4 | 8.3 | ||||||||
| 100–120 | 3.7 | 6.1 | 8.1 | ||||||||
| Outlying 1 | Drip | 0–20 | |||||||||
| 20–40 | 100.28 | 15.05 | 16.0 | 15.7 | 40.5 | 43.8 | |||||
| 40–60 | 125.34 | 16.96 | 9.9 | 3.5 | 8.1 | 22.7 | 37.5 | 39.8 | |||
| 60–80 | 128.82 | 20.19 | 15.1 | 6.1 | 8.4 | ||||||
| 80–100 | 15.3 | 49.7 | 35.0 | ||||||||
| 100–120 | 16.6 | 13.0 | 47.0 | 40.0 | |||||||
| Outlying 2 | Drip | 0–20 | 25.2 | 35.4 | 39.4 | 5.77 | |||||
| 20–40 | 0.9 | 1.3 | 7.9 | 23.2 | 37.0 | 39.8 | 2.27 | ||||
| 60–80 | 2.6 | 2.8 | 8.6 | ||||||||
| 80–100 | 4.8 | 5.9 | 8.2 | 19.1 | 46.5 | 34.4 | 7.48 | ||||
| 100–120 | 2.4 | 3.6 | 8.2 | 10.5 | 51.7 | 37.8 | 16.71 |
| Location | Position | Depth | CEC | Exchangeable Sodium Percentage | Sodium Adsorption Ratio | ECe | pH | Sand | Silt | Clay | Saturated Hydraulic Conductivity |
|---|---|---|---|---|---|---|---|---|---|---|---|
| cm | mmolc/kg | % | (mmolc/L)0.5 | dS/m | % | % | % | cm d−1 | |||
| Tower | Drip | 20–40 | 44.59 | 15.39 | 1.7 | 8.1 | 52.7 | 36.7 | 10.6 | 29.18 | |
| 40–60 | 48.19 | 16.80 | 0.9 | 8.2 | 48.5 | 37.9 | 13.6 | 17.74 | |||
| 60–80 | 68.61 | 15.62 | 1.1 | 7.3 | 53.7 | 38.7 | 7.6 | 21.82 | |||
| 100–120 | 78.01 | 15.68 | 1.7 | 8.1 | 58.6 | 35.2 | 6.2 | 27.78 | |||
| Mid | 20–40 | 35.75 | 10.87 | 2.0 | 1.1 | 8.2 | |||||
| 40–60 | 38.85 | 13.45 | 3.1 | 1.1 | |||||||
| 60–80 | 46.26 | 15.54 | 5.6 | 0.2 | 8.7 | ||||||
| 100–120 | 86.53 | 13.39 | 7.0 | 1.3 | 8.6 | ||||||
| Outlying 1 | Drip | 20–40 | 35.14 | 22.90 | 6.0 | 1.6 | 8.6 | 45.0 | 33.0 | 22.0 | |
| 40–60 | 34.38 | 17.73 | 5.7 | 2.5 | 8.3 | 48.3 | 27.7 | 24.0 | |||
| 60–80 | 31.37 | 17.09 | 6.8 | 0.8 | 51.3 | 26.7 | 22.0 | ||||
| 100–120 | 29.72 | 23.90 | 6.8 | 1.0 | 8.3 | 51.0 | 29.0 | 20.0 | |||
| Mid | 20–40 | 33.90 | 10.61 | 1.9 | 0.7 | 7.5 | |||||
| 40–60 | 30.36 | 13.21 | 2.7 | 1.4 | 7.9 | ||||||
| 60–80 | 32.60 | 10.82 | 2.6 | 1.2 | 8.2 | ||||||
| 100–120 | 33.01 | 16.60 | 4.0 | 1.1 | 7.6 | ||||||
| 20–40 | 16.8 | 3.0 | 8.9 | ||||||||
| 40–60 | 13.3 | 3.0 | 8.8 | ||||||||
| 60–80 | 14.3 | 4.0 | 8.2 | ||||||||
| 100–120 | 17.7 | 4.5 | 8.5 |
| Location | Position | Depth | CEC | Exchangeable Sodium Percentage | Sodium Adsorption Ratio | ECe | pH | Sand | Silt | Clay | Saturated Hydraulic Conductivity |
|---|---|---|---|---|---|---|---|---|---|---|---|
| cm | mmolc/kg | % | (mmolc/L)0.5 | dS/m | % | % | % | cm d−1 | |||
| Tower | Drip | 0–20 | 10.5 | 37.9 | 51.6 | ||||||
| 20–40 | 97.07 | 21.05 | 0.3 | 4 | 7.5 | 8.5 | 39.3 | 52.2 | 21.85 | ||
| 40–60 | 120.64 | 20.58 | 0.9 | 1.5 | 8.5 | 14.3 | 38.1 | 47.6 | 7.03 | ||
| 60–80 | 96.43 | 19.23 | 2.9 | 3.7 | 7.5 | 7.02 | |||||
| 100–120 | 2.6 | 4.8 | 24.2 | 35.2 | 40.6 | 13.57 | |||||
| Mid | 0–20 | ||||||||||
| 20–40 | |||||||||||
| 40–60 | |||||||||||
| 100–120 | |||||||||||
| Outlying 1 | Drip | 0–20 | |||||||||
| 20–40 | 126.53 | 10.30 | 2.16 | 5.0 | 7.8 | 9.2 | 39.2 | 51.6 | |||
| 40–60 | 119.59 | 10.21 | 2.89 | 5.8 | 7.8 | 7.3 | 38.9 | 53.8 | |||
| 60–80 | 129.58 | 8.04 | 8.7 | 35.4 | 55.9 | ||||||
| 100–120 | 53.07 | 12.13 | 13.32 | 5.5 | 7.4 | 19.1 | 37.2 | 43.7 | |||
| Mid | 0–20 | ||||||||||
| 20–40 | 103.42 | 11.23 | 2.6 | 7.3 | |||||||
| 40–60 | 106.44 | 10.12 | 14.1 | 2.3 | 7.4 | ||||||
| 60–80 | 118.36 | 8.01 | 3.7 | 7.2 | |||||||
| 100–120 | 106.34 | 5.73 | 4.9 | 7.0 | |||||||
| Outlying 2 | Drip | 0–20 | |||||||||
| 20–40 | 117.76 | 21.43 | 14.03 | 3.6 | 8.3 | 8.90 | |||||
| 60–80 | 124.53 | 23.20 | 14.05 | 3.8 | 8.4 | 3.79 | |||||
| 100–120 | 166.82 | 25.59 | 34.48 | 9.79 |
| Location | Position | Depth | CEC | Exchangeable Sodium Percentage | Sodium Adsorption Ratio | ECe | pH | Sand | Silt | Clay | Saturated Hydraulic Conductivity |
|---|---|---|---|---|---|---|---|---|---|---|---|
| cm | mmolc/kg | % | (mmolc/L)0.5 | dS/m | % | % | % | cm d−1 | |||
| Tower | Drip | 0–20 | 72.4 | 21.9 | 5.7 | ||||||
| 20–40 | 6.08 | 16.25 | 1.42 | 0.3 | 7.6 | 72.6 | 21.4 | 5.9 | 50.95 | ||
| 40–60 | 8.10 | 7.96 | 1.47 | 0.2 | 6.9 | 70.0 | 22.5 | 7.5 | 30.33 | ||
| 60–80 | 9.90 | 14.44 | 1.39 | 0.5 | 6.6 | 71.1 | 24.2 | 4.7 | 13.81 | ||
| 100–120 | 30.46 | 11.50 | 1.33 | 1.1 | 7.9 | 56.7 | 35.6 | 7.7 | 11.20 | ||
| Outlying 1 | Drip | 0–20 | |||||||||
| 20–40 | 1.2 | 1.1 | 7.9 | 63.0 | 13.8 | 23.2 | |||||
| 40–60 | 2.0 | 2.6 | 8.0 | 59.0 | 10.0 | 31.0 | |||||
| 60–80 | 2.0 | 1.1 | 7.9 | 60.3 | 8.0 | 31.7 | |||||
| 100–120 | 1.3 | 0.6 | 50.2 | 8.0 | 41.8 | ||||||
| Mid | 0–20 | ||||||||||
| 20–40 | 0.5 | 0.9 | 8.4 | ||||||||
| 40–60 | 0.6 | 0.7 | 8.2 | ||||||||
| 60–80 | 0.3 | 0.9 | 8.2 | ||||||||
| 100–120 | 0.6 | 0.6 | 7.8 | ||||||||
| Outlying 2 | Drip | 0–20 | |||||||||
| 20–40 | 6.12 | 26.27 | 1.9 | 0.3 | 6.3 | 42.0 | 26.0 | 32.0 | |||
| 40–60 | 8.03 | 16.07 | 2.3 | 1.1 | 6.9 | 38.0 | 36.0 | 26.0 | |||
| 60–80 | 54.88 | 1.31 | 7.1 | 5.0 | 7.2 | 48.0 | 22.0 | 30.0 | |||
| 100–120 | 47.84 | 1.51 | 8.0 | 3.3 | 8.4 | 31.3 | 33.0 | 35.7 | |||
| Mid | 0–20 | ||||||||||
| 20–40 | 8.57 | 11.02 | 1.2 | 2.6 | 7.1 | 48.0 | 27.0 | 25.0 | |||
| 40–60 | 21.40 | 15.59 | 3.4 | 1.9 | 8.2 | 16.0 | 34.0 | 50.0 | |||
| 60–80 | 82.25 | 16.71 | 6.3 | 4.3 | 7.6 | 27.0 | 28.0 | 45.0 | |||
| 100–120 | 47.83 | 16.63 | 4.9 | 4.3 | 8.4 | 40.7 | 24.0 | 35.3 |
| Cl | Na | Ca | K | Mg | B | Mo | |
|---|---|---|---|---|---|---|---|
| meq/L | meq/L | meq/L | meq/L | meq/L | ppm | ppm | |
| ASL | 2.15 | 2.38 | 5.04 | 0.28 | 2.42 | 0.08 | 2.42 |
| ASM | 0.48 | 12.26 | 20.82 | 1.00 | 11.40 | 0.17 | 11.40 |
| ASH | 1.04 | 11.98 | 14.77 | 0.77 | 7.02 | 1.17 | 7.02 |
| PSL | 0.28 | 1.28 | 2.68 | 0.83 | 1.38 | 0.28 | 1.38 |
| PSH | 1.10 | 19.20 | 17.38 | 0.64 | 6.53 | 2.60 | 6.53 |
| Sites | Day of Irrigation | ECiw (dS/m) | SAR (mmolc/L )0.5 | pH | Ca2+ (mmolc/L) | Mg2+ (mmolc/L) | Na+ (mmolc/L) | K+ (mmolc.l/L) | |
|---|---|---|---|---|---|---|---|---|---|
| 1 | ASH | 30 May 2017 | 0.3 | 7.78 | 0.32 | 0.32 | 1.29 | 0.17 | |
| 11 Aug 2017 | 0.24 | 1.4 | 7.14 | 0.35 | 0.35 | 1.54 | 0.09 | ||
| 6 Jul 2018 | 0.43 | 7.6 | 1.04 | 0.51 | 2.24 | 0.1 | |||
| 19 Sep 2018 | 0.54 | 6.95 | 0.31 | 0.29 | 1.09 | 0.07 | |||
| 20 Jan 2019 | 0.79 | 7.8 | 1.1 | 1.16 | 4.76 | 0.19 | |||
| 2 | ASM | 30 May 2017 | 0.28 | 1.7 | 7.7 | 0.33 | 0.33 | 1.47 | 0.08 |
| 17 May 2018 | 0.43 | 7.69 | 0.87 | 0.58 | 2.47 | 0.13 | |||
| 6 Jul 2018 | 0.54 | 1.8 | 7.72 | 0.43 | 0.61 | 3.26 | 0.12 | ||
| 19 Sep 2018 | 0.51 | 7.89 | 0.46 | 0.52 | 2.31 | 0.11 | |||
| 5 Jan 2019 | 0.48 | 7.8 | 0.91 | 0.69 | 5.98 | 0.14 | |||
| 3 | PSL | 30 Mar 2017 | 0.05 | 0.48 | 7.64 | 0.1 | 0.02 | 0.19 | 0.05 |
| 5 Jul 2017 | 0.24 | 7.8 | 0.49 | 0.24 | 1.15 | 0.07 | |||
| 17 May 2018 | 0.04 | 7.2 | 0.08 | 0.02 | 0.19 | 0.04 | |||
| 2 Aug 2018 | 0.05 | 8.06 | 0.07 | 0.01 | 0.15 | 0.04 | |||
| 4 | PSH | 20 Feb 2018 | 0.44 | 7.57 | 0.52 | 0.59 | 2.86 | 0.16 | |
| 31 Aug 2018 | 0.89 | 4.1 | 7.72 | 0.51 | 0.56 | 2.54 | 0.12 | ||
| 19 Sep 2018 | 0.48 | 3 | 7.93 | 0.44 | 0.57 | 3.03 | 0.11 | ||
| 30 Jan 2019 | 0.9 | 7.77 | 1.22 | 0.74 | 5.89 | 0.09 |
References
- Schoups, G.; Hopmans, J.W.; Young, C.A.; Vrugt, J.A.; Wallender, W.W.; Tanji, K.K.; Panday, S. Sustainability of Irrigated Agriculture in the San Joaquin Valley, California. Proc. Natl. Acad. Sci. USA 2005, 102, 15352–15356. [Google Scholar] [CrossRef] [Green Version]
- Tindula, G.N.; Orang, M.N.; Snyder, R.L. Survey of Irrigation Methods in California in 2010. J. Irrig. Drain. Eng. 2013, 139, 233–238. [Google Scholar] [CrossRef]
- Hanson, B.; May, D. Drip Irrigation Salinity Management for Row Crops; University of California, Agriculture and Natural Resources: Davis, CA, USA, 2011; ISBN 978-1-60107-740-0. [Google Scholar]
- Machado, R.M.; Serralheiro, R.P. Soil Salinity: Effect on Vegetable Crop Growth. Management Practices to Prevent and Mitigate Soil Salinization. Horticulturae 2017, 3, 30. [Google Scholar] [CrossRef]
- Kelsey, R.; Hart, A.; Butterfield, H.S.; Vink, D. Groundwater Sustainability in the San Joaquin Valley: Multiple Benefits If Agricultural Lands Are Retired and Restored Strategically. Calif. Agric. 2018, 72, 151–154. [Google Scholar] [CrossRef] [Green Version]
- Galloway, D.L.; Jones, D.R.; Ingebritsen, S.E. Land Subsidence in the United States; Circular 1182; US Geological Surwey: Denver, CO, USA, 1999. [Google Scholar]
- Carle, D. Introduction to Water in California, 2nd ed.; University of California Press: Oakland, CA, USA, 2016; ISBN 978-0-520-28789-1. [Google Scholar]
- Quinn, N.W.T. The San Joaquin Valley: Salinity and Drainage Problems and the Framework for a Response. In Salinity and Drainage in San Joaquin Valley, California: Science, Technology, and Policy; Chang, A.C., Brawer Silva, D., Eds.; Springer: Dordrecht, The Netherlands, 2014; pp. 47–97. ISBN 978-94-007-6851-2. [Google Scholar]
- Quinn, N.W.T.; Delamore, M.L. Issues of Sustainable Irrigated Agriculture in the San Joaquin Valley of California in a Changing Regulatory Environment Concerning Water Quality and Protection of Wildlife; Lawrence Berkeley National Laboratory: Berkelye, CA, USA, 1994. [Google Scholar]
- He, R.; Jin, Y.; Kandelous, M.M.; Zaccaria, D.; Sanden, B.L.; Snyder, R.L.; Jiang, J.; Hopmans, J.W. Evapotranspiration Estimate over an Almond Orchard Using Landsat Satellite Observations. Remote Sens. 2017, 9, 436. [Google Scholar] [CrossRef] [Green Version]
- Gaines, R.W. Central Valley Project Water Development: Historical Background, Economic Impacts, and Future Outlook; R.W. Gaines: Roseville, CA, USA, 1986. [Google Scholar]
- Department of Water Resources. Drainage Management in the San Joaquin Valley, a Status Report; Department of Water Resources: Sacramento, CA, USA, 1998.
- Bellvert, J.; Adeline, K.; Baram, S.; Pierce, L.; Sanden, B.L.; Smart, D.R. Monitoring Crop Evapotranspiration and Crop Coefficients Over an Almond and Pistachio Orchard Throughout Remote Sensing. Remote Sens. 2018, 10, 2001. [Google Scholar] [CrossRef] [Green Version]
- Anderson, R. AmeriFlux US-PSL USSL San Joaquin Valley Pistachio Low; US Department of Energy, Office of Biological and Environmental Research: Berkeley, CA, USA, 2020.
- Anderson, R. AmeriFlux US-PSH USSL San Joaquin Valley Pistachio High; USDA-ARS: US Department of Energy, Office of Biological and Environmental Research: Berkeley, CA, USA, 2020. [Google Scholar]
- Anderson, R. AmeriFlux US-ASL USSL San Joaquin Valley Almond Low Salinity; US Department of Energy, Office of Biological and Environmental Research: Berkeley, CA, USA, 2020.
- Anderson, R. AmeriFlux US-ASM USSL San Joaquin Valley Almond Medium Salinity; US Department of Energy, Office of Biological and Environmental Research: Berkeley, CA, USA, 2020.
- Anderson, R. AmeriFlux US-ASH USSL San Joaquin Valley Almond High Salinity; US Department of Energy, Office of Biological and Environmental Research: Berkeley, CA, USA, 2020.
- Fisher, J.B.; Lee, B.; Purdy, A.J.; Halverson, G.H.; Dohlen, M.B.; Cawse-Nicholson, K.; Wang, A.; Anderson, R.G.; Aragon, B.; Arain, M.A.; et al. ECOSTRESS: NASA’s Next Generation Mission to Measure Evapotranspiration From the International Space Station. Water Resour. Res. 2020, 56, e2019WR026058. [Google Scholar] [CrossRef]
- US Salinity Laboratory. Diagnosis and Improvement of Saline and Alkali Soils; Richards, L.A., Ed.; Handbook; Soil and Water Conservative Research Branch, Agricultural Research Service, US Department of Agriculture: Washington, DC, USA, 1954.
- Maas, E.V.; Hoffman, G. Crop Salt Tolerance-Current Assessment. J. Irrig. Drain. Div. ASCE 1977, 103, 115–134. [Google Scholar] [CrossRef]
- van Straten, G.; de Vos, A.C.; Rozema, J.; Bruning, B.; van Bodegom, P.M. An Improved Methodology to Evaluate Crop Salt Tolerance from Field Trials. Agric. Water Manag. 2019, 213, 375–387. [Google Scholar] [CrossRef]
- Sanden, B.L.; Ferguson, L.; Corwin, D.L. Development and Long-Term Salt Tolerance of Pistachios from Planting to Maturity Using Saline Groundwater. Acta Hortic. 2014, 1028, 327–332. [Google Scholar] [CrossRef]
- Sepaskhah, A.R.; Maftoun, M. Relative Salt Tolerance of Pistachio Cultivars. J. Hortic. Sci. 1988, 63, 157–162. [Google Scholar] [CrossRef]
- Ferguson, L.; Poss, J.A.; Grattan, S.M.; Grieve, C.M.; Wang, D.; Wilson, C.; Donavan, T.A.; Chao, C.T. Pistachio Rootstocks Influence Scion Growth and Ion Relations under Salinity and Boron Stress. J. Am. Soc. Hortic. Sci. JASHS 2002, 127, 194–199. [Google Scholar] [CrossRef] [Green Version]
- Griffin, D.; Anchukaitis, K.J. How Unusual Is the 2012–2014 California Drought? Geophys. Res. Lett. 2014, 41, 9017–9023. [Google Scholar] [CrossRef] [Green Version]
- Fram, M.S. Groundwater Quality in the Western San Joaquin Valley Study Unit, 2010: California GAMA Priority Basin Project; Scientific Investigations Report; U.S. Geological Survey: Reston, VA, USA, 2017; p. 146. [Google Scholar]
- Gee, G.W.; Or, D. 2.4 Particle-Size Analysis. In Methods of Soil Analysis; John Wiley & Sons, Ltd.: Hoboken, NJ, USA, 2002; pp. 255–293. ISBN 978-0-89118-893-3. [Google Scholar]
- Durner, W.; Iden, S.C.; von Unold, G. The Integral Suspension Pressure Method (ISP) for Precise Particle-Size Analysis by Gravitational Sedimentation. Water Resour. Res. 2017, 53, 33–48. [Google Scholar] [CrossRef]
- Blake, G.R.; Hartge, K.H. Bulk Density. In Methods of Soil Analysis; John Wiley & Sons, Ltd.: Hoboken, NJ, USA, 1986; pp. 363–375. ISBN 978-0-89118-864-3. [Google Scholar]
- Klute, A.; Dirksen, C. Hydraulic Conductivity and Diffusivity: Laboratory Methods. In Methods of Soil Analysis; John Wiley & Sons, Ltd.: Hoboken, NJ, USA, 1986; pp. 687–734. ISBN 978-0-89118-864-3. [Google Scholar]
- Rayment, G.E.; Higginson, F.R. Australian Soil and Land Survey. Vol. 3: Australian Laboratory Handbook of Soil and Water Chemical Methods; Inkata Press: Melbourne, Australia, 1992; ISBN 978-0-909605-68-1. [Google Scholar]
- Pratt, K.W.; Koch, W.F.; Wu, Y.C.; Berezansky, P.A. Molality-Based Primary Standards of Electrolytic Conductivity (IUPAC Technical Report). Pure Appl. Chem. 2001, 73, 1783–1793. [Google Scholar] [CrossRef]
- Chapman, H.D. Cation-Exchange Capacity. In Methods of Soil Analysis; John Wiley & Sons, Ltd.: Hoboken, NJ, USA, 1965; pp. 891–901. ISBN 978-0-89118-204-7. [Google Scholar]
- Anderson, R.G.; Alfieri, J.G.; Tirado-Corbalá, R.; Gartung, J.; McKee, L.G.; Prueger, J.H.; Wang, D.; Ayars, J.E.; Kustas, W.P. Assessing FAO-56 Dual Crop Coefficients Using Eddy Covariance Flux Partitioning. Agric. Water Manag. 2017, 179, 92–102. [Google Scholar] [CrossRef]
- Fratini, G.; Mauder, M. Towards a Consistent Eddy-Covariance Processing: An Intercomparison of EddyPro and TK3. Atmos. Meas. Tech. 2014, 7, 2273–2281. [Google Scholar] [CrossRef] [Green Version]
- Reichstein, M.; Falge, E.; Baldocchi, D.; Papale, D.; Aubinet, M.; Berbigier, P.; Bernhofer, C.; Buchmann, N.; Gilmanov, T.; Granier, A.; et al. On the Separation of Net Ecosystem Exchange into Assimilation and Ecosystem Respiration: Review and Improved Algorithm. Glob. Chang. Biol. 2005, 11, 1424–1439. [Google Scholar] [CrossRef]
- Anderson, R.G.; Wang, D.; Tirado-Corbalá, R.; Zhang, H.; Ayars, J.E. Divergence of Actual and Reference Evapotranspiration Observations for Irrigated Sugarcane with Windy Tropical Conditions. Hydrol. Earth Syst. Sci. 2015, 19, 583–599. [Google Scholar] [CrossRef] [Green Version]
- Anderson, R.G.; Wang, D. Energy Budget Closure Observed in Paired Eddy Covariance Towers with Increased and Continuous Daily Turbulence. Agric. For. Meteorol. 2014, 184, 204–209. [Google Scholar] [CrossRef]
- Leuning, R.; van Gorsel, E.; Massman, W.J.; Isaac, P.R. Reflections on the Surface Energy Imbalance Problem. Agric. For. Meteorol. 2012, 156, 65–74. [Google Scholar] [CrossRef]
- Melton, F.S.; Johnson, L.F.; Lund, C.P.; Pierce, L.L.; Michaelis, A.R.; Hiatt, S.H.; Guzman, A.; Adhikari, D.D.; Purdy, A.J.; Rosevelt, C.; et al. Satellite Irrigation Management Support With the Terrestrial Observation and Prediction System: A Framework for Integration of Satellite and Surface Observations to Support Improvements in Agricultural Water Resource Management. IEEE J. Sel. Top. Appl. Earth Obs. Remote Sens. 2012, 5, 1709–1721. [Google Scholar] [CrossRef]
- Eching, S. Technical Elements of CIMIS, the California Irrigation Management Information System; California Department of Water Resources: Sacramento, CA, USA, 1998.
- Allen, R.G.; Pereira, L.S.; Raes, D.; Smith, M. Crop Evapotranspiration: Guidelines for Computing Crop Water Requirements; Food and Agriculture Organization of the United Nations: Rome, Italy, 1998; ISBN 92-5-104219-5. [Google Scholar]
- Doorenbos, J.; Pruitt, W. Crop Water Requirements. FAO Irrigation and Drainage Paper 24; Land and Water Development Division, FAO: Rome, Italy, 1977. [Google Scholar]
- Campbell, G.S.; Campbell, C.S.; Cobos, D.R.; Crawford, L.B.; Rivera, L.; Chambers, C. Method A: Soil-Specific Calibrations for METER Soil Moisture Sensors; METER Group: Pullman, WA, USA; Available online: https://www.metergroup.com/environment/articles/method-a-soil-specific-calibrations-for-meter-soil-moisture-sensors/ (accessed on 15 August 2021).
- Czarnomski, N.M.; Moore, G.W.; Pypker, T.G.; Licata, J.; Bond, B.J. Precision and Accuracy of Three Alternative Instruments for Measuring Soil Water Content in Two Forest Soils of the Pacific Northwest. Can. J. For. Res. 2005, 35, 1867–1876. [Google Scholar] [CrossRef] [Green Version]
- Starr, J.; Paltineanu, I. Methods for Measurement of Soil Water Content: Capacitance Devices. In Methods Soil Anal., Part 4; Soil Science Society of America Book Series Number 5; Soil Science Society of America: Madison, WI, USA, 2002; pp. 463–474. [Google Scholar]
- Hilhorst, M.A. A Pore Water Conductivity Sensor. Soil Sci. Soc. Am. J. 2000, 64, 1922–1925. [Google Scholar] [CrossRef] [Green Version]
- Anderson, R.G.; Tirado-Corbalá, R.; Wang, D.; Ayars, J.E. Long-Rotation Sugarcane in Hawaii Sustains High Carbon Accumulation and Radiation Use Efficiency in 2nd Year of Growth. Agric. Ecosyst. Environ. 2015, 199, 216–224. [Google Scholar] [CrossRef] [Green Version]
- Sanden, B.L.; Muhammed, S.; Brown, P.H.; Brown, K.A.; Snyder, R.L. Correlation of Individual Tree Nut Yield, Evapotranspiration, Tree Stem Water Potential, Total Soil Salinity and Chloride in a High Production Almond Orchard; ASABE: St. Joseph, MI, USA, 2014; p. 1. [Google Scholar]
- Scudiero, E.; Corwin, D.L.; Anderson, R.G.; Yemoto, K.; Clary, W.; Wang, Z.; Skaggs, T.H. Remote Sensing Is a Viable Tool for Mapping Soil Salinity in Agricultural Lands. Calif. Agric. 2017, 71, 231–238. [Google Scholar] [CrossRef] [Green Version]


| Site Name | Ameriflux Designation | Initial Salinity (dS/m) 1 | Size (ha) | Year Planted |
|---|---|---|---|---|
| Almond Salinity High | US-ASH | 2.2–4.1 | 81 | 1998 |
| Almond Salinity Medium | US-ASM | 1.8–3.5 | 53 | 2006 |
| Almond Salinity Low | US-ASL | 1.3–1.9 | 16 | 2010 |
| Pistachio Salinity High | US-PSH | 2.3–4.7 | 63 | 2006 |
| Pistachio Salinity Low | US-PSL | 1.1–2.1 | 16 | 2008 |
| Year | Season | Season Start | Irrigation (cm) | Rain (cm) | ETc (cm) | ETa (cm) | Irrigation + Rain (cm) | Apparent LF (−) |
|---|---|---|---|---|---|---|---|---|
| 2017 | F 16 | 15 October 2016 | 7.49 | 3.76 | 13.56 | 11.47 | 11.25 | −0.02 |
| W 17 | 15 December 2016 | 13.10 | 14.58 | 14.21 | 10.68 | 27.68 | 0.61 | |
| SP 17 | 15 March 2017 | 50.32 | 4.01 | 46.55 | 45.32 | 54.33 | 0.17 | |
| SU 17 | 15 June 2017 | 55.65 | 0.00 | 76.21 | 51.38 | 55.65 | 0.08 | |
| Annual | 2017 | 126.56 | 22.35 | 150.52 | 118.85 | 148.91 | 0.20 | |
| 2018 | F 17 | 15 September 2017 | 27.55 | 0.30 | 29.57 | 23.30 | 27.85 | 0.16 |
| W 18 | 15 December 2017 | 30.59 | 4.55 | 18.02 | 8.26 | 35.14 | 0.77 | |
| SP 18 | 15 March 2018 | 50.85 | 6.10 | 42.40 | 51.05 | 56.95 | 0.10 | |
| SU 18 | 15 June 2018 | 65.20 | 0.00 | 72.20 | 63.51 | 65.20 | 0.03 | |
| Annual | 2018 | 174.20 | 10.95 | 162.19 | 146.12 | 185.15 | 0.21 | |
| 2019 | F 18 | 15 September 2018 | 24.14 | 3.76 | 25.81 | 27.76 | 27.90 | 0.00 |
| W 19 | 15 December 2018 | 12.21 | 14.58 | 14.14 | 10.77 | 26.79 | 0.60 | |
| SP 19 | 15 March 2019 | 50.32 | 4.01 | 43.16 | 51.58 | 54.33 | 0.05 | |
| SU 19 | 15 June 2019 | 55.65 | 0.00 | 71.95 | 54.19 | 55.65 | 0.03 | |
| Annual | 2019 | 142.32 | 22.35 | 155.06 | 144.30 | 164.67 | 0.12 |
| Year | Season | Season Start | Irrigation (cm) | Rain (cm) | ETc (cm) | ETa (cm) | Irrigation + Rain (cm) | Apparent LF (−) |
|---|---|---|---|---|---|---|---|---|
| 2017 | F 16 | 15 October 2016 | 22.26 | 4.01 | 13.56 | 10.54 | 26.27 | 0.60 |
| W 17 | 15 December 2016 | 6.68 | 12.78 | 14.21 | 10.10 | 19.46 | 0.48 | |
| SP 17 | 15 March 2017 | 47.22 | 4.04 | 46.55 | 47.86 | 51.26 | 0.07 | |
| SU 17 | 15 June 2017 | 50.98 | 0.00 | 76.21 | 50.37 | 50.98 | 0.01 | |
| Annual | 2017 | 127.13 | 20.83 | 150.52 | 118.87 | 147.96 | 0.20 | |
| 2018 | F 17 | 15 December 2017 | 22.35 | 0.28 | 29.57 | 23.52 | 22.63 | −0.04 |
| W 18 | 15 December 2017 | 12.35 | 4.70 | 18.02 | 7.28 | 17.05 | 0.57 | |
| SP 18 | 15 March 2018 | 50.22 | 6.02 | 45.84 | 54.29 | 56.24 | 0.03 | |
| SU 18 | 15 June 2018 | 75.00 | 0.00 | 78.72 | 73.22 | 75.00 | 0.02 | |
| Annual | 2018 | 159.92 | 11.00 | 172.15 | 158.30 | 170.91 | 0.07 | |
| 2019 | F 18 | 15 September 2018 | 22.35 | 2.87 | 24.80 | 26.14 | 25.22 | −0.04 |
| W 19 | 15 December 2018 | 6.68 | 10.52 | 12.25 | 9.30 | 17.20 | 0.46 | |
| SP 19 | 15 March 2019 | 50.22 | 2.62 | 43.77 | 49.59 | 52.83 | 0.06 | |
| SU 19 | 15 June 2019 | 65.00 | 0.00 | 72.20 | 64.49 | 65.00 | 0.01 | |
| Annual | 2019 | 144.25 | 16.00 | 153.02 | 149.52 | 160.25 | 0.07 |
| Year | Season | Season Start | Irrigation (cm) | Rain (cm) | ETc (cm) | Eta (cm) | Irrigation + Rain (cm) | Apparent LF (−) |
|---|---|---|---|---|---|---|---|---|
| 2017 | F 16 | 15 October 2016 | 20.16 | 6.55 | 10.95 | 9.27 | 26.71 | 0.65 |
| W 17 | 15 December 2016 | 35.19 | 14.00 | 13.19 | 12.37 | 62.24 | 0.80 | |
| SP 17 | 15 March 2017 | 47.77 | 6.20 | 43.32 | 55.86 | 53.97 | −0.04 | |
| SU 17 | 15 June 2017 | 61.77 | 0.28 | 70.05 | 67.89 | 62.10 | −0.09 | |
| Annual | 2017 | 164.88 | 27.03 | 137.52 | 145.40 | 205.01 | 0.29 | |
| 2018 | F 17 | 15 September 2017 | 29.32 | 2.36 | 25.06 | 20.12 | 31.68 | 0.37 |
| W 18 | 15 December 2017 | 14.42 | 8.69 | 15.48 | 11.29 | 23.20 | 0.51 | |
| SP 18 | 15 March 2018 | 45.45 | 8.18 | 45.65 | 55.23 | 53.52 | −0.03 | |
| SU 18 | 15 June 2018 | 42.92 | 0.00 | 70.20 | 64.96 | 42.92 | −0.51 | |
| Annual | 2018 | 132.10 | 19.23 | 156.40 | 151.60 | 151.33 | 0.00 | |
| 2019 | F 18 | 15 September 2018 | 21.38 | 7.65 | 22.65 | 19.14 | 29.03 | 0.34 |
| W 19 | 15 December 2018 | 36.16 | 16.00 | 13.29 | 16.62 | 57.55 | 0.71 | |
| SP 19 | 15 March 2019 | 47.77 | 8.18 | 41.40 | 50.52 | 55.95 | 0.10 | |
| SU 19 | 15 June 2019 | 61.77 | 0.00 | 69.72 | 59.19 | 61.77 | 0.04 | |
| Annual | 2019 | 167.08 | 31.82 | 147.06 | 145.46 | 204.29 | 0.29 |
| Year | Season | Season Start | Irrigation (cm) | Rain (cm) | ETc (cm) | ETa (cm) | Irrigation + Rain (cm) | Apparent LF (−) |
|---|---|---|---|---|---|---|---|---|
| 2017 | F 16 | 15 October 2016 | 15.11 | 3.86 | 12.19 | 6.19 | 18.97 | 0.67 |
| W 17 | 15 December 2016 | 17.23 | 14.33 | 14.30 | 13.87 | 31.55 | 0.56 | |
| SP 17 | 15 March 2017 | 38.23 | 3.35 | 40.09 | 38.56 | 41.58 | −0.22 | |
| SU 17 | 15 June 2017 | 69.08 | 0.03 | 66.70 | 63.47 | 69.11 | 0.08 | |
| Annual | 2017 | 139.65 | 21.56 | 133.27 | 122.08 | 161.21 | 0.24 | |
| 2018 | F 17 | 15 September 2017 | 15.73 | 0.61 | 25.84 | 13.77 | 16.34 | 0.16 |
| W 18 | 15 December 2017 | 17.48 | 4.34 | 16.48 | 10.36 | 21.82 | 0.53 | |
| SP 18 | 15 March 2018 | 45.24 | 3.58 | 24.86 | 37.06 | 48.83 | 0.24 | |
| SU 18 | 15 June 2018 | 40.00 | 0.00 | 63.66 | 29.01 | 40.00 | 0.88 | |
| Annual | 2018 | 118.45 | 8.53 | 130.84 | 90.21 | 126.99 | 0.48 | |
| 2019 | F 18 | 15 September 2018 | 16.45 | 3.38 | 24.58 | 15.21 | 19.83 | 0.23 |
| W 19 | 15 December 2018 | 17.23 | 10.01 | 13.16 | 13.71 | 27.23 | 0.50 | |
| SP 19 | 15 March 2019 | 29.57 | 9.04 | 35.42 | 37.76 | 38.61 | 0.02 | |
| SU 19 | 15 June 2019 | 67.74 | 0.00 | 60.48 | 67.26 | 67.74 | 0.01 | |
| Annual | 2019 | 130.99 | 22.43 | 133.64 | 133.94 | 153.42 | 0.13 |
| Year | Season | Season Start | Irrigation (cm) | Rain (cm) | ETc (cm) | ETa (cm) | Irrigation + Rain (cm) | Apparent LF (−) |
|---|---|---|---|---|---|---|---|---|
| 2017 | F 16 | 15 October 2016 | 17.67 | 6.55 | 10.43 | 9.50 | 24.22 | 0.61 |
| W 17 | 15 December 2016 | 14.19 | 20.00 | 13.68 | 11.64 | 34.19 | 0.66 | |
| SP 17 | 15 March 2017 | 35.76 | 6.20 | 35.80 | 37.01 | 41.96 | 0.12 | |
| SU 17 | 15 June 2017 | 65.56 | 0.28 | 63.42 | 66.16 | 65.84 | 0.00 | |
| Annual | 2017 | 133.17 | 33.03 | 123.33 | 124.31 | 166.20 | 0.25 | |
| 2018 | F 17 | 15 September 2017 | 15.19 | 2.36 | 23.22 | 21.51 | 17.55 | −0.23 |
| W 18 | 15 December 2017 | 18.21 | 8.69 | 15.57 | 8.19 | 26.89 | 0.70 | |
| SP 18 | 15 March 2018 | 38.19 | 8.18 | 23.55 | 36.30 | 46.37 | 0.22 | |
| SU 18 | 15 June 2018 | 65.56 | 0.00 | 62.56 | 57.83 | 65.56 | 0.12 | |
| Annual | 2018 | 137.14 | 19.23 | 124.91 | 123.83 | 156.37 | 0.21 | |
| 2019 | F 18 | 15 September 2018 | 17.67 | 7.65 | 22.29 | 24.74 | 25.31 | 0.02 |
| W 19 | 15 December 2018 | 14.19 | 21.39 | 14.83 | 11.22 | 35.58 | 0.68 | |
| SP 19 | 15 March 2019 | 35.76 | 8.18 | 35.34 | 34.85 | 43.94 | 0.21 | |
| SU 19 | 15 June 2019 | 65.56 | 0.00 | 63.85 | 70.91 | 65.56 | −0.08 | |
| Annual | 2019 | 133.17 | 37.21 | 136.30 | 141.71 | 170.38 | 0.17 |
Publisher’s Note: MDPI stays neutral with regard to jurisdictional claims in published maps and institutional affiliations. |
© 2021 by the authors. Licensee MDPI, Basel, Switzerland. This article is an open access article distributed under the terms and conditions of the Creative Commons Attribution (CC BY) license (https://creativecommons.org/licenses/by/4.0/).
Share and Cite
Helalia, S.A.; Anderson, R.G.; Skaggs, T.H.; Jenerette, G.D.; Wang, D.; Šimůnek, J. Impact of Drought and Changing Water Sources on Water Use and Soil Salinity of Almond and Pistachio Orchards: 1. Observations. Soil Syst. 2021, 5, 50. https://doi.org/10.3390/soilsystems5030050
Helalia SA, Anderson RG, Skaggs TH, Jenerette GD, Wang D, Šimůnek J. Impact of Drought and Changing Water Sources on Water Use and Soil Salinity of Almond and Pistachio Orchards: 1. Observations. Soil Systems. 2021; 5(3):50. https://doi.org/10.3390/soilsystems5030050
Chicago/Turabian StyleHelalia, Sarah A., Ray G. Anderson, Todd H. Skaggs, G. Darrel Jenerette, Dong Wang, and Jirka Šimůnek. 2021. "Impact of Drought and Changing Water Sources on Water Use and Soil Salinity of Almond and Pistachio Orchards: 1. Observations" Soil Systems 5, no. 3: 50. https://doi.org/10.3390/soilsystems5030050
APA StyleHelalia, S. A., Anderson, R. G., Skaggs, T. H., Jenerette, G. D., Wang, D., & Šimůnek, J. (2021). Impact of Drought and Changing Water Sources on Water Use and Soil Salinity of Almond and Pistachio Orchards: 1. Observations. Soil Systems, 5(3), 50. https://doi.org/10.3390/soilsystems5030050


