Article

Manure Application Timing and Tillage Influence on Nutrient Loss from Snowmelt Runoff

1
Department of Agriculture, Agribusiness and Environmental Science, Texas A&M University, MSC 228, 700 University Blvd, 1150 Engineering Ave. Kleberg Ag Room 113, Kingsville, TX 78363, USA
2
Soil Testing Laboratory, Plant Science Department, South Dakota State University, Plant Science-Box 2207A, Brookings, SD 57007, USA
3
Department of Agricultural and Biosystems Engineering, South Dakota State University, Ag Engineering 213, Brookings, SD 57006, USA
*
Author to whom correspondence should be addressed.
Soil Syst. 2021, 5(4), 67; https://doi.org/10.3390/soilsystems5040067
Submission received: 20 August 2021 / Revised: 4 October 2021 / Accepted: 20 October 2021 / Published: 1 November 2021

Abstract

:
Winter manure application contributes substantial nutrient loss during snowmelt and influences water quality. The goal of this study is to develop best management practices (BMPs) for winter manure management. We compared nutrient concentrations in snowmelt runoff from three dates of feedlot solid beef manure application (November, January, and March) at 18 tons ha−1 on untilled and fall-tilled plots. The manure was applied at a single rate. Sixteen 4 m2 steel frames were installed in the fall to define individual plots. Treatments were randomly assigned so that each tillage area had two control plots, two that received manure during November, two in January, and two in March. Snowmelt runoff from each individual plot was collected in March and analyzed for runoff volume (RO), ammonium-nitrogen (NH4-N), nitrate-nitrogen (NO3-N), total suspended solids (TSS), total Kjeldahl nitrogen (TKN), total phosphorus (TP), and total dissolved phosphorus (TDP). Snowmelt runoff concentrations and loads of NH4-N, TKN, TP, and TDP were significantly higher in runoff from manure application treatments compared to control. The concentration of NH4-N and loads of NH4-N and TDP were significantly (p = 0.05) greater (42%, 51%, and 47%, respectively) from untilled compared to fall-tilled plots. The November application significantly increased RO, NH4-N, and TDP concentrations and loads in the snowmelt runoff compared to January and March applications. Results showed that nutrient losses in snowmelt runoff were reduced from manure applications on snow compared to non-snow applications. The fall tillage before winter manure application decreased nutrient losses compared to untilled fields.

1. Introduction

Manure is an important source of plant nutrients for crop production [1] that improves soil quality by increasing organic matter, water infiltration, and soil productivity and reducing surface runoff [2,3]. However, over-applications of manure [4], winter applications [5], and applications based on crop nitrogen (N) needs [6,7] can result in nutrient loss from land to water. Land-applied manure contributes a significant amount of N and phosphorus (P) to the Gulf of Mexico. A computer model predicted that approximately 14% of the total nitrogen and 48% of the total phosphorus that reached the Gulf was from manure sources, contributing to hypoxia (lack of oxygen) [8]. In addition, the nutrient loss from applied manure and the over-enrichment of N and P in aquatic ecosystems may cause toxic algal blooms, loss of aquatic vegetation, and reduced biodiversity [9,10]. Therefore, nutrient loss to water bodies through land applications of manure can be significant, and proper manure management is vital in controlling the impairment of water resources and ecological damage. Approximately 45% of the soils in the United States freeze during winter [11]. The winter manure application guidelines and regulations differ worldwide with climatic and physiographic conditions. Most of the European countries prohibit manure application during winter. Canada, Australia, New Zealand, and the United States (US) have diverse regulations imposing different restrictions at state or provincial levels [12]. For instance, the current national standard on winter manure management guidelines in the US restrict winter manure application when a risk of runoff exists and if the land is saturated or frozen. Manure application on frozen soils greater than 9% slope must also include conservation practices [4]. Thus, generally, applying manure on frozen, snow-covered fields in winter is not recommended. However, winter manure application is still common in many Northern US states and Canadian provinces because of limited storage capacities in traditional concentrated animal feeding operations (CAFOs), lack of storage facilities in small farms, and more time available for manure application and spreading and to avoid soil compaction [4,13,14].
Management practices such as tillage affect snowmelt runoff and water quality and quantity and may reduce nutrient losses [15,16,17]. For instance, fall tillage before manure application creates surface roughness and depressions in fields, traps more water to reduce runoff nutrients, and alters the soil’s chemical and physical interactions with manure [18,19]. In contrast, no-till, with the smooth surface under frozen soils, can accumulate nutrients, decrease infiltration, and reduce the interaction between manure nutrients and soil particles, favoring more significant runoff and nutrient losses compared to conventional tillage [8,20,21,22]. Studies have shown that incorporating manure in the soil helps to reduce nutrient loss from the soil [19,20,23,24,25,26], possibly because of soil and manure nutrient interactions and increased surface roughness. However, tillage during the winter in the northern US states is not possible or practical due to frozen soil. Therefore, tillage in late fall before winter manure applications may be an option for the northern US states to reduce snowmelt runoff. Further, snowmelt runoff volume and rates play a vital role in nutrients and sediment loss. For example, Vliet et al. [27] reported 90–96% of total runoff volume and 39–80% of total annual soil loss in the Peace River Basin of British Columbia, and Xu et al. [28] found that 92.2% of total runoff was due to the initial snowmelt, resulting in a significant amount of gulley erosion in northeast China. Soil erosion and nutrient loss can cause significant agricultural and ecological problems such as the siltation of lakes, water quality issues, and eutrophication [29]. Singh et al. [30] studied the impact of winter manure spreading on surface runoff water quality and quantity in South Dakota (at three-watershed-scale) and found that nutrient runoff varied among the years and was mainly affected by landscape position. They also recommended further studies to understand the influence of snowmelt hydrology and management practices such as fall tillage and manure application timings on nutrient losses.
Manure applied at different times and snow depths affect snowmelt processes, the infiltration hydrology of soils, and manure application timing during winter and may show differences in nutrient losses. For example, higher runoff and nutrient loss from manure applied during fall (before snow) rather than in winter was reported by Young and Mutchler [19]. Some manure spreading studies (on both field and watershed scales) have shown greater nutrient losses from manure when applied during winter [5,31,32]. Other studies have reported higher nutrient loss if applied during late winter (thawing periods) and on top of the snow [33,34,35,36], while a few studies have indicated no differences in nutrient loss with manure application timing [9,37].
Because of the mixed results and limited studies on winter manure application timings, many producers still believe that winter spreading restrictions are based on common perceptions rather than scientific recommendations [4], and winter manure spreading relies mostly on the common sense of the applicators [13]. Additionally, management practices such as manure application rates, manure application timing, methods of applying manure, and their interactions with soils, topography, snowmelt hydrology, and weather are significant in controlling nutrient losses from agricultural fields [38]. However, there is limited literature identifying the impact of hydrology processes, specific management practices such as tillage prior to manure application, and risk of nutrient loss on snowmelt runoff from winter manure applications [4,17,39], and more research is needed to develop proper winter manure application guidelines and policy recommendations. This study hypothesizes that tillage in the fall (before manure application in winter) reduces snowmelt runoff sediment and nutrient loss and that applying manure in November increases snowmelt nutrient loss over January and March applications. Therefore, the project’s overall goal is to improve the understanding of tillage and manure application timings on nutrient loss during snowmelt runoff and develop BMPs for winter manure management. The specific objectives were to:
  • Determine the contributions of manure nutrients and snowmelt hydrology (soil moisture and temperature) to snowmelt runoff and nutrient loss.
  • Compare the effect of prior fall tillage and untilled fields on nutrient losses from subsequent manure applications.
  • Determine the influence of winter manure application timing (manure application before snow vs. manure applications on snow) on nutrient losses.

2. Materials and Methods

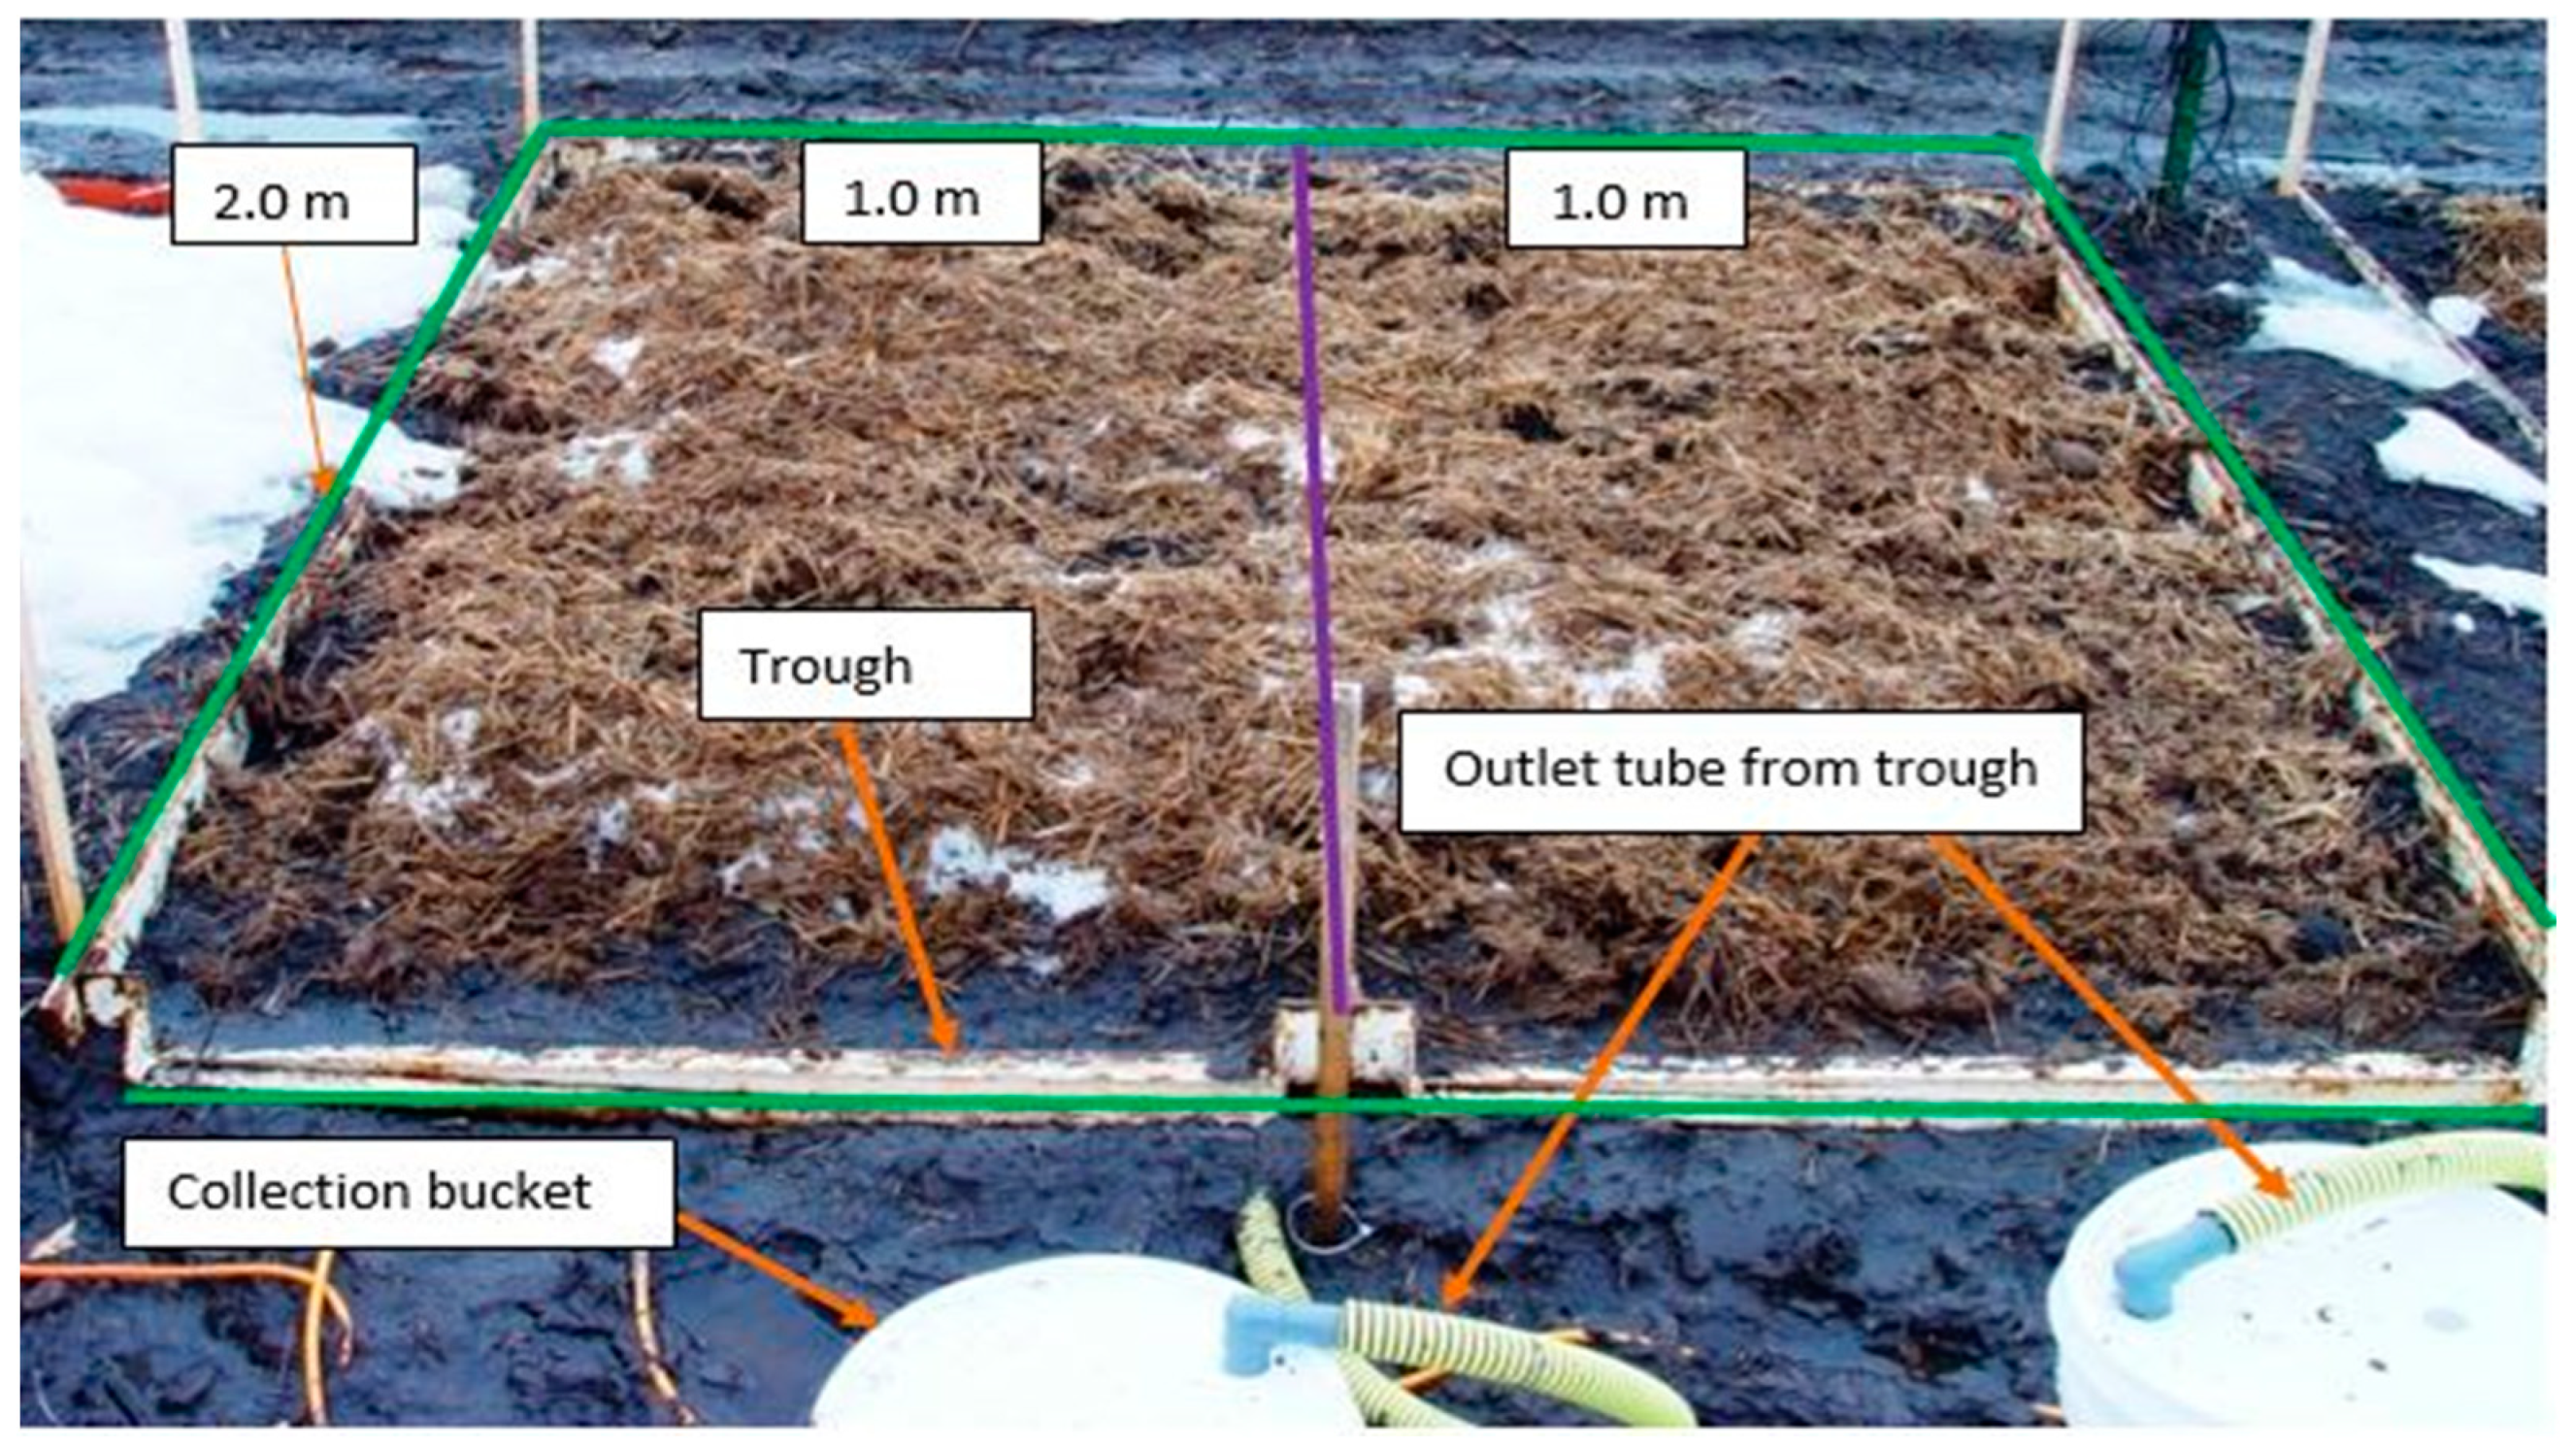
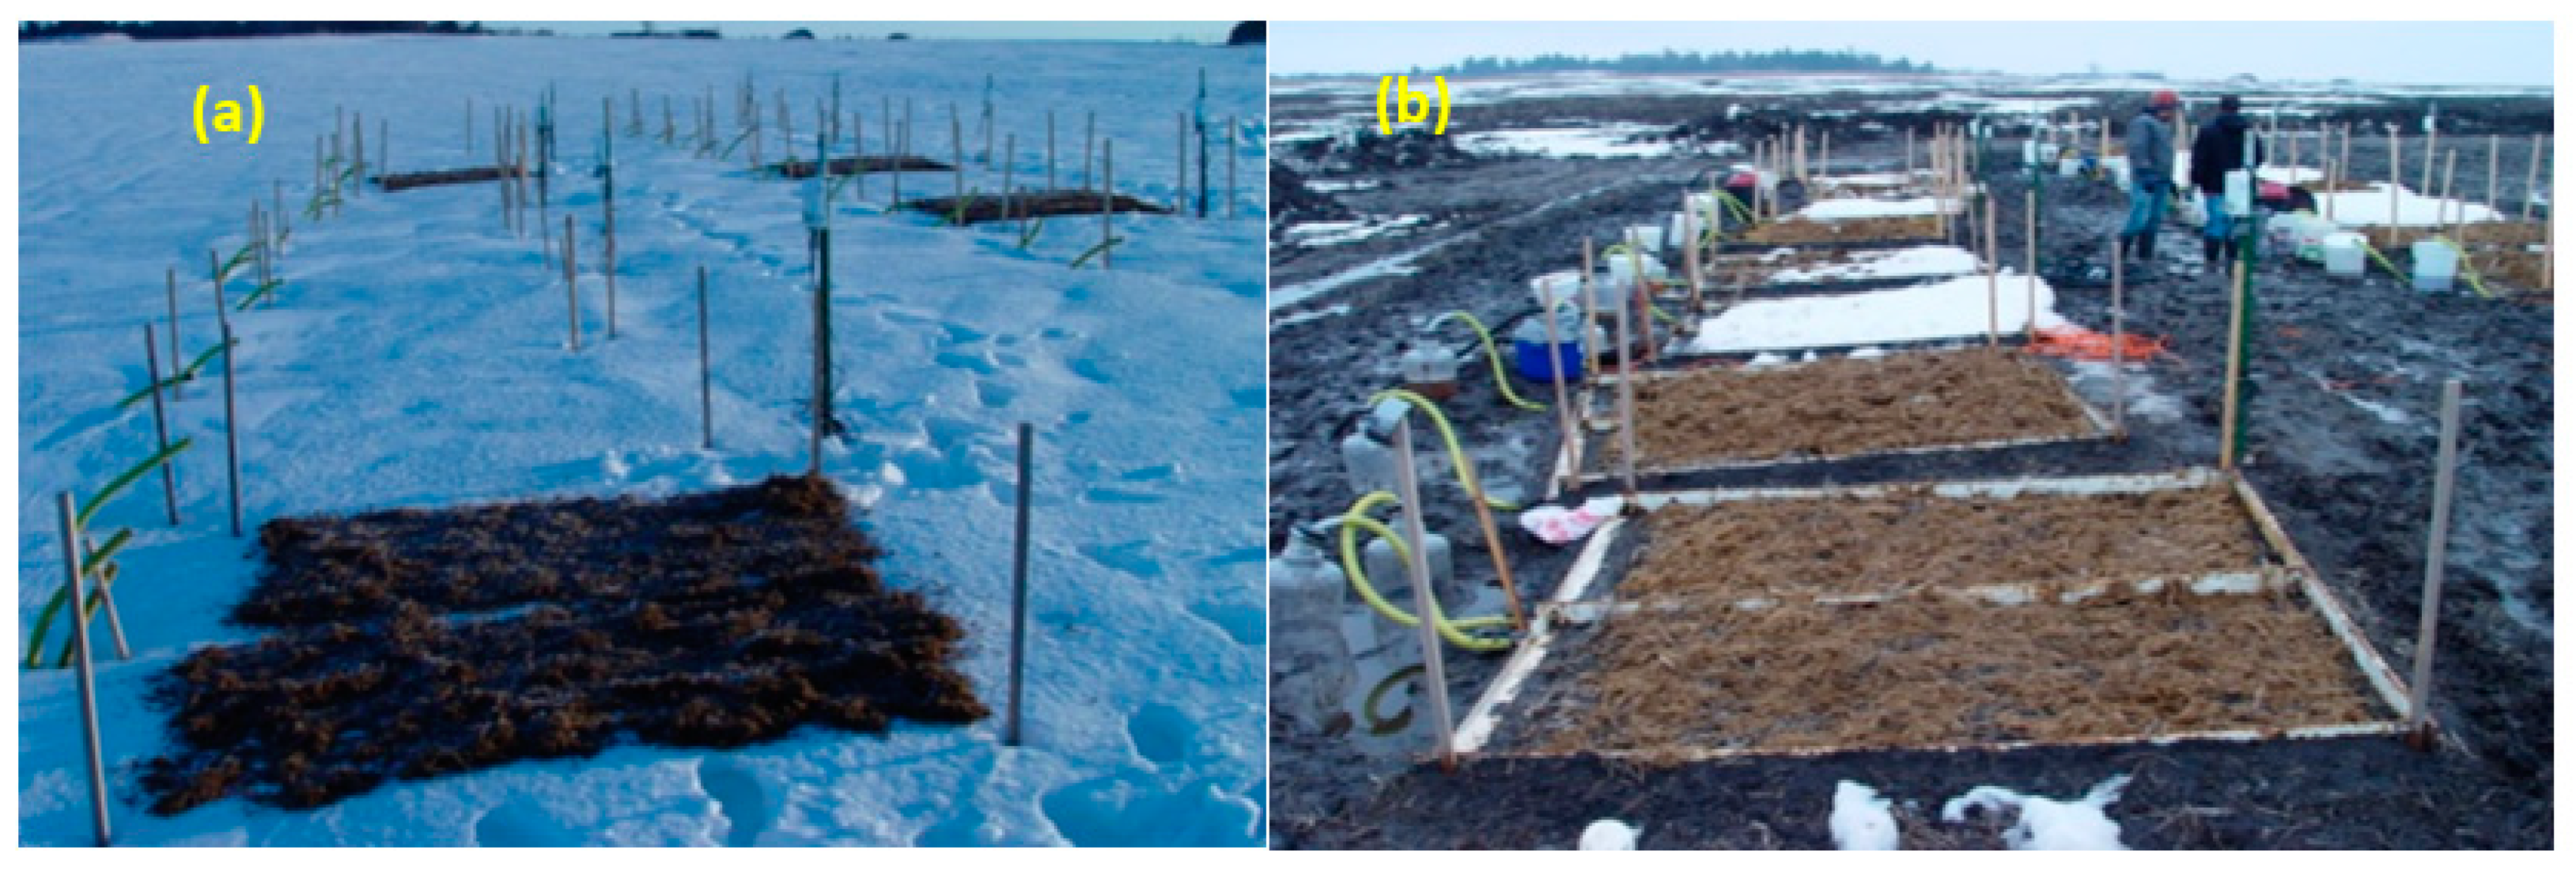
2.1. Experimental Design

A site near Brookings, South Dakota (USA), was selected for the study due to its uniform low soil test P, moderate slope (2–5%), and good drainage. The site was located on loamy soil with 34% sand, 42% silt, and 24% clay at 0–15 cm depth. Soil samples were collected from 0–15 and 15–51 cm depth using a core probe (50 mm diameter). The soil samples were air-dried, ground, sieved through a 2 mm mesh, and analyzed for soil pH, inorganic nitrate-nitrogen concentration (NO3-N), available P, bulk density, and soil texture (Table 1). The soil pH was measured in a 1:1 (soil:deionized water) extract with a pH meter. Inorganic N concentration was analyzed as the sum of KCl-extractable NO3-N in an autoanalyzer (Timberland Instruments, LLC, Boulder, CO). Available P concentration was analyzed by extracting 2.5 g soil with 50 mL 0.5 mol L–1 sodium bicarbonate and measuring the concentration with a spectrophotometer [40]. The soil texture was determined using the hydrometer method [41]. We determined the soil bulk density by collecting four undisturbed soil cores (2.3 cm diam. × 15 cm and 2.3 cm diam. × 51 cm) using a customized hand probe, oven drying samples at 110 °C for 24 h, and dividing the weight of the oven-dried sample by the volume of the core [42]. The organic matter, cation exchange capacity (CEC), and soil hydrologic group (SHG) were estimated using a soil web survey (https://websoilsurvey.sc.egov.usda.gov/App/HomePage.htm, accessed on 20 August 2021).
A field study was conducted to compare three dates of manure application on fall chisel-plowed (~8 inch depth) soybean (tilled) and on non-tilled soybean stubble (untilled). The tillage was done in fall (15 October 2009). The distance of the chisel (ridge interval) was 30 cm and hence created six chisels shanks (8 inches shovels) in each 2 m long plot. The orientation of the chisel rows was perpendicular compared to the slope and snowmelt collection gutter (Figure 1). After tillage, 16 steel frames of 4 m2 for runoff collection (8 on tilled plots and 8 on untilled plots) were installed to define 32 individual runoff plot areas. The experimental study design was a split plot with two replications and samples (from each individual plot), with two tillage as the main plot and the manure application date as the split. The individual plots were divided in the middle with a metal bar to keep the runoff samples separate and independent. The frames defined 2 individual plots, each of 2 m2, resulting in 32 individual plot samples. The frames were driven into the soil at about 10 cm deep, as per the guidelines of the National Phosphorus Research Project (NPRP, 2001) for simulated rainfall and surface runoff studies [43]. Soils in the inner sides of the frames were firmly hand-compacted after installation (about 10 cm deep) to control snowmelt seepage below the driven frames. Five cm of the frame was left above the soil surface to isolate surface runoff. Troughs were installed at the lower end of each frame to facilitate snowmelt runoff collection (Figure 1), following NPRP guidelines. Temperature and moisture sensors (EM50 data logger with a Decagon 5TM soil moisture sensor) were installed at 15.24 and 50.80 cm (hereafter referred to as “15 cm” and “51 cm” depths, respectively) below the soil surface. Temperature and moisture data were collected for the entire study period (October 2009 to March 2010) from all 32 plots. We calibrated the moisture and temperature data following standard procedures, as described in the user manual.
Solid beef manure was obtained from the South Dakota State University (SDSU) beef-finishing unit, Brookings, SD, for each manure application. Although the application rate was the same, the nutrient content of the manure was unique for each application date (Table 2). The total nitrogen rate was 223, 101, and 351 Kg ha−1, and the total phosphorus rate was 63, 33, and 56 Kg ha−1 for November, January, and March applications, respectively. The application rate selected for the study was based on the mass of feedlot manure commonly applied by producers in the region, i.e., 18-ton ha−1 (7.2 kg per 2 m−2 plots). The manure was thoroughly mixed, sub-sampled for analysis, weighed to the nearest 0.001 kg, and then surface-applied as a single rate by hand to each plot area in November, January and March. Each tillage treatment had eight control plots, eight that received manure in November, eight in January, and eight in March (Figure 2a,b).
The manure analysis results showed the March application had higher ammonium (NH4-N) and total nitrogen (TN), total phosphorus (TP), and dissolved phosphorus (DP) concentrations, but the loss in concentration was higher in the November application, which indicated that even though manure nutrient content was different in all three application timings, there was no effect of manure nutrient concentration on the results (Table 2).

2.2. Data Collection

Precipitation at Brookings for October 2009 (study initiation month) was 150 mm, which was approximately 4 times greater than the 30-year average of 45 mm. Precipitation from November 2009 through the conclusion of the study (March 2010) was very similar to the 30-year average. However, in January, the study area had 40.0 mm more precipitation than normal, mostly as snow (Figure 3). The first snowfall was recorded five days after the first manure application. No new snow was received in the area after the third application. Snowmelt began six days after the third application (i.e., 10 March 2010) and ceased on 18 March 2010. Snow core samples were taken during the January and March manure applications to determine snow depth and snow water content (Table 3). The first natural snowmelt runoff after the November manure application began on 10 March 2010, and runoff collection continued until 17 March 2010. Runoff for each individual plot (2 m2 area) was collected and analyzed separately. Snowmelt collected in a gutter was manually vacuumed (2–5 min intervals) using a wet vacuum and routed by plastic pipe to a 19 L container. Snowmelt runoff water was collected until all snow had melted and no further runoff occurred. Each day, the runoff collection started at ~6:00 AM in the morning and ended at ~8:00–8:30 PM. The overall air temperature during the snowmelt runoff collection period was low (~5 °C), with lower night temperatures causing no snowmelt runoff at night. There were enough people to continuously vacuum and collect snowmelt runoff water. Further, the plots did not produce snowmelt runoff at the same time; 10 plots produced runoff on the first day, while only 5 plots produced runoff on the last (seventh) day. Each day’s runoff volume from each plot was measured and termed as Day 1, Day 2, and Day 3, respectively. Snowmelt runoff samples were acidified (with 2 drops of 10% H2SO4), stored in a cooler with ice packs, and refrigerated before being delivered to Olsen Analytical Services Laboratory, South Dakota State University.
Snowmelt water samples were analyzed for ammonium-N (NH4-N), nitrate-N (NO3-N), total suspended solids (TSS), total Kjeldahl nitrogen (TKN), total P (TP), and total dissolved phosphorus (TDP) using the EPA 350.2 method, the SM 4110 B method, the EPA 351.3 (Nesslerization) method, the SM 2540 D method, and the SM 4500 B&E method, respectively (SMWW, 2017). Daily load (calculated as runoff volume area−1 × concentration) was calculated from daily runoff volume and concentrations for each sub-plot.

2.3. Statistical Analyses

Data were analyzed using the Proc GLM procedure in SAS 9.2 (SAS Institute NC, USA, 2008) [44]. Tillage was considered as a whole-plot factor, and manure application timings were sub-plot factors. Samples were collected from each individual plot, analyzed separately, and averaged. Two samples (two individual plot samples out of eight) from fall-tilled and untilled plots for November and January were discarded due to an error in manure application. Mean separation of treatment effects (where appropriate) was conducted using Fisher’s LSD test, and means were considered significantly different at p = 0.05.

3. Results and Discussion

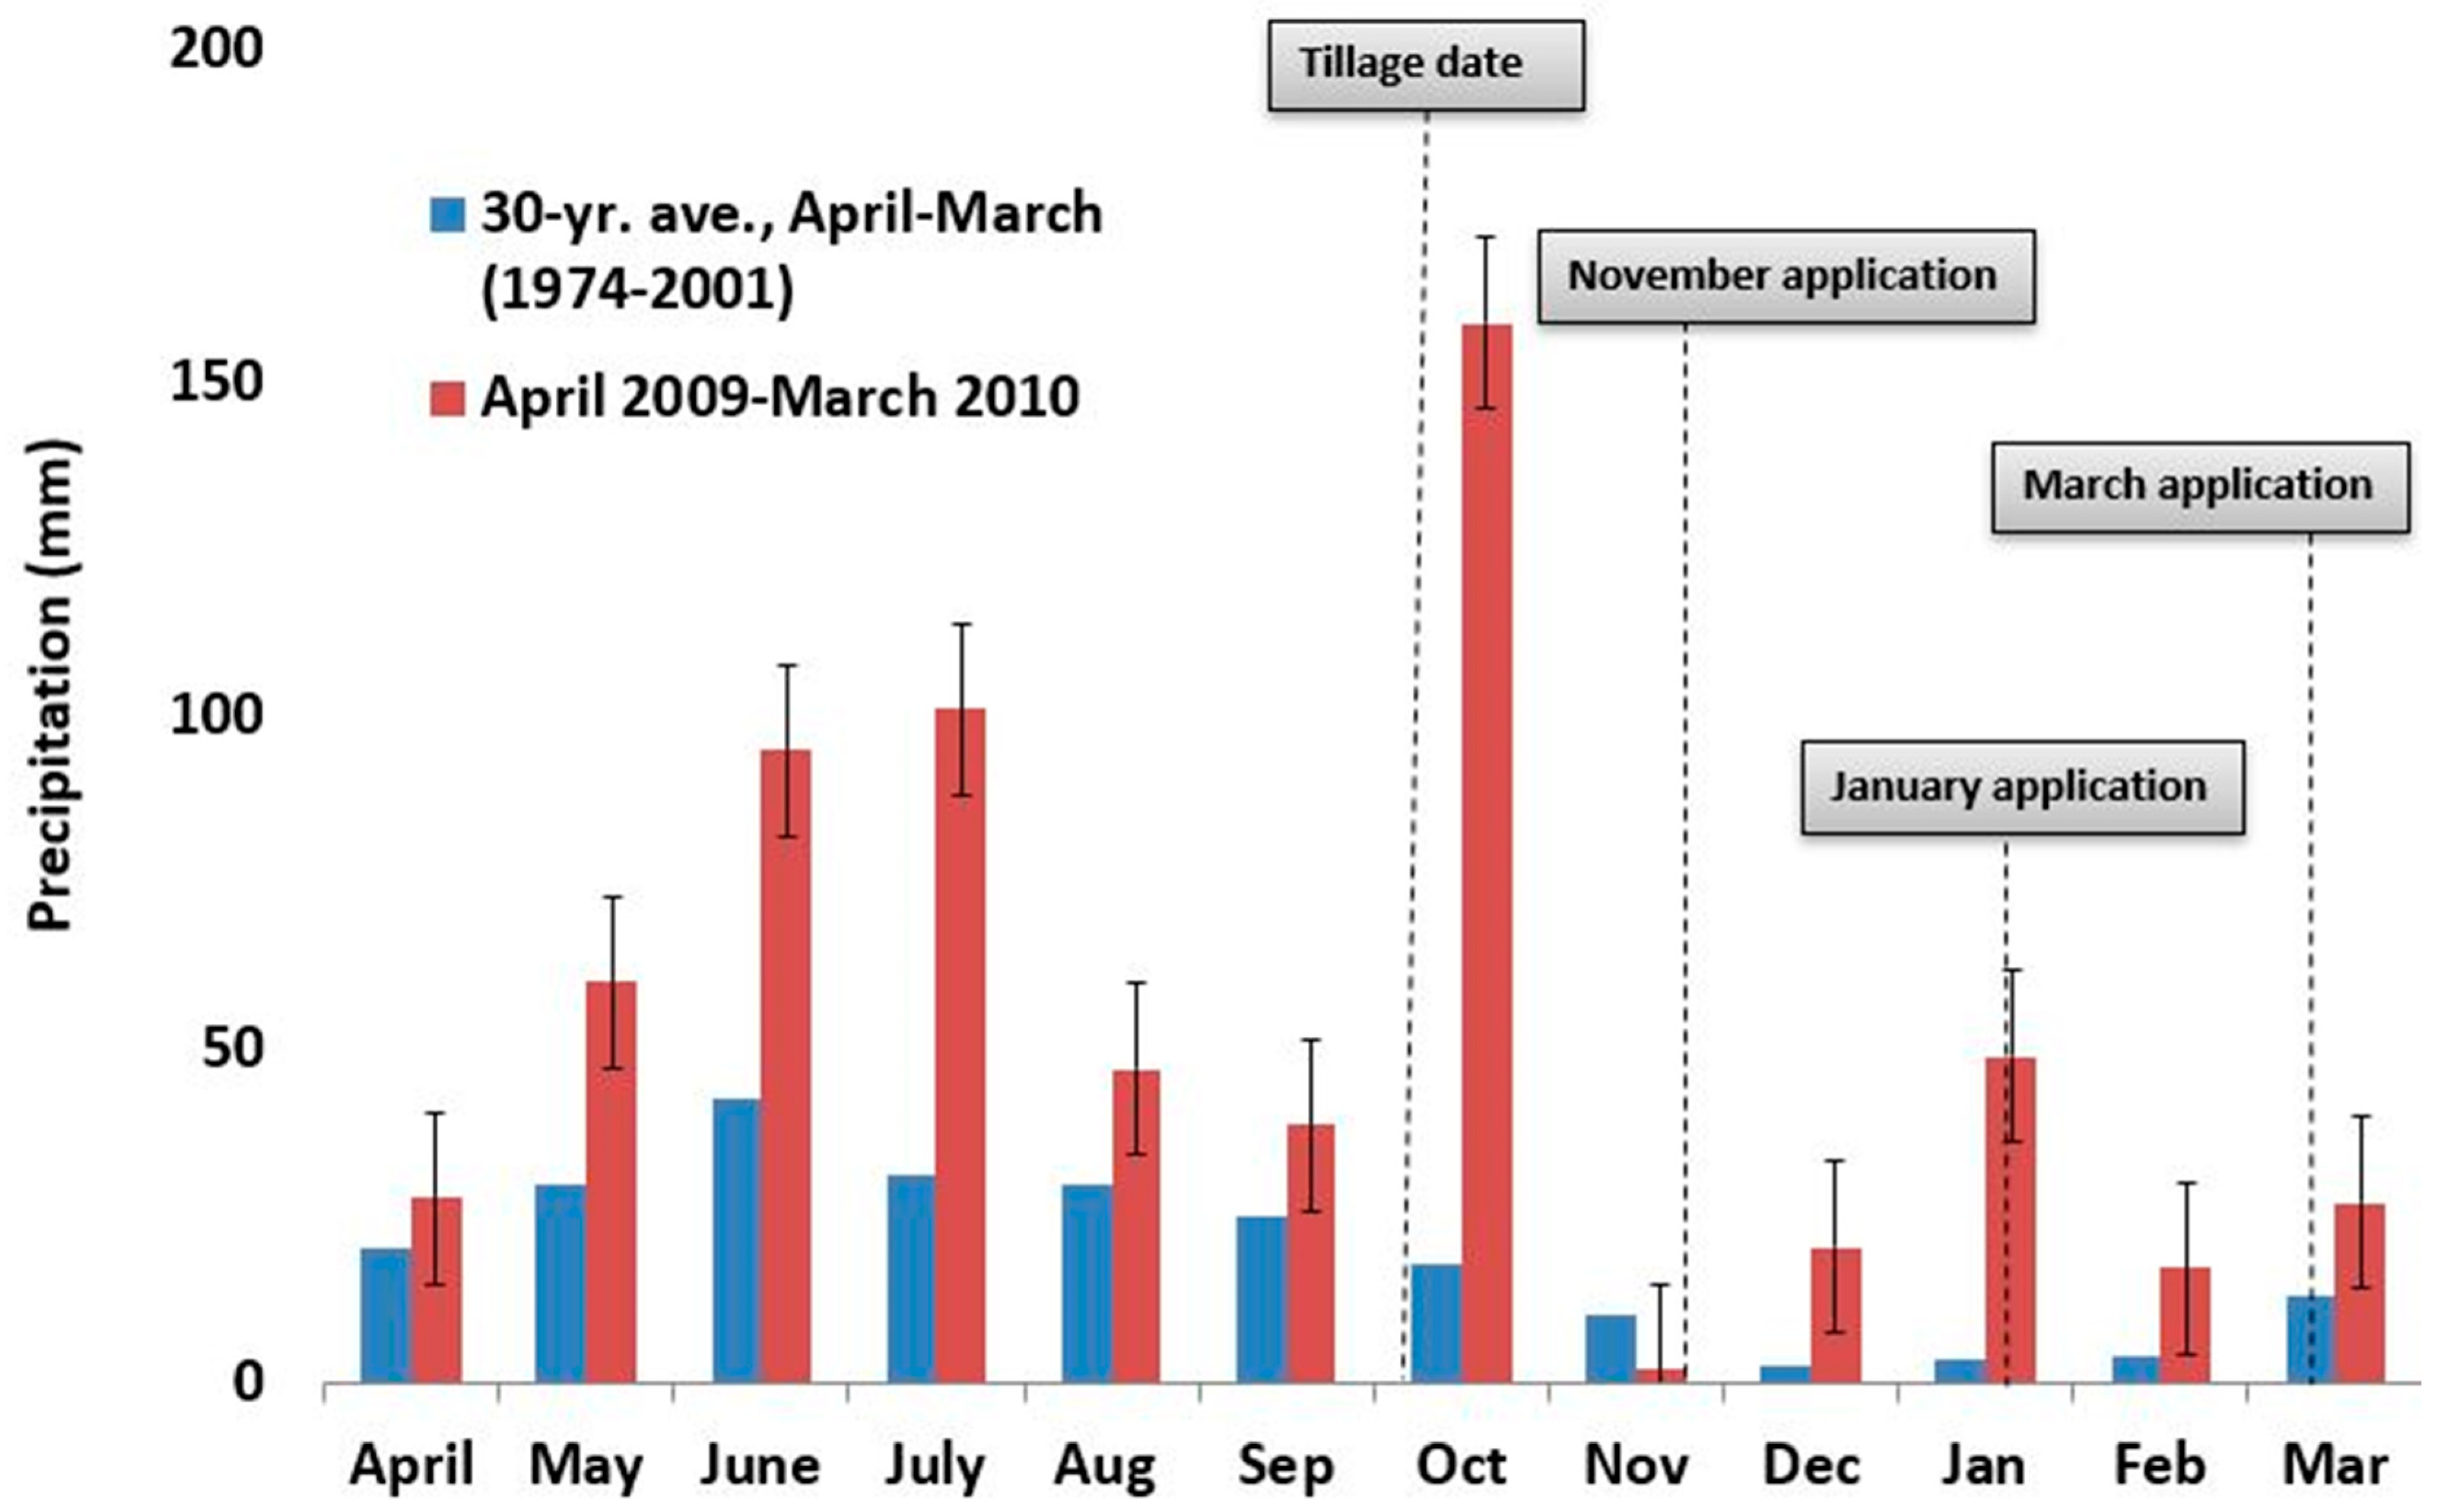
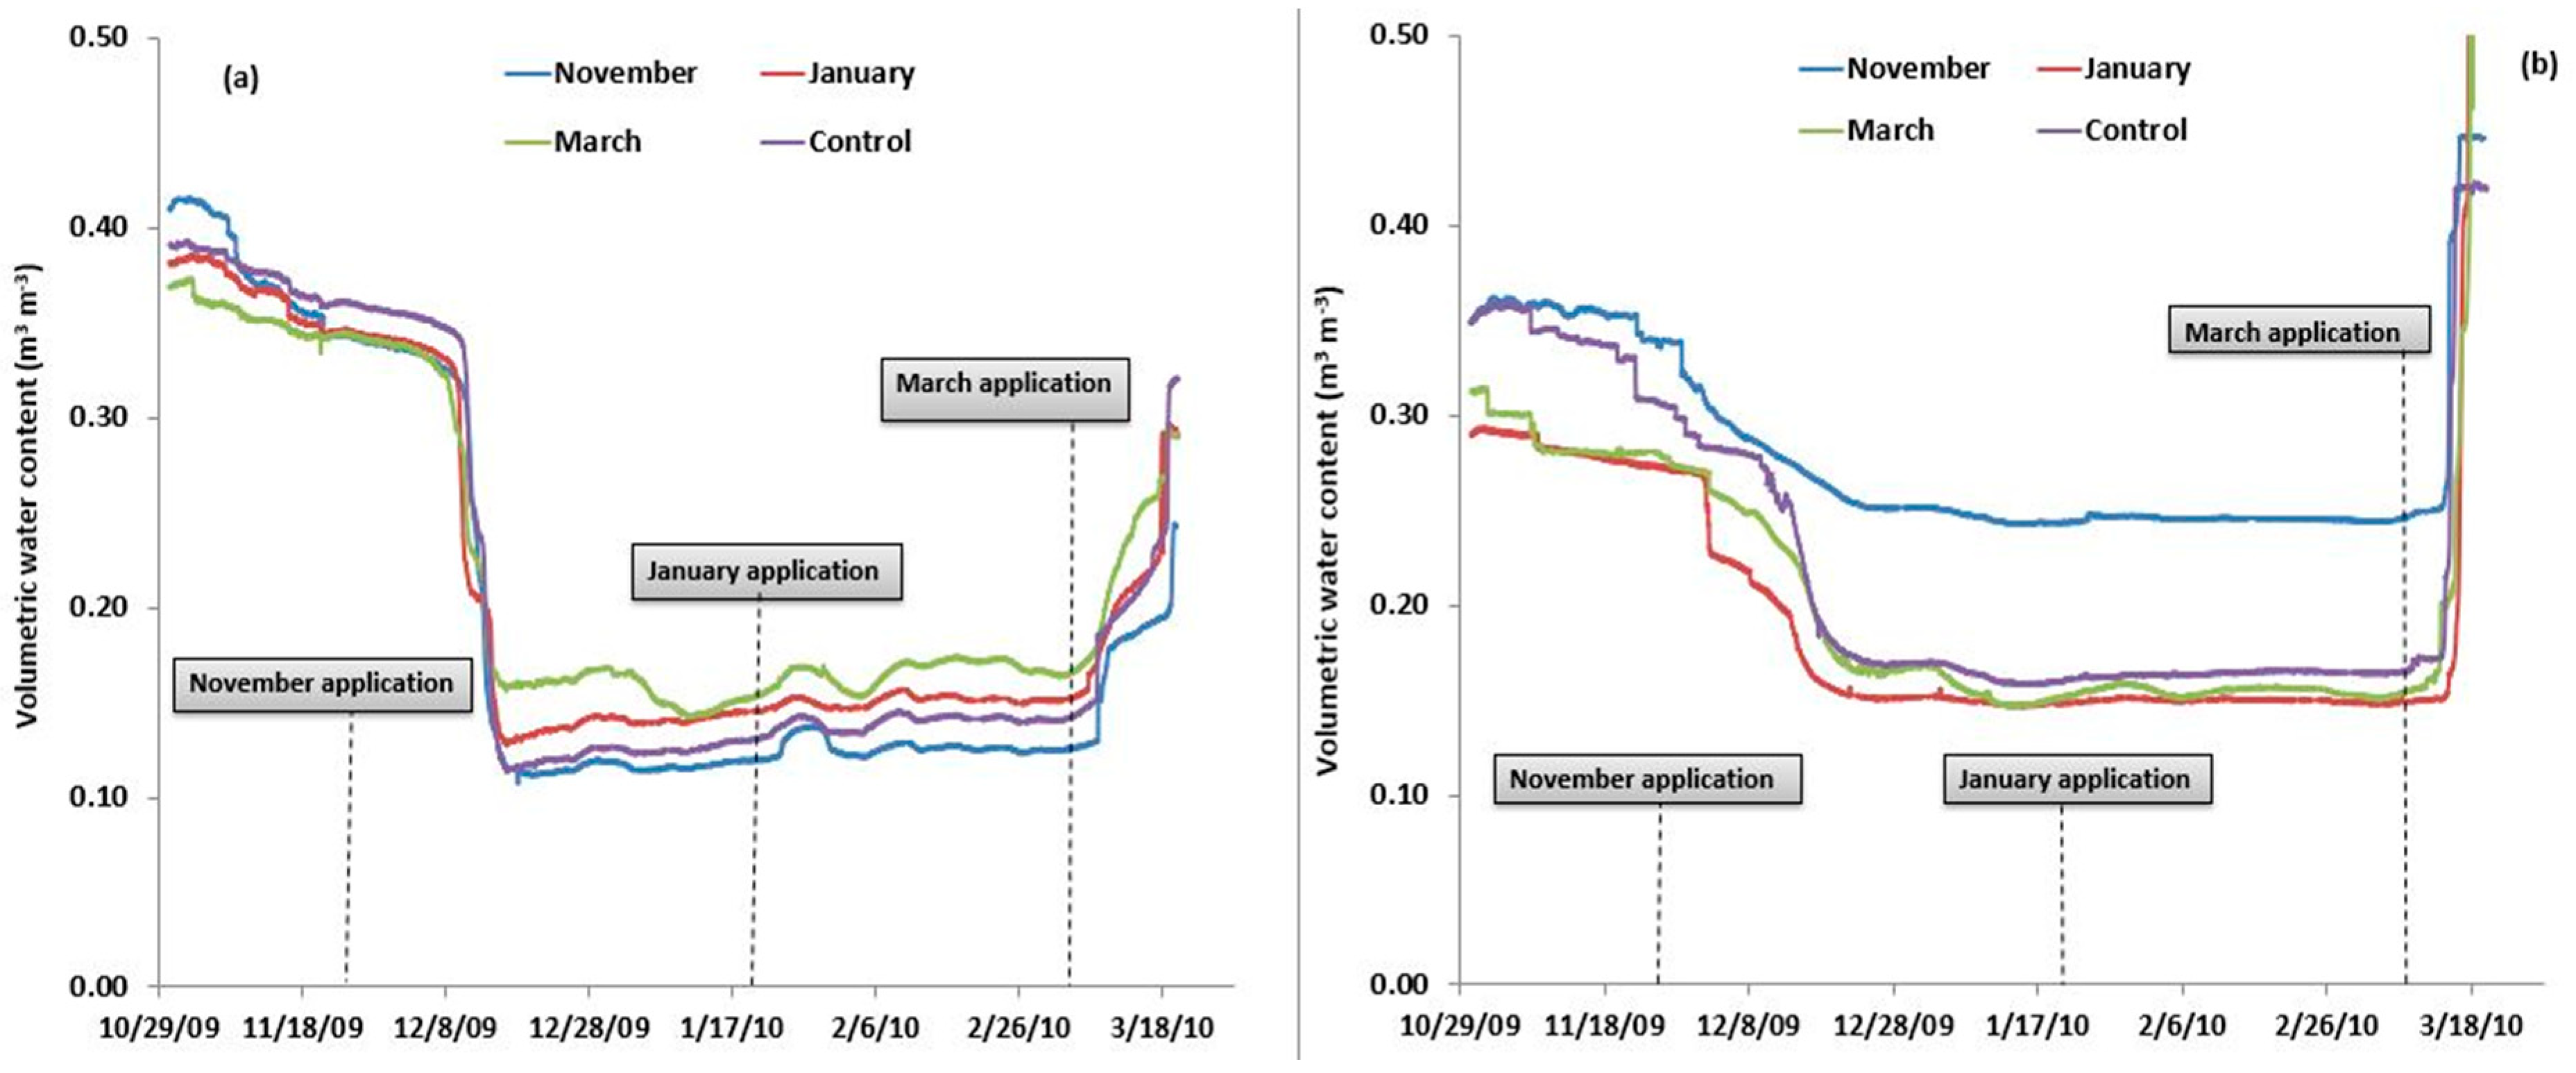
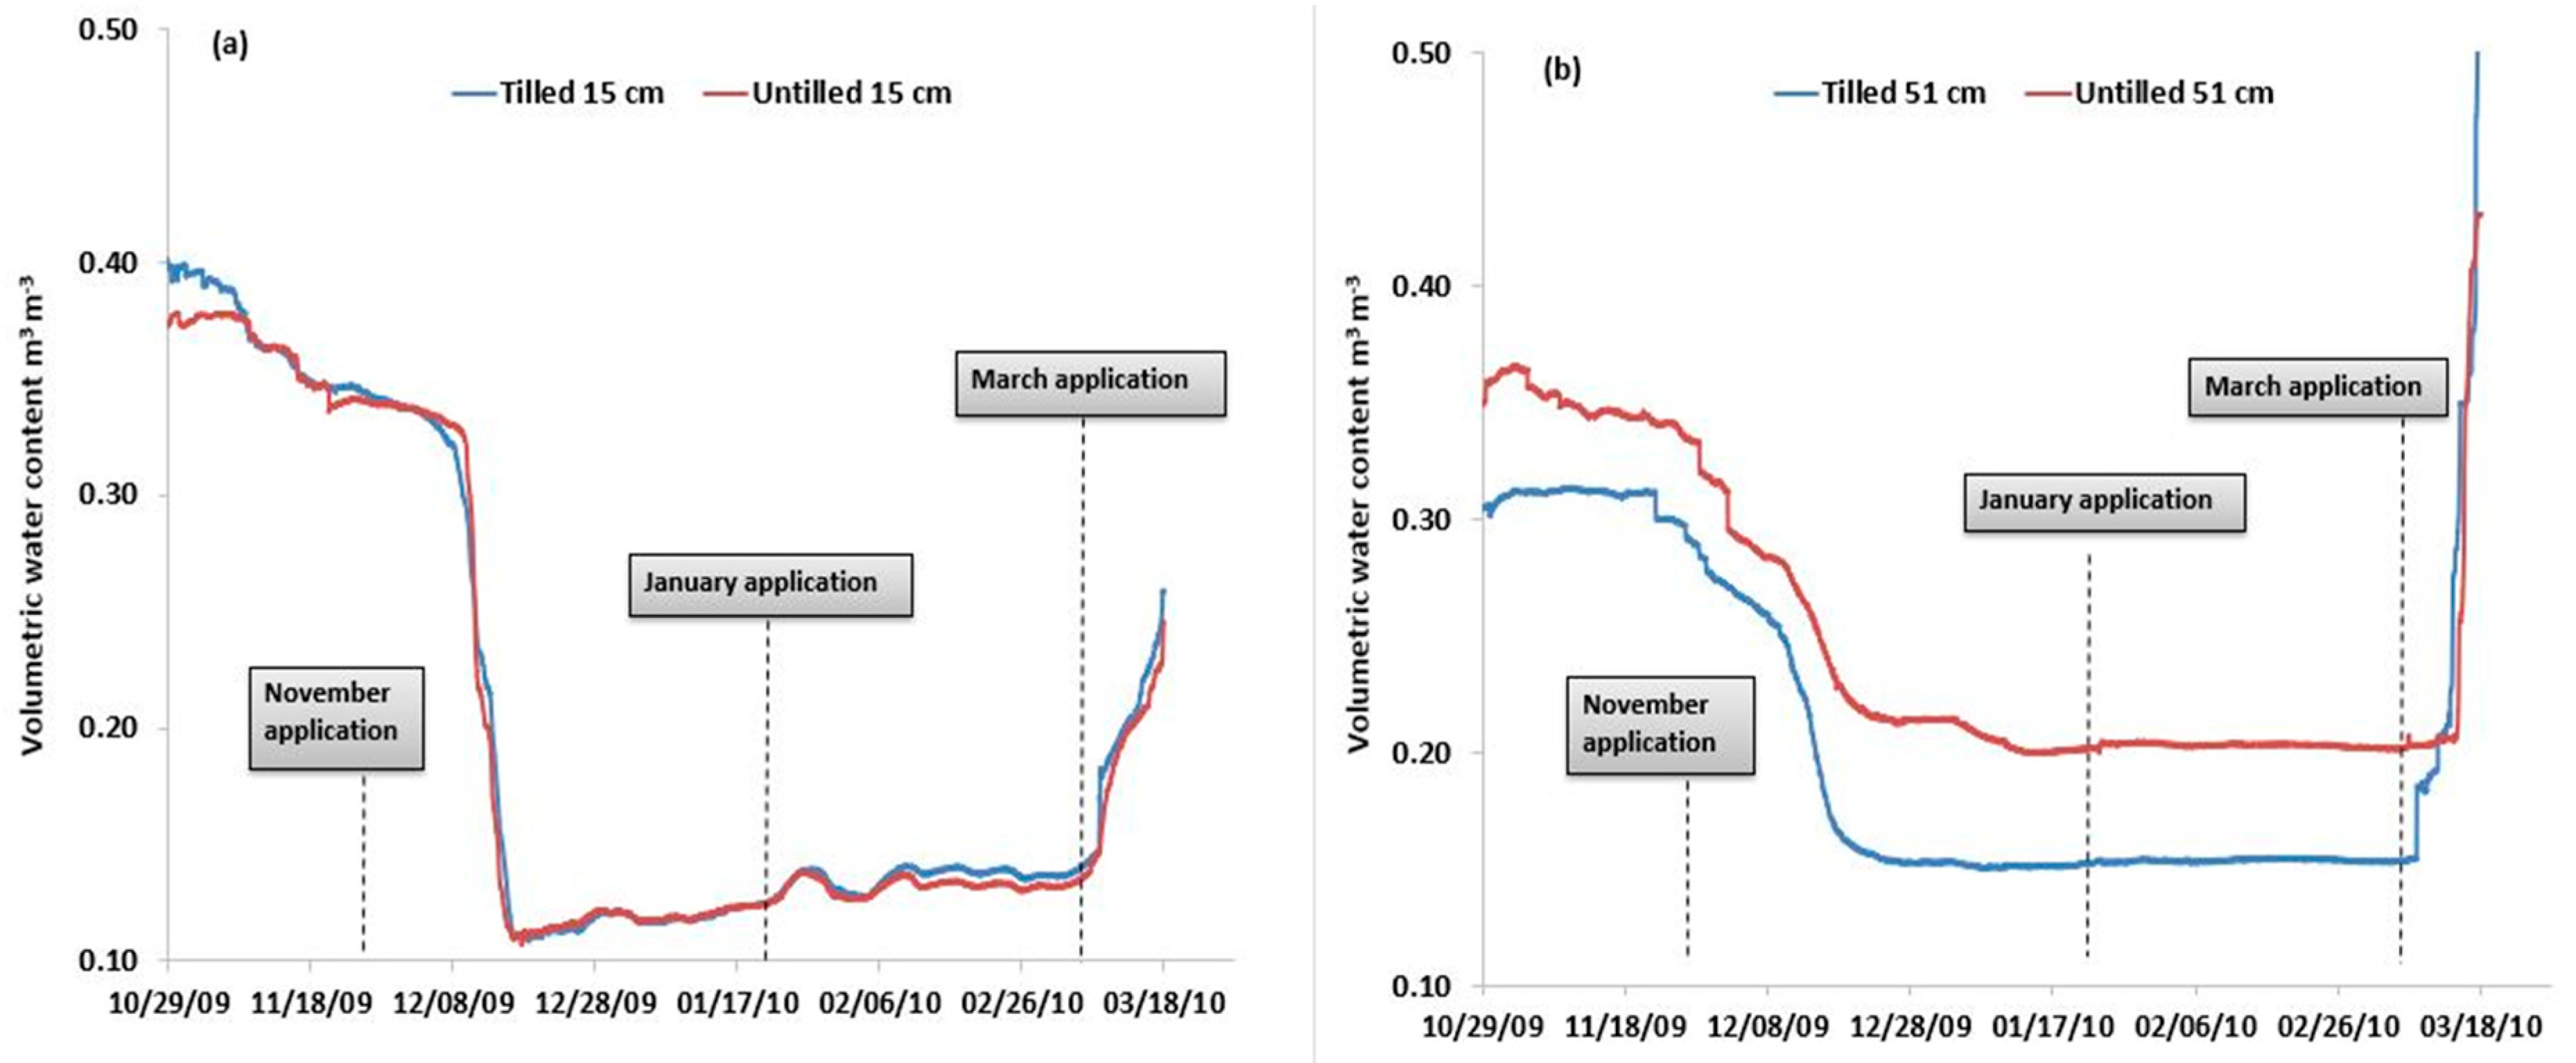
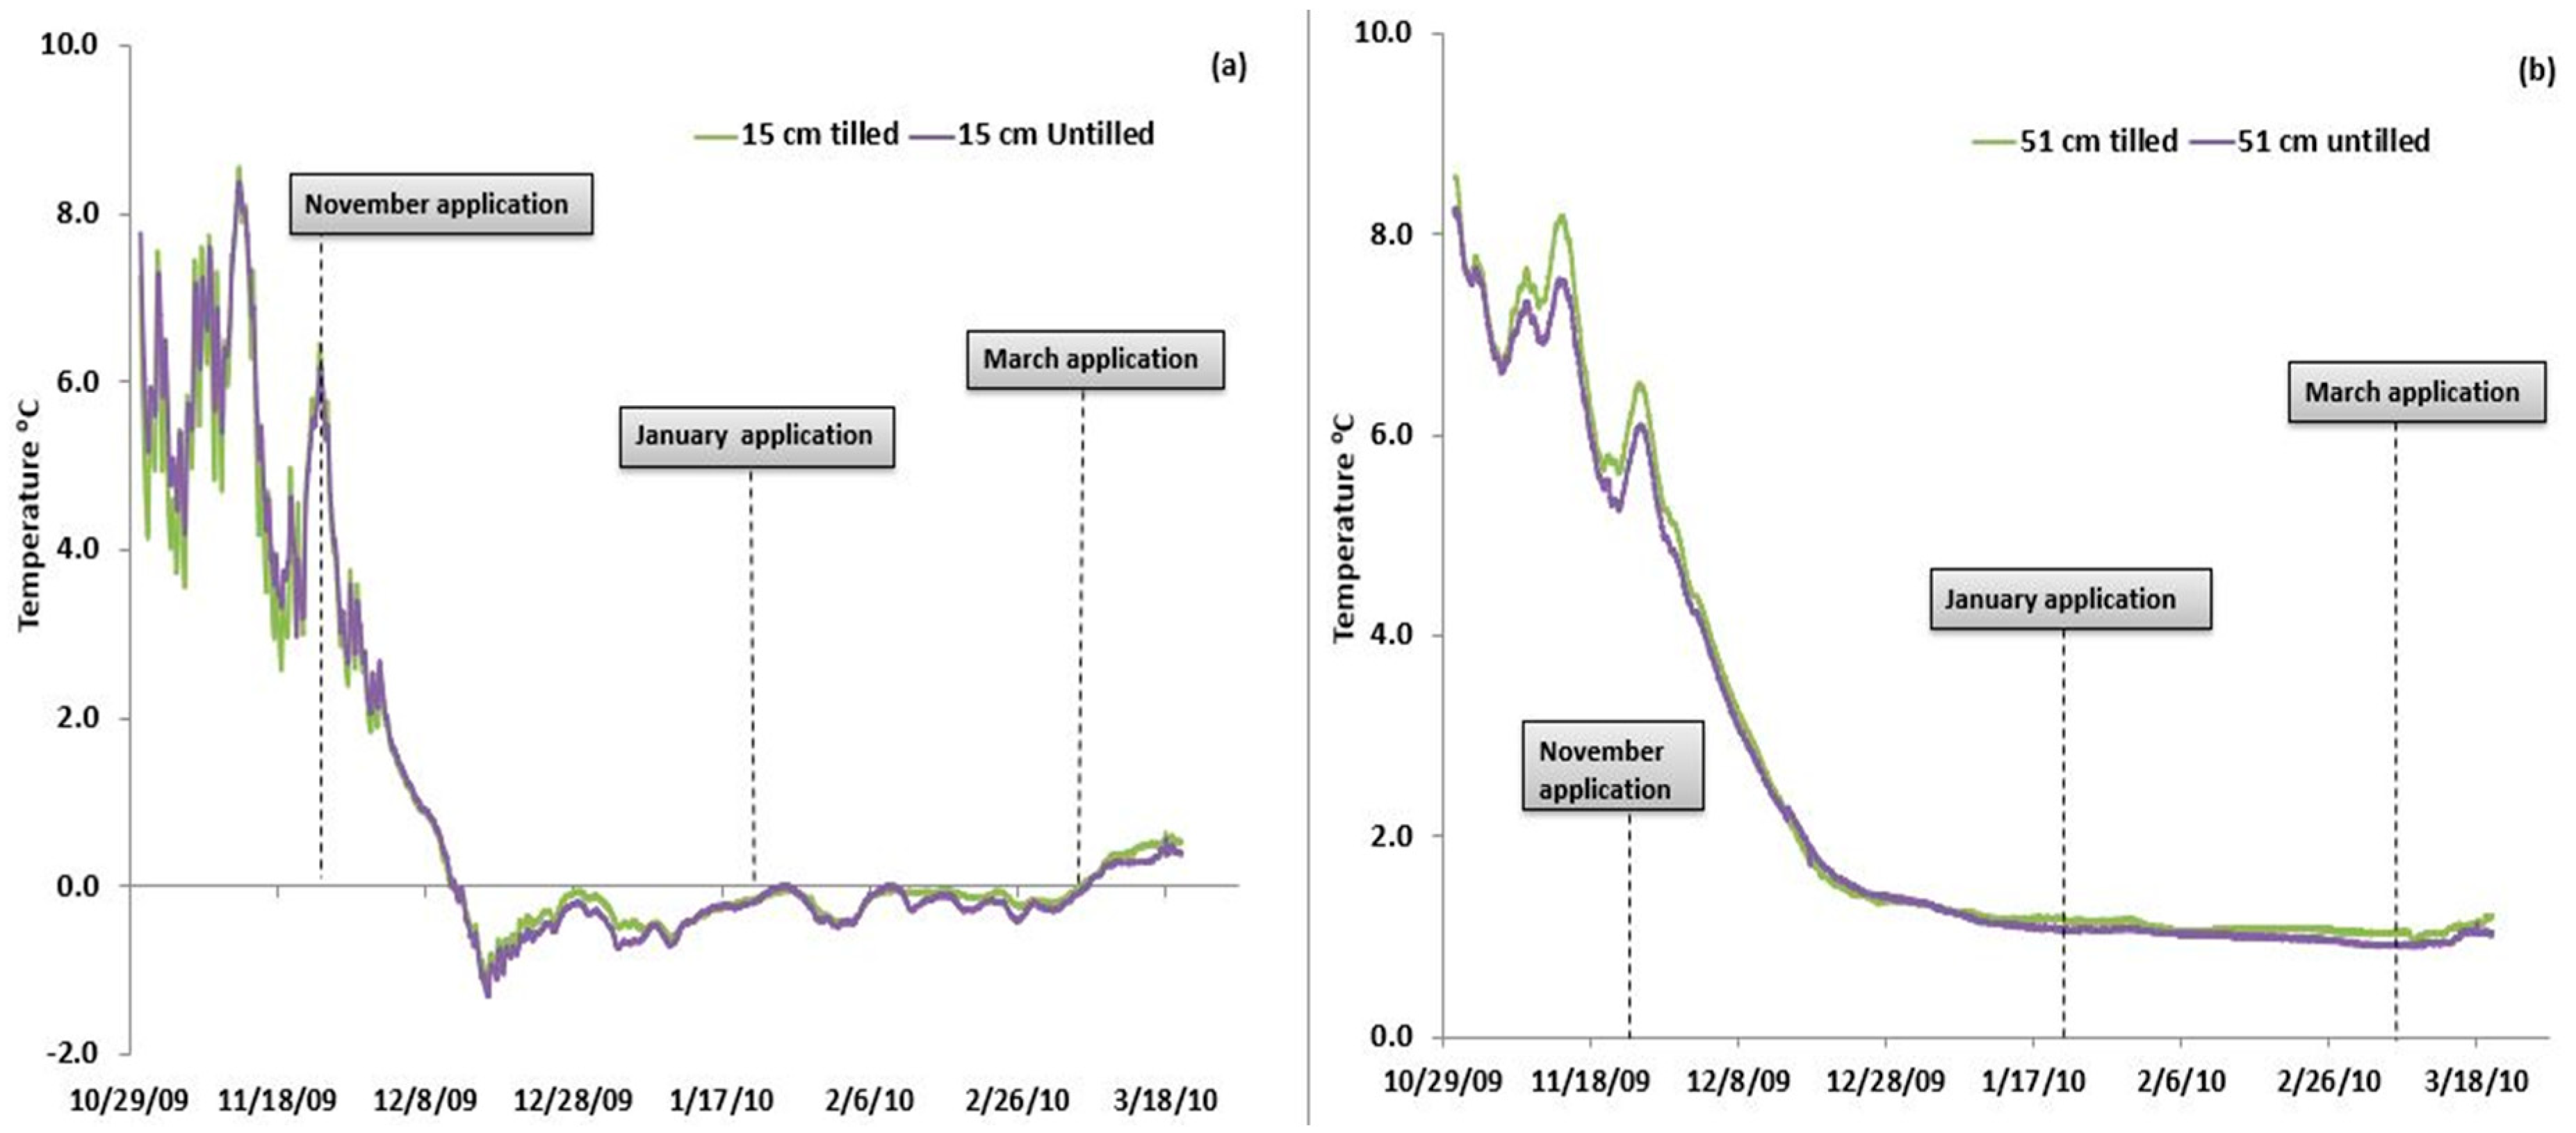
3.1. Hydrologic Processes and Temperatures

The snow depth was 15.2 cm at the time of runoff collection, yielding ~15 mm of snowmelt water. Additional precipitation of 25 mm during the snowmelt runoff period provided an average of 40.0 mm of water during the runoff collection. Fall tillage did not appear to influence soil moisture at 15 cm but influenced it at the 51 cm soil depth. The untilled treatment had slightly greater (0.19 m3 m−3) soil volumetric water content (VWC) than the tilled treatment (0.15 m3 m−3) (Figure 4a,b). The VWC was constant from late November through early March, indicating that no or very minimum in-season thawing occurred up to 51 cm depth (Figure 4a,b). The soil was literally frozen to the depth of 15 cm for the whole winter (Figure 4a).
The VWC was similar at 15 cm depth for all manure application dates (November, January, and March). The VWC was far greater at 51 cm depth in November compared to the January and March manure application dates (Figure 4a,b). The VWC was greater in the plots receiving manure in November (51 cm depth) from the beginning of the study and remained higher for the entire study (Figure 4b), which indicates variability in the soil moisture conditions for the study area. The frozen conditions for the topsoil layer (15 cm), coupled with greater VWC at the 51 cm depth in the November application, may have substantially decreased infiltration in these plots, resulting in higher runoff volumes (Table 3), because the soil moisture content at the time of freezing significantly influences the runoff loss [45,46,47]. Likewise, Komissarov and Gabbasova [29] reported that the freezing depth and moisture content before the establishment of snow determine the snowmelt runoff.
The VWC did not appear to be influenced by tillage at 15 cm depth. However, at 51 cm depth, the tilled plots had slightly greater VWC than untilled plots throughout the study (Figure 5a,b). Perhaps the abundant October rainfall (Figure 3) right after the tillage may have provided more moisture, resulting in more infiltration and storage in the tilled plots. The VWC for all tillage and manure application treatments increased drastically after 10 March 2010 with the start of snowmelt (Figure 5a,b), indicating that soil-thawing during snowmelt facilitated infiltration into the soil profile.
The average temperature at 15 cm fell to a near-freezing point by mid-December and remained near freezing until runoff began (Figure 6a,b). The soil temperature at 51 cm depth remained above freezing (~1 °C), but the maximum air temperature went below freezing for almost the entire study period (Figure 6 and Figure 7b). The air and soil temperatures at the upper soil surface (15 cm) indicated minimal or no thawing during the entire winter and could have influenced the overall runoff loss as infiltration may have been reduced on the frozen soils, leading to increased runoff [21,48].
Soil temperatures at 15 and 51 cm depths did not appear to be influenced by tillage and the timing of manure applications (Figure 7a,b). Other studies have shown similar results [14,49], indicating that increasing soil water content at the time of freezing decreases the infiltration rate of frozen soils. Soils frozen under high moisture created a concrete-like structure that is impermeable to water infiltration during runoff [36]. Nutrient loads and sediment loss vary, depending on the amount of runoff loss. Therefore, increasing infiltration and decreasing runoff loss are vital to minimizing nutrient and sediment loss during snowmelt runoff.

3.2. Tillage-Affected Runoff and Nutrient Loss

There were no significant differences in runoff volume (RO) between fall-tilled and untilled plots (Table 4). Ulen reported similar results for RO from plowed fields compared to unplowed plots in a natural snowmelt runoff study in Sweden [50]. Similar frozen conditions (soil temperature at 15 and 51 cm depths) for both treatments may have limited snowmelt infiltration into the soil regardless of tillage treatments because frozen soils affect both soil hydrology and snowmelt runoff [51]. There was no significant difference between tilled and untilled plots and no interactions of tillage with manure application timing for NO3-N, TKN, and TP and concentration or loads.
The fall tillage treatment before manure application significantly lowered NH4-N concentrations and loads in runoff compared to untilled plots (Table 4 and Table 5; Figure 8a,b). For example, the concentration of NH4-N was decreased by 105% and 84%, respectively, in November and January applications when tilled compared to untilled plots (Table 5). Perhaps the manure nutrients (especially NH4-N) interacted more with the exposed soil surface from fall tillage and held more NH4-N at the exchange sites compared to untilled soils. Likewise, the TDP load loss (kg ha−1) was significantly lower (~50%) with fall-tilled compared to untilled plots (Table 4 and Table 6). The TDP load was decreased by 175%, 433%, and 50%, respectively, in November, January, and March applications when tilled in the fall compared to untilled plots (Table 5). One reason for the relatively high TDP load loss with untilled plots was that manure was applied to bare soils without tillage and had less chance of interaction, leaving more manure P to runoff. Although the manure type was different (liquid manure), the result was in agreement with Stock et al. [52] in reducing the nutrient loads from winter manure applications with fall tillage (chisel plow), especially to reduce runoff volumes. Likewise, [19,53] reported greater total phosphorus and dissolved phosphorus with no-till compared to conventual tillage when manure was applied during frozen conditions.
There was a significant interaction of tillage and manure application date for TSS concentration but not for load (Table 4). The concentration (mg L−1) of TSS in snowmelt runoff substantially increased with later manure application for both fall-tilled and untilled treatments. However, the rate of increase was much less for the tilled plots compared to untilled plots (Table 4 and Table 6; Figure 8c). For example, the TSS losses from untilled January and March applications were 130 and 209 mg L−1 compared 75 and 96 mg L−1, respectively, from tilled November, January, and March applications (Table 5). The fall tillage created surface roughness, and the manure applied in close contact with soil during November could have held a greater portion of the suspended solids compared to untilled plots. Further, direct loss of suspended solids from manure when applied on top of snow could have contributed to greater TSS loss from manure-applied plots, regardless of the tillage.
Similar to these results, a number of runoff studies [23,25,26,54] have shown greater soluble nutrient losses from the surface application of manure under no-tillage and greater sediment losses with tillage. Other studies have shown greater soluble nutrient losses from the surface application of manure under no-tillage and higher sediment losses with tillage [18,24,55]. However, these studies were focused on comparing the incorporated vs. surface application of manure effects and its timing.
Manure application did not influence the runoff volume captured. As expected, the addition of manure significantly increased nutrient losses (both concentration and runoff loads) in snowmelt except for TSS and NO3-N loads (Table 4 and Table 6). Compared to the non-manure control, the concentration of NH4-N, TKN, and TDP were 8, 12, and 73 times higher, respectively, in snowmelt runoff from manure plots. Similar snowmelt study results have been reported [5,24,26,35].
The timing of manure applications significantly influenced snowmelt runoff volumes (RO), NH4-N, TKN, TSS concentrations, and NH4-N, NO3-N, TKN, TP, and TDP loads in the snowmelt runoff. The RO was significantly increased when manure was applied in November (before snow) compared to January and March dates when there was snow cover (Table 4 and Table 6). For example, the average runoff volumes measured on the first day of snowmelt collection in November, January, and March were 13.0, 10.0, and 9.3 (liter) L, respectively. Similarly, the corresponding values for the second day of snowmelt collection were 10.6, 4.9, and 4.2 L, respectively. This result may be due to the sealing of soil pores with manure solids that could have minimized infiltration during snowmelt, increasing runoff, but this is also related to differences in snowmelt hydrology on these plots, as described earlier.
While different in scale, the results were in agreement with higher runoff volumes (57% more) from fall-manured (before snow) alfalfa plots compared to spring-manured (above snow) corn plots [53]. Solid manure, when applied onto snow, acted as an insulator and slowed melting, resulting in more infiltration and less runoff [38], as in the case of the January and March applications in this study. Further, the rate of snowmelt was faster and the runoff volumes were greater for the first few days when manure was applied on top of snowpacks (March and January) compared to manure applied under snow (November). For example, the snowmelt runoff collection from March and January plots was completed within 4–5 days, whereas the snowmelt collection was extended up to the 6th or 7th day on November plots. The faster snowmelts and runoff from March and January, when manure was applied on top of snow, might be due to manure absorbing more solar radiation and acting as a heater to cause the snow to melt. Alterations in radiative energy fluxes of snowpack cause accelerated snowmelt runoff when liquid manure is applied on top of the snow [52]. In addition, the insulation effect of manure when applied on the top of the snow, delaying runoff, was not observed in our study, unlike in [38]. One of the primary reasons might be the application rates. For example, our manure application rate was 16 tons per acres. However, their rates were 45–100 tons per acre, which was ~3 to 5 times greater than this study.
Runoff NH4-N concentrations and loads (kg ha−1) were significantly greater from the November application than from the January and March applications (Table 4 and Table 5). The NH4-N concentrations measured for the first snowmelt collection from the November, January, and March applications were 6.9, 2.3, and 2.2 mg L−1, respectively. Likewise, the NH4-N concentrations measured for the second snowmelt from the November, January, and March applications were 4.9, 1.5, and 2.7 mg L−1, respectively. After the manure was applied on 28 November 2009, about 3 cm of snow was received 5 days later. The snow could have trapped the manure and limited ammonia volatilization, thus providing more NH4-N for runoff loss during snowmelt. Akbari et al. [56] reported the highest rates of ammonia volatilization loss within 24 h with surface-applied manure during winter, which can continue at lower rates after 120–150 h. In addition, snow acts as an insulator, and soil microbes might have converted more organic N to NH4-N due to increased soil contact; with the November application, mineralization can still proceed at low temperatures [57]. The accumulated NH4-N at the soil surface beneath the snow layer could have solubilized during the snowmelt runoff period. Snowmelt starts from the top of the snowpack, which might have washed the accumulated NH4-N from the November application, where manure was applied on top of the soil surface and was completely covered by snow. Further, higher runoff volumes with the November application may have resulted in higher NH4-N loss. The total amount of runoff water that had passed through the manure is significant in nutrient loss, and increased runoff may result in greater N loss [58,59].
Runoff TDP concentration, and load, were significantly greater from the November application than from the January and March applications (Table 4 and Table 5). The TDP concentrations measured on the first day of the snowmelt collection from the November, January, and March applications were 3.0, 2.0, and 2.0 mg L−1, respectively, which accounted for 89%, 85%, and 64% of the TP loss for November, January, and March, respectively. Likewise, the TDP concentrations measured on the second day of the snowmelt collection were 3.0, 1.3, and 1.9 mg L−1, respectively, which accounted 88%, 80%, and 73% of the TP loss for November, January, and March, respectively. The higher TDP load loss (kg ha−1) from the November application was most likely because of the higher runoff volume (23.6 L compared to 15.1 and 12.3 L, respectively). The decreased runoff volume decreased the concentrations of nutrient loss in the runoff [60]. The results indicated TP loss was most likely determined by the TDP loss in snowmelt runoff when manure was applied. Therefore, the snowmelt processes, runoff volume, and site hydrology are important factors with respect to winter manure management. In general, NH4-N, NO3-N, TP, and TDP runoff concentrations were higher for the November application, as in the case of the nutrient loads (Table 3).
These results are supported by Young and Mutchler [19], who suggested fall-applied manure would lay underneath melting snow and result in higher concentrations of nutrient loss as snowmelt runoff will pass directly over the layer of manure. In a lab study, greater NH4-N and TDP losses, with semi-solid manure applied on top of snow or in between the snow layers, were reported due to greater NH3 volatilization loss [53]. In contrast, [33,35] reported greater nutrient losses when manure was applied on top of melting snow, especially during the active thawing period. However, in this study, the manure was not applied on top of the melting snow during the active thawing period. Most nutrient concentration and load losses tended to be higher for the March application compared to the January application, although only TKN concentration was significantly higher.

4. Conclusions

Winter manure applications significantly increased nutrient loads and potential loss in snowmelt runoff compared to no manure application. The snowmelt runoff was greater with high soil volumetric water content in the sub-surface (51 cm depth), indicating site hydrology (moisture and temperature) is vital and needs to be considered in any winter manure nutrient loss study to understand the risk of water quality impairment by the runoff from frozen soils. It also indicated the importance of site snowmelt hydrology to understand better the winter manure application mechanisms and its potential risk to water quality. The November manure application resulted in a more significant loss of nutrients compared to the January and March applications. In a tillage system, nutrient losses in snowmelt runoff can be minimized by fall tillage before applying manure in late fall or winter. Therefore, the best management practice (BMP) implications for manure use in the Northern Great Plains suggest that fields with prior fall tillage should be utilized if winter manure applications are necessary. The results will help establish guidelines for potential winter manure applications for common management and climate concerns in the study areas. However, further studies that are conducted over two or more winters are needed to confirm these results in order to develop manure nutrient management guidelines and BMPs on winter manure applications. Further study is also needed to quantify the relationship between soil temperature, moisture content (site hydrology) at the time of freezing and melting, and the intensity of soil–manure interaction (fall tillage) to better understand the extensive risk of winter manure applications on water quality.

Author Contributions

A.B.B.: data curation, analysis, writing original draft, review, and corrections; R.G.: data analysis; D.G.: experiment set up and data collection; D.T.: data collection. All authors have read and agreed to the published version of the manuscript.

Funding

The work was partially supported by the Water Resources Institute of South Dakota State University, the USGS 104b program SDSU, the East Dakota Water Development District, and the South Dakota Farm Bureau.

Institutional Review Board Statement

Not applicable.

Informed Consent Statement

Not applicable.

Data Availability Statement

Not applicable.

Acknowledgments

The authors thank the soil testing lab staff at South Dakota State University. This project was funded through a grant from the Water Resources Institute USGS 104b program, the East Dakota Water Development District, and the South Dakota Farm Bureau.

Conflicts of Interest

The authors declare no conflict of interest.

References

  1. Shuyler, L.; Meek, J.W. EPA guidelines concerning agricultural manure management practices. In Dairy Manure Management; Cornell University: Ithaca, NY, USA, 1989; pp. 23–28. [Google Scholar]
  2. McDowell, R.W.; Biggs, B.J.F.; Sharpley, A.N.; Nguyen, L. Connecting phosphorus loss from agricultural landscapes to surface water quality. Chem. Ecol. 2004, 20, 1–40. [Google Scholar] [CrossRef]
  3. Smith, D.; Owens, P.; Leytem, A.; Warnemuende, E. Nutrient losses from manure and fertilizer applications as impacted by time to first runoff event. Environ. Pollut. 2007, 147, 131–137. [Google Scholar] [CrossRef] [PubMed]
  4. Srinivasan, S.M.; Bryant, R.B.; Callahan, M.P.; Weld, J.L. Manure management and nutrient loss under winter conditions: A literature review. J. Soil Water Conserv. 2006, 61, 200–206. [Google Scholar]
  5. Meals, D.W. Watershed-scale response to agricultural diffuse pollution control programs in Vermont, USA. Water Sci. Technol. 1996, 33, 197–204. [Google Scholar] [CrossRef]
  6. Miller, J.J.; Chanasyk, D.S.; Curtis, T.W.; Olson, B.M. Phosphorus and nitrogen in runoff after phosphorus- or nitrogen-based manure applications. J. Environ. Qual. 2011, 40, 949–958. [Google Scholar] [CrossRef]
  7. Sharpley, A.N. Dependence of Runoff Phosphorus on Extractable Soil Phosphorus. J. Environ. Qual. 1995, 24, 920–926. [Google Scholar] [CrossRef] [Green Version]
  8. Goolsby, D.A.; Battaglin, W.A.; Lawrence, G.B.; Artz, R.S.; Aulnbach, B.T.; Hooper, R.P.; Keeney, D.R.; Stensland, G.J. Flux and sources of nutrients in Mississippi Atchafalaya river basin: Topic 3 Report for the Integrated Assessment on Hypoxia in the Gulfof Mexico. In NOAA Coastal Ocean Program Decision Analysis Series; NOAA: Silver Spring, MD, USA, 1999; p. 130. [Google Scholar]
  9. Carpenter, S.R.; Caraco, N.F.; Correll, D.L.; Howarth, R.W.; Sharpley, A.N.; Smith, V.H. Nonpoint pollution of surface waters with phosphorus and nitrogen. Ecol. Soc. Am. 1998, 8, 559–568. [Google Scholar] [CrossRef]
  10. USEPA. Preventing Eutrophication: Scientific Support for Dual Nutrient Criteria; EPA 820-S015-001; USEPA: Washington, DC, USA, 2015.
  11. Formanek, G.E.; Muckel, G.B.; Evans, W.R. Conservation applications impacted by soil freeze-thaw. In Frozen Soil Impacts on Agricultural Range and Forest Lands, Proceedings of the International Symposium, Sponkane, WA, USA, 21–22 Marah 1990; Cooly, K.R., Ed.; CRREL Special Report 90-1; US. Army Cold Regions Research and Engineering Laboratory: Hanover, NH, USA, 1990; pp. 108–112. [Google Scholar]
  12. Liu, J.; Kleinman, P.J.A.; Aronsson, H.; Flaten, D.; McDowell, R.W.; Bechmann, M.; Beegle, D.B.; Robinson, T.P.; Bryant, R.B.; Liu, H.; et al. A Review of Regulations and Guidelines Related to Winter Manure Application. Ambio 2018, 47, 657–670. [Google Scholar] [CrossRef] [PubMed]
  13. Fleming, R.; Fraser, H. Impacts of Winter Spreading of Manure on Water Quality: Literature Review; Ridgetown College, University of Guelph: Ridgetown, ON, Canada, 2000; Available online: https://www.farmfoodcareon.org/wp-content/uploads/2019/02/Impacts-of-winter-spreading-on-water-quality.pdf (accessed on 20 August 2021).
  14. Liu, J.; Veith, T.L.; Collick, A.S.; Kleinman, P.J.A.; Beegle, D.B.; Bryant, R.B. Seasonal Manure Application Timing and Storage Effects on Field- and Watershed-Level Phosphorus Losses. J. Environ. Qual. 2017, 46, 1403–1412. [Google Scholar] [CrossRef] [PubMed]
  15. Liu, K.; Elliott, J.A.; Lobb, D.A.; Flaten, D.N.; Yarotski, J. Conversion of Conservation Tillage to Rotational Tillage to Reduce Phosphorus Losses during Snowmelt Runoff in the Canadian Prairies. J. Environ. Qual. 2014, 43, 1679–1689. [Google Scholar] [CrossRef] [PubMed]
  16. Liu, K.; Elliott, J.A.; Lobb, D.A.; Flaten, D.N.; Yarotski, J. Nutrient and Sediment Losses in Snowmelt Runoff from Perennial Forage and Annual Cropland in the Canadian Prairies. J. Environ. Qual. 2014, 43, 1644–1655. [Google Scholar] [CrossRef] [PubMed]
  17. Schneider, K.D.; McConkey, B.G.; Thiagarajan, A.; Elliott, J.A.; Reid, D.K. Nutrient Loss in Snowmelt Runoff: Results from a Long-term Study in a Dryland Cropping System. J. Environ. Qual. 2019, 48, 831–840. [Google Scholar] [CrossRef] [PubMed] [Green Version]
  18. Hansen, N.C.; Daniel, T.C.; Sharpley, A.N.; Lemunyon, J.L. The fate and transport of phosphorus in agricultural systems. J. Soil Water Conserv. 2002, 57, 408–417. [Google Scholar]
  19. Young, R.A.; Mutchler, C.K. Pollution Potential of Manure Spread on Frozen Ground. J. Environ. Qual. 1976, 5, 174–179. [Google Scholar] [CrossRef]
  20. Ismail, I.; Blevins, R.L.; Frye, W.W. Long-Term No-tillage Effects on Soil Properties and Continuous Corn Yields. Soil Sci. Soc. Am. J. 1994, 58, 193–198. [Google Scholar] [CrossRef]
  21. Ranaivoson, A.; Moncrief, J.; Hansen, N.; Gupta, S. Effect of fall tillage following soybeans on organic matter losses in snowmelt. Soil Tillage Res. 2005, 81, 205–216. [Google Scholar] [CrossRef]
  22. Vadas, P.A.; Stock, M.N.; Feyereisen, G.W.; Arriaga, F.J.; Good, L.W.; Karthikeyan, K.G. Temperature and Manure Placement in a Snowpack Affect Nutrient Release from Dairy Manure during Snowmelt. J. Environ. Qual. 2018, 47, 848–855. [Google Scholar] [CrossRef] [PubMed] [Green Version]
  23. Eghball, B.; Gilley, J.E. Phosphorus and Nitrogen in Runoff following Beef Cattle Manure or Compost Application. J. Environ. Qual. 1999, 28, 1201–1210. [Google Scholar] [CrossRef]
  24. Little, J.L.; Bennett, D.R.; Miller, J.J. Nutrient and Sediment Losses Under Simulated Rainfall Following Manure Incorporation by Different Methods. J. Environ. Qual. 2005, 34, 1883–1895. [Google Scholar] [CrossRef] [PubMed] [Green Version]
  25. Mueller, D.H.; Wendt, R.C.; Daniel, T.C. Soil and Water Losses as Affected by Tillage and Manure Application. Soil Sci. Soc. Am. J. 1984, 48, 896–900. [Google Scholar] [CrossRef]
  26. Young, A.R.; Holt, R.F. Winter applied manure: Effects on annual runoff, erosion, and nutrient movement. J. Soil Water Conserv. 1977, 35, 219–222. [Google Scholar]
  27. Van Vliet, L.J.P.; Hall, J.W. Effects of two crop rotations on seasonal runoff and soil loss in the Peace River region. Can. J. Soil Sci. 1991, 71, 533–543. [Google Scholar] [CrossRef] [Green Version]
  28. Xu, J.; Li, H.; Liu, X.; Hu, W.; Yang, Q.; Hao, Y.; Zhen, H.; Zhang, X. Gully Erosion Induced by Snowmelt in Northeast China: A Case Study. Sustainability 2019, 11, 2088. [Google Scholar] [CrossRef] [Green Version]
  29. Komissarov, M.A.; Gabbasova, I.M. Snowmelt-induced soil erosion on gentle slopes in the southern Cis-Ural region. Eurasian Soil Sci. 2014, 47, 598–607. [Google Scholar] [CrossRef]
  30. Singh, S.; Brandenburg, N.; Ahiablame, L.; Gongalez, A.; Kjaersgaard, J.; Trooien, T.P.; Kumar, S. Response of winter manure application on surface runoff water quantity and quality from small watersheds in South Dakota. Water Air Soil Pollut. 2017, 228, 389. [Google Scholar] [CrossRef]
  31. Hensler, R.F.; Olsen, R.J.; Witzel, S.A.; Attoe, O.J.; Paulson, W.H.; Johannes, R.F. Effect of Method of Manure Handling on Crop Yields, Nutrient Recovery and Runoff Losses. Trans. ASAE 1970, 13, 726–731. [Google Scholar] [CrossRef]
  32. Minshall, N.E.; Witze, S.A.; Nicholas, M.S. Stream enrichment from farm operations. J. Sanit. Eng. Div. 1970, 96, 513–524. [Google Scholar] [CrossRef]
  33. Klausner, S.D.; Zwerman, P.J.; Ellis, D.F. Nitrogen and Phosphorus Losses from Winter Disposal of Dairy Manure. J. Environ. Qual. 1976, 5, 47–49. [Google Scholar] [CrossRef]
  34. Lorimor, J.C.; Melvin, J.C. Nitrogen Losses in Surface Runoff from Winter Applied Manure; Final Report; University of Iowa: Iowa City, IA, USA, 1996. [Google Scholar]
  35. Midgley, A.R.; Dunklee, D.E. Fertility Runoff Losses from Manure Spread during the Winter; Agricultural Experiment Station, University of Vermont and State Agricultural College: Burlington, VT, USA, 1945; Volume 523, pp. 1–19. [Google Scholar]
  36. Zuzel, J.F.; Pikul, J.L., Jr. Infiltration into a seasonally frozen agricultural soil. J. Soil Water Conserv. 1987, 42, 447–450. [Google Scholar]
  37. Owens, L.B.; Bonta, J.V.; Shipitalo, M.; Rogers, S. Effects of Winter Manure Application in Ohio on the Quality of Surface Runoff. J. Environ. Qual. 2011, 40, 153–165. [Google Scholar] [CrossRef]
  38. Kongoli, C.E.; Bland, W.L. Influence of manure application and surface energy and snow cover: Field experiments. J. Environ. Qual. 2002, 31, 1166–1173. [Google Scholar] [CrossRef]
  39. Stock, M.N.; Arriaga, F.J.; Vadas, P.A.; Good, L.W.; Casler, M.D.; Karthikeyan, K.G.; Zopp, Z. Fall Tillage Reduced Nutrient Loads from Liquid Manure Application during the Freezing Season. J. Environ. Qual. 2019, 48, 889–898. [Google Scholar] [CrossRef] [PubMed] [Green Version]
  40. Olsen, S.R. Estimation of Available Phosphorus in Soils by Extraction with Sodium Bicarbonate; USDA: Washington, DC, USA, 1954.
  41. Gee, G.W.; Bauder, J.W. Particle Size Analysis by Hydrometer: A Simplified Method for Routine Textural Analysis and a Sensitivity Test of Measurement Parameters. Soil Sci. Soc. Am. J. 1979, 43, 1004–1007. [Google Scholar] [CrossRef]
  42. Blake, G.R.; Hartge, K.H. Bulk density. In Methods of Soil Analysis. Part 1: Physical and Mineralogical Methods; Klute, A., Ed.; ASA and SSSA: Madison, WI, USA, 1986; pp. 363–375. [Google Scholar]
  43. NPRP. National Research Project for Simulated Rainfall-Surface Runoff Studies Protocol. 2001. Available online: https://sera17dotorg.files.wordpress.com/2015/02/national-p-protocol.pdf (accessed on 20 August 2021).
  44. SAS Institute. The Products & Solutions / SAS® 9.2 Software; SAS Institute: Cary, NC, USA, 2008. [Google Scholar]
  45. Storey, H.C. Frozen soil and spring and winter floods. In Yearbook of Agriculture; U.S. Government Printing Press: Washington, DC, USA, 1955; pp. 179–185. [Google Scholar]
  46. Watanabe, K.; Kito, T.; Dun, S.; Wu, J.Q.; Greer, R.C.; Flury, M. Water Infiltration into a Frozen Soil with Simultaneous Melting of the Frozen Layer. Vadose Zone J. 2012, 12, 1–7. [Google Scholar] [CrossRef]
  47. Zuzel, J.F.; Pikul, J.L., Jr. Frozen soil runoff and soil erosion research in Northeastern Oregon. In Frozen Soils Impact on Agricultural, Range and Forest Lands; Cooley, K.R., Ed.; Cold Regional Research and Engineering Laboratory: Hanover, NH, USA, 1990; pp. 4–10. [Google Scholar]
  48. Ginting, D.; Moncrief, J.F.; Gupta, S.C.; Evans, S.D. Corn yield, runoff and sediment losses from manure and tillage systems. J. Environ. Qual 1998, 27, 1396–1402. [Google Scholar] [CrossRef]
  49. Willis, W.O.; Carlson, C.W.; Alessi, J.; Haas, H.J. Depth of Freezing And Spring Run-off As Related to Fall Soil-Moisture Level. Can. J. Soil Sci. 1961, 41, 115–123. [Google Scholar] [CrossRef]
  50. Ulén, B. Concentrations and transport of different forms of phosphorus during snowmelt runoff from an illite clay soil. Hydrol. Process. 2002, 17, 747–758. [Google Scholar] [CrossRef]
  51. Niu, G.-Y.; Yang, Z.-L. Effects of Frozen Soil on Snowmelt Runoff and Soil Water Storage at a Continental Scale. J. Hydrometeorol. 2006, 7, 937–952. [Google Scholar] [CrossRef]
  52. Stock, M.N.; Arriaga, F.J.; Vadas, P.A.; Karthikeyan, K. Manure application timing drives energy absorption for snowmelt on an agricultural soil. J. Hydrol. 2018, 569, 51–60. [Google Scholar] [CrossRef]
  53. Zopp, Z.P.; Ruark, M.D.; Thompson, A.M.; Stuntebeck, T.D.; Cooley, E.; Radatz, A.; Radatz, T. Effects of Manure and Tillage on Edge-of-Field Phosphorus Loss in Seasonally Frozen Landscapes. J. Environ. Qual. 2019, 48, 966–977. [Google Scholar] [CrossRef] [PubMed] [Green Version]
  54. Gupta, R.K.; Rudra, R.P.; Dickson, W.T.; Wall, G.J. Surface water quality impacts of tillage practices under liquid swine manure application. J. Am. Water Resour. Assoc. 1997, 33, 681–687. [Google Scholar] [CrossRef]
  55. Gilley, J.E.; Eghball, B. Runoff and erosion following field application of beef cattle manure and compost. Trans. ASAE 1998, 41, 1289–1294. [Google Scholar] [CrossRef]
  56. Akbari, P.; Herbert, S.; Hashemi, M.; Barker, A.; Zandvakili, O.R.; Bistgani, Z.E. Winter Annual Rye Seeding Date Influence on Nitrogen Recovery and Ammonia Volatilization from Late Fall Surface-Applied Manure. Agronomy 2020, 10, 931. [Google Scholar] [CrossRef]
  57. Zhang, X.; Wang, W.; Chen, W.; Zhang, N.; Zeng, H. Comparision of seasonal soil microbial process in snow-covered temperature ecosystems of northern China. PLoS ONE 2014, 9, e92985. [Google Scholar]
  58. Ross, I.J.; Sizemore, S.; Bowden, J.P.; Haan, C.T. Quality of Runoff from Land Receiving Surface Application and Injection of Liquid Dairy Manure. Trans. ASAE 1979, 22, 1058–1062. [Google Scholar] [CrossRef]
  59. Steenhuis, T.S.; Bubenzer, G.D.; Converse, J.C.; Walter, M.F. Winter-Spread Manure Nitrogen Loss. Trans. ASAE 1981, 24, 436–441. [Google Scholar] [CrossRef]
  60. Vadas, P.A.; Stock, M.N.; Arriaga, F.J.; Good, L.W.; Karthikeyan, K.G.; Zopp, Z.P. Dynamics of Measured and Simulated Dissolved Phosphorus in Runoff from Winter-Applied Dairy Manure. J. Environ. Qual. 2019, 48, 899–906. [Google Scholar] [CrossRef] [PubMed] [Green Version]
Figure 1. Plot configuration for snowmelt study.
Soilsystems 05 00067 g001
Figure 2. (a) Manure application in January 2010 (on top of snow); (b) snowmelt runoff collection in March 2010.
Soilsystems 05 00067 g002
Figure 3. Precipitation data by month, Brookings, SD. (28 November 2009, 28 January 2009, and 4 March 2010 were the first, second, and third manure application dates, respectively; 11–17 March 2010 was the runoff collection date). The bars indicate standard errors.
Soilsystems 05 00067 g003
Figure 4. Soil volumetric water content (VWC) at (a) 15 cm, and (b) 51 cm soil depth for manure timing treatments (mean overall manure treatments); Brookings, SD.
Soilsystems 05 00067 g004
Figure 5. Soil volumetric water content (VWC) at (a) 15 cm, and (b) 51 cm soil depth for untilled and fall-tilled treatments (mean overall manure treatments); Brookings, SD.
Soilsystems 05 00067 g005
Figure 6. Air temperature and below ground soil temperature at (a) 15 cm and (b) 51 cm soil depth for manure timing treatments (mean overall manure treatments); Brookings, SD.
Soilsystems 05 00067 g006
Figure 7. Below ground soil temperature at (a) 15 cm, and (b) 51 cm soil depth for untilled and fall-tilled treatments (mean overall manure treatments); Brookings, SD.
Soilsystems 05 00067 g007
Figure 8. Significant interaction of tillage and manure timing treatment on (a) ammonium nitrogen (NH4-N) concentration, (b) ammonium nitrogen (NH4-N) load, and (c) total suspended solids concentration in snowmelt runoff; Brookings, SD. Different letters indicate significant interactions between concentrations and loads due to treatments. The bars indicate standard errors.
Soilsystems 05 00067 g008
Table 1. Soil Characteristics of the study site, Brookings, SD.
Depth (cm)Soil pHSoil
Nitrogen (ppm)
Soil
Phosphorus (ppm)
Bulk
Density (g cm−3)
Organic Matter (%)CEC (meq/100 g soil)SHG
0–156.7651.35213.5B
15–517.544.51.651.77B
CEC = cation exchange capacity of soil; SHG = soil hydrologic group, estimated using the web soil survey. SGS of B means soils having a moderate infiltration rate when thoroughly wet. These consist chiefly of moderately deep or deep, moderately well-drained or well-drained soils that have moderately fine texture to moderately coarse texture. These soils have a moderate rate of water transmission.
Table 2. Manure characteristics used for the snowmelt runoff study; Brookings, SD.
Application DatesRate (Kg/2 m2) TDM (%) NH4-N§ TN TP
-----------------Kg ha−1-----------------
November7.223.23622363
January 143010133
March 23.86135156
TDM = total dry matter percentage; NH4-N = ammonium nitrogen; § TN = total nitrogen; TP= total phosphorus.
Table 3. Average soil moisture, temperature, snow depth, and total snow accumulation during manure application dates; Brookings, SD.
Manure
Application Dates
AverageTotal Snow Accumulation since Previous Application (cm)
Soil Moisture (cm3)Soil
Temperature (°C)
Snow Depth (cm)
28 November 20090.3330.00 (0.00) 0
28 January 20100.15−0.422.9 (2.3)58.5
4 March 20100.16−0.1730.5 (3.0)35.6
ROC; 10 March 20100.220.4715.2 (1.5)0
ROC = start of the runoff collection date. () Values in parenthesis indicate water depth equivalents.
Table 4. Treatment mean comparisons of runoff, nutrient concentrations, and loads in snowmelt, as influenced by tillage and time of manure application, 2010.
Treatment EffectConcentration in Runoff Load in Runoff
RONH4-NNO3-NTKNTSSTPTDPNH4-NNO3-NTKNTSSTPTDP
Orthogonal Contrast Pr > F §
Control vs. Manure0.840.01 #0.04 #0.01 #0.280.03 #0.01 #0.01 #0.110.04 #0.280.004 #0.001 #
Manure Application mg L−1Kg ha−1
No Manure Control (8)17.8a0.4a1.7a1.5a68.9a0.25a0.03a0.03a0.16a0.13a4.5a0.01a0.02a
Manured (20)16.5a3.3b2.6b17.5b106.0a2.8b2.2b0.33b0.23a1.6b7.4a0.27b0.21b
Tillage mg L−1Kg ha−1
Fall-Tilled (12)16.9a1.6a2.5a11.4a64.5a1.67a1.2a0.15a0.23a1.0a6.2a0.14a0.09a
Untilled (16)16.8a3.0b2.2a14.2a119.0a2.4a1.8a0.32b0.19a1.3a6.8a0.23a0.19b
Manure Timing mg L−1Kg ha−1
November (6)23.6a6.0a3.2a18.0ab39.5a3.5a2.9a0.72a0.38a2.17a4.64a0.42a0.35a
January (6)15.1b2.0b2.1a12.2a111.0ab2.2a1.8b0.17b0.14b1.00b7.00b0.19b0.15b
March (8)12.3b2.1b2.2a21.2b153.0b2.8a1.9b0.15b0.17b1.65ab9.68b0.21b0.14b
Source of Variation Without Control ANOVA Pr > F
Tillage [1]0.520.02 #0.20.670.320.250.140.03 #0.140.780.170.520.2
Manure Timing [2]0.060.01 #0.220.30.320.30.260.01 #0.02 #0.320.740.130.04 #
txm [2]0.740.04 #0.880.780.03 #0.390.140.04 #0.920.840.750.360.16
MSE [10]54.30.772.274.377.71.51.10.020.031.289.70.020.01
RO, snowmelt run-off in liters; NH4-N, ammonium nitrogen; NO3-N, nitrate-nitrogen; TKN, total Kjeldhal nitrogen; TSS, total suspended solids; TP, total phosphorus; TDP, total dissolved phosphorus. # Indicates a significant difference at 0.05%. Different letters indicate significant differences of mean in concentration and loads due to treatments. Calculated as runoff volume/area × concentration. Values in parenthesis ( ) are the number (n) of values in the mean. § Pr > F = probability that the tabular F-ratio exceeds the F-ratio calculated by analysis of variance. Values less than 0.05 are considered significant. [ ] Data in brackets are df of mean square error (MSE) for each parameter for ANOVA. Each plot’s data (two sub-plot samples out of eight) from November and January was discarded due to errors in manure application.
Table 5. Runoff and nutrient concentrations and loads in snowmelt, as influenced by tillage and time of manure application; Brookings, SD, 2010.
Treatment EffectConcentration in Runoff Load in Runoff
RONH4-NNO3-NTKNTSSTPTDPNH4-NNO3-NTKNTSSTPTDP
mg L−1Kg ha−1
Fall tilled
ontrol17.60.422.31.337.40.350.040.030.190.112.90.020.01
November20.83.53.213.246.121.60.360.341.44.80.20.16
January12.91.328.172.51.41.10.070.170.553.10.080.03
March16.42.12.622.396.732.30.190.25211.70.270.18
Untilled
Control17.90.431.11.71000.150.020.040.140.166.20.010.01
November257.23.320.436.14.23.60.90.42.64.60.50.44
January16.32.42.114.2130.22.62.20.220.141.290.230.16
March8.32.21.820.1209.32.61.60.130.091.37.70.160.12
RO, snowmelt runoff in liters; NH4-N, ammonium-nitrogen; NO3-N, nitrate-nitrogen; TKN, total Kjeldhal nitrogen; TSS, total suspended solids; TP, total phosphorous; TDP; total dissolved phosphorus. Calculated.
Table 6. Mean difference comparisons of several runoff concentrations and loss parameters from manure timing treatments; SD.
Manure TimingRONH4-NNO3-NTKNTSSTPTDP
LitersAbsolute Difference between Means Concentration (mg L−1)
Nov-Jan 8.47 #3.90 #NSNSNSNSNS
Nov-Mar 11.33 #3.84 #NSNS113.5 #NSNS
Jan–Mar §NSNSNS9.04 #NSNSNS
Litersabsolute difference between means runoff load (kg ha−1)
Nov–Jan8.47 #0.55 #0.20 #1.17 #NS0.23 #0.19 #
Nov–Mar11.33 #0.56 #0.23 #NSNS0.20 #0.21 #
Jan–MarNSNSNSNSNSNSNS
† Nov–Jan = November–January; Nov–Mar = November–March; § Jan–Mar = January–March; NS = not significant; # indicates significance (0.05 level) of absolute mean difference.
Publisher’s Note: MDPI stays neutral with regard to jurisdictional claims in published maps and institutional affiliations.

