Article

Litter Decomposition in Wet Rubber and Fruit Agroforests: Below the Threshold for Tropical Peat Formation

by
Yosefin Ari Silvianingsih
1,2,
Meine van Noordwijk
3,4,5,*,
Didik Suprayogo
3 and
Kurniatun Hairiah
3
1
Faculty of Agriculture, University of Palangka Raya, Kampus UPR Tunjung Nyaho, Palangka Raya 74874, Indonesia
2
Graduate Studies Program, Faculty of Agriculture, Brawijaya University, Malang 65145, Indonesia
3
Agroforestry Research Group, Faculty of Agriculture, Brawijaya University, Jl. Veteran no 1, Malang 65145, Indonesia
4
Plant Production Systems, Wageningen University, 6700AK Wageningen, The Netherlands
5
Centre for International Forestry Research and World Agroforestry (CIFOR-ICRAF), Bogor 16115, Indonesia
*
Author to whom correspondence should be addressed.
Soil Syst. 2022, 6(1), 19; https://doi.org/10.3390/soilsystems6010019
Submission received: 11 December 2021 / Revised: 27 January 2022 / Accepted: 4 February 2022 / Published: 8 February 2022

Abstract

:
Peatlands are shaped by slow litter decomposition, but threshold decomposition rates that allow peat formation remain unclear. Can agroforestry in the tropics be compatible with paludiculture that allows peat formation? We explored the determinants of litter decomposition in wet agroforests adjacent to tropical peatlands in Central Kalimantan (Indonesia) by litterbag studies (up to 16 weeks) with standing litter sources to estimate rate constants, characterize litter quality (especially lignin (L), polyphenolics (Pp) and nitrogen (N)), and monitor temperature and groundwater levels. In litter transfer experiments we tested for home-field advantage (HFA) effects between land cover types. Mean residence times around 85 weeks at 27 °C were associated with a high (L + Pp)/N ratio. However, in the crossover treatments, mean residence times varied from 30 to 180 weeks and strong HFA effects (up to 80% faster decomposition at “home”) were found when litter from other sources was tested in old fruit-based agroforests. HFA indicates a local decomposer community well-adapted to its normal litter diet. Litter residence times of around two years are below the apparent peat formation threshold. Maintaining wet agroforest conditions adjacent to peat domes supports peatland rewetting and restoration but does not contribute to on-site peat formation processes.

1. Introduction

The existence of peat soils in the tropics has puzzled scientists studying temperate and subarctic (boreal) peatlands [1]. In the latter, temperature limits soil biological activity and allows even low rates of necromass production to exceed decomposition rates. This starts an accumulation process of dead organic matter that alters the hydrology and creates anaerobic conditions that further slow-down decomposition. Blocking access to nutrient sources in the subsoil, or brought in by streams, further supports oligotrophic vegetation with associated slow decomposition rates. Thus, a positive feedback loop reinforces the incomplete decomposition of necromass inputs and enhances conditions for peat formation. Thresholds for the start of this feedback loop, however, remain unclear. Under tropical conditions (temperatures typically above 20 °C), anaerobic conditions play a prominent role in maintaining peat soils, but the initial cause of slow decomposition may be oligotrophic conditions and flat terrain where hydrological separation from riverine (or marine) sedimentation and nutrient sources can be expected to occur (Figure 1).
The transition from mineral to peat soil conditions can be more gradual when trees in peat swamps are rooted in underlying mineral soils. The pioneering research of tropical peatlands in Indonesia initiated by Dr. Betje Polak [2] showed an example of such rooting patterns and clarified the palynological and historical dimensions of peat profiles. Her research showed limits to the agronomic opportunities for crops in deep peat soils, and towards the end of her life, she warned against the destructive types of peat reclamation that were emerging. Early estimates of the area covered with peat in Indonesia of about 16.5 million ha [3] have since been refined by imposing a threshold peat depth of more than 50 cm and finding 13.4 million ha met this condition [4], with the reclassification of wetland soils in Southwest Papua being responsible for most of the difference.
Drainage of peat swamp forest to facilitate agricultural use and conversion to fast-growing timber or oil palm plantations has turned a continuous but modest sink for atmospheric CO2 through peat formation into a substantial source. For example, a comparison of annual net ecosystem CO2 exchange (NEE) based on eddy-covariance data was conducted between peat swamp forest on deep peat in Malaysia and oil palm on drained soils in the same region during the same period. The oil palm emitted 9.9 Mg C ha−1 year−1, while the forest absorbed 1.4 Mg C ha−1 year−1. A large amount of plant debris left in the plantation probably contributed, according to the authors, to the large NEE through decomposition, while the forest litter contributed to peat formation [5]. Drainage of peat areas also increases the risk that fires spread, with dramatic consequences for human health, as well as greenhouse gas emissions as what accumulated over many years is released in a short period of time [6,7].
Much of contemporary peat research in Indonesia is understandably focused on restoring, through various approaches to canal blocking, the hydrological controls lost through drainage for agricultural use [8]. The thresholds for initial, aerobic excess of necromass formation over its decomposition remain poorly quantified, however, and triggered our current research (Figure 2).
Peat formation depends on a phase transition in a gradual process of slowing decomposition rates that lead to wetter (and potentially anaerobic) conditions as a positive feedback loop and eventually to residence times that may become hundreds of years [9]. Decomposition of above- and below-ground litter closes nutrient cycles that started with uptake by plants and bring nutrients back to the root zone [10]. Rates of litter decomposition vary across ecosystems [11,12,13], as has been a focus of soil biological research, aimed at biological management of soil fertility [14,15]. Before decomposing, litter protects the soil from erosion on sloping lands [16], and it is a temporary carbon pool, part of the international C accounting standards [17]. The ratio of average standing stock and annual litterfall equals the mean residence time [16], which is inversely related to the “quality” of litter. The metric that has been found to be the most effective single indicator of “quality” in this respect was derived to describe digestibility for ruminants: the ratio of lignin (L) plus polyphenols (Pp) and nitrogen (N), (L + Pp)/N [18]. The lower the quality, the longer litter stays in the system, reducing nutrient uptake and, potentially, subsequent litter quality [19]. The accumulating organic matter supports an oligotrophic and acid system independent of the mineral soil below the peat or nutrient-enriching river flows depositing sediment and where plants with special adaptations to supply oxygen to their roots dominate [20]. In this positive feedback loop towards peat formation, the initial thresholds of lower quality and slower decomposition in interaction with hydrology and anaerobic conditions are not well known, especially for tropical countries where temperature does not limit biological activity by decomposers, as it does in temperate and arctic zones where peat formation is common [20].
Possible thresholds of peat formation are relevant for policy designs and decisions matching the current interest in restoring tropical peatlands that were degraded by drainage and fire [21,22]. The prioritized actions of canal blocking to achieve rewetting may not be sufficient to trigger the process [21,23,24]. Wet conditions are not sufficient for peat formation if nutrient availability is high and decomposition is not retarded by low litter quality [25]. Expectations that peatland restoration can be achieved within productive forms of land use, such as “paludiculture” [26] or “agroforestry” [27], may be too optimistic if nutrient supply requirements for plant growth are to be met. Paludiculture, defined as the productive use of wet and rewetted peatlands, is seen as a highly desirable land use, currently on the margin of what is feasible in tropical conditions [27]; with lower decomposition rates in the temperate zone, peat formation is less dependent on oligotrophic conditions [28,29]. It remains an open question whether or not productive wet tropical agroforests can cross the threshold to peat formation. Earlier analyses of litter decomposition in agroforests [30] on mineral soils have found results similar to those for natural forests [31].
In our earlier analysis [32] of land use by the Dayak Ngaju people of Pulang Pisau Regency in Central Kalimantan, the recognized importance for local livelihoods of the narrow zones between rivers and peat domes was found to match its role in peatland preservation and restoration, as the agroforests tolerate high groundwater levels (with values up to −15 cm in the rainy season; [33]). These agroforests on mineral soils but in the transition to peat soils offer an opportunity to understand determinants of litter decomposition and possibly identify thresholds where the peat formation can start. In the agroforests, a range of local fruit trees (including various types of durian and a forest mango) are combined with rubber (Hevea brasiliensis) as a marketable commodity that derives from Amazonian floodplains and tolerates wet conditions. The soils have low pH and high exchangeable Al3+ concentrations and are considered to be of low quality for agriculture. Yet, they have supported sustainable livelihoods for more than a century [33].
In process-level understanding of decomposition, the relative importance of litter quality as an internal factor [34,35] and the soil characteristics as an external factor remain contested [36,37]. Internal factors include not only the chemical attributes, such as lignin that is hard to digest and polyphenols that can immobilize nitrogen, but also physical attributes, such as silica deposits, that can slow down comminutors among the soil biota [38]. External factors include rainfall, seasonal patterns in temperature and air humidity [39], soil biota, and soil factors such as nitrogen supply needed to digest materials of low-quality litter [40,41,42]. In mixtures of litter types with different qualities, interactions have been attributed to effects on nutrient supply to decomposers [43]. In specific situations, concentrations of Mn rather than N may influence decomposition rates [44].
On the interface of external and internal factors, there has also been interest in the concepts of home-field advantage (HFA) and priming [45]. HFA [46,47,48] can derive from specific adaptations of soil biota to local litter sources that account for higher rates of decomposition “at home” rather than as “guest” in neighboring habitats [49,50]. Negative values of HFA have been tentatively attributed to the effects of dietary diversity on decomposer activity [51]. Negative HFA values may in part be due to “priming”, where external N supply allows the decomposing microbial biomass to form, which leads to increased rates of decomposition and N mineralization [52,53]. HFA effects on litter decomposition have, to our knowledge, not been clarified in the context of the threshold for tropical peat formation.
A study in a temperate peatland in the USA [54] explored the balance between internal and external nutrient control over decomposition and mineralization and found water tables to dominate and external nutrient supply not to speed up decomposition in crossover experiments between habitats and litter types. Research on peatlands in New Zealand [55] found that surface litter decomposition constants (0.12–0.80 year−1) decreased from early to late successional species but that decomposition was slower at more waterlogged early successional sites. Elsewhere, drying and rewetting conditions were shown to differentially affect the mineralization of fresh plant litter and existing soil organic matter [56], indicating that effects of groundwater levels, the water content in the topsoil, and the humidity of the air may all influence the rates of decomposition.
In view of the scarcity of studies on wet or drained mineral soils in tropical peatland landscapes and the possible contributions wet agroforestry might make to not only protect adjacent, rewetted peat but also allow sustainable use and store carbon, the specific questions for our study were:
  • How do rates of litter decomposition vary among agroforestry habitats (land cover types) on mineral soils but in peatland landscapes that differ in depth of drainage?
  • How strong are home-field advantage (HFA) effects between the various habitat types when tested in a crossover experiment?
  • Can HFA effects be related to soil and microclimatic conditions and/or to specific aspects of litter quality that may favor adapted decomposer communities?
In the discussion, we will relate the answers to these questions to the thresholds of peat formation when decomposition slows down further.

2. Material and Methods

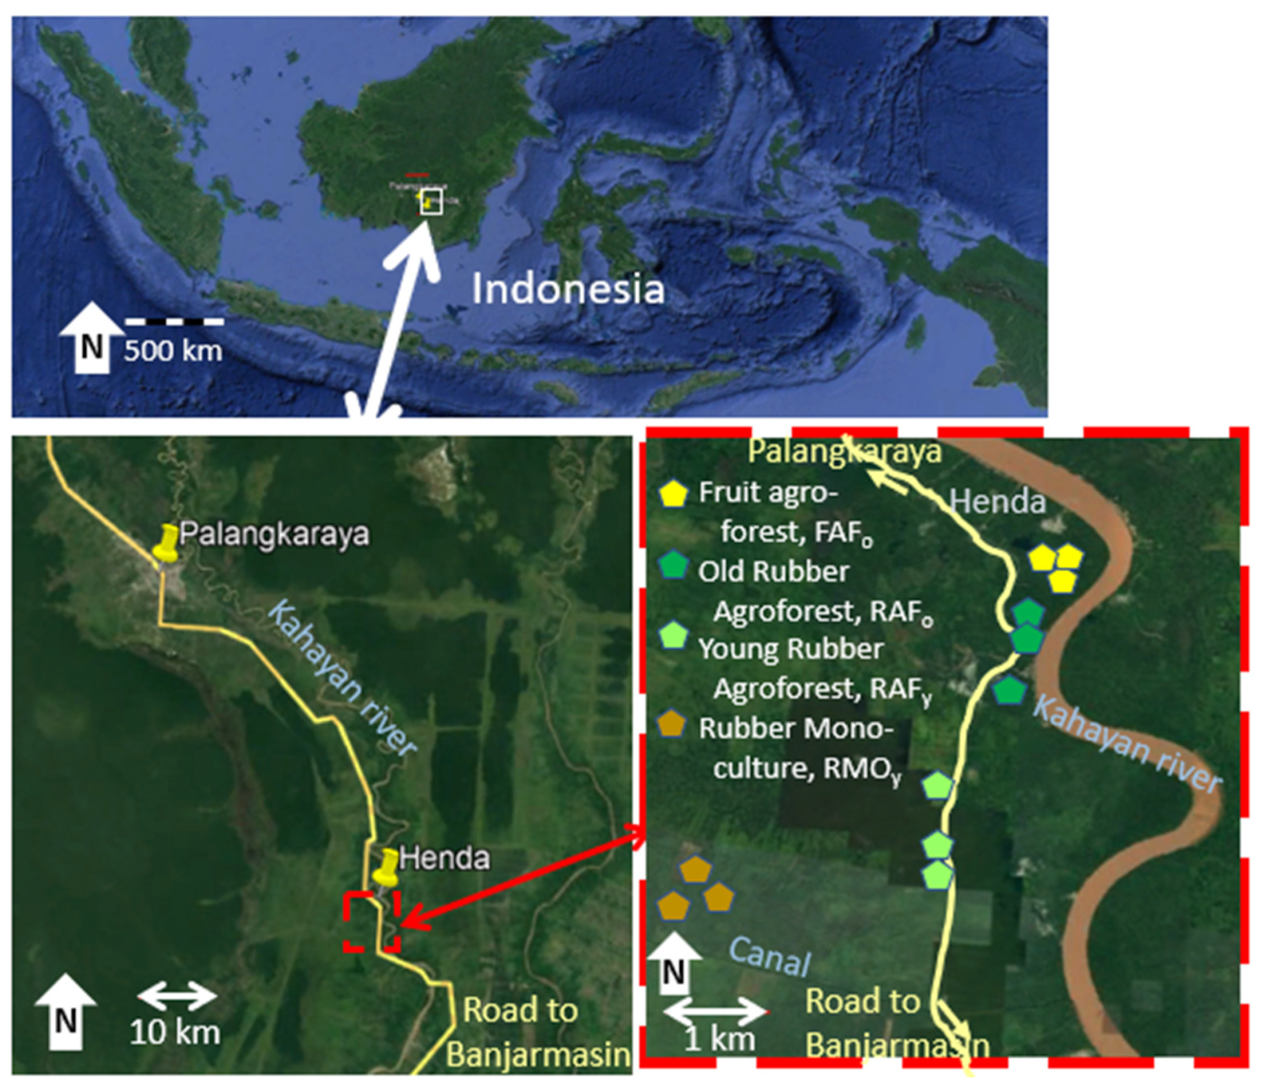
2.1. Research Location

As described in two previous studies [32,33], the research location in Henda village is along the Kahayan River in Central Kalimantan, Indonesia (Figure 3). At an elevation of 0–5 m above sea level, the climate is tropical, with a mean annual temperature of 26 °C; a mean annual rainfall of 3194 mm; and 7 wet, 3 moist, and 2 dry months [57,58]. The research took place in the period October 2018–January 2019, in the beginning of the rainy season.
The current research focused on four habitats (land cover types) within the agroforest–tree crop continuum in the landscape, which were characterized as [33]:
  • Fruit agroforest (FAFo), closest to the village and probably an older location of the village that shifted slightly to the south. Some of the trees are, according to local sources, at least one hundred years old. Important local fruit trees include “cempedak” (Artocarpus integer), “manggis” (Garcinia sp.), “rambai” (Baccaurea motleyana), “langsat” (Lansium domesticum), and “paken” (Durio kutejensis). There are also rubber (Hevea brasiliensis) trees in the plots.
  • Old rubber agroforest (RAFo), planted with rubber around 150 years ago and relying on natural regeneration of these trees within the plot, along with local fruit trees including cempedak, rambai, durian (Durio sp.), “binjai” (Mangifera caesia), and rambutan (Nephelium lappaceum).
  • Young rubber agroforest, (RAFy), planted with rubber around 30 years ago (according to local informants) and similar in tree composition to the RAFo plots. Local trees include “hampalam” (Mangifera sp.), manggis, rambutan, and “sentol” (Sandoricum koetjape).
  • Rubber monoculture (RMOy), also planted around 30 years ago, with a higher rubber density, but still containing some local trees such as durian, rambutan, and cempedak. In the terminology used in [32,33], systems with >85% of basal area belonging to the dominant system are labeled as “monoculture”.

2.2. Soil, Microclimate, and Vegetation Characteristics

Characteristics of the soil were measured with standard physical and wet chemistry analytical methods [33]. Measured Corg concentrations were compared to what could be expected for a soil of similar texture and pH in Indonesia [59]. In addition, microclimate measurements of soil temperature and relative humidity were collected in three replications in the four habitats, close to the locations of the litterbags. Air humidity was measured in the shade at 1 m above the soil surface with a thermo-hygrometer (Haar-Synth-Hygro, Wertheim, Germany) and soil temperature was measured at 5, 15, and 25 cm depth with a digital thermometer (iTUIN) from October 2018 to January 2019 at weekly intervals at 7 a.m. and 2 p.m. At the start of the study, hourly measurements taken for three days confirmed that 7 a.m. readings are close to the daily minimum temperature and 2 p.m. ones usually represent the daily maximum.
Characteristics of the vegetation in the four habitats were earlier described in [33], with the exception of the thickness of and necromass in the litter layer. Litter thickness was assessed by lightly compressing the litter (above the mineral soil layer) in a caliper and recording the results on six locations for each of three subplots in each of the habitats. Litter necromass data were collected in parallel with the earthworm sampling of three 50 cm × 50 cm monoliths per subplot, reported in [33].

2.3. Litterbags

Freshly fallen leaves and twigs were collected from the soil surface in the various land covers as a basis for the litter decomposition studies. Air-dried litter was chopped to a maximum size of 5 cm before filling the plastic litterbags of 30 × 25 × 2 cm, 5 mm mesh size [14,60], to a specified weight (equivalent to 62 to 67.5 g dry weight, depending on initial estimates of standing litter stocks in the four habitats and the relative water contents of the litter types). In total, 84 litterbags were prepared for each of the four litter sources, with three replicates sampled at each of seven time intervals (1, 2, 4, 6, 8, 12, and 16 weeks) in each of the four habitats. Litterbags were preidentified for the various sampling intervals and placed in a random design within a designated test area in the litter layer (with existing layer removed so that litterbags were in contact with the mineral soil). At the time of sampling, 48 (4 × 4 × 3) litterbags were carefully lifted and transferred to a plastic bag to minimize the risk of loss during transportation to the laboratory. Litter samples were floated in a bucket of water to remove soil particles, drained in a filter, and air-dried. After further drying in an oven at 70 °C for 72 h, dry weight was determined. For the analysis, the remaining dry weight in each sample was expressed as a ratio to the initial amount.
Samples of the initial litter dried at 60 °C for 48 h [61] were analyzed for the concentrations of polyphenols (extraction of 0.1 g of plant material with 50 mL of a 50% (v/v) methanol–water mixture, response to Folin–Ciocalteu reagent calibrated with a tannic acid standard after [14]), N (Kjeldahl method in [14,62]), cellulose, and lignin [63]. The latter method is based on the residual weight of samples following successive removal of various tissue constituents: The first step oxidizes soluble organic components and defines acid detergent fiber (ADF: lignin + cellulose + insoluble minerals) based on boiling for 1 h in cetyltrimethylammonium bromide 1 N-H2SO4, followed by filtering, drying, and weighing. The next step breaks down the cellulose for 3 h at 20 °C in 72% H2SO4 and estimates lignin + insoluble minerals (“ash”). After filtering, drying, and weighing, the sample is heated in a muffle furnace at 550 °C to determine the insoluble mineral residue. Cellulose and lignin estimates are based on weight differences between the first and second steps and between the second and third steps, respectively. Part of the literature describes these fractions as proximate cellulose and lignin, respectively [64,65].

2.4. Reciprocal Litter Exchange Experiment

For the crossover experiment, the decomposition rates of surface litter collected in each of the four habitats were tested in each of the four habitats (Figure 4).

2.5. Decomposition Rates

The relative remaining dry weight of litterbag samples was analyzed with an exponential decay function, modified from [66]:
Xt/X0 = e−kd t
where:
Xt = litter weight at time t (g);
X0 = initial litter weight (g);
kd = decomposition rate (week-1);
t = time of observation (week).
In practice, kd estimates were derived as the slope estimate in a regression of Ln(Xt/X0) on time t.
Mean residence time (MRT) (which equals stock/input in an equilibrium situation) and half-life time t50 were calculated as:
MRT = −1/kd
and
t50 = −ln(0.5)/kd
respectively. For the decomposition constants, an equivalent value at 20 °C was calculated for comparison with literature values, based on a Q10 estimate of 2.2 [67]:
kd (20) = kd (t) Q10(t − 20)/10

2.6. Home-Field Advantage

Pairwise comparisons between two “home” combinations of litter source and habitat (Aa and Bb) and the crossovers (Ab and Ba) were used to estimate the home-field advantage (HFA) index (rearranging the terms in the equations developed by [46]) as:
HFA = 100 × Aa   ×   Bb Ab   ×   Ba Ab   × Aa + Ba 2 +   Ba   × Ab   +   Bb 2
HFA1 was calculated on the basis of kd estimates; HFA2, on the basis of mean residence times. By substituting (2) into Equation (5), the relation between the two indices could be clarified as:
HFA 2 = HFA 1 × Aa   ×   Ab   + 2 ×   Ab   ×   Ba   +   Ba   ×   Bb Aa   ×   Ab   + 2 ×   Aa   ×   Bb   +   Ba   ×   Bb = 100 × HFA 1 / 100 + HFA 1
Beyond a metric of pairwise expressions of HFA, an average HFA for each litter type, MeanHFAlit(i), and a mean for each habitat, MeanHFAhab(j), were calculated following [68]:
MeanHFAlit(i) = (3 × kd(i, home)/∑kd(i, guest)   −1) × 100
MeanHFAhab(j) = (3 × kd(j, home)/∑kd(j, guest)   −1) × 100
where kd(home) values were obtained in the original habitat of the litter type, and kd(guest) values were obtained as the average of the three crossover tests for the MeanHFAlit(i) of each litter type or the three other litter sources tested in the same habitat for MeanHFAhab(j).

3. Results

3.1. Soil and Vegetation Characteristics

Soil characteristics (Table 1) showed that the FAFo and RAFo, closest to the river, had the highest clay contents, while in the RAFy and RMOy plots, the silt fraction and the Corg levels were higher. Corg levels in RAFy and RMOy are considerably higher than what would be expected for a soil of similar texture and pH in Indonesia [59].
Characteristics of the vegetation (Table 2) showed that RAFo had the highest tree basal area, but FAFo had the highest aboveground biomass due to a few large-diameter trees (see also [33]) but also the highest necromass in the litter layer. Litter thickness and necromass were closely related (Figure 5).

3.2. Microclimate

Soil temperature and relative humidity at the specific location of the decomposition studies were relatively constant during the litterbag study; variation between the sites in temperature was mostly less than 2 °C; in the RAFy site, air humidity dropped by more than 20% in a number of episodes (Figure 6).

3.3. Litter Quality

Characteristics of the litter sources are summarized in Table 3.

3.4. Decomposition Rates

In the FAFo habitat, the loss of dry weight from all types of litter was similar; in RAFo, it diverged most strongly (Figure 7), suggesting that there were strong interactions between habitat and litter types in the rate of decomposition. Calculations of the kd estimates (Table 4) and of the HFA based on kd values confirmed these interactions and described them in more detail.
As the standard error estimates of the regression coefficient kd were found not to correlate with kd, the 95% confidence interval for kd, which was 0.0119–0.0211, can be used to judge for which habitat x litter types specific kd estimates differ statistically from the overall average value. For the home combinations, the RAFy estimate for kd was significantly lower and the RMOy value was significantly higher than the overall average. For the crossover values, all guest litters tested in FAFo had a significantly lower kd, and the RAFo litter tested in RMOy had a significantly higher kd than the overall average.
The MRT, expected value of the stock/input ratio in equilibrium, ranged from 39 to 81 weeks for the home combinations of litter type and habitat (Figure 8) but showed a much wider range (28 to 183 weeks) in the crossover situations
The average equivalent kd estimate at 20 °C was 0.564 year−1 (MRT 1.77 years), and it ranged from 1.27 year−1 (MRT 0.79 years) to 0.179 year−1 (MRT 5.59 years).

3.5. Home-Field Advantage (HFA)

The specific interactions described are reflected in the HFA index, whether calculated for the kd estimates or for the MRT ones (Table 5); the HFA index values for MRT are opposite in sign and smaller in value than those for kd, based on equation (6). As differences in recorded temperature between the habitats were small, calculations of HFA based on equivalent kd values at 20 °C differed only slightly from those based on the nonstandardized kd values (Table 5).
The strongest HFA effects, around 80% faster decomposition at home compared with the “guest” environment, were noticed (Table 5) in the combinations RMOy and FAFo, followed by the other two habitats interacting with FAFo. HFA values between the other three habitats were negative (−1% to −11%). The mean HFA per habitat type, MeanHFAhab(j), was 15.6%, −23.7%, −13.7%, and 102% for FAFo, RAFo, RAFy, and RMOy, respectively. Mean HFA per litter type, MeanHFAlit(i), was −1.9%, −1.6%, −1.3%, and −2.6% for L-FAFo, L-RAFo, L-RAFy, and L-RMOy, respectively. The main interaction effects were thus noticed when non-FAFo litter sources were tested in the FAFo habitat, especially when this involved L-RMOy litter.

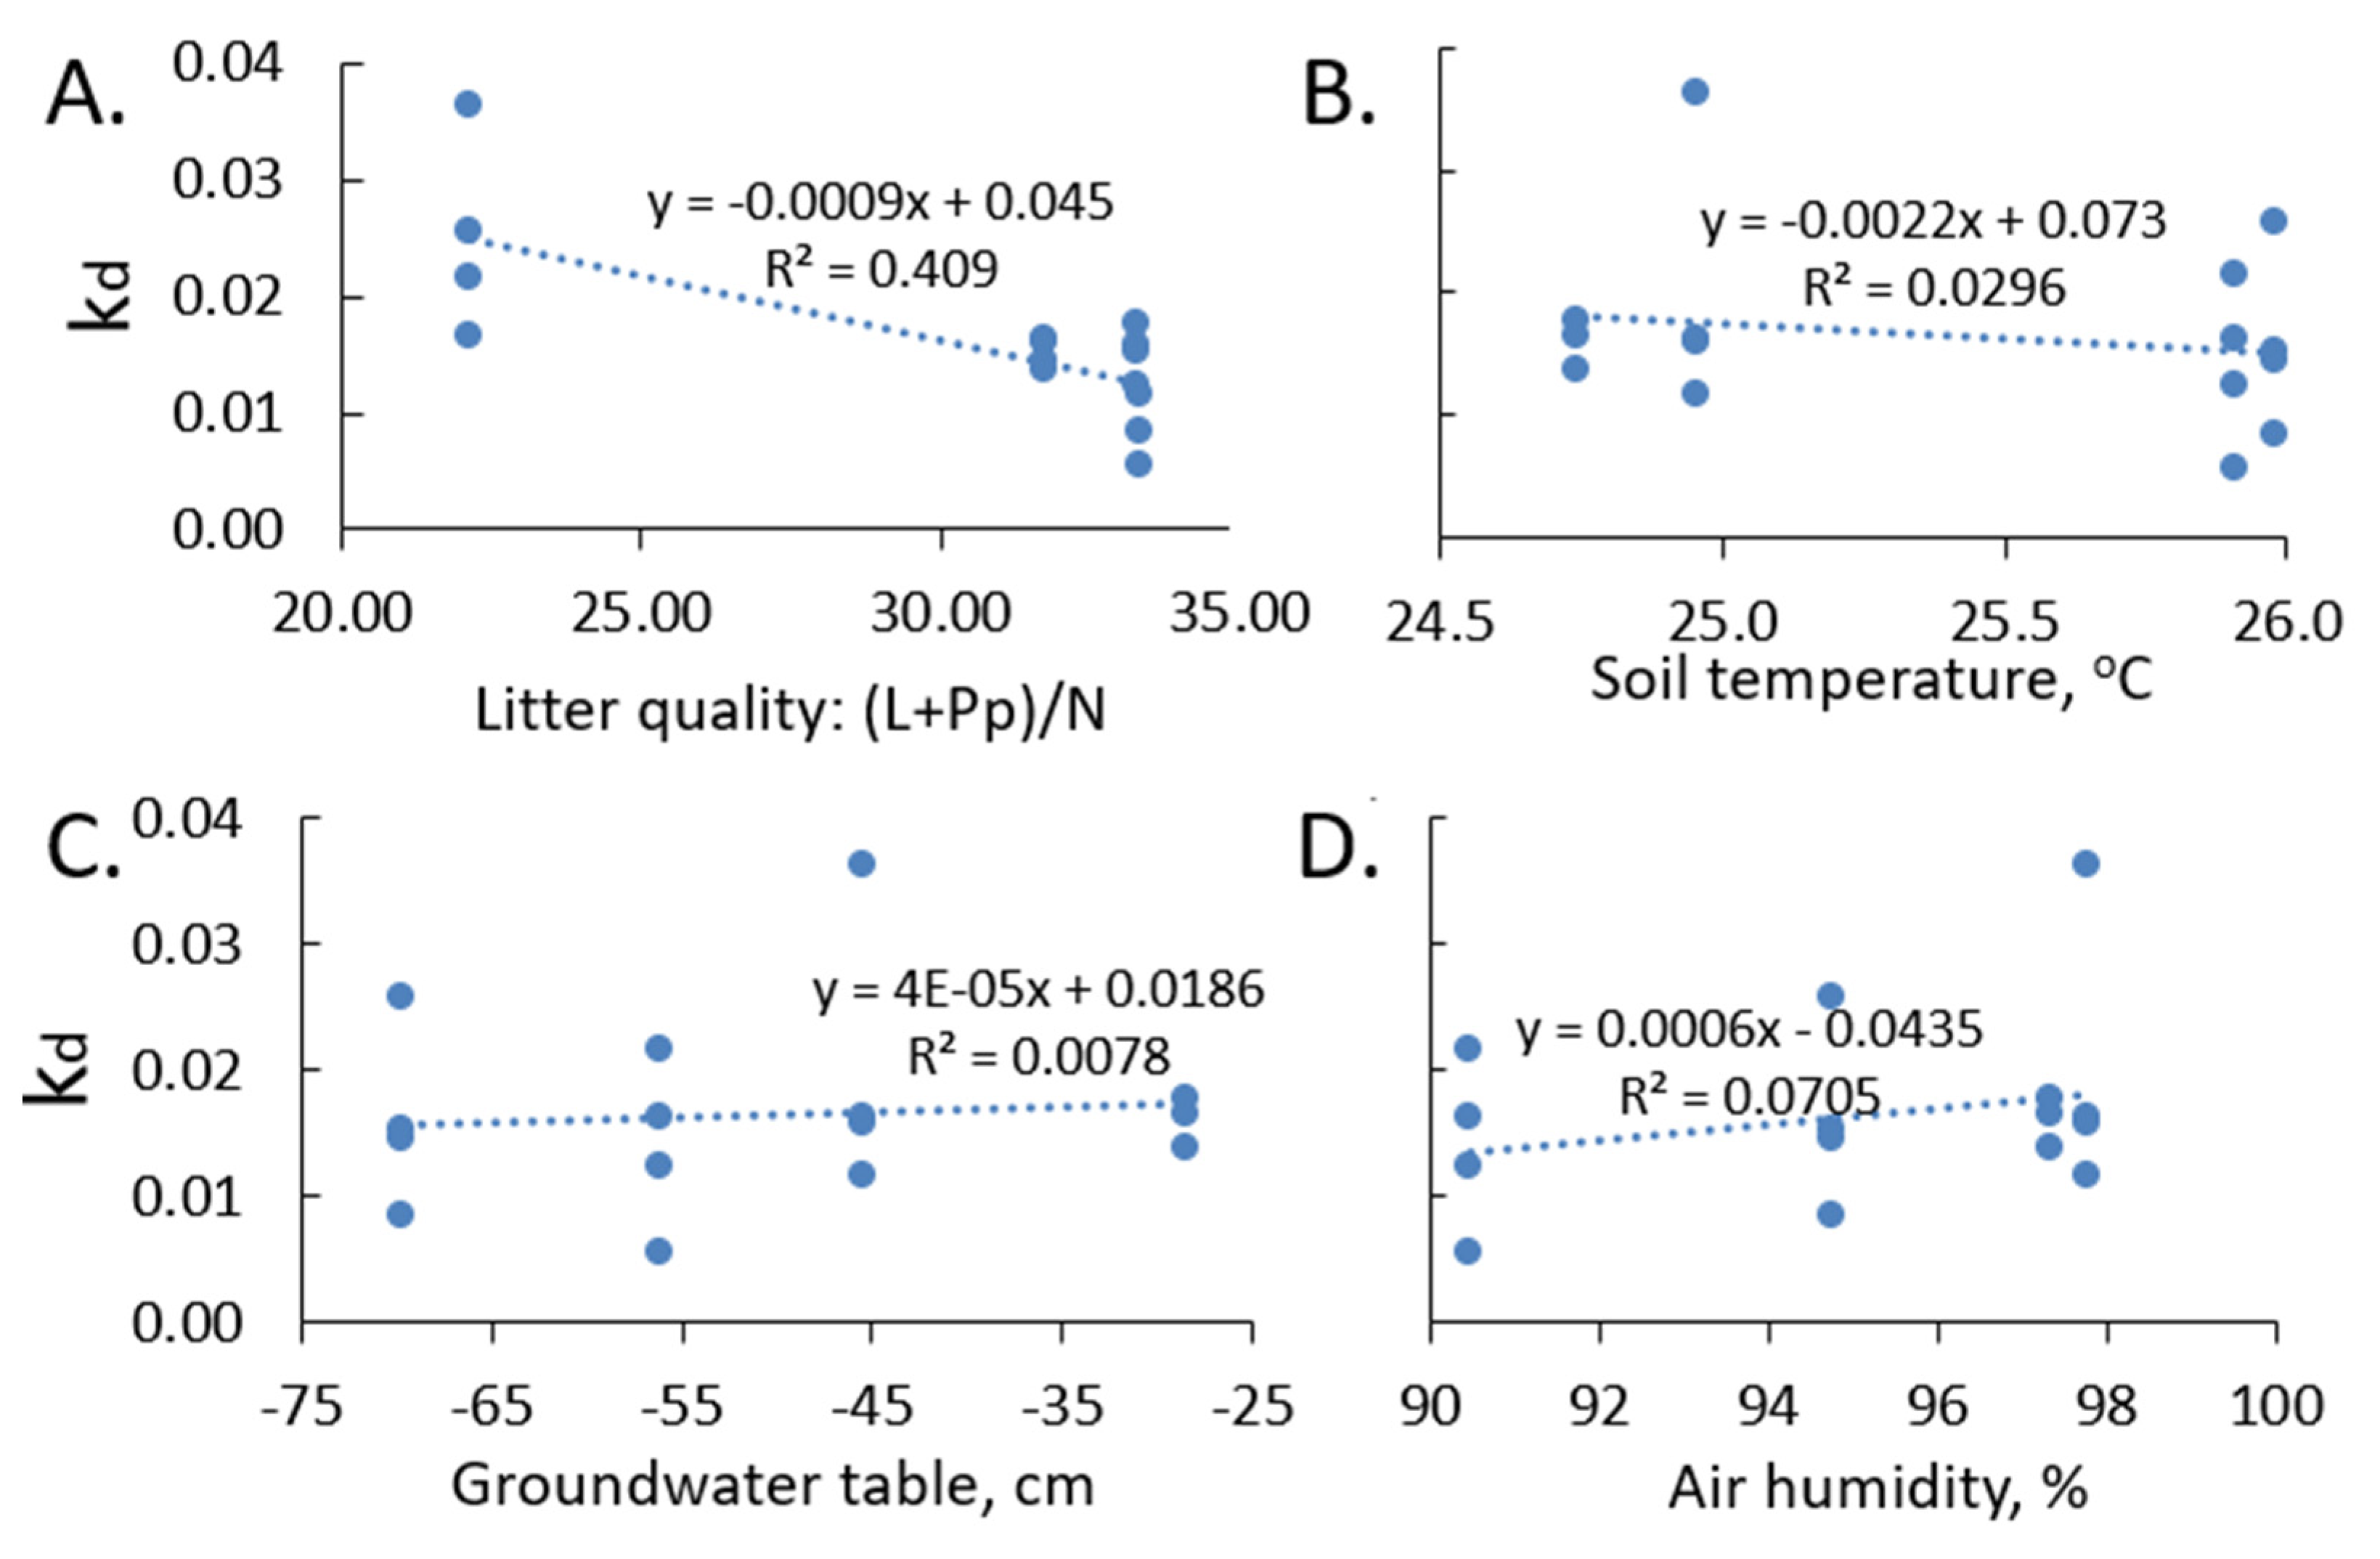
3.6. Litter Quality, Environmental Conditions, and HFA
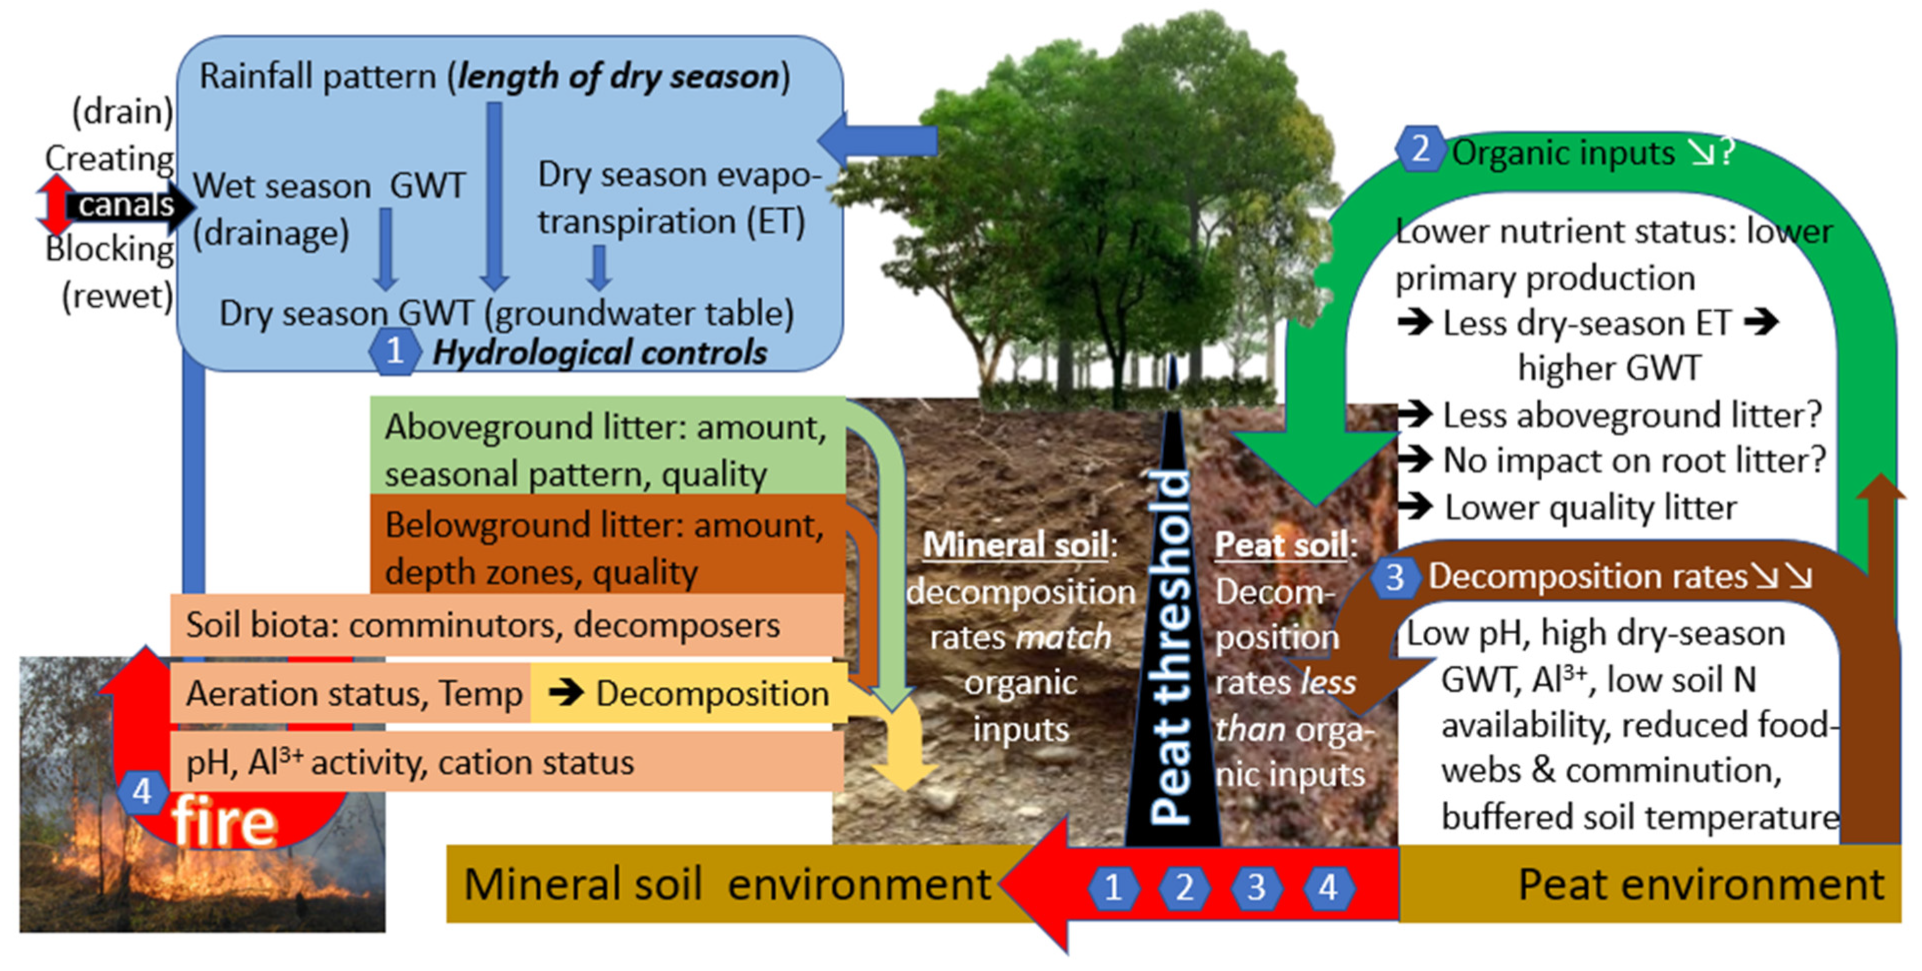
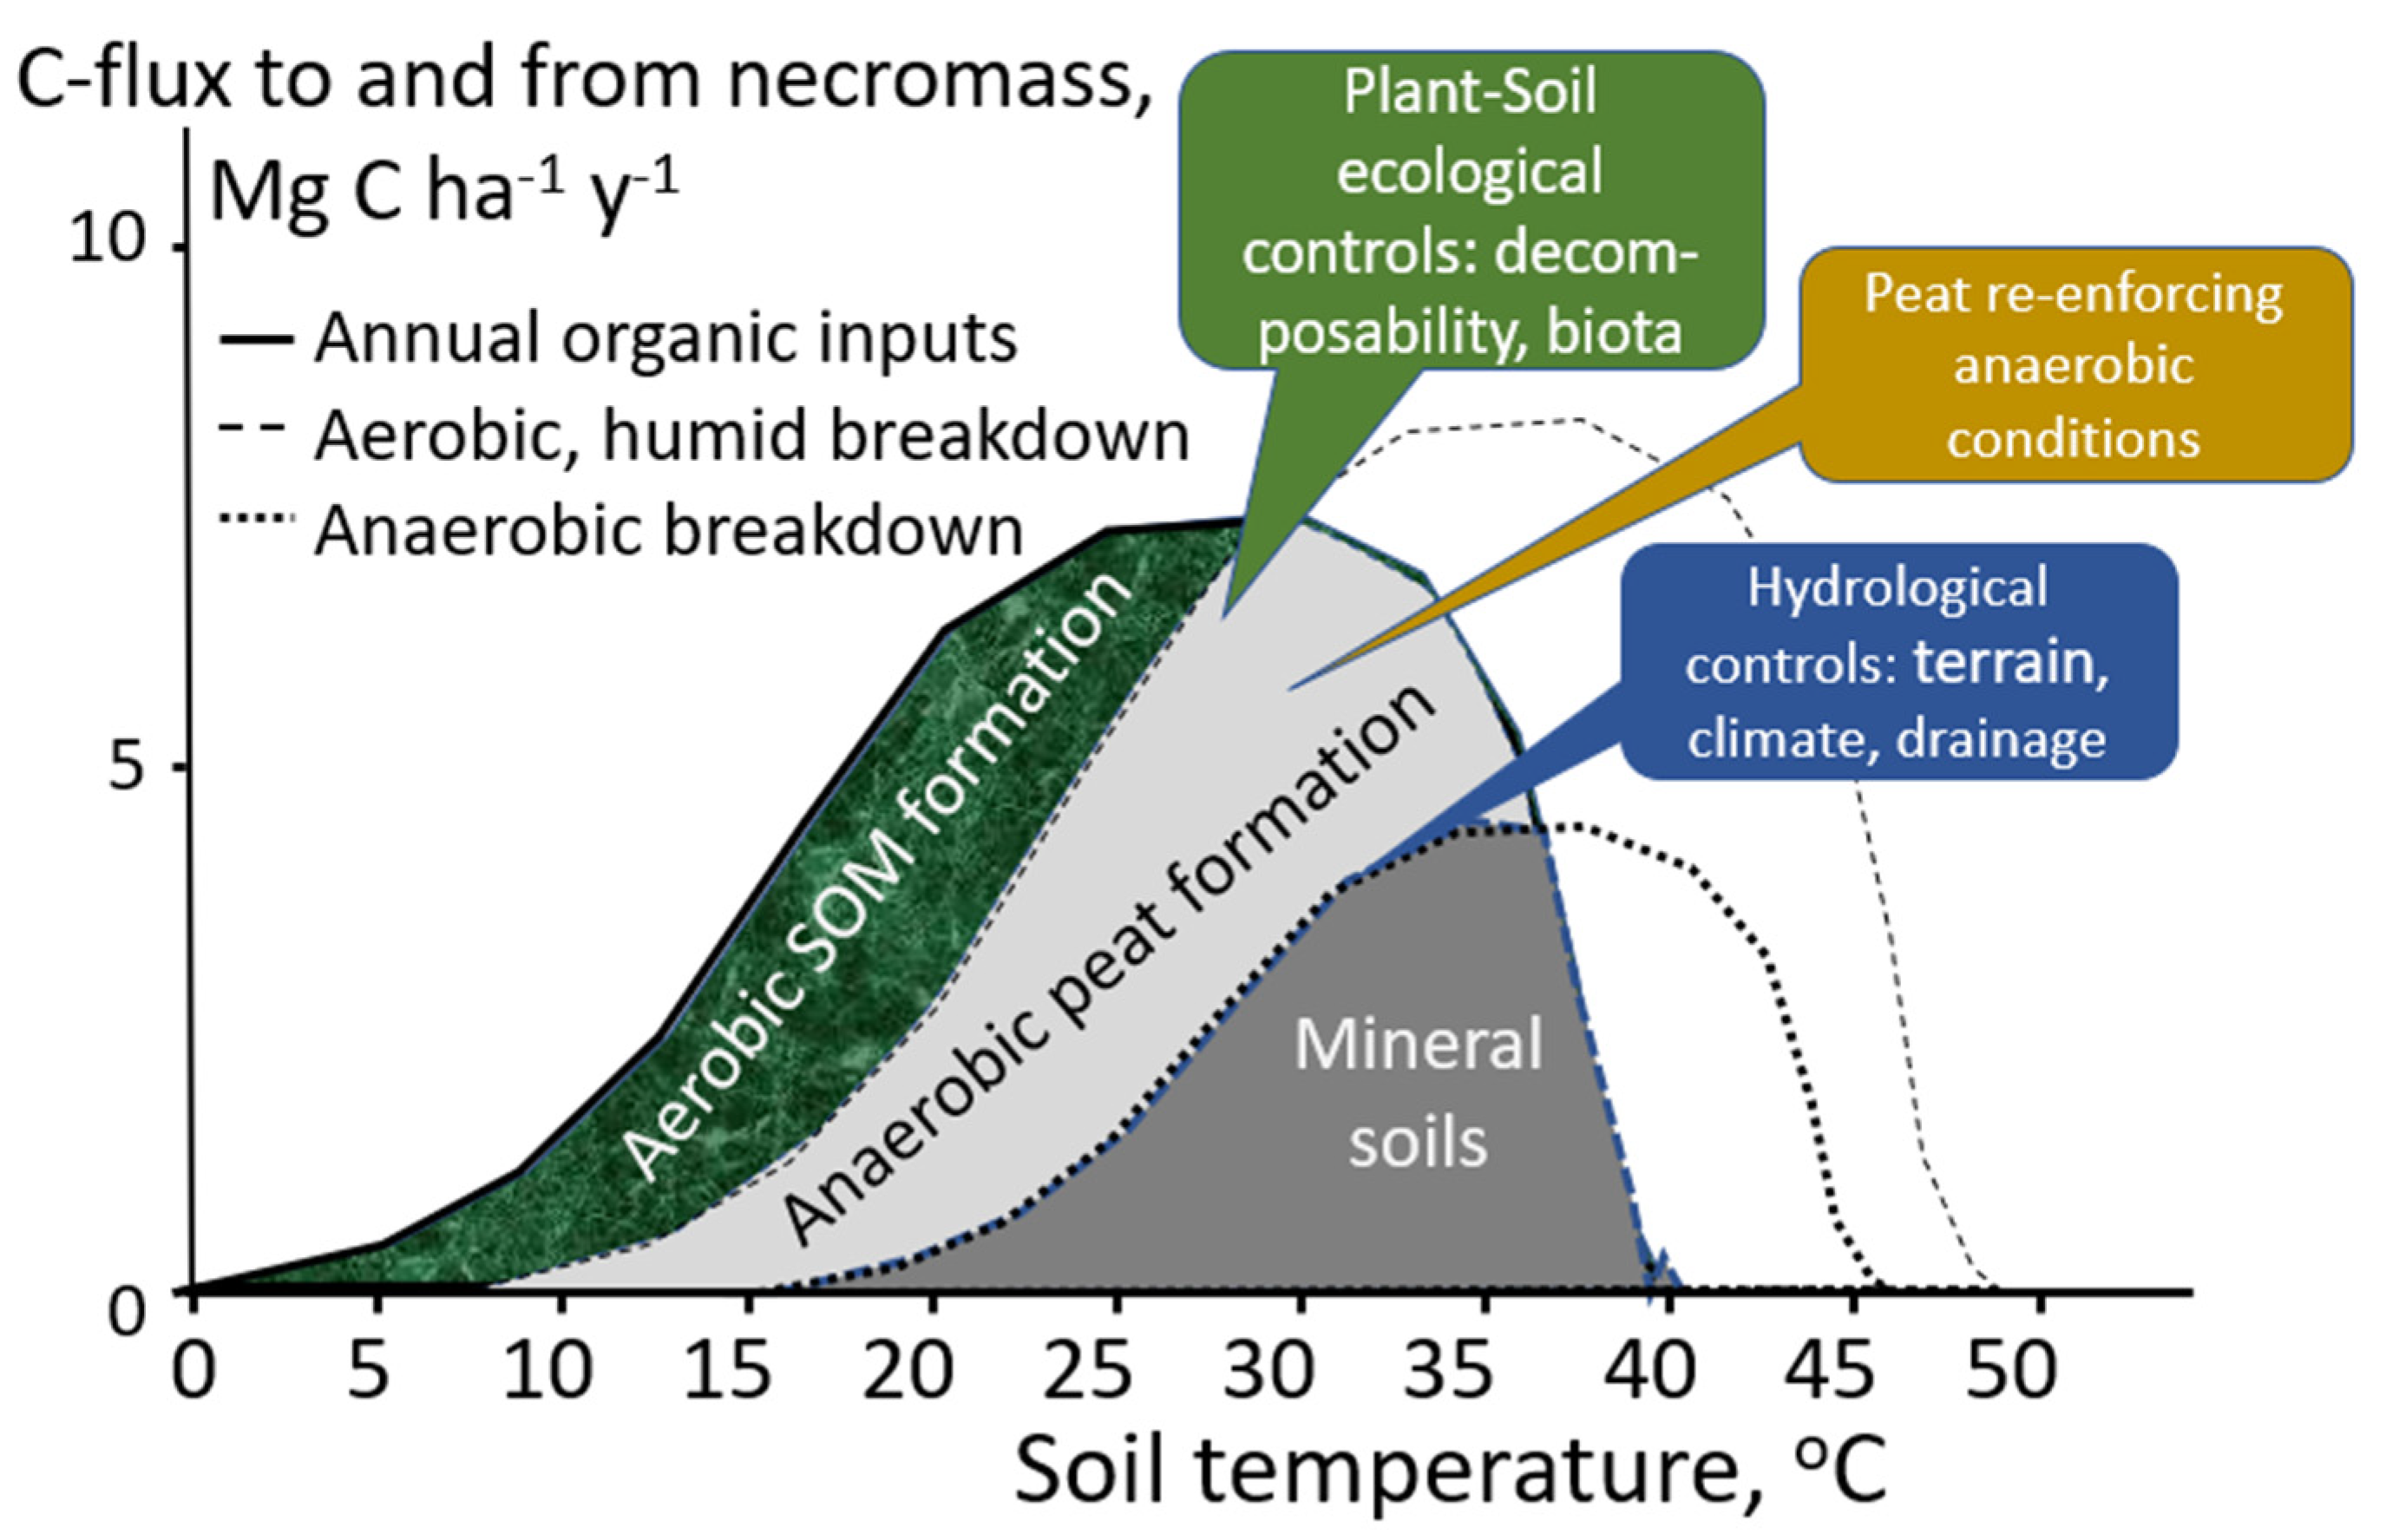
About 40% of the variation in kd estimates could be accounted for by the (L + Pp)/N litter quality indicator, but the slope of relations with soil temperature, groundwater table, or air humidity did not differ significantly from zero (Figure 9).

4. Discussion

The first question for our study addressed differences in rates of litter decomposition between habitats and litter types. The rubber monoculture, RMOy, had the shortest mean residence times (MRT 39 weeks) and highest litter quality (lowest (L + Pp)/N ratio), but also less than half the earthworm numbers found in the other three habitats [33]. The resulting estimates of MRT and standing necromass stocks in the litter layer are consistent with a reasonable estimate of annual litter input: for FAFo, the necromass of 10.3 Mg ha−1 and MRT of 1.05 years would be in equilibrium with an annual litter input of 9.8 Mg ha−1 year−1, while for RAFo, RAFy, and RMOy, equilibrium litter inputs would be 5.4, 4.5, and 11.0 Mg ha−1 year−1, respectively. On average, this is close to the 8 Mg ha−1 year−1 that has been used as a sustainability target for soil organic matter maintenance [15]. The annual litterfall rate in natural forests in the humid tropics of Indonesia is usually above 10 Mg ha−1 year−1, and that in agroforests is above 8 Mg ha−1 year−1 [69,70,71]. Monthly average litter temperatures were consistently 2–4 °C higher in plantation sites in a study in Brazil than in the rainforest and secondary forests in their comparison [72]. Canopy closure strongly determined the litter temperatures in the sites and influenced soil macrofauna biomass. All four habitats in our comparison, however, had a closed canopy, and temperature differences were small (at most 1.3 °C).
The equivalent value for the decomposition constant kd at 20 °C kd was on average 0.564 year−1 (MRT 1.77 years). This is at the slow end of the range of reported litter decomposition values for tropical forests. According to the literature review [73], an average kd value in tropical regions was 2.33 year−1, equivalent to an MRT of 0.43 years and litter stocks that are less than half the annual litter input. For example, the MRTs for litter from Anacardium occidentale, Artocarpus heterophyllus, and Mangifera indica were found to be 0.38, 0.41, and 0.48 years, respectively, in a study in India [74]. Thus, decomposition in the wet agroforests on acid soils for litter with an (L + Pp)/N ratio of around 30 was slow in comparison to other forest ecosystems, but still a considerable distance from the (as yet unknown) threshold of peat formation.
All the land uses studied had a lower tree diversity (with likely consequences for litter decomposition) than the natural peat swamp forests of the region. Vegetation analyses of the nearby Sebangau peat swamp forest [75] documented a mean tree density of 2689 ha−1 (range 1660–3064) and a mean tree basal area of 31.5 m2 ha−1 (range 20.4–44.6), in which the 20–34 m2 ha−1 range of our study (Table 2) is just below the average. Tree diversity in our study habitats is lower than that in natural peat swamp forests [69] but still responsible for diverse litter diets for the soil biota. The authors of [76] found, more upstream in the Pulang Pisau district, the basal area of fruit- and rubber-based agroforests to be 23–59 m2 ha−1 (versus secondary forest 36 m2 ha−1) on silty clay, and 18–38 m2 ha−1 versus 26 m2 ha−1 on sandy soils. The agroforests are forest-like in structure, aboveground biomass, and diversity [33].
In our study, differences in the water table had no direct relationship with the decomposition constant (Figure 9C). Similarly, a study of plant litter decomposition in boreal peatlands [77] found that the direct effects of decreasing water tables were relatively small and were overruled by the indirect effects through changes in litter type composition and production of the changing vegetation. Increased litter inputs from modified vegetation resulted in a large accumulation of organic matter in spite of increased decomposition rates.
A clear limitation of our study was that it only tested aboveground litter sources, while peat formation may be largely dependent on the slow process of woody root turnover, rather than aboveground litter. Beyond the leaf plus twig litter we tested in the litterbags, the more episodic branch and tree turnover (as long as not harvested as source of firewood) makes additional contributions.
The second question addressed the HFA effects between the various habitats when tested in a crossover experiment. The combination of strongly positive and moderately negative HFA results (Table 5), depending on the specific habitats and litter sources involved in the comparison, may challenge any generic theory of the conditions where HFA effects emerge. As suggested before [78], most documentation of HFA refers to monocultures where the decomposer community may become narrowly adapted to the prevailing diet, and in mixed forests, such as what was investigated in the Atlantic rainforest of Brazil, HFA effects are absent, as decomposers are used to diverse diets. In contrast, our strongest HFA results were obtained when external litter sources were tested in the FAFo habitat, the most diverse of all four systems compared. HFA values can be negative, as documented for example by [79] for a grassland to early-successional forest comparison, where despite large differences in litter quality (lignin:N) between the two habitats there was an overall disadvantage for at-home decomposition. In our study, some of the HFA estimates were negative (up to −11%) but modest in size compared to the positive HFA values for other combinations of habitat and litter source.
As soil organic matter (SOM) is largely composed of microbial products rather than plant compounds that resist decomposition, the chemical transformation of leaf litter components during decomposition is critical in controlling SOM formation [49], with changes in litter chemistry more pronounced for the more recalcitrant lodgepole pine (Pinus contorta) litter than the aspen (Populus tremuloides) with which it was compared. Decomposer community specialization may be more important for recalcitrant litter. In our study, however, litter quality as such did not predict the combinations where HFA effects emerged. Litterbag studies [80] in a tropical Malaysian peat swamp (waterlogged, nutrient-poor, anaerobic, and pH 2.9–3.5) showed that the sclerophyllous, toxic leaves of endemic peat forest plants were barely decomposed by bacteria and fungi (decay rates of only 0.219–0.584 year−1, MRT 1.7–4.5 years), while leaves of a secondary forest species had decay rates of around 1.75 year−1 (MRT 0.57 years). The authors concluded that intrinsic properties of the leaves that are adaptations to deter herbivory in the nutrient-poor environment impede microbial breakdown. Important among plant components that deter herbivory, however, are alkaloids that rapidly leach out of plant litter and terpenoids that are generally volatile [81]. A recent study [82] compared the decomposition of leaf litter from Coffea arabica and adjacent mixed forest in Costa Rica. They found a strong HFA effect in short-term studies, while longer-term studies did not confirm the effect, and attributed the difference to the caffeine content of fresh litter. Key attributes of litter quality may thus depend on the length of the study period. Litter can also shift the balance between microbially and fungally dominated decomposition pathways. Litter type was a stronger factor than water table in determining either fungal community composition or turnover of C, N, and P in litter in a study in cutover peatland in Scotland [83].
The third question focused on the relationship between HFA effects and habitat and/or litter quality characteristics. Bonanomi et al. [84] explored how other quality metrics beyond lignin/N ratio and presence of polyphenolics could be closer to the actual microbial decomposition and comminution by other types of soil biota, which remains a frontier of this science.
Literature on the hierarchy among the multiple potential constraints for litter decomposition tends to be site-specific. Water table depth was found to have a strong effect on the decomposition of an external litter source (tea bag method) introduced to temperate Sphagnum peatland [85]. The effectiveness of external nutrient enrichment and litter sources richer in the limiting nutrient on decomposition has been compared [86] in oligotrophic, P-limited herbaceous wetlands of northern Belize. The authors concluded that site enrichment effects were stronger than those of litter quality although both were highly significant. Further HFA studies that include specific nutrient enrichment treatments might give further insights in this context.
The plots compared in this study differed not only in mean groundwater table but also in the rate at which the GWT dropped during the driest part of the year. From data presented in [33], it can be derived that over 142 days in the driest period, the GWT decreased by 3.7 mm/day in RAFy, 3.4 mm/day in RMOy, 2.0 mm/day in RAFo, and 0.46 mm/day in RAFy. Land use that maintains high evapotranspiration rates in the dry period will cause substantial drops in GWT, regardless of the drainage, as influenced by canal blocking. The current government regulation (SK.22/PPKL/PKG/PKL.0/7/2017) requires that water tables are maintained within 40 cm of the peat surface at the center of each plot for at least half of the year and within 100 cm of the surface at all times. If a groundwater table would be −40 cm at the start of a dry season, 150 days at 3.7 mm/day would bring the water table down to about −95 cm, even in the absence of any drainage. Longer dry seasons and/or higher ET rates make it impossible to match the mandated rules in systems that include evergreen trees that maintain ET, rather than shed their leaves.
Finally, the results presented may have some relevance for understanding the thresholds of peat formation when decomposition slows down further. Mirmanto [75] described gradients in tree species composition from close to the river with shallow peat-layers up to the inland with relatively deep peat-layer. The author suggested that the change in nutrient availability from river to peat dome could lead to differences in decomposability and nutrient recycling as explanations of the existence of the specific forms of peat swamp forest encountered but found that the evidence so far is incomplete on such coupling. Our exploration of the riparian side of the gradient in mineral, but in part organic-matter-rich, soils suggests that the threshold for peat formation as bifurcation response is indeed a combination of low litter quality, reduced dry season water use, high acidity, and wet (or explicitly anaerobic?) conditions that are part of a positive feedback loop.
It is clear that in these agroforests no peat is currently formed, with a litter layer of a maximum of 4 cm (Figure 5) and a mean residence time of around two years. We interpret the relatively high Corg concentrations in the young RAFy and RMOy shown in Table 1 as remnants, while Corg in the older FAFO and RAFO is about at the level predicted by a texture-based pedotransfer function for mineral soils [59]. Yet, at what mean residence time an accumulating litter layer could cross the threshold to peat formation is unknown. “By most definitions, the peat thickness must exceed 40 cm before a soil profile can be called peat, but there is also C contained in shallower organic deposits where peat is currently accumulating or has the potential to form if peat-forming plants are present” [87]. Current understanding goes beyond “peat forms whenever C inputs to a peatland exceed C outputs” and emphasizes for Southeast Asia that “The peatlands of this region typically form large domes located behind mangroves along coastal plains and between major rivers. During their development, the peat surface of these systems became increasingly elevated above the surrounding land. As peat accrued, rainwater replaced tidal and riverine flood waters as the principal water source, and the domed peat surface … became increasingly nutrient poor and acidic. The peat-forming vegetation is a type of tropical rainforest—peat swamp forest—that, despite the stressful environmental conditions of anoxia, acidity, and low nutrient availability, has a relatively high tree species diversity” [87].
Our litterbag experiments focused on the early stages of aboveground litter decomposition, while it is recognized that much aboveground production in tropical peats—the leaves especially—is readily decomposed and does not contribute much to the makeup of the peat [88]. Although overall litter production may be dominated by the aboveground component in the tropics, it may actually be the belowground component—fine roots in particular—that is critical in peat formation. This certainly seems to be the case for Southeast Asian peatlands [89]. The decomposition of tree roots depends on water tables. A recent review found subsurface water-table fluctuations from pristine forested tropical peatlands have been reported to vary from about 25 to 90 cm [90]—a range similar to what we documented for the agroforests. Peat swamp forests have a remarkable microtopographic differentiation between hummocks and hollows [91]—more than we found in the agroforests.
As the decrease in groundwater tables during the dry season may depend primarily on evapotranspiration by the vegetation, there is a risk that locally adapted vegetation that is deep-rooted and maintains active canopy growth during dry seasons dries up adjacent peat areas—as may be the case for fast-growing timber plantations managed for the pulp and paper industry elsewhere in Indonesia. The old agroforests included in this research appear to have less effect than the young agroforests and rubber plantation [33].
A number of other studies have derived positive conclusions on the use of agroforestry practices in rewetting, restoring, and conserving peatland landscapes in Central Kalimantan [92,93] and elsewhere in Indonesia [94,95] and Asia [96]. Giesen and Sari [97] discussed sago cultivation as the best example of tropical paludiculture in Indonesia, compatible with peat conservation. They also described a gap between paludiculture–agroforestry ambitions and what has been demonstrated yet to be bio-economically feasible. Most studies have so far focused on the plot-level properties, rather than the landscape-level interactions. Our parallel study of the hydrology of Kaleka agroforests [33], which related hydrological functions and plant diversity to climate mitigation and biodiversity conservation, concluded that the positive role at the landscape scale of Kaleka agroforests that function well at high groundwater tables is primarily that they allow adjacent peat areas to remain wet, or recover as a result of canal blocking. We now conclude that while the wet agroforests studied support landscape-level rewetting strategies and protect peat dome hinterlands from drying and fire, they do not contribute to in situ peat formation.

5. Conclusions

On the basis of the evidence presented, we formulated five conclusions:
  • The mean residence times for aboveground litter in wet agroforests were around 85 weeks, about 2 times longer than expected given litter quality and temperature, which was likely due to wet and acid soil conditions.
  • Home-field advantage indices showing up to 80% faster decomposition in the home environment in specific habitat–litter combinations may reflect strong adaptation of decomposers to local litter sources.
  • Overall, the ratio of lignin plus polyphenolics and nitrogen accounted for 40% of the variance in decomposition constant kd, indicating other more specific quality indicators can play a role.
  • The measured litter residence times in wet agroforests support litter stocks larger than annual litterfall but are still far below the (as yet unknown) thresholds for peat formation.
  • While the wet agroforests studied support landscape-level rewetting strategies and protect peat dome hinterlands from drying and fire, they do not contribute to in situ peat formation.

Author Contributions

Conceptualization, Y.A.S., M.v.N., D.S. and K.H.; methodology, Y.A.S., M.v.N., D.S. and K.H.; investigation, Y.A.S.; data curation, Y.A.S. and M.v.N.; writing—original draft preparation, Y.A.S. and M.v.N.; writing—review and editing, all coauthors. All authors have read and agreed to the published version of the manuscript.

Funding

This research was supported by the Ph.D. scholarship for the first author from the Indonesian Ministry of Research, Technology and Higher Education.

Institutional Review Board Statement

Not applicable.

Informed Consent Statement

Not applicable.

Data Availability Statement

Basic data will be made available at https://data.worldagroforestry.org/.

Acknowledgments

Our deep gratitude to the people in Henda village for welcoming the research, and especially to the Lambung and Dillin family who hosted and facilitated the senior author during her fieldwork.

Conflicts of Interest

The authors declare no conflict of interest. The funders had no role in the design of the study; in the collection, analyses, or interpretation of data; in the writing of the manuscript; or in the decision to publish the results.

References

  1. Mohr, E.C.J.; van Baren, F.A.; van Schuylenborgh, J. Tropical Soils, A Comprehensive Study of their Genesis, 3rd ed.; Mouton: Paris, France; Ichtiar Baru: Jakarta, Indonesia; Van Hoeve: The Hague, The Netherlands, 1972. [Google Scholar]
  2. Havinga, A.J.; Muller, J. In Memoriam Betje Polak (1901–1980), pioneer of peat research in The Netherlands and in the tropics. Acta Bot. Neerl. 1981, 30, 337–343. [Google Scholar] [CrossRef]
  3. Polak, B. Veen en veenontginning in Indonesia [Peat and peat exploitation in Indonesia]. Indones. J. Nat. Sci. 1952, 5, 146–160. [Google Scholar]
  4. Anda, M.; Ritung, S.; Suryani, E.; Hikmat, M.; Yatno, E.; Mulyani, A.; Subandiono, R.E. Revisiting tropical peatlands in Indonesia: Semi-detailed mapping, extent and depth distribution assessment. Geoderma 2021, 402, 115235. [Google Scholar] [CrossRef]
  5. Kiew, F.; Hirata, R.; Hirano, T.; Xhuan, W.G.; Aries, E.B.; Kemudang, K.; Wenceslaus, J.; San, L.K.; Melling, L. Carbon dioxide balance of an oil palm plantation established on tropical peat. Agric. For. Meteorol. 2020, 295, 108189. [Google Scholar] [CrossRef]
  6. Page, S.E.; Hooijer, A. In the line of fire: The peatlands of Southeast Asia. Philos. Trans. R. Soc. B Biol. Sci. 2016, 371, 20150176. [Google Scholar] [CrossRef] [Green Version]
  7. McCalmont, J.; Kho, L.K.; Teh, Y.A.; Lewis, K.; Chocholek, M.; Rumpang, E.; Hill, T. Short-and long-term carbon emissions from oil palm plantations converted from logged tropical peat swamp forest. Glob. Change Biol. 2021, 27, 2361–2376. [Google Scholar] [CrossRef]
  8. Dohong, A.; Aziz, A.A.; Dargusch, P. A review of the drivers of tropical peatland degradation in South-East Asia. Land Use Policy 2017, 69, 349–360. [Google Scholar] [CrossRef]
  9. Page, S.; Hosciło, A.; Wösten, H.; Jauhiainen, J.; Silvius, M.; Rieley, J.; Ritzema, H.; Tansey, K.; Graham, L.; Vasander, H. Restoration ecology of lowland tropical peatlands in Southeast Asia: Current knowledge and future research directions. Ecosystems 2009, 12, 888–905. [Google Scholar] [CrossRef]
  10. Swift, M.J.; Heal, O.W.; Anderson, J.M. Decomposition in Terrestrial Ecosystems; University of California Press: Berkeley, CA, USA, 1979. [Google Scholar]
  11. Handa, I.T.; Aerts, R.; Berendse, F.; Berg, M.P.; Bruder, A.; Butenschoen, O.; Chauvet, E.; Gessner, M.O.; Jabiol, J.; Makkonen, M.; et al. Consequences of biodiversity loss for litter decomposition across biomes. Nature 2014, 509, 218. [Google Scholar] [CrossRef] [Green Version]
  12. Bradford, M.A.; Berg, B.; Maynard, D.S.; Wieder, W.R.; Wood, S.A. Understanding the dominant controls on litter decomposition. J. Ecol. 2016, 104, 229–238. [Google Scholar] [CrossRef]
  13. Giweta, M. Role of litter production and its decomposition, and factors affecting the processes in a tropical forest ecosystem: A review. J. Ecol. Environ. 2020, 44, 1–9. [Google Scholar] [CrossRef]
  14. Anderson, J.M.; Ingram, J.S.I. Tropical Soil Biology and Fertility. A Handbook of Methods, 2nd ed.; CAB International: Wallingford, UK, 1993. [Google Scholar]
  15. Hairiah, K.; Utami, S.R.; Suprayogo, D.; Sunaryo, D.; Sitompul, S.M.; Lusiana, B.; Mulia, R.; van Noordwijk, M.; Cadisch, G. Pengelolaan Tanah Masam Secara Biologi. Refleksi Pengalaman dari Lampung Utara [Biological Management of Acid Soils: Reflections from Research in North Lampung]; International Centre for Research in Agroforestry: Bogor, Indonesia, 2000. [Google Scholar]
  16. Hairiah, K.; Sulistyani, H.; Suprayogo, D.; Purnomosidhi, P.; Widodo, R.H.; Van Noordwijk, M. Litter layer residence time in forest and coffee agroforestry systems in Sumberjaya, West Lampung. For. Ecol. Manag. 2006, 224, 45–57. [Google Scholar] [CrossRef]
  17. Hairiah, K.; Dewi, S.; Agus, F.; Velarde, S.; Ekadinata, A.; Rahayu, S.; van Noordwijk, M. Measuring Carbon Stocks: Across Land Use Systems: A Manual; World Agroforestry (ICRAF): Bogor, Indonesia, 2011. [Google Scholar]
  18. Palm, C.A.; Sanchez, P.A. Nitrogen release from the leaves of some tropical legumes as affected by their lignin and polyphenolic contents. Soil Biol. Biochem. 1991, 23, 83–88. [Google Scholar] [CrossRef]
  19. Zhang, D.; Hui, D.; Luo, Y.; Zhou, G. Rates of litter decomposition in terrestrial ecosystems: Global patterns and controlling factors. J. Plant Ecol. 2008, 1, 85–93. [Google Scholar] [CrossRef] [Green Version]
  20. Van Noordwijk, M.; Martikainen, P.; Bottner, P.; Cuevas, E.; Rouland, C.; Dhillion, S.S. Global change and root function. Glob. Change Biol. 1998, 4, 759–772. [Google Scholar] [CrossRef]
  21. Medrilzam, M.; Smith, C.; Aziz, A.A.; Herbohn, J.; Dargusch, P. Smallholder Farmers and the Dynamics of Degradation of Peatland Ecosystems in Central Kalimantan, Indonesia. Ecol. Econ. 2017, 136, 101–113. [Google Scholar] [CrossRef]
  22. Taufik, M.; Setiawan, B.I.; Van Lanen, H.A. Increased fire hazard in human-modified wetlands in Southeast Asia. Ambio 2019, 48, 363–373. [Google Scholar] [CrossRef]
  23. Jaenicke, J.; Wösten, H.; Budiman, A.; Siegert, F. Planning hydrological restoration of peatlands in Indonesia to mitigate carbon dioxide emissions. Mitig. Adapt. Strateg. Glob. Chang. 2010, 15, 223–239. [Google Scholar] [CrossRef] [Green Version]
  24. Jefferson, U.; Carmenta, R.; Daeli, W.; Phelps, J. Characterising policy responses to complex socio-ecological problems: 60 fire management interventions in Indonesian peatlands. Glob. Environ. Chang. 2020, 60, 102027. [Google Scholar] [CrossRef]
  25. Van Noordwijk, M.; Matthews, R.; Agus, F.; Farmer, J.; Verchot, L.; Hergoualc’h, K.; Dewi, S. Mud, muddle and models in the knowledge value-chain to action on tropical peatland conservation. Mitig. Adapt. Strateg. Glob. Change 2014, 19, 887–905. [Google Scholar] [CrossRef] [Green Version]
  26. Tata, H.L. Mixed farming systems on peatlands in Jambi and Central Kalimantan provinces, Indonesia: Should they be described as paludiculture? Mires Peat 2019, 25, 8. [Google Scholar]
  27. Widayati, A.; Tata, H.L.; van Noordwijk, M. Agroforestry on Peatlands: Combining Productive and Protective Functions as Part of Restoration; Policy Brief No. 70; Agroforestry Options for ASEAN Series No. 4; World Agroforestry Centre (ICRAF): Bogor, Indonesia, 2016. [Google Scholar]
  28. Wichtmann, W.; Schröder, C.; Joosten, H. Paludiculture-Productive Use of Wet Peatlands; Schweizerbart Science Publishers: Stuttgart, Germany, 2016. [Google Scholar]
  29. Ziegler, R. Paludiculture as a critical sustainability innovation mission. Res. Policy 2020, 49, 103979. [Google Scholar] [CrossRef]
  30. Froufe, L.C.M.; Schwiderke, D.K.; Castilhano, A.C.; Cezar, R.M.; Steenbock, W.; Seoane, C.E.S.; Bognnola, I.A.; Vezzani, F.M. Nutrient cycling from leaf litter in multistrata successional agroforestry systems and natural regeneration at Brazilian Atlantic Rainforest Biome. Agrofor. Syst. 2020, 94, 159–171. [Google Scholar] [CrossRef]
  31. Prescott, C.E. Do rates of litter decomposition tell us anything we really need to know? For. Ecol. Manag. 2005, 220, 66–74. [Google Scholar] [CrossRef]
  32. Silvianingsih, Y.A.; Hairiah, K.; Suprayogo, D.; van Noordwijk, M. Agroforests swiddening and livelihoods between restored peat domes and river: Effects of the 2015 fire ban in Central Kalimantan (Indonesia). Int. For. Rev. 2020, 22, 382–396. [Google Scholar] [CrossRef]
  33. Silvianingsih, Y.A.; Hairiah, K.; Suprayogo, D.; van Noordwijk, M. Kaleka agroforest in Central Kalimantan (Indonesia): Soil quality, hydrological protection of adjacent peatlands, and sustainability. Land 2021, 10, 856. [Google Scholar] [CrossRef]
  34. Hättenschwiler, S.; Tiunov, A.V.; Scheu, S. Biodiversity and litter decomposition in terrestrial ecosystems. Annu. Rev. Ecol. Evol. Syst. 2005, 36, 191–218. [Google Scholar] [CrossRef]
  35. Martinez-Yrizar, A.; Nuñez, S.; Burquez, A. Leaf litter decomposition in a southern Sonoran Desert ecosystem, northwestern Mexico: Effects of habitat and litter quality. Acta Oecol. 2007, 32, 291–300. [Google Scholar] [CrossRef]
  36. Gholz, H.L.; Wedin, D.A.; Smitherman, S.M.; Harmon, M.E.; Parton, W.J. Long-term dynamics of pine and hardwood litter in contrasting environments: Toward a global model of decomposition. Glob. Change Biol. 2000, 6, 751–765. [Google Scholar] [CrossRef]
  37. Delgado-Baquerizo, M.; García-Palacios, P.; Milla, R.; Gallardo, A.; Maestre, F.T. Soil characteristics determine soil carbon and nitrogen availability during leaf litter decomposition regardless of litter quality. Soil Biol. Biochem. 2015, 81, 134–142. [Google Scholar] [CrossRef]
  38. Tian, G.; Brussaard, L.; Kang, B.T. Biological effects of plant residues with contrasting chemical compositions under humid tropical conditions: Effects on soil fauna. Soil Biol. Biochem. 1993, 25, 731–737. [Google Scholar] [CrossRef] [Green Version]
  39. Krishna, M.P.; Mohan, M. Litter decomposition in forest ecosystems: A review. Energy Ecol. Environ. 2017, 2, 236–249. [Google Scholar] [CrossRef]
  40. Strickland, M.S.; Lauber, C.; Fierer, N.; Bradford, M.A. Testing the functional significance of microbial community composition. Ecology 2009, 90, 441–451. [Google Scholar] [CrossRef] [Green Version]
  41. Keiser, A.D.; Keiser, D.A.; Strickland, M.S.; Bradford, M.A. Disentangling the mechanisms underlying functional differences among decomposer communities. J. Ecol. 2014, 102, 603–609. [Google Scholar] [CrossRef]
  42. Cleveland, C.C.; Reed, S.C.; Keller, A.B.; Nemergut, D.R.; O’Neill, S.P.; Ostertag, R.; Vitousek, P.M. Litter quality versus soil microbial community controls over decomposition: A quantitative analysis. Oecologia 2014, 174, 283–294. [Google Scholar] [CrossRef] [PubMed]
  43. Hoorens, B.; Aerts, R.; Stroetenga, M. Does initial litter chemistry explain litter mixture effects on decomposition? Oecologia 2003, 137, 578–586. [Google Scholar] [CrossRef]
  44. Berg, B.; Steffen, K.T.; McClaugherty, C. Litter decomposition rate is dependent on litter Mn concentrations. Biogeochemistry 2007, 82, 29–39. [Google Scholar] [CrossRef]
  45. Di Lonardo, D.P.; Manrubia, M.; De Boer, W.; Zweers, H.; Veen, G.F.; Van der Wal, A. Relationship between home-field advantage of litter decomposition and priming of soil organic matter. Soil Biol. Biochem. 2018, 126, 49–56. [Google Scholar] [CrossRef]
  46. Ayres, E.; Steltzer, H.; Simmons, B.L.; Simpson, R.T.; Steinweg, J.M.; Wallenstein, M.D.; Mellor, N.; Parton, W.J.; Moore, J.C.; Wall, D.H. Home-field advantage accelerates leaf litter decomposition in forests. Soil Biol. Biochem. 2009, 41, 606–610. [Google Scholar] [CrossRef]
  47. Ayres, E.; Steltzer, H.; Berg, S.; Wall, D.H. Soil biota accelerate decomposition in high-elevation forests by specializing in the breakdown of litter produced by the plant species above them. J. Ecol. 2009, 97, 901–912. [Google Scholar] [CrossRef]
  48. Veen, G.F.; Sundqvist, M.K.; Wardle, D.A. Environmental factors and traits that drive plant litter decomposition do not determine home-field advantage effects. Funct. Ecol. 2015, 29, 981–991. [Google Scholar] [CrossRef] [Green Version]
  49. Wallenstein, M.D.; Haddix, M.L.; Ayres, E.; Steltzer, H.; Magrini-Bair, K.A.; Paul, E.A. Litter chemistry changes more rapidly when decomposed at home but converges during decomposition–transformation. Soil Biol. Biochem. 2013, 57, 311–319. [Google Scholar] [CrossRef]
  50. Kagata, H.; Ohgushi, T. Home-field advantage in decomposition of leaf litter and insect frass. Popul. Ecol. 2013, 55, 69–76. [Google Scholar] [CrossRef]
  51. Hairiah, K.; van Noordwijk, M.; Mardiani, M.O.; Alhusna, M.; Khurniawati, D.N.; Ayun, C.; Prayogo, C.; Rowe, R.L.; McNamara, N.P. Dietary diversity preference, home-field advantage, macrofauna and microclimate effects in aboveground litter decomposition in coffee and pine agroforestry. 2021. [Google Scholar]
  52. Bradford, M.A.; Veen, G.C.; Bonis, A.; Bradford, E.M.; Classen, A.T.; Cornelissen, J.H.C.; Crowther, T.W.; Jonathan, R.; Freschet, G.T.; Kardol, P.; et al. A test of the hierarchical model of litter decomposition. Nat. Ecol. Evol. 2017, 1, 1836. [Google Scholar] [CrossRef] [PubMed]
  53. Lin, H.; He, Z.; Hao, J.; Tian, K.; Jia, X.; Kong, X.; Akbar, S.; Bei, Z.; Tian, X. Effect of N addition on home-field advantage of litter decomposition in subtropical forests. For. Ecol. Manag. 2017, 398, 216–225. [Google Scholar] [CrossRef]
  54. Bridgham, S.D.; Richardson, C.J. Endogenous versus exogenous nutrient control over decomposition and mineralization in North Carolina peatlands. Biogeochemistry 2003, 65, 151–178. [Google Scholar] [CrossRef]
  55. Clarkson, B.R.; Moore, T.R.; Fitzgerald, N.B.; Thornburrow, D.; Watts, C.H.; Miller, S. Water table regime regulates litter decomposition in restiad peatlands, New Zealand. Ecosystems 2014, 17, 317–326. [Google Scholar] [CrossRef]
  56. Lopez-Sangil, L.; Hartley, I.P.; Rovira, P.; Casals, P.; Sayer, E.J. Drying and rewetting conditions differentially affect the mineralization of fresh plant litter and extant soil organic matter. Soil Biol. Biochem. 2018, 124, 81–89. [Google Scholar] [CrossRef] [Green Version]
  57. BMKG: Badan Meteorologi, Klimatologi dan Geofisika Palangka Raya. Kalimantan Tengah, 2019. Available online: https://www.bmkg.go.id/iklim (accessed on 4 September 2021).
  58. Badan Pusat Statistik (BPS). Kecamatan Jabiren Raya dalam Angka; National Bureau of Statistics: Jakarta, Indonesia, 2018.
  59. Hairiah, K.; van Noordwijk, M.; Sari, R.R.; Saputra, D.D.; Suprayogo, D.; Kurniawan, S.; Prayogo, C.; Gusli, S. Soil carbon stocks in Indonesian (agro) forest transitions: Compaction conceals lower carbon concentrations in standard accounting. Agric. Ecosyst. Environ. 2020, 294, 106879. [Google Scholar] [CrossRef]
  60. Schinner, F.; Öhlinger, R.; Kandeler, E.; Margesin, R. (Eds.) Methods in Soil Biology; Springer: Berlin/Heidelberg, Germany, 2012. [Google Scholar]
  61. Walela, C.; Daniel, H.; Wilson, B.; Lockwood, P.; Cowie, A.; Harden, S. The initial lignin: Nitrogen ratio of litter from above and below ground sources strongly and negatively influenced decay rates of slowly decomposing litter carbon pools. Soil Biol. Biochem. 2014, 77, 268–275. [Google Scholar] [CrossRef]
  62. Vanlauwe, B.; Gachengo, C.; Shepherd, K.; Barrios, E.; Cadisch, G.; Palm, C.A. Laboratory validation of a resource quality-based conceptual framework for organic matter management. Soil Sci. Soc. Am. J. 2005, 69, 1135–1145. [Google Scholar] [CrossRef] [Green Version]
  63. Goering, H.U.; Van Soest, P.J. Forage Fiber Analyses (Apparatus, Reagents, Procedures, and Some Applications); Report No 379; US Agricultural Research Service: Washington, DC, USA, 1970.
  64. Van Soest, P.J.; McQueen, R.W. The chemistry and estimation of fibre. Proc. Nutr. Soc. 1973, 32, 123–130. [Google Scholar] [CrossRef] [PubMed] [Green Version]
  65. Gessner, M.O. Proximate lignin and cellulose. In Methods to Study Litter Decomposition; Graça, M.A.S., Bärlocher, F., Gessner, M.O., Eds.; Springer: Dordrecht, The Netherlands, 2005; pp. 115–120. [Google Scholar]
  66. Olson, J.S. Energy storage and the balance of producers and decomposers in ecological systems. Ecology 1963, 44, 322–331. [Google Scholar] [CrossRef] [Green Version]
  67. Fierer, N.; Craine, J.M.; McLauchlan, K.; Schimel, J.P. Litter quality and the temperature sensitivity of decomposition. Ecology 2005, 86, 320–326. [Google Scholar] [CrossRef] [Green Version]
  68. Austin, A.T.; Vivanco, L.; González-Arzac, A.; Pérez, L.I. There’s no place like home? An exploration of the mechanisms behind plant litter–decomposer affinity in terrestrial ecosystems. New Phytol. 2014, 204, 307–314. [Google Scholar] [CrossRef]
  69. Tjitrosemito, S.; Guhardja, E.; Qayim, I.; Leuschner, C. Litterfall production and leaf-litter decomposition at natural forest and cacao agroforestry in Central Sulawesi, Indonesia. Asian J. Biol. Sci. 2011, 4, 221–234. [Google Scholar]
  70. Nanda, F.; Muhammad, A.; Fatonah, S. Laju Produksi Serasah Dalam Dua Sistem Budidaya Karet Pada Lahan Gambut di Kawasan Rimbo Panjang, Riau. 2013. Available online: https://repository.unri.ac.id/xmlui/bitstream/handle/123456789/2399/Karya%20Ilmiah%20Fristya%20Nanda%2026%2001%202013.pdf?sequence=1&isAllowed=y (accessed on 4 September 2021).
  71. Sari, R.R.; Saputra, D.D.; Hairiah, K.; Rozendaal, D.; Roshetko, J.M.; van Noordwijk, M. Gendered species preferences link tree diversity and carbon stocks in cacao agroforest in Southeast Sulawesi, Indonesia. Land 2020, 9, 108. [Google Scholar] [CrossRef] [Green Version]
  72. Martius, C.; Höfer, H.; Garcia, M.V.; Römbke, J.; Förster, B.; Hanagarth, W. Microclimate in agroforestry systems in central Amazonia: Does canopy closure matter to soil organisms? Agrofor. Syst. 2004, 60, 291–304. [Google Scholar] [CrossRef]
  73. Ge, X.; Zeng, L.; Xiao, W.; Huang, Z.; Geng, X.; Tan, B. Effect of litter substrate quality and soil nutrients on forest litter decomposition: A review. Acta Ecol. Sin. 2013, 33, 102–108. [Google Scholar] [CrossRef]
  74. Isaac, S.R.; Nair, M.A. Biodegradation of leaf litter in the warm humid tropics of Kerala, India. Soil Biol. Biochem. 2005, 37, 1656–1664. [Google Scholar] [CrossRef]
  75. Mirmanto, E. Vegetation analyses of Sebangau peat swamp forest, Central Kalimantan. Biodivers. J. Biol. Divers. 2010, 11, 82–88. [Google Scholar] [CrossRef]
  76. Natalia, D.; Arisoesilaningsih, E.; Hairiah, K. Are high carbon stocks in agroforests and forest associated with high plant species diversity? Agrivita 2016, 39, 74–82. [Google Scholar] [CrossRef] [Green Version]
  77. Straková, P.; Penttilä, T.; Laine, J.; Laiho, R. Disentangling direct and indirect effects of water table drawdown on above-and belowground plant litter decomposition: Consequences for accumulation of organic matter in boreal peatlands. Glob. Change Biol. 2012, 18, 322–335. [Google Scholar] [CrossRef]
  78. Gießelmann, U.C.; Martins, K.G.; Brändle, M.; Schädler, M.; Marques, R.; Brandl, R. Lack of home-field advantage in the decomposition of leaf litter in the Atlantic Rainforest of Brazil. Appl. Soil Ecol. 2011, 49, 5–10. [Google Scholar] [CrossRef]
  79. John, M.G.S.; Orwin, K.H.; Dickie, I.A. No ‘home’ versus ‘away’ effects of decomposition found in a grassland–forest reciprocal litter transplant study. Soil Biol. Biochem. 2011, 43, 1482–1489. [Google Scholar] [CrossRef]
  80. Yule, C.M.; Gomez, L.N. Leaf litter decomposition in a tropical peat swamp forest in Peninsular Malaysia. Wetl. Ecol. Manag. 2009, 17, 231–241. [Google Scholar] [CrossRef]
  81. Chomel, M.; Guittonny-Larchevêque, M.; Fernandez, C.; Gallet, C.; DesRochers, A.; Paré, D.; Jackson, B.G.; Baldy, V. Plant secondary metabolites: A key driver of litter decomposition and soil nutrient cycling. J. Ecol. 2016, 104, 1527–1541. [Google Scholar] [CrossRef]
  82. Schmitt, L.; Perfecto, I. Coffee leaf litter decomposition: Short term home-field advantage in shaded coffee agro-ecosystems. Appl. Soil Ecol. 2021, 161, 103854. [Google Scholar] [CrossRef]
  83. Trinder, C.J.; Johnson, D.; Artz, R.R. Interactions among fungal community structure, litter decomposition and depth of water table in a cutover peatland. FEMS Microbiol. Ecol. 2008, 64, 433–448. [Google Scholar] [CrossRef] [Green Version]
  84. Bonanomi, G.; Incerti, G.; Giannino, F.; Mingo, A.; Lanzotti, V.; Mazzoleni, S. Litter quality assessed by solid state 13C NMR spectroscopy predicts decay rate better than C/N and Lignin/N ratios. Soil Biol. Biochem. 2013, 56, 40–48. [Google Scholar] [CrossRef]
  85. Górecki, K.; Rastogi, A.; Stróżecki, M.; Gąbka, M.; Lamentowicz, M.; Łuców, D.; Kayzer, D.; Juszczak, R. Water table depth, experimental warming, and reduced precipitation impact on litter decomposition in a temperate Sphagnum-peatland. Sci. Total Environ. 2021, 771, 145452. [Google Scholar] [CrossRef] [PubMed]
  86. Rejmánková, E.; Houdková, K. Wetland plant decomposition under different nutrient conditions: What is more important, litter quality or site quality? Biogeochemistry 2006, 80, 245–262. [Google Scholar] [CrossRef]
  87. Page, S.E.; Baird, A.J. Peatlands and global change: Response and resilience. Annu. Rev. Environ. Resour. 2016, 41, 35–57. [Google Scholar] [CrossRef]
  88. Chimner, R.A.; Ewel, K.C. A tropical freshwater wetland: II. Production, decomposition and peat formation. Wet. Ecol. Manag. 2005, 13, 671–684. [Google Scholar] [CrossRef]
  89. Brady, M.A. Organic Matter Dynamics of Coastal Peat Deposits in Sumatra, Indonesia. Ph.D. Thesis, Department of Forestry, University of British Columbia, Vancouver, BC, Canada, 1997. Available online: https://open.library.ubc.ca/cIRcle/collections/ubctheses/831/items/1.0075286 (accessed on 25 January 2022).
  90. Bacon, K.L.; Baird, A.J.; Blundell, A.; Bourgault, M.A.; Chapman, P.J.; Dargie, G.; Dooling, G.P.; Gee, C.; Holden, J.; Kelly, T.J.; et al. Questioning ten common assumptions about peatlands. Mires Peat 2017, 19, 1–23. Available online: https://eprints.whiterose.ac.uk/119944/1/map_19_12.pdf (accessed on 25 January 2022).
  91. Jauhiainen, J.; Takahashi, H.; Heikkinen, J.E.P.; Martikainen, P.J.; Vasander, H. Carbon fluxes from a tropical peat swamp forest floor. Glob. Change Biol. 2005, 11, 1788–1797. [Google Scholar] [CrossRef]
  92. Applegate, G.; Freeman, B.; Tular, B.; Sitadevi, L.; Jessup, T.C. Application of agroforestry business models to tropical peatland restoration. Ambio 2021, 1–12. [Google Scholar] [CrossRef] [PubMed]
  93. Surahman, A.; Soni, P.; Shivakoti, G.P. Reducing CO2 emissions and supporting food security in Central Kalimantan, Indonesia, with improved peatland management. Land Use Policy 2018, 72, 325–332. [Google Scholar] [CrossRef]
  94. Budiman, I.; Sari, E.N.; Hadi, E.E.; Siahaan, H.; Januar, R.; Hapsari, R.D. Progress of paludiculture projects in supporting peatland ecosystem restoration in Indonesia. Glob. Ecol. Conserv. 2020, 23, e01084. [Google Scholar] [CrossRef]
  95. Van Noordwijk, M.; Ekadinata, A.; Leimona, B.; Catacutan, D.; Martini, E.; Tata, H.L.; Öborn, I.; Hairiah, K.; Prasit Wangpakapattanawong, M.R.; Dewi, S.; et al. Agroforestry options for degraded landscapes in Southeast Asia. In Agroforestry for Degraded Landscapes; Springer: Singapore, 2020; pp. 307–347. [Google Scholar]
  96. He, G.; Wang, K.; Zhong, Q.; Zhang, G.; van den Bosch, C.K.; Wang, J. Agroforestry reclamations decreased the CO2 budget of a coastal wetland in the Yangtze estuary. Agric. For. Meteorol. 2021, 296, 108212. [Google Scholar] [CrossRef]
  97. Giesen, W.; Sari, E.N.N. Tropical Peatland Restoration Report: The Indonesian Case; Berbak Green Prosperity Partnership—MCA: Jakarta, Indonesia, 2018; Available online: https://luk.staff.ugm.ac.id/rawa/GiesenNirmala2018TropicalPeatlandRestorationReportIndonesiaForBRG.pdf (accessed on 5 September 2021).
Figure 1. Rate of breakdown and formation of soil organic matter (SOM) as related to temperature, hydrological, and plant–soil ecological controls (modified from [1]).
Soilsystems 06 00019 g001
Figure 2. Authors’ synthesis of factors that can influence the threshold between mineral and peat soils depending on decomposition rates (3) that depend on litter quantity and quality (2) and soil conditions, which depend on water balance (1, and thus on climate, evapotranspiration, and drainage), vegetation, and fire incidence (4).
Soilsystems 06 00019 g002
Figure 3. Location of research in Henda village, Pulang Pisau Regency, Central Kalimantan, Indonesia (using Google Earth imagery available in January 2022).
Soilsystems 06 00019 g003
Figure 4. Design of litter transfer experiment where four litter types were tested in four habitats (land cover types), including its “home” location (FAFo = fruit agroforest, RAFo = old rubber agroforest, RAFy = young rubber agroforest, RMOy = rubber monoculture; L = litter).
Soilsystems 06 00019 g004
Figure 5. Relationship between litter thickness and litter layer necromass across three replicates in four habitats; FAFo = fruit agroforest, RAFo = old rubber agroforest, RAFy = young rubber agroforest, RMOy = rubber monoculture.
Soilsystems 06 00019 g005
Figure 6. Air temperature ((A) maximum around 2 p.m.; (B) minimum around 7 a.m.) and relative humidity ((C) minimum around 2 p.m.; (D) maximum around 7 a.m.) as monitored during the litterbag studies in four habitats (FAFo = fruit agroforest, RAFo = old rubber agroforest, RAFy = young rubber agroforest, RMOy = rubber monoculture; L = litter).
Soilsystems 06 00019 g006
Figure 7. Primary results of litterbag time series, with decreasing amounts of remaining dry weight in the various litterbags; explanations of subfigures: FAFo = fruit agroforest, RAFo = old rubber agroforest, RAFy = young rubber agroforest, RMOy = rubber monoculture.
Soilsystems 06 00019 g007
Figure 8. Mean residence time estimates for the combination of litter sources and decomposition environments, with the home conditions indicated: (A) schematic (compare Figure 4); (B) histogram. FAFo = fruit agroforest, RAFo = old rubber agroforest, RAFy = young rubber agroforest, RMOy = rubber monoculture.
Soilsystems 06 00019 g008
Figure 9. Regression of resulting decomposition factor kd (week−1) on litter quality (A) and environmental conditions ((B) Soil temperature, (C) groundwater table, (D) Air humidity) across 16 combinations of habitats and litter types.
Soilsystems 06 00019 g009
Table 1. Soil properties and environmental conditions for the litterbags (the first six columns were reported in [33], the last three columns refer to the measurement period); s.e.d. = standard error of differences; values not followed by a shared letter within a column are statistically distinguishable at P = 0.05%.
Bulk Density, g cm−3Clay, %Silt, %CorgpH i (H2O)Earth-Worms, # m−2Soil Temp, °CRel. Humidity, Air, %Mean Water Table, cm
Fruit agroforest
(FAFo)
0.94 b76.7 a23.1 a2.04 a3.63 a75.1 bc24.7 a97.4 c−28.5 a
Old rubber agroforest (RAFo)0.97 b68.6 a32.2 ab2.76 a3.64 a93.4 c25.0 a97.8 c−45.4 b
Young rubber agroforest (RAFy)0.85 a60.9 ab39.0 b6.11 b3.71 b63.1 b25.9 b90.5 a−56.1 b
Rubber monoculture (RMOy)0.83 a50.2 b49.6 c5.43 b3.66 a27.5 a26.0 b94.8 b−69.6 c
s.e.d.0.045.074.91.060.0319.70.462.3712.3
i The low pH (H2O) reported for laboratory samples may indicate the presence of pyrite and acid-sulfate soil properties, but we do not have direct pH measurements in the field to test this.
Table 2. Vegetation characteristics of the four habitats used for the experiments; values not followed by a shared letter within a column are statistically distinguishable at P = 0.05%.
HabitatPoles #Medium TreesLarge TreesBasal AreaAboveground Tree BiomassLitter LayerLitter Layer
Individuals ha−1m2 ha−1Mg ha−1cmMg ha−1
FAFo320 a142 a87 b26.8 ab299 b2.50 b10.32 b
RAFo347 a127 a102 b34.4 b281 b1.39 a6.45 a
RAFy527 b132 a28 a20.2 a144 a1.74 ab6.95 a
RMOy320 a217 b40 a20.8 a148 a2.35 b8.25 ab
s.e.d.7627.7519.083.7142.70.381.22
# poles (10 cm < DBH < 20 cm), medium trees (20 cm < DBH < 30 cm), and large trees (DBH > 30 cm), where DBH is stem diameter 1.3 m above the ground; s.e.d., standard error of differences in an ANOVA using three replicates per habitat; values not sharing letters within their column differ significantly in a Duncan multiple range test (p < 0.05); FAFo = fruit agroforest, RAFo = old rubber agroforest, RAFy = young rubber agroforest, RMOy = rubber monoculture; first five columns were reported in [33].
Table 3. Quality characteristics of the litter sources (SEM = standard error of mean).
Polyphenol, Pp %Lignin, L %Ash, %Cellulose, %N, %(L + Pp)N
Fruit Agroforest (old)5.9331.341.8030.071.1233.36
SEM1.870.280.451.310.042.50
Rubber agroforest (old)3.8331.211.4227.891.1331.76
SEM1.190.660.260.660.174.50
Rubber agroforest (young)10.6929.441.3429.561.2133.32
SEM0.360.870.371.120.092.29
Rubber monoculture (young)4.1029.751.4727.811.5322.13
SEM0.250.690.292.280.010.61
Table 4. Decomposition constants (week−1), mean residence time, and half-life times (T0.5, weeks) for loss of dry weight for various litter sources, tested in various habitats; “home” conditions (where litter type and habitat match) are presented in bold font.
HabitatLitter Sourcekd, Week−1Se of kd EstimateR2, %MRT, WeekT0.5, Week
FAFoL-FAFo0.0183470.0032184.554.537.8
L-RAFo0.0136750.00173891.273.150.7
L-RAFy0.0174970.00161595.157.239.6
L-RMOy0.0164520.00148595.360.842.1
RAFoL-FAFo0.0114970.00351464.187.060.3
L-RAFo0.0161190.00146195.362.043.0
L-RAFy0.0157440.00246087.263.544.0
L-RMOy0.0360970.00199898.227.719.2
RAFyL-FAFo0.0054810.00222350.3182.5126.5
L-RAFo0.0160390.00216590.162.343.2
L-RAFy0.0123480.00261278.881.056.1
L-RMOy0.0214100.00101998.746.732.4
RMOyL-FAFo0.0084070.00199774.7119.082.5
L-RAFo0.0143670.00265183.069.648.2
L-RAFy0.0151630.00342776.566.045.7
L-RMOy0.0255480.00417786.239.127.1
Minimum0.0054810.00101950.327.719.2
Average 0.0165120.00235984.372.049.9
Maximum0.0360970.00417798.7182.5126.5
FAFo = fruit agroforest, RAFo = old rubber agroforest, RAFy = young rubber agroforest, RMOy = rubber monoculture; L = litter.
Table 5. Home-field advantage (%) in pairwise combination of habitats, without and with adjustment of decomposition rates to 20 °C, based on kd and based on mean residence time; FAFo = fruit agroforest, RAFo = old rubber agroforest, RAFy = young rubber agroforest, RMOy = rubber monoculture.
Based on Decomposition Constant kdBased on Mean Residence Time
FAFoRAFoRAFyFAFoRAFoRAFy
RAFo 37.1, 36.8 −27.1, −26.9
RAFy 51.4, 43.2 −11.2, −11.1 −33.9, −30.1 12.6, 12.5
RMOy 77.6, 82.2 −9.7, −10.6 −1.3, −9.7 −43.7, −45.1 10.8, 11.9 1.3, 10.8
Publisher’s Note: MDPI stays neutral with regard to jurisdictional claims in published maps and institutional affiliations.

