Article

Desorption Kinetics of Legacy Soil Phosphorus: Implications for Non-Point Transport and Plant Uptake

1
National Soil Erosion Research Laboratory, USDA Agricultural Research Service, 275 S. Russell St., West Lafayette, IN 47907, USA
2
Department of Agronomy, Purdue University, West Lafayette, IN 47907, USA
*
Author to whom correspondence should be addressed.
Soil Syst. 2022, 6(1), 6; https://doi.org/10.3390/soilsystems6010006
Submission received: 23 November 2021 / Revised: 21 December 2021 / Accepted: 1 January 2022 / Published: 8 January 2022

Abstract

:
Soil phosphorus (P) solubility and kinetics partly control dissolved P losses to surface water and uptake by plants. While previous studies have focused on batch techniques for measuring soil P desorption kinetics, flow-through techniques are more realistic because they simulate P removal from the system, akin to runoff, leaching, and plant uptake. The objectives were to measure soil P desorption by a flow-through technique at two flow rates and several batch methods, and utilize both for understanding how flow rate impacts the thermodynamics and kinetics of soil P desorption. Desorption obeyed first-order kinetics in two different phases: an initial rapid desorption phase followed by a gradual release. Desorption was limited by equilibrium and the kinetics of physical processes as demonstrated by an interruption test. Dilution-promoted desorption occurred with increasing cumulative volume, which increased desorption rate via first-order kinetics. The batch tests that simulated cumulative solution volume and time of flow-through were similar to the flow-through results; however, the batch methods overestimated the desorption rates due to less limitations to diffusion. Fast flow rates desorbed less P, but at a greater speed than slow flow rates. The differences were due to contact time, cumulative time, and solution volume, which ultimately controlled the potential for chemical reactions to be realized through physical processes. The interaction between these processes will control the quantity and rate of desorption that buffer P in non-point drainage losses and plant uptake.

1. Introduction

1.1. Background

The dynamic between soil bound phosphorus (P) and soil solution P is critical for understanding both dissolved P transport and P availability to plants. Desorption of P that has accumulated in soils and sediments (i.e., legacy P) can serve as a substantial source of dissolved P to surface waters [1], contributing to eutrophication, harmful algal blooms, and their associated negative impacts [2]. The soil solution also serves as the medium for nutrient uptake; P must first be relinquished from the soil to solution before it can be taken up by a plant. The ability of a soil to desorb a sufficient amount of P to solution in a timely manner is therefore necessary for achieving maximum crop yield. While many studies have investigated soil P sorption kinetics [3,4,5], few have examined soil P desorption kinetics despite the implications for non-point transport and agronomic productivity.
In soil fertility and nutrient transport studies, P dynamics are typically evaluated using laboratory extractions. Agronomic soil tests (e.g., Mehlich-3, Bray-1) developed to determine fertilizer recommendations have been adopted to predict edge-of-field P losses [6,7,8,9,10,11]. More sophisticated P-sink extraction techniques (e.g., anion exchange resin, Fe-oxide sinks) have also been used to estimate bioavailable P [12,13,14,15,16,17,18]. To assess P desorption dynamics between soil and solution, simple water extractions are typically used [6,11,19], with the solution:soil ratios (1:1 to 1000:1; [20,21,22]) and time of reaction (minutes to days; [23,24,25]) varying widely. The most common water extraction uses a solution:soil ratio of 10:1, a reaction time of 1 to 24 h, and is often referred to as water-extractable P [6,7,26]. While soil water extractions have been correlated to P concentrations in runoff and tile drainage [27,28], they provide little information on long-term P release to flowing solutions or plants. Soil water extractions provide only a snapshot of P “intensity” without any information on P “quantity” or the dynamic between them [29,30,31]. They are therefore unable to provide information on soil P buffering, which is a critical process for P transport and plant uptake. The rate or kinetics of P desorption from soil to solution is also rarely considered among traditional soil water extraction techniques.
The kinetics of soil P desorption is often conducted in batch soil water extractions [23]. Multiple sample containers and sacrificial samples that are tested for solution P concentrations at different reaction times have also been utilized for measuring desorption kinetics [20,23,32], as well as several other techniques [33,34,35]. While batch or stirred reactor techniques are most common for soil kinetics experiments, flow-through techniques (also known as miscible displacement techniques) can be used and present several advantages over batch experiments [36,37]. In contrast to batch techniques, the net kinetics of P desorption determined using flow-through techniques are constrained by physical limitations to mass transfer (i.e., kinetics of physical processes) not just chemical reactions, making them more realistic in the context of field soils where water and solute are both moving [36]. Flow-through experiments, however, are more difficult to conduct and therefore most P sorption-desorption experiments have been conducted via batch tests.
Both flow-through and batch desorption methods possess unique attributes that can offer useful but different insights into P desorption processes. Differences between these methods are likely to provide valuable information on the nature of P desorption as it applies to both non-point transport and plant uptake. Flow rate typically influences desorption in flow-through systems [38], although the mechanisms are difficult to pinpoint since flow rate simultaneously changes the contact time of solution with soil and the cumulative volume of solution per unit time. Thus, use of complimentary batch tests may help to better understand how thermodynamics and kinetics dictate P desorption in flow-through systems. The objectives of this study were to (i) determine how solution flow rate impacts P desorption; (ii) compare flow-through and batch desorption techniques; (iii) utilize batch desorption results in combination with flow-through to better understand how flow rate impacts the thermodynamics and kinetics of soil P desorption; and (iv) incorporate the P desorption results into a discussion of soil P buffering for non-point P transport and plant uptake.

1.2. Soil P Desorption Theory

Soil P desorption is a dynamic equilibrium-based process, governed by thermodynamics and kinetics. Inorganic and organic P (not including organic P in biomass) is bound to soil in three broad categories including inner-sphere (i.e., ligand exchange), outer-sphere (i.e., anion exchange), and precipitation [39]. Each soil P pool is thermodynamically driven to achieve equilibrium with the soil solution through desorption and dissolution (hereafter referred to collectively as desorption) and are collectively considered “Soil P”. When solution P concentrations are measured through a soil water extraction, it is not known which P pool is supplying P to solution. A generic representation of soil P equilibrium with solution is:
Soil-P ⇌ Solution-P K = X
where K is the numeric equilibrium constant that quantifies equilibrium between the reactants (soil-P) and products (solution-P) and is constant at a given temperature and pressure. While K will vary as a function of the soil P form or pool, an overall value for an individual soil can be estimated through traditional adsorption isotherms [40]. Since this is an equilibrium-based process,
Solution   P Soil   P = K
Observation of Equation (2) provides information on the buffering of soil P; as soil P concentration increases, so does the ability of the soil to release P to solution. If the solution P concentration becomes too low such that it disrupts equilibrium (as quantified by K), the soil will desorb P. The degree of desorption is therefore dictated by the concentration of soil and solution P; large soil P pools and small solution P concentrations (i.e., dilution) promote desorption. Increasing solution:soil ratios during water extractions increased the mass of P desorbed, yet resulted in lower solution concentration [20,23]. Thus, as soil solution P is removed either through plant uptake or loss, the soil-P pool is thermodynamically driven to further desorb P.
The connection between thermodynamics and kinetics is found in that:
K = k 1 k 2 = Solution   P Soil   P
where the forward rate for reaction 1 is described by the rate constant k1, and the rate constant for the reverse is k2 [36]. This connection between P desorption kinetics and thermodynamics is well exemplified through an understanding of P desorption reaction order. Soil P desorption has been described as first-order whereby concentrations of a single constituent will impact desorption rate. For instance, increasing the concentration of the soil P pool or decreasing the concentration of solution P pool will increase desorption rate. Due to the complexity of soil P pools, however, P desorption has been described using two first-order reactions; an initial rapid desorption followed by a gradual release [41,42,43]. Note that most kinetics methods including those used in the current study are only able to measure net desorption kinetics, not the rate of the chemical reaction alone because the kinetics of physical transport processes involved in chemical reactions are not separated with these measurements [34,37,44]. In the current study, “kinetics” therefore refers to net desorption kinetics unless specified otherwise. Additionally, while a certain outcome with regard to soil P desorption may be expected to occur through a disruption of equilibrium, such an outcome may deviate because desorption requires time as expressed in the link between thermodynamics and kinetics.

2. Materials and Methods

2.1. Soil Collection and Characterization

Soil was collected in 2020 from an agricultural field (3.7 ha) in Mercer County, Ohio. The soil was classified as a Blount silt loam (fine, illitic, mesic Aeric Epiaqualfs) and is somewhat poorly drained; thus, the field contains tile drainage to increase field trafficability and decrease crop water stress. The field was cropped in a corn (Zea mays L.) and soybean (Glycine max [L.] Merr.) rotation, with cover crops established during the non-growing season. Tillage occurred once per rotation after soybean. Historically, the field received poultry manure applications in which P was added beyond plant needs and resulted in elevated soil test P levels; however, P has not been applied to the field since 2005. Discharge and water quality from the site have been monitored in surface runoff and tile drainage since 2011 as part of the USDA Agricultural Research Service edge-of-field network [45], with data showing the field is a large source of non-point P losses [46].
Surface soil (0–15 cm depth) was collected as a composite sample from throughout the field, air-dried, and sieved (<2 mm). Soil pH was measured with a glass pH electrode (1:1 soil:deionized water, 30 min equilibration time) and electrical conductivity (EC) was measured on the same solution with an EC probe. Bulk density was determined by measuring soil mass in a container of known volume. Sand, silt, and clay content were measured with a laser diffraction particle size analyzer (Malvern Mastersizer 3000, Malvern, UK) 24 h after 3 g of soil were combined with 100 mL deionized (DI) water and 100 mL of 5% sodium hexametaphosphate and shaken for 30 min. Total carbon and nitrogen (TC and TN) were measured with a LECO Truspec dry combustion analyzer (LECO, St. Joseph, MI, USA; [47]). Soils were extracted with Mehlich-3 solution [48] for 5 min at a 1:10 soil:solution ratio and filtered with Whatman #42 paper (GE Healthcare, Chicago, IL, USA). Water extracts were conducted at a 1:10 soil:DI water ratio with 1 h reaction time, followed by centrifugation (1700 RCF, 10 min) and filtration with 0.45 µM Millipore membrane (Merck KGaA, Darmnstadt, Germany). Ammonium oxalate extractions were performed at a 1:20 soil:solution ratio for 2 h in the dark [49]. Mehlich-3 extracts were analyzed for P, Ca, Fe, and Al by inductively coupled plasma atomic emission spectroscopy (ICP-AES). Ammonium oxalate extracts were analyzed for P, Al, and Fe by ICP-AES. Degree of P saturation was calculated on a molar basis as P/(Fe + Al) x 100 for M3 (DPSM3) and ammonium oxalate extracts (DPSox) [6]. Water extracts were analyzed for P by the molybdate blue method [50]. All analyses were duplicated and values averaged.

2.2. Batch and Flow-Through Experiments to Determine P Desorption Kinetics

A series of batch tests at different times and solution:soil ratios were conducted in addition to flow-through experiments conducted at two different flow rates. Batch tests are described below in detail and for each batch test all samples were sacrificial (i.e., a sample tube was sacrificed at each measurement time). All samples for batch tests and flow-through experiments were duplicated and results averaged. Solutions were analyzed for P by the molybdate blue method [50]. Desorbed P was expressed both as mg L−1 in solution and mg kg−1 calculated based on solution volume and soil mass. In the subsequent sections, the differences between batch test and flow-through experiments related to time, volume, and desorbed solution P concentration are presented (Section 2.2.1), and specific methods for each of the experiments are shown (Section 2.2.2, Section 2.2.3, Section 2.2.4, Section 2.2.5 and Section 2.2.6).

2.2.1. Differences between Batch Tests and Flow-Through: Time, Volume, Concentration

Time: Different flow rates were tested in flow-through experiments by varying the rate of a pump that pulled the solution through the soil (Figure 1). Contact time in flow-through experiments is the time required for one pore volume to pass through the soil, is proportional to flow rate, and is calculated as the total soil pore volume divided by flow rate. In addition to discrete contact time, flow-through experiments also allow for quantification of desorption over the entire experiment (i.e., flow initiation to time t; cumulative time). For flow-through experiments, contact time and cumulative time are therefore very different. However, contact time is equal to cumulative time for batch methods.
Volume: Flow-through experiments allow for evaluation of both discrete water volume (i.e., only a finite volume of flowing solution can interact with the soil mass; one pore volume over the duration of the contact time) and cumulative water volume (i.e., volume of water that moves through a flow cell from flow initiation to time t). In contrast, the water volume used in batch methods is equal to the cumulative volume. Discrete and cumulative volume in a flow-through system is difficult to separate from time because flow rate controls the volume yet includes a time component. For flow-through experiments, the local soil-water interaction is described by a small solution:soil ratio, which is less dilute than typical batch tests. Cumulative volume, however, cannot be discounted because this is what continues to dilute the solution and remove P from the system, which disrupts equilibrium (Equation (1) and promotes further desorption. In this regard, flow-through experiments are profoundly different from batch methods because batch methods impose a thermodynamic limitation (i.e., P can only continue to desorb at a high rate if the P is removed from solution or diluted). Thus, at small solution:soil ratios, batch system desorption may be limited thermodynamically due to accumulation of reaction products, as desorption rate will increase with larger differences between solution and soil concentrations [51,52,53]. Alternatively, a much larger volume of water can interact with the soil in a short amount of time in batch methods due to the shaking/stirring process, whereas a flow-through is limited to a pore-volume for interaction. Large solution:soil ratios create a highly diluted system that promotes desorption based on Equation (1), but it is not likely that the entire solution volume is able to interact with the soil mass in the given time for batch tests with excessively large solution:soil ratios and short contact times (e.g., solution:soil ratio of 100:1 with a shake/stir time of 30 s).
Desorbed solution P concentration: The desorbed solution P concentrations for flow-through experiments are considered discrete concentrations over the period of collection. For example, if all outflow is collected and separated every 5 min (i.e., a cumulative 5 min sample), the sample is considered as a single 5 min discrete sample among many over the entire experiment. This allows for quantification of concentration changes not only with time, but also cumulative volume. In batch methods, however, the solution concentrations are cumulative by nature since the entire volume interacts with the soil at once, as opposed to flow-through where the cumulative volume of water is changing with time. Discrete concentration for batch methods is therefore synonymous with “cumulative concentration”, while for flow-through experiments, cumulative concentration is the flow-weighted concentration (i.e., normalization of concentration for volume in a flowing system; mass of all P desorbed per cumulative flow volume over the time period). Calculation of flow-weighted concentrations are critical for studying edge-of-field P transport [54,55,56]. Thus, to compare solution P concentrations between batch and flow-through techniques, discrete concentrations from flow-through experiments must first be converted to flow-weighted concentrations.

2.2.2. Traditional Batch Test Using Constant Volume and Variable Time

Five g of soil was reacted with 5 mL of DI water in centrifuge tubes on a reciprocating shaker at 20 times ranging from 14 min to 16 d. Soils were analyzed for P after centrifugation (20 min, 2000 rpm) and filtration using 0.45 µM Millipore membrane (Merck KGaA, Darmnstadt, Germany).

2.2.3. Standard Reaction Order

Five g of soil was reacted with 5, 25, 50, 200, and 500 mL of DI water for 5, 30, 60, 360, and 1440 min. The 5, 25, and 50 mL volumes were centrifuged prior to filtration, while aliquots of the 200 and 500 mL samples were centrifuged and filtered. A plot of time versus the natural log of P concentration with application of a linear equation was used to determine if the kinetics were first-order [37].

2.2.4. Flow-Through Experiment

A flow-through desorption technique was adapted based on the flow-through P sorption method described by Scott et al. [57] and Penn and Bowen [58]. Briefly, 5 g of soil was placed in a flow cell (Figure 1) underlain by a 0.45 µM Millipore membrane (47 mm diameter) and a Mariotte bottle was used to maintain a constant head of DI water at the surface of the soil. Soil thickness was 3 mm based on surface area of 17.3 cm2. The bottom of the cell was connected to a single channel peristaltic pump (VWR variable rate “low flow” and “ultra-low flow”, 61161-354 and 54856-070) using plastic tubing, and the desired flow rate through the cell was achieved by varying the rate of the pump. Two different flow rates were tested: a “fast” and “slow” flow rate of 25 and 0.5 cm h−1, respectively, which corresponded to target flow rates of 7.2 and 0.14 mL min−1. The fast flow rate represents rapid flows measured through similar surface soils in preferential flow pathways using stable water isotope breakthrough curves ([59]; Williams et al., unpublished data), while the slow flow rate was representative of saturated hydraulic conductivity for silt loam soils [60]. As the pump pulled the water through the flow cell, an automated fraction collector at the tube outlet was programmed to collect all water and separate samples into different bottles every 15 and 180 min for the fast and slow rates, respectively. Volume of each sample was determined by mass, which was used to calculate the actual flow rate. Each flow cell was duplicated. The slow flow rate cell was operated continuously for about 17 d. The fast flow rate was split into four different runs with a 48 h interruption period of no-flow between each run; each run was conducted for 5 h. The interruption tests were conducted for the purpose of determining if desorption kinetics were limited by physical diffusion.
The cumulative amount of P desorbed (Q) in mg P kg−1 soil at any given time interval (t) was calculated knowing the outflow concentration (C; mg L−1) and volume (V; L) measured at each time interval corresponding to each j-th outflow solution bottle and the soil mass (m; g):
Qt i = 1 i ( CV ) j m
Flow-weighted concentrations (mg L−1) were calculated as the sum of concentration times sample volume divided by the sum of sample volume.

2.2.5. Batch Simulated Flow-Through (Variable Time and Volume)

The batch simulated flow-through test was designed to simulate the changing cumulative volume and time similar to the flow-through method. Using eleven different volumes (100–6000 and 100–3300 mL for fast and slow flow rates, respectively) and the same soil mass (5 g) as the flow-through experiments, the corresponding times (fast flow rate: 0.23 to 14 h, slow flow rate: 12 to 392 h) with each volume simulating both slow and fast rates were utilized. At the end of each shaking time, samples were allowed to settle for five minutes before taking an aliquot, followed by filtration and P analysis.

2.2.6. Batch Hybrid (Constant Time, Variable Volume)

The batch hybrid test differed from the batch simulated flow-through with regard to time. Specifically, this method simulated the discrete contact time, which was constant, over several different volumes (100–6000 mL) that corresponded to the flow-through experiments. Contact time for the slow and fast rate was 0.5 and 23 min, respectively. Samples were treated and analyzed in the same manner as the batch simulated flow-through described in Section 2.2.5.

2.3. Data Analysis

Phosphorus desorption data from all batch experiments were averaged and standard deviation presented. However, flow-through data is largely presented by replication rather than averaged over replications since flow rates between duplicated cells were never exactly the same and the cumulative volume added for any given sample was, therefore, slightly different between replications and times. The PROC LINLIN (i.e., linear-linear) procedure using statistical analysis software (SAS) [61] was conducted to estimate the “breakpoint” time value in which there was a significant decrease in the slope of the relationship between time and P desorbed for the reaction order experiment and the flow-through. This allowed determination of the point where desorption rate decreased (p < 0.01).

3. Results and Discussion

3.1. Soil Characterization

The soil used in this study had a silt loam texture, with other soil properties shown in Table 1. The soil test P (i.e., M3-P) was 353 mg kg−1, which greatly exceeded the “optimum” P level of 40 mg kg−1 [62]. The elevated P reflected the history of previous long-term poultry manure applications, with P consistently added beyond plant needs and thereby resulting in a “legacy” P source [1]. Based on correlations between the M3-P and dissolved P concentrations in leachate and runoff [6,7,63], this field would be considered a potential source of non-point P pollution. Similarly, values of DPSox and DPSM3 indicate the field poses a high risk for non-point P loss [7].

3.2. Batch Desorption Tests

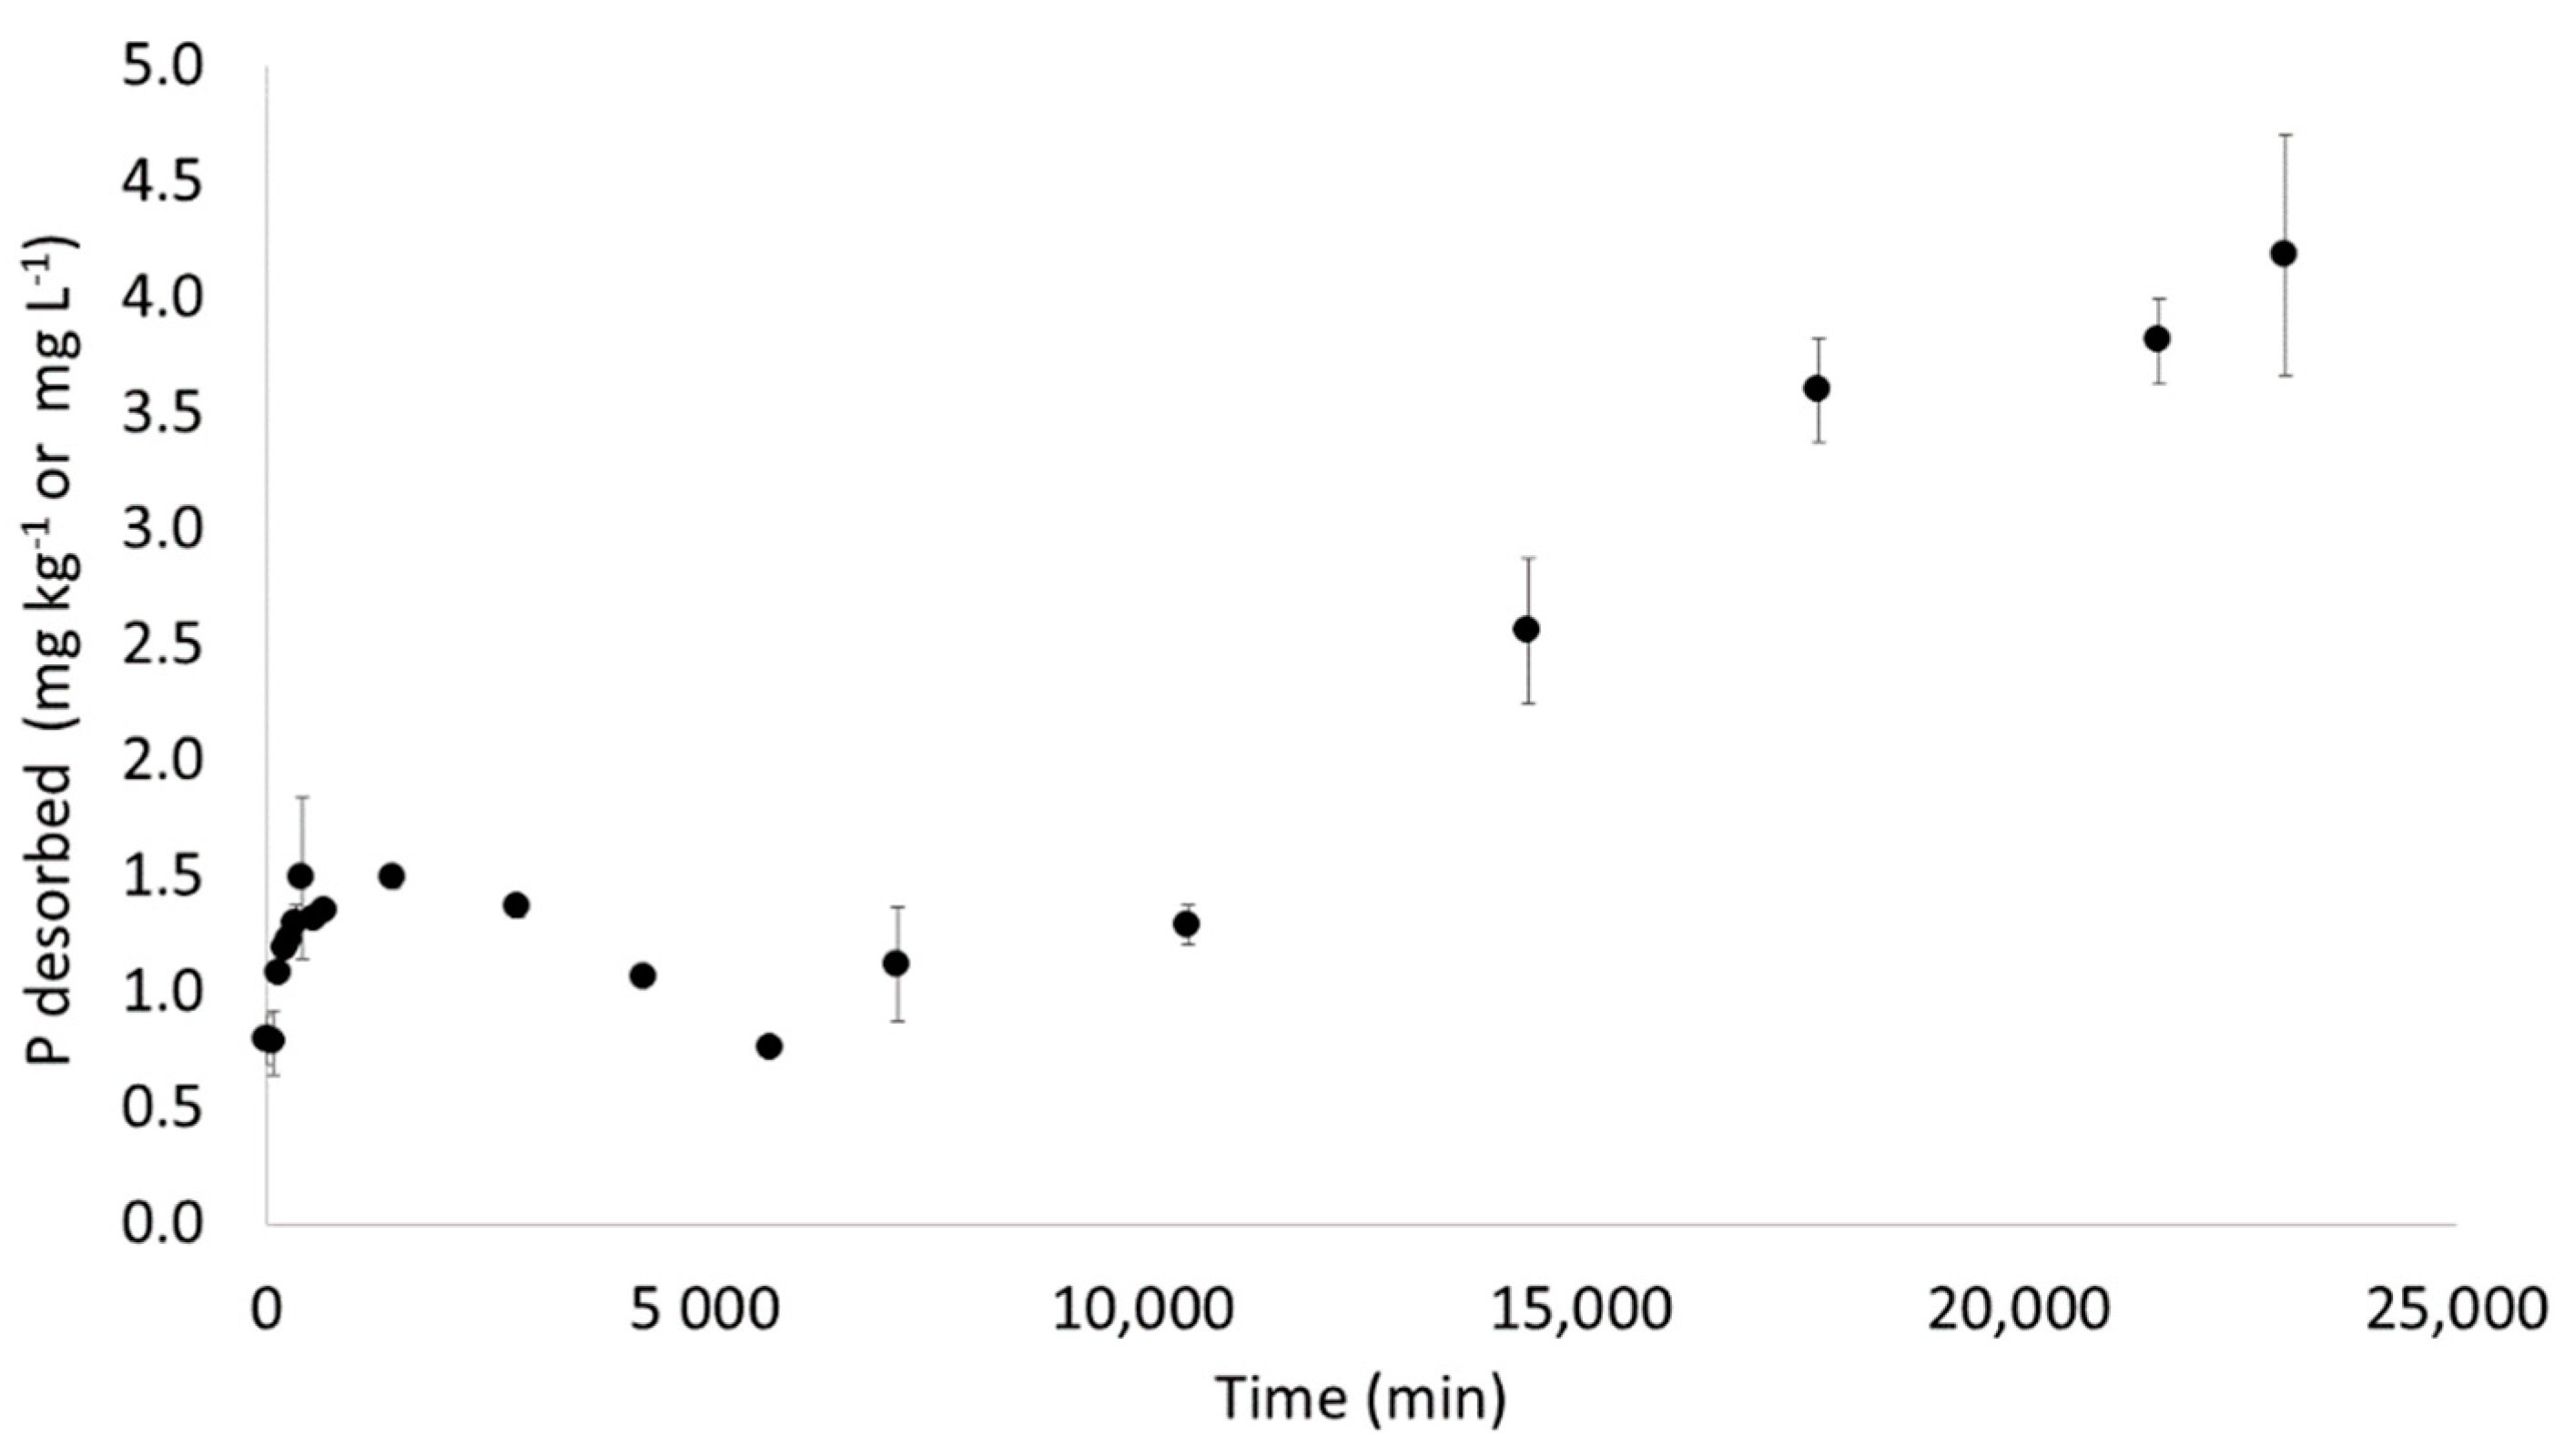
3.2.1. Traditional Batch Test

The traditional batch test conducted using a 1:1 solution:soil ratio showed increasing P desorption with longer reaction times (Figure 2). In accordance with two-stage first-order kinetics and previous studies [64,65], the P desorption rate was not constant (i.e., non-linear slope; Figure 2). The highest desorption rate occurred in the first 420 min, where the soil P and solution P concentrations were at their highest and lowest, respectively. The initial high P desorption rate from 0 to 420 min was reversed from 420 to 6000 min when P sorption occurred prior to the soil once again desorbing P at a more gradual rate.
Thereafter, increasing the reaction time resulted in more desorbed P, but the desorption rate was less than during the first 420 min. The series of desorption–sorption–desorption has been commonly observed in studies focused on mineral weathering/dissolution kinetics [64] and illustrates one of the weaknesses of traditional batch tests using small solution:soil ratios. Frossard et al. [41] attributed this phenomenon to high abrasion from shaking, which exposed mineral surfaces with little to no P and resulted in some sorption of previously desorbed P.

3.2.2. Batch Hybrid: Constant Time and Variable Volume

While cumulative volume was the same between contact times, contact time substantially impacted P desorption (Figure 3). The 23 min contact time resulted in greater desorption compared to the 0.5 min contact time for both solution P concentration (Figure 3a) and mass of P desorbed (Figure 3b). Despite a stable solution P concentration, P continued to be desorbed as a plateau in P desorption was not reached (Figure 3b). The near-constant solution P concentration was a result of increased desorption in response to dilution (i.e., increasing volume), as the soil was thermodynamically driven to move toward equilibrium with dilution of reaction products. Previous studies have also shown that increasing solution:soil ratio (i.e., greater volume) increased P desorption while decreasing solution P concentration [20,23,66].

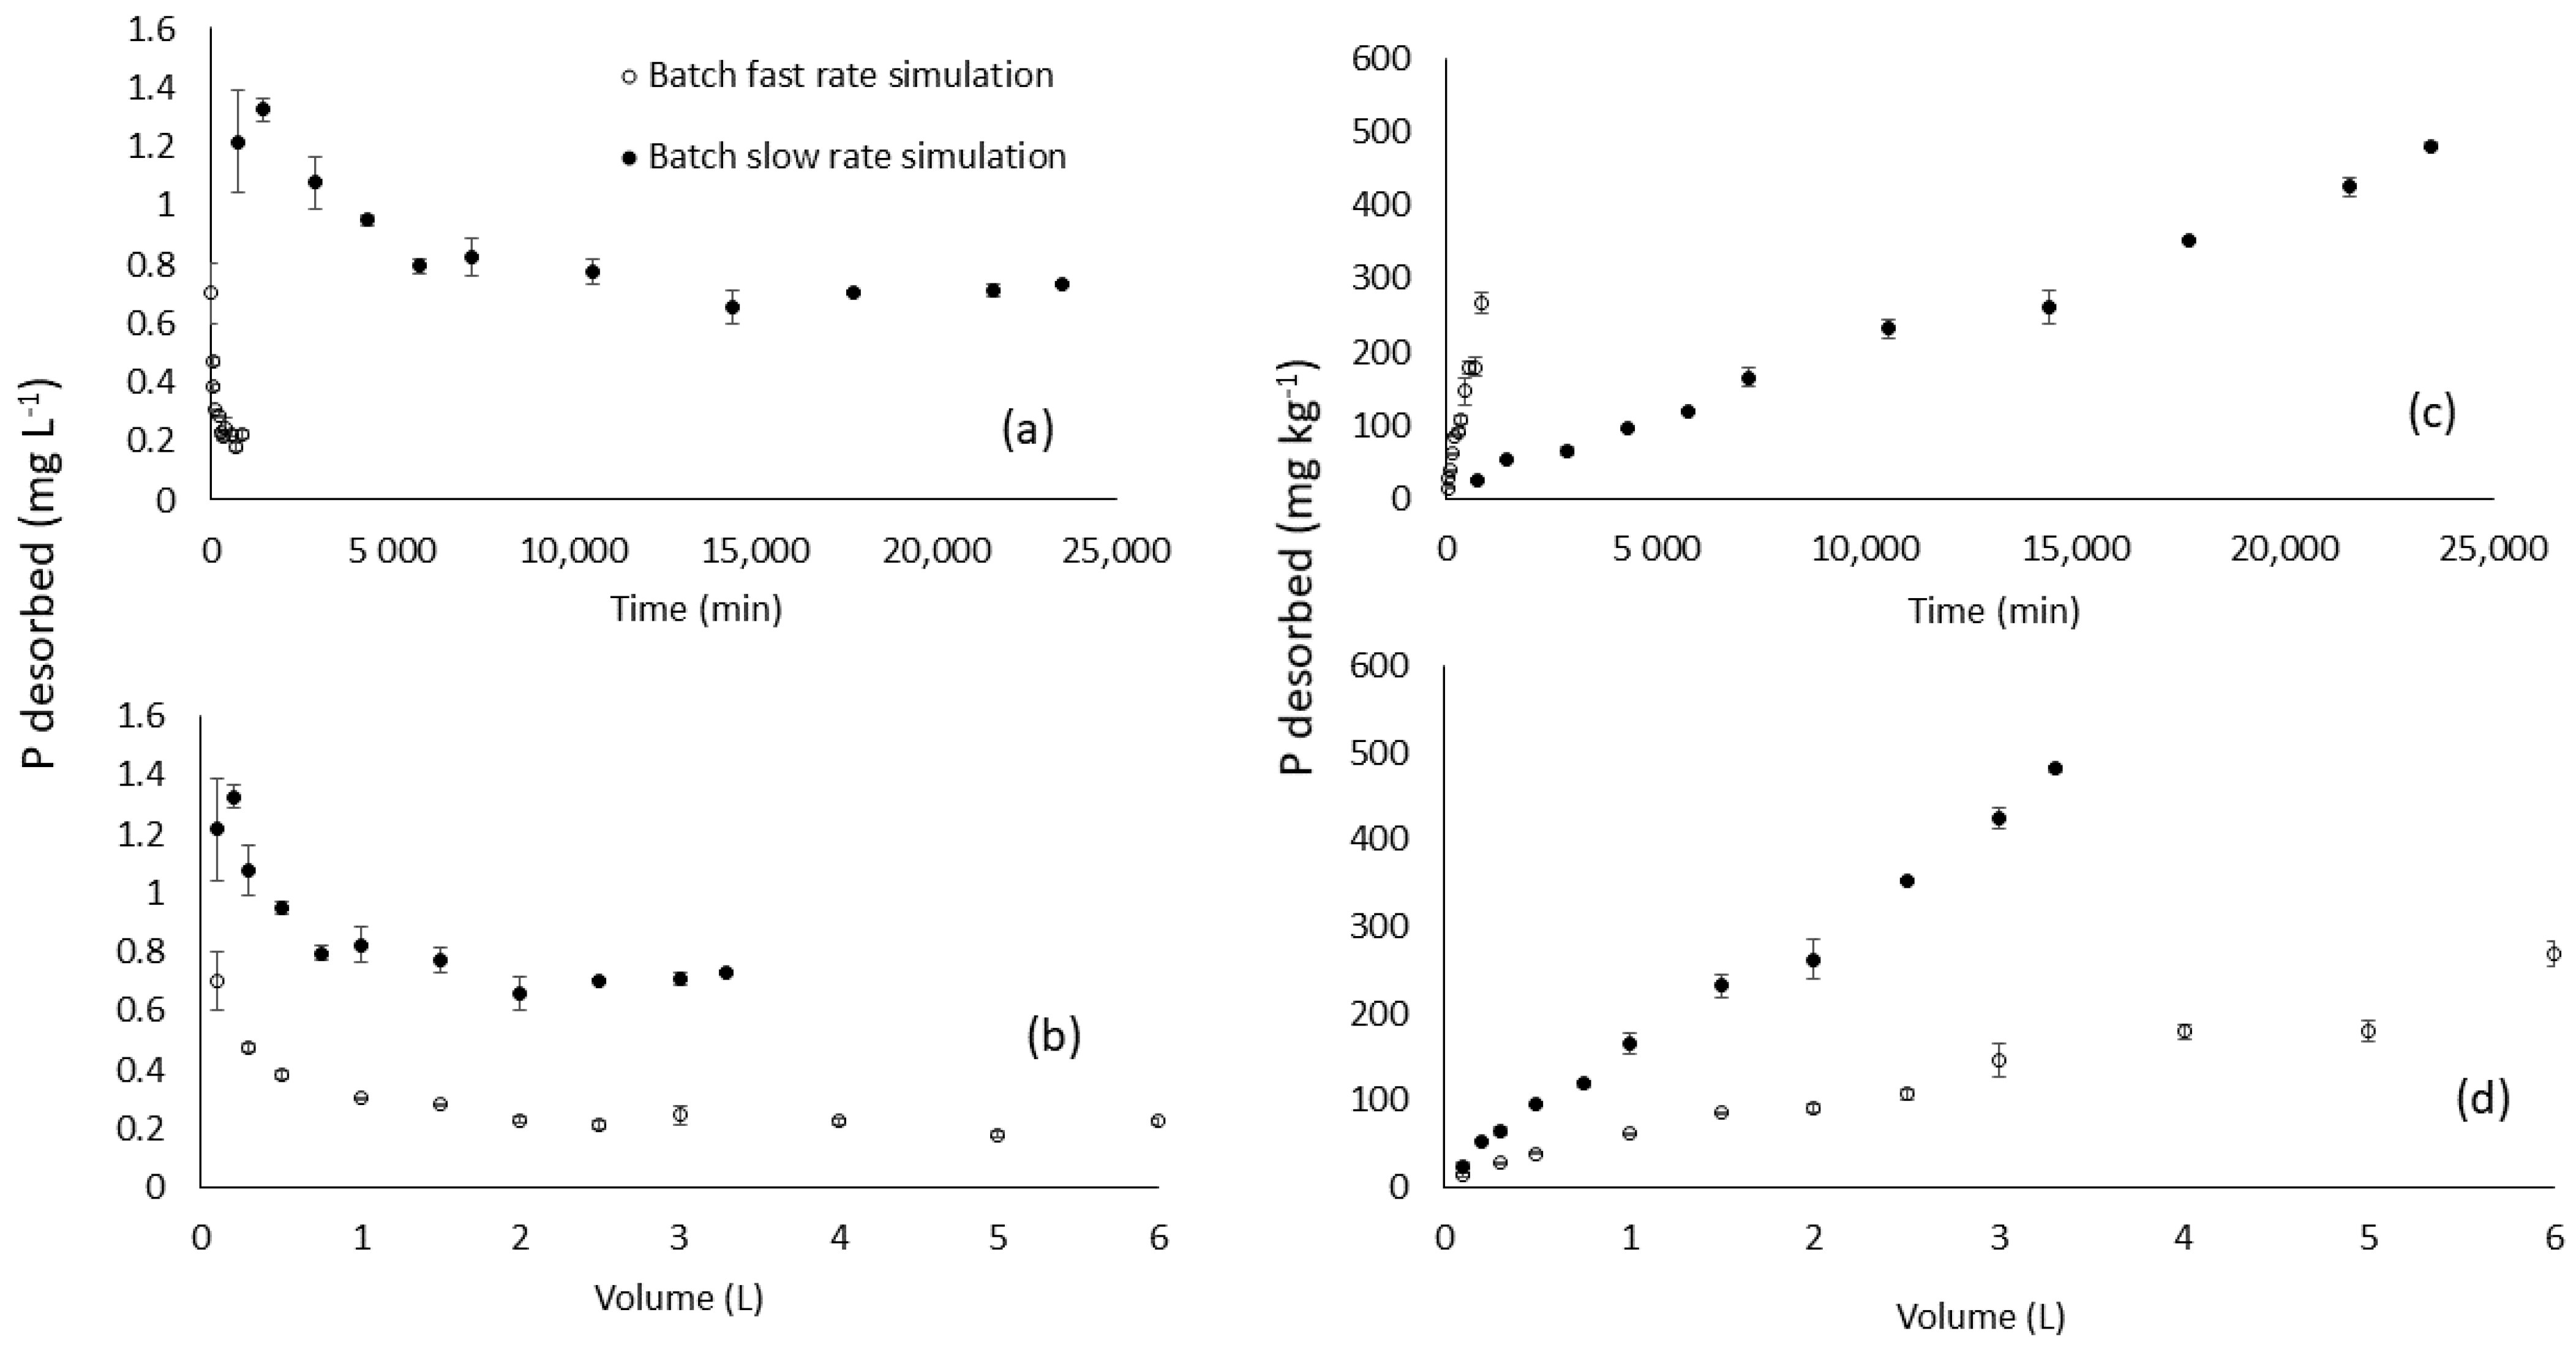
3.2.3. Batch Simulated Flow-Through Test: Variable Time and Variable Volume

The batch simulated slow flow rate had a substantially greater solution P concentration compared to the fast flow rate (Figure 4a), even at an equal volume (Figure 4b). This suggests that time had a large impact on desorption as well as dilution. The mass of P desorbed at a given time, however, was smaller for the slow flow rate simulation (i.e., long contact time per unit volume; Figure 4c) because it also received a smaller cumulative volume at a given time and, as a result, less dilution-promoted desorption.
Results showed that the increased time of reaction promoted P desorption (Figure 4c), but increasing the volume promoted dilution and therefore shifted equilibrium (Equation (1)) towards further desorption (Figure 4d). The impact of volume (dilution) on P desorption observed in Figure 4d is similar to results for the hybrid batch test (Figure 3). The linear relationship between time and the mass of P desorbed (Figure 4c) indicates a constant desorption rate in this batch system. It should also be noted that equilibrium was never achieved, as a plateau was not reached (Figure 4c).

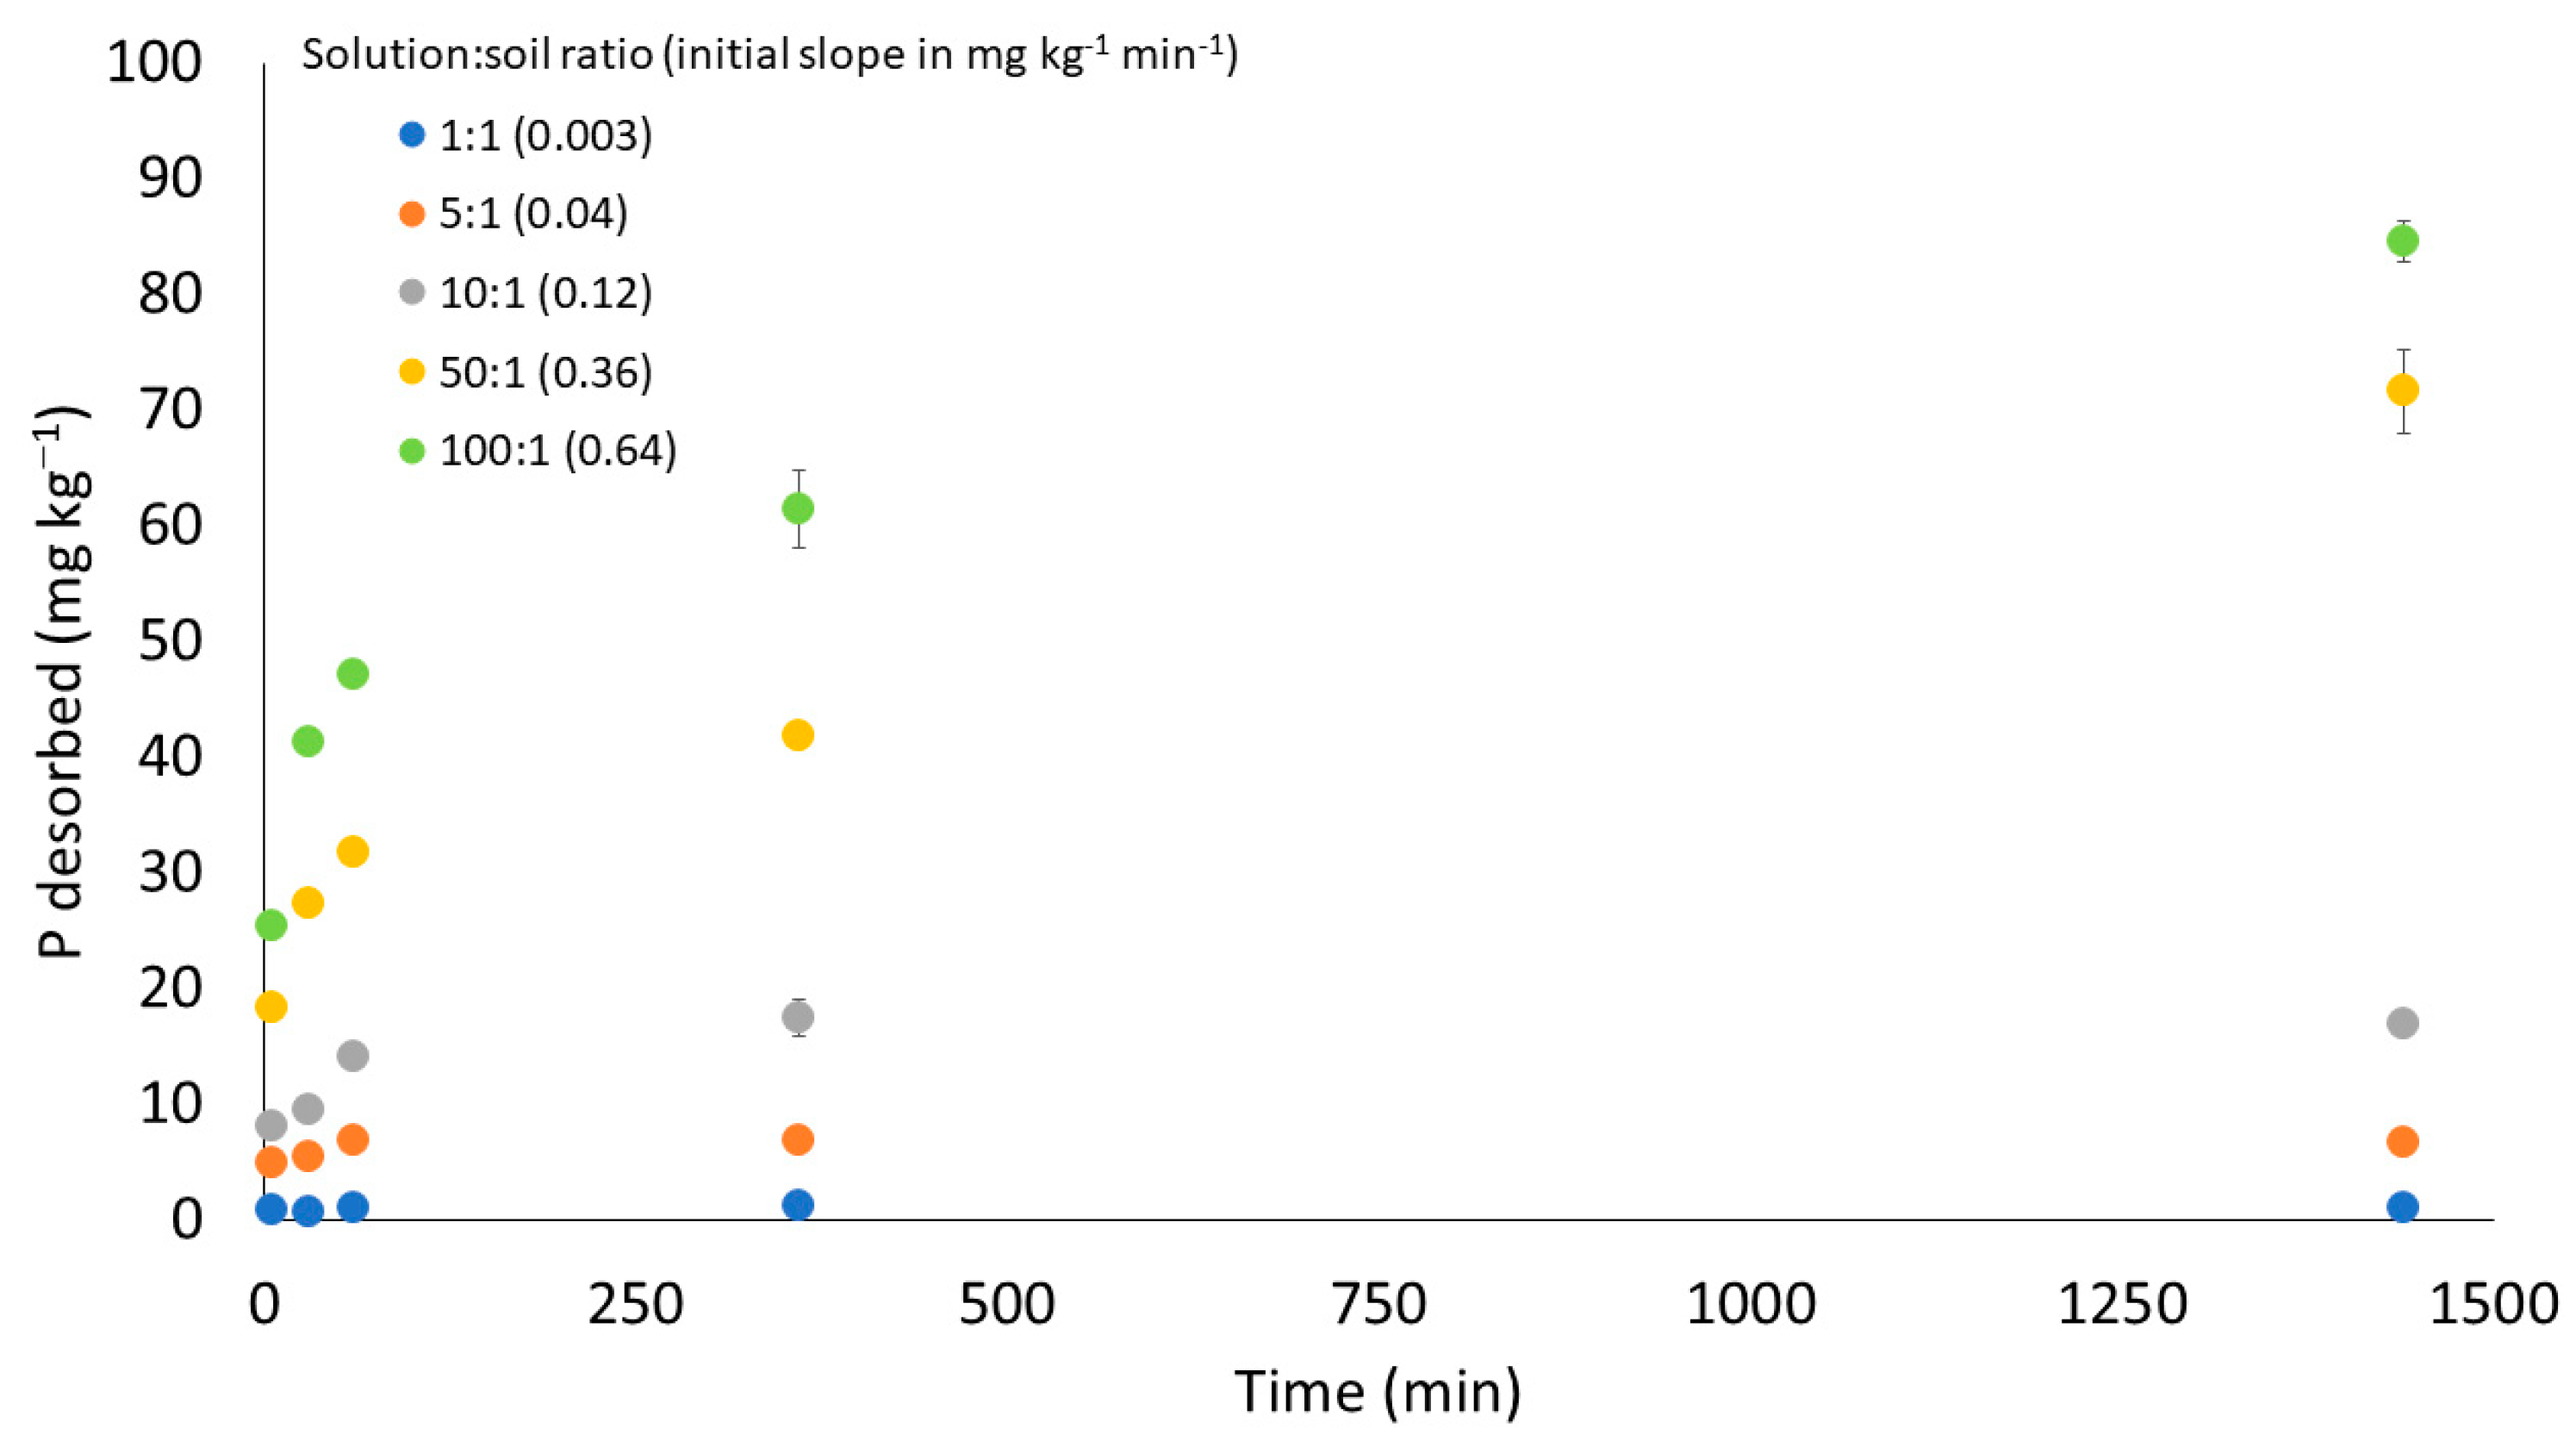
3.2.4. Reaction Order Experiment

The identification of first- vs. zero-order kinetics is critical to knowing how concentrations affect desorption rates. Previous studies have shown that P desorption is best described by two different first-order reactions; the first linear relationship describing an initial rapid desorption rate followed by a second linear relationship describing a gradual desorption rate [41,43]. Indeed, in the current study (Figure 5), two linear relationships were needed to describe the relationship between the natural log of P concentration and time, as a single linear relationship did not adequately fit the data (not shown). Desorption rate constants (k values) are not presented since they would only represent “apparent” rate constants, i.e., the measurements represented net desorption kinetics that included the kinetics of physical processes such as diffusion, not solely chemical kinetics [34].
Further, comparing desorption at different solution:soil ratios helped determine if changing the concentration of a reaction component (by dilution) changes the desorption rate (i.e., first-order). A significant change (p < 0.01) in the slope of the relationship between time and P desorbed was observed across the solution:soil ratios, indicating a change in net desorption rate (Figure 5). Due to the presence of two different kinetic “pools” of P, the desorption rate was initially higher until the “rapid pool” was largely exhausted. The desorption rate for this “rapid pool” increased with increasing solution:soil ratio (Figure 5), which is indicative of a first-order reaction with the desorption rate being proportional to the initial concentration (i.e., volume).
Smaller volumes (i.e., smaller solution:soil ratios) reached equilibrium (flat slope; net sorption and desorption rate equaling zero) in a shorter time period, but with less P desorbed (Figure 5). Small solution:soil ratios (less dilution) also desorbed P more slowly, as indicated by the slope, and illustrates the connection between dilution (thermodynamics) and kinetics. Due to a greater solution P concentration, there was less chemical potential (i.e., differences between solid and solution phase concentrations) and, as a result, desorption occurred at a slower rate. In addition, samples with less dilution required a smaller mass of P to desorb to reach equilibrium and therefore it took less time to plateau and reach equilibrium. In fact, samples with the greatest solution:soil ratio (50:1 and 100:1) did not reach a plateau.

3.3. Flow-Through Experiment

Similar to the batch simulated flow-through test (see Section 3.2.3), the fast flow rate (i.e., short contact time) during the flow-through experiment had lower concentrations in solution than the slow flow rate for a given cumulative volume (Figure 6a). Comparison on an equal volume basis excluded concentration differences due to dilution, which is not to be confused with the effect of dilution on thermodynamics or kinetics. The same conclusion can be drawn for the mass of P desorbed since it is expressed on a per volume basis (Figure 6b) and highlights the importance of contact time in a flowing system. Regardless of flow rate, desorbed P solution concentrations were initially high and were followed by a logarithmic decrease (Figure 6a,c). Using a similar approach (stirred flow reactor), Guedes et al. [42] showed similar trends of P release. Frossard et al. [41] and Beauchemin et al. [33] also found P concentrations from soil leaching columns to follow a logarithmic decrease with time or pore volume until a steady P concentration was reached.
The forty-eight hour interruption (i.e., no-flow) periods each resulted in a sharp increase in desorbed solution P concentrations at re-start compared to the previous measured values (Figure 6c). Such changes indicate that physical kinetics, particularly particle diffusion, were limiting net desorption rate [36,67]. Amacher [36] noted that mass transfer processes for non-mixed flow reactors, such as the flow-through apparatus used in the current study, are often limited, especially for fast chemical reactions. In other words, it takes time for P diffusion to occur. This ultimately limits the ability of the chemical reaction to proceed due to the accumulation of reaction products, which decreases chemical potential (Equations (1) and (2)). Previous comparisons of reaction kinetics between flow-through and batch methods have shown that apparent rate coefficients are larger in batch systems [38,68] and steady-state conditions obtained sooner [36]. These studies also reported that apparent rate coefficients obtained from flow-through methods may depend on the flow velocity through the disk, which provides further evidence of physical kinetics influencing chemical kinetics. The changes in solution P concentrations after interruption in the current study are partly what constitutes soil P buffering, and this process is itself limited by kinetics (physical and chemical).
For any given mass of P, P desorption occurred in a shorter time period for the fast flow rate compared to the slow flow rate (Figure 6d), indicating net faster kinetics. This observation is intimately related to cumulative flow volume and flow rate. At any given time, the fast flow rate received a larger volume of water, with batch tests showing that larger volumes of water increase P desorption rate by minimizing solution concentration (Figure 3 and Figure 4) in accordance with first-order kinetics (Figure 5). For example, the slow flow rate released more P on a volume basis because it had sufficient contact time (23 min) and cumulative time for the net reaction to occur (Figure 6b). The slow flow rate, however, released less P per unit cumulative time (slower desorption rate) indicated by the slope (Figure 6d). This occurred because less cumulative volume flowed through the soil at any given time relative to the fast flow rate allowing reaction products (i.e., dissolved P) to accumulate and inhibit reaction rate. In contrast, the fast flow rate had little contact time (0.5 min) and cumulative time for the reaction to occur, but a greater volume of water flowing through it, which continued upsetting equilibrium and allowing the desorption rate to remain high (first-order kinetics).

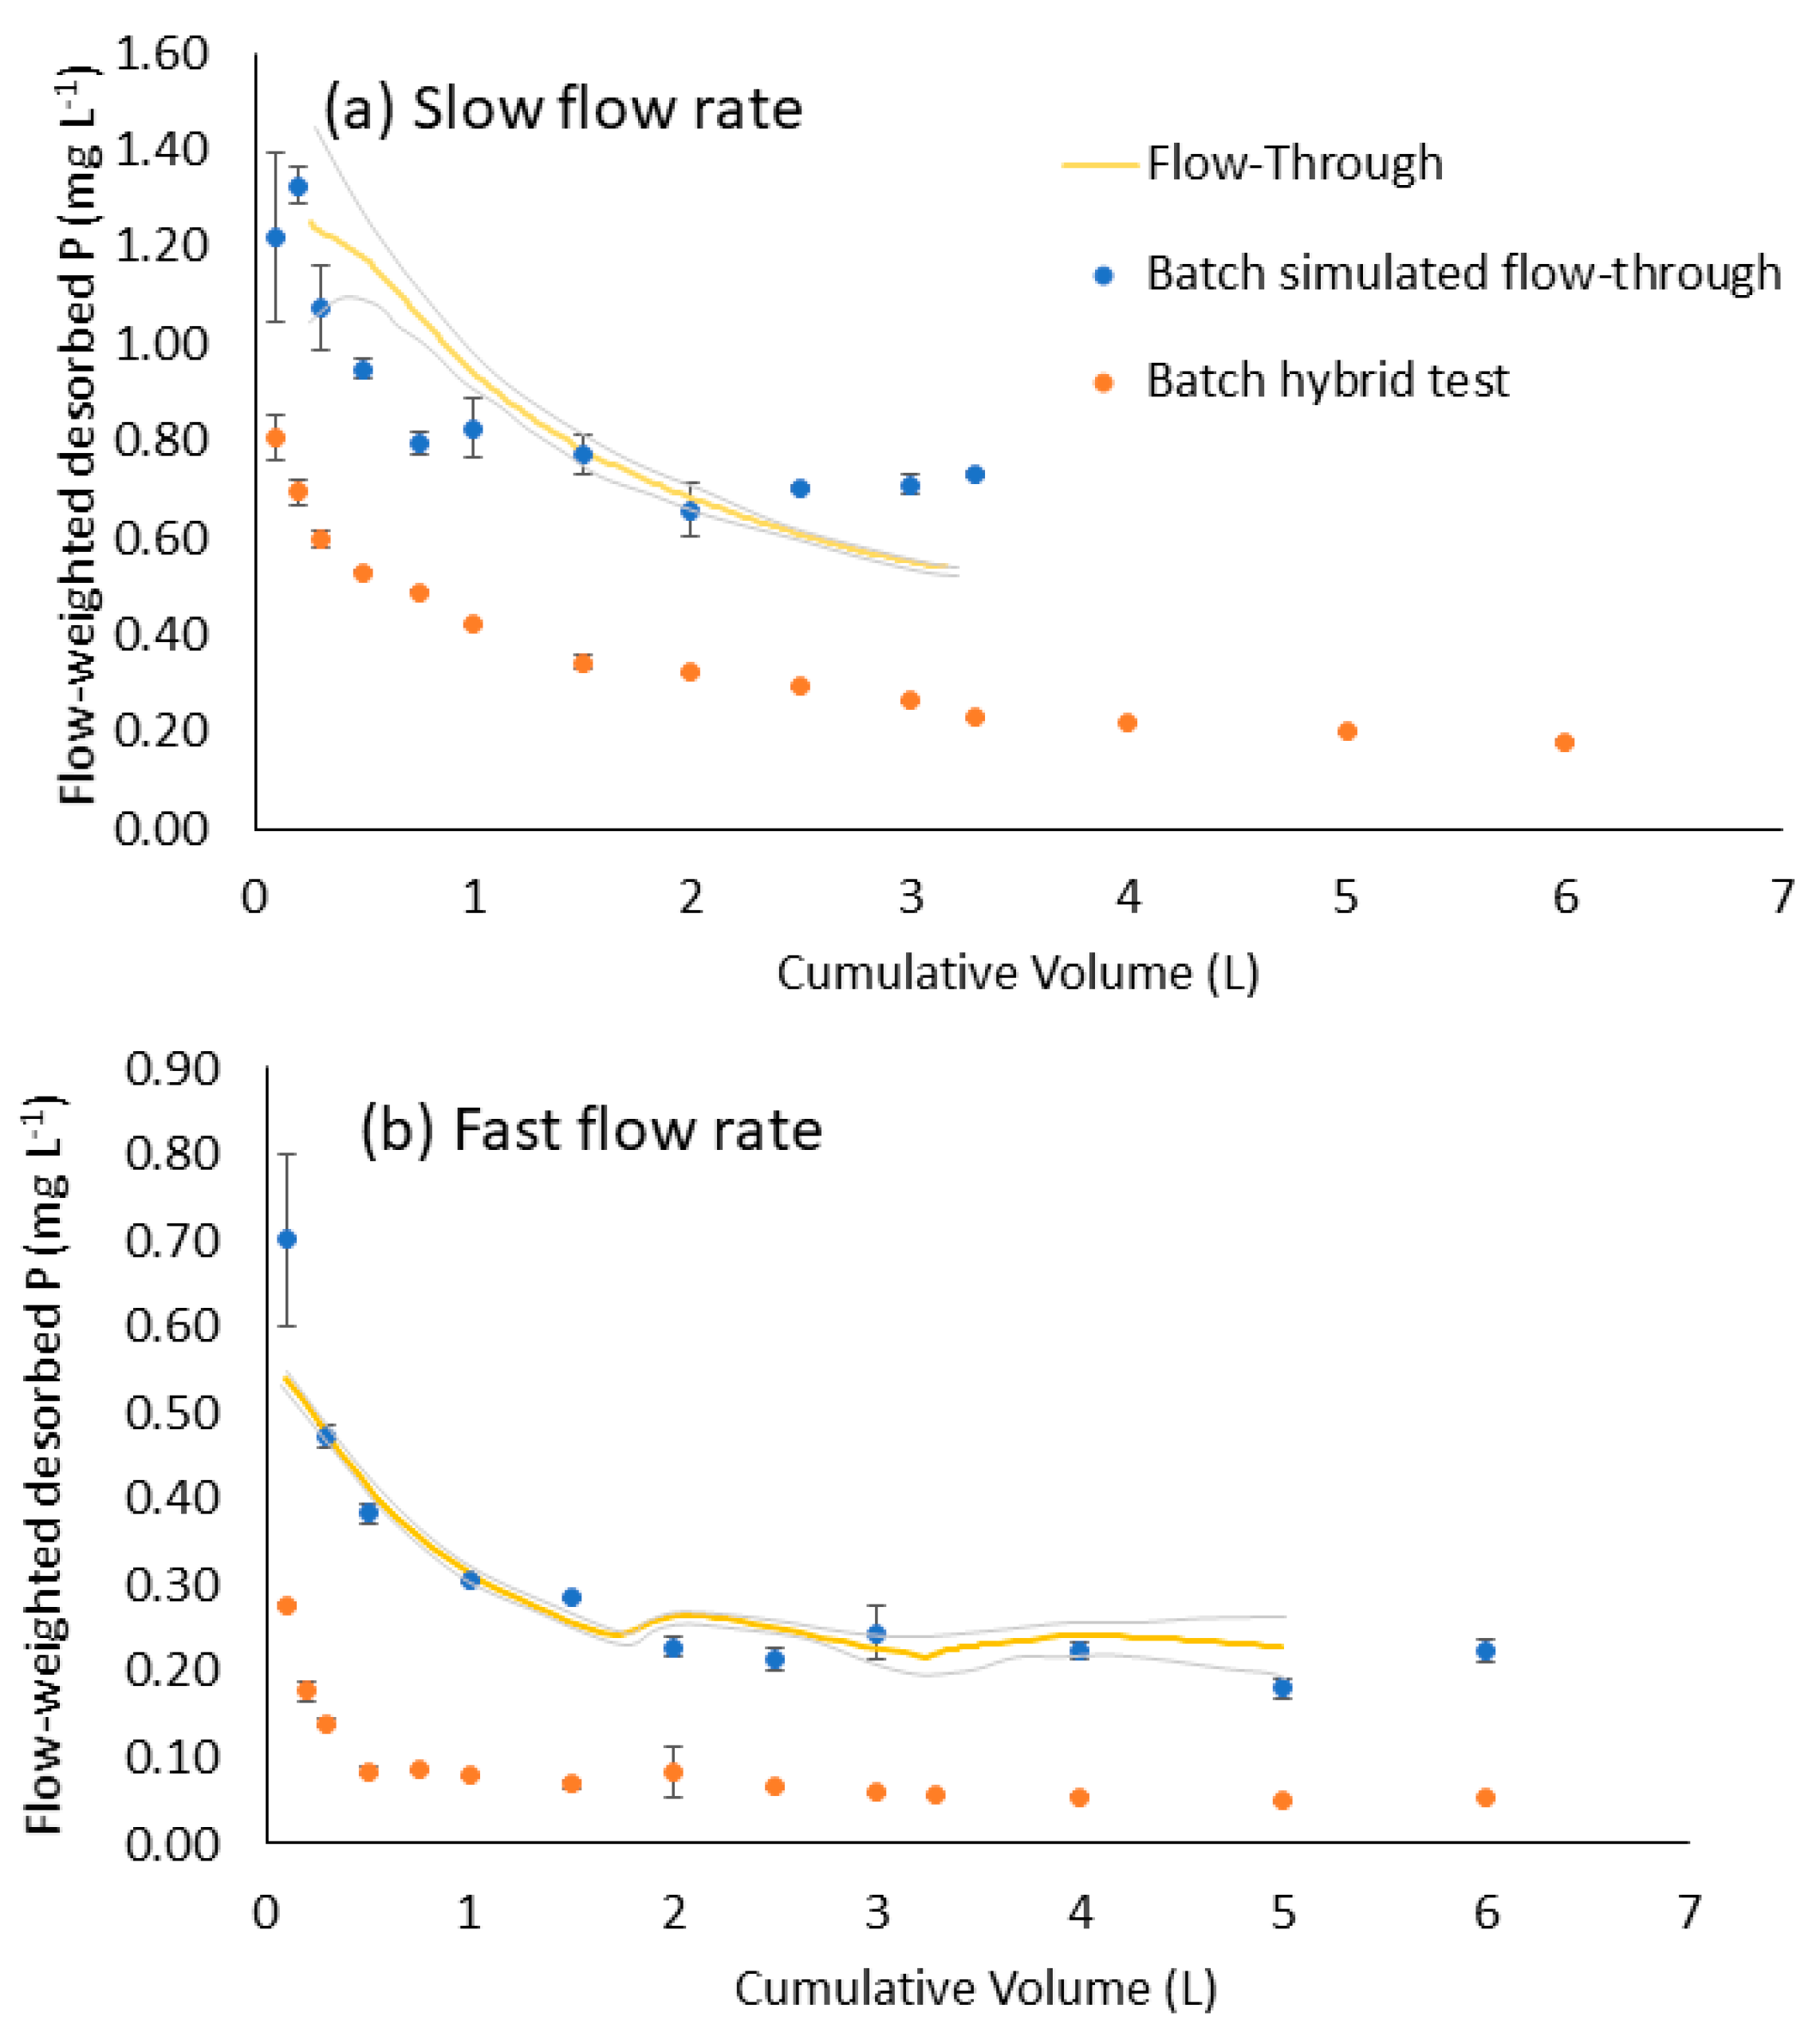
3.4. Comparison of Flow-Through Experiment and Batch Test Desorption

Since batch desorption P concentration data are naturally flow-weighted, the flow-through desorption concentrations were converted to flow-weighted for comparison. Similarly, flow-through desorption must also be expressed as cumulative for normalized comparisons based on soil mass. There was poor agreement between the hybrid batch test and the flow-through experiment for both flow-weighted concentrations (Figure 7) and P desorbed as mg kg−1 (not shown). Results therefore indicate that even though shake-times of 0.5 min and 23 min during the hybrid batch test matched the discrete contact time for the flow-through experiment, it was not possible for the entire volume of water to sufficiently interact with the soil in that time. In comparison, in a flowing system, the same cumulative volume interacts with the soil one pore volume at a time for many hours. This finding suggests that while not unimportant or non-influential, discrete contact time has less impact on P desorption than cumulative contact time in systems where water is moving or dissolved P is removed. It also illustrates how flow rate and time are difficult to separate for flow-through experiments whereby two factors, time and volume, both influence P release and are confounded within the single factor of flow rate. Further, the mass of P desorbed from the fast flow rate would eventually equal that of the slow flow rate (Figure 6d), given sufficient cumulative flow time.
There was decent agreement between the batch simulated flow-through test and the flow-through experiment (Figure 7). The batch simulated flow-through test matched cumulative time of the flow-through experiment, but not the discrete contact time (Figure 4). For P adsorption, Miller et al. [69] found that a flow-through system was thermodynamically similar to a batch system that used a large solution:soil ratio. However, a closer comparison of desorption between the flow-through experiment and the batch simulated flow-through test in the current study reveals that the latter was not a perfect representation of the former (Figure 8). Desorption for the batch simulated flow-through test was linear compared to the flow-through experiment which was non-linear; therefore, the batch simulated flow-through test tended to desorb P at a constant rate compared to the flow-through experiment. Differences in the slope of time versus cumulative desorbed P relationship indicated that the flow-through experiment generally desorbed P more slowly than the batch simulated flow-through test after the desorption rate significantly decreased for flow-through (Figure 8). Thus, even though both tests utilized the same cumulative volumes and cumulative time, the batch simulated flow-through test desorbed P at a more constant and faster rate. In the flow-through system, a limited discrete volume (i.e., pore volume) and contact time is allowed for interaction between soil and solution. Additionally, in a batch test the cumulative volume is able to interact with the whole soil mass over the entire cumulative time period, which allows more time for physio-chemical limitations to be overcome. This also disrupts equilibrium via dilution and allows the reaction to proceed at a higher rate according to first-order kinetics (Figure 5). So, while cumulative time was more influential than discrete contact time, the discrete contact time and discrete volume still partly controlled P desorption. Only a few direct comparisons between batch and flow-through methods have been conducted [38,68,69,70,71], with Amacher [36] summarizing the differences between methods as mostly due to differences in mass transfer rates. In a review paper, Sparks [72] wrote that “flow studies performed at realistic solution-to-solid ratios clearly indicated that for many chemical species of interest, such as potassium, phosphate, and selenite, the solute-solid interactions are much slower than with batch techniques”.

3.5. Differences in P Desorption between Fast and Slow Flow Rates

The fast flow rate in the flow-through experiment had a smaller degree of desorption, but desorption occurred more quickly than the slow flow rate, which desorbed a greater mass of P at a gradual rate. Differences between flow rates can be further explored in light of the physio-chemical aspect of P buffering. The ability of a soil to buffer P (i.e., “quantity-intensity”) addresses both the degree and speed by which a soil can replenish the solution phase. While P buffering will vary among soils, only one soil was evaluated in the current study; thus, there is a constant chemical potential for maximum solution P buffering and therefore the actual P buffering (P desorption character) manifests as a function of the conditions.
For an individual soil, physical conditions and processes ultimately control the degree to which maximum P buffering potential is realized. Physical processes can impact chemical equilibrium and kinetic processes that transport reaction products and reactants, with both first-order kinetics and particle diffusion-limited kinetics directly applicable to the current study. First-order kinetics dictate that the rate of reaction is proportional to the concentration of one of the chemical participants in the reaction. The physio-chemical process of reaction product dilution therefore allows desorption to occur faster. The flow-through interruption test also demonstrated that desorption under flow-through conditions was limited by particle diffusion. Since P desorption was found to be best described by two different first-order kinetic reactions in the current study and others [42,43,73], these physio-chemical processes can help explain the differences in P desorption behavior between flow rates and also changes in desorption over time.
Batch test results indicated that the higher desorption rate of the fast flow rate relative to the slow flow rate (i.e., the slope in Figure 6d) was due to dilution via fast removal of reaction products. That is, the faster flow rate added more cumulative volume at any given time than the slow flow rate. However, within both flow rates there was a decrease in desorption rate that was not observed with the batch simulated flow-through test that received the same cumulative volumes for the same cumulative time (Figure 8). Soil P can be broadly separated into two pools, less-labile and labile, based on solubility [74]. The less-labile pool is larger, but less soluble. This pool is in equilibrium with the labile pool and is often considered important to the second “gradual phase” of first-order P desorption kinetics [41,42]. Likewise, the labile pool is often considered important to the initial “rapid phase” of desorption, although it is much smaller in size and more dynamic [73]. The interruption tests conducted at the fast flow rate illustrates the impact of this buffering process (Figure 9). At start-up, the labile P pool was at its maximum size producing high initial solution concentrations (Figure 6a,c) and therefore maximum desorption rate (Figure 9). As the labile pool was depleted via desorption, desorption rate decreased. In this case, the desorption rate to solution exceeded the rate of “re-supply” or buffering of the less-labile to the labile pool, which caused the net desorption rate to solution to decrease. During the interruption period, the less-labile and labile pools were able to re-equilibrate, allowing the labile pool to be replenished. Thus, at re-start, a much higher desorption rate was observed similar to that at the initiation of the experiment (Figure 9). McDowell and Sharpley [73] found that the initial P release into solution was reflective of desorption from particle edges and over time P release was controlled by diffusion rate from within aggregates. Notice that following the second interruption, the desorption rate did not return to the expected level (Figure 9). After the second interruption, the pump only reached approximately 3 mL min−1 rather than the target flow rate of 7.2 mL min−1. This produced higher solution concentrations (Figure 6c), which ultimately reduced desorption rate based on first-order kinetics. The findings demonstrate how sensitive desorption rate is to solution P concentrations partly controlled by a flowing system that removes P.
Determination of a best fit linear-linear model to the flow-through data (Figure 7) normalized to 3 L cumulative volume provided the “breakpoint” value where the slope changed (p < 0.001). This provided an indicator of the split between the rapid and gradual phases commonly reported for P desorption. The breakpoint between phases occurred after desorption of 50 and 185 mg kg−1 for the fast and slow flow rates, respectively. The slow flow rate released more P than the fast flow rate during its initial rapid phase since the labile pool was not exhausted as quickly due to slower solution desorption rates (Figure 6d). This allowed replenishment of the labile pool by the less-labile pool over a greater amount of cumulative desorption. Notice that the batch simulated flow-through desorbed P at approximately the same rate as flow-through up until the desorption rate for the flow-through significantly decreased (Figure 8). Apparently, physical differences between batch shaking and flow-through allow for batch desorption to continue to maintain a near-constant desorption rate compared to flow-through conditions that decrease in desorption rate. Interestingly, regardless of differences in P desorption, these breakpoint values occurred irrespective of flow rate after about 1 L of cumulative flow, or a 200:1 solution:soil ratio. This supports previous findings on the strong influence of cumulative volume on desorption, and the importance of physical processes. Similarly, Frossard et al. [41] successfully modelled P release from a soil leaching column based on two different P pools that followed first-order kinetics.

3.6. A Closer Look at the Physio-Chemical Process of P Buffering and Desorption Kinetics

The physio-chemical aspects of P buffering processes (e.g., [36,73]) uncovered in the flow-through interruption test were also what caused differences in P desorption character between fast and slow flow rates, with the common denominator being time: time of interruption in one case, and contact time in the other. Ultimately, in a flowing system, the difference imparted by flow rate is cumulative volume and contact time. While cumulative volume was previously discussed in detail, less has been stated on contact time. Indeed, contact time is intimately related to physical processes such as diffusion kinetics. For instance, in a study on P leaching, Akhtar et al. [75] stated that “…high pore-water velocities can override the kinetics because the residence time can be too short for the solute to diffuse to reaction sites on the macropore wall”.
The buffering process of the less-labile pool replenishing the labile pool requires time. The interruption period therefore permits this replenishment by halting removal of newly dissolved P and allowing P in the dynamic labile pool to accumulate again. This same time requirement is necessary for overcoming physical limitations due to flow rate. The fast flow rate depletes the labile pool in a shorter time period and after less cumulative desorption (Figure 8) due to a greater desorption rate (Figure 6d) and less replenishment of the labile pool by the less-labile pool compared to the slow flow rate. Sharpley [76] observed the effect of this process on P lost in runoff. Briefly, he found that dissolved P concentrations decreased with time during an individual rainfall event, but increasing the interval between flow events from 1 day to 3 or 6 days increased P loss.
Knowing that mass transfer (i.e., kinetics of physical processes such as diffusion) limits the overall kinetics in flow-through methods [68] and as demonstrated in this study, it is apparent that this limitation is captured by the flow rate variable. For chemical reactions to proceed, the physical limitations of delivering and removing reactants and products, respectively, must be overcome. A flowing system naturally removes reaction products; therefore, a faster flow rate will result in a faster desorption rate via the dilution of products (Figure 6d) in the same manner as a large solution:soil ratio will desorb P faster than a small one (Figure 5). However, a faster flow rate may impose a physical limitation on the degree of the reaction with regard to the reactants. In brief, at the slow rate, the rate of the reaction was limited due to lack of dilution, and for the fast flow rate, what little P was able to desorb, desorbed fast, but the degree of the reaction was limited (Figure 6). Previous discussions (see Section 3.4 and Section 3.5) explained how flow rates impact desorption rates. The following sections focus on the effect of flow rate on the degree of P desorption as related to physio-chemical processes.
When P desorbs from soil, the process often involves protons or hydroxyls, as either reactants or products. This occurs for P desorption from ligand exchange (i.e., inner-sphere) sites via hydroxyl or dissolution of various phosphate minerals involving either hydroxyl or protons [39]. Inner-sphere bound P and poorly-soluble P minerals are considered less-labile compared to P bound on anion exchange sites, which is weakly held and labile, and does not necessarily involve hydroxyl and protons. Protons and hydroxyl are sourced from the hydrolysis of water, which occurs instantaneously [36] and may or may not result in a measurable change in pH. In addition to inner-sphere bound P and poorly-soluble P minerals, P bound within biomass is also considered less-labile since it requires microbial decomposition to be released into solution. While mineralization of P held in biomass contributes P to solution, its contribution at the time scale of the current study can only be minor. For example, soil organic matter (SOM) is approximately 0.5% P [77]. The evaluated soil had 19.6 g kg−1 organic carbon (Table 1; 33.7 g kg−1 SOM), which would equal about 167 mg P kg−1 in SOM. Organic C mineralization rates for arable soils were demonstrated to mineralize at a maximum of 0.014 g kg−1 d−1 under ideal moisture and similar temperatures (25 °C) [78]. At that mineralization rate, P release would amount to only 0.12 mg kg−1 d−1. For the slow flow rate, overall P release was 21 mg kg−1 d−1. In a flow-through desorption study, Frossard et al. [41] also found that the contribution of soil organic P was insignificant.
While desorption and dissolution chemical reactions can be on the scale of seconds [37], the kinetics of physical movement of either H+ or OH to the mineral surface as a reactant is limiting. Previous studies have shown that kinetics of dissolution under flow-through methods are indeed physically limiting [68,70], as illustrated in this study with the interruption test. A flowing solution with limited contact and contact time disrupts this physical process, thereby preventing the chemical reaction. Further evidence within the current study is found in the pH of outflow water samples. The pH was significantly greater (p < 0.01) for samples from the slow flow rate (mean = 6.21) compared to the fast flow rate (mean = 5.62).
The physical processes that occur during solute removal from soils with water flow are well depicted by Schott et al. [79]. Bulk flow through large pores and between aggregates rapidly transport solute and P located in that space via advection. Movement of P from between particles and across the particle film, however, is a much slower process [37,79]. Indeed, Koopmans et al. [32] described this rate-limiting step as diffusion of desorbed P from inside metal hydroxides into the outer layers of aggregates [80]. The slow release of P via intra-aggregate diffusion, they concluded, is what replenishes the soil solution for potential transport and bioavailability.
Kinetics limited by physical processes would explain why the slow flow rate (i.e., longer contact time) desorbs a greater mass of P than the fast flow rate, on an equal volume basis (Figure 6b), and also the discrepancy between the flow-through experiment and batch simulated flow-through test (Figure 8). The batch kinetic methods used in the current study demonstrate how increased contact time increases P desorption (Figure 2, Figure 3 and Figure 5). Further, the results provide insight into the buffering process. Knowing that P desorption chemical reactions are fast, it is therefore the physical transport that limits the reaction rate as demonstrated with the flow-through interruption tests. Compared to the slower flow rate, the faster flow rate: (i) possesses higher desorption rates due to dilution of products via first-order kinetics, but (ii) displays a lesser degree of desorption because of the physical limitations that reduce the ability of the less-labile slow phase P to replenish the labile pool.

3.7. Implications for Water Quality and Fertility Studies

The amount of P desorption from the flow-through experiment and the batch tests that utilized large solution:soil ratios was comparable to the amount of P extracted with M3, which contains strong acids, fluoride, and EDTA to dissolve/desorb a portion of several soil P pools [81]. Mehlich-3 was designed to estimate plant-available P across a variety of soil properties through the correlation to P uptake and yield measured in-field. Given the rigor of the M3 extraction, it was unexpected that a similar P mass could be removed over only 17 d using water, albeit at large solution:soil ratios. For the hybrid batch test conducted with variable volumes and constant reaction time, one-third of the M3-P level (120 mg kg−1) was extracted in only 23 min. The findings therefore highlight the strong influence of chemical potential on P release as dictated by thermodynamics using water, the weakest possible extractant.
The impact of flow rate on P desorption has direct implications for P transport research and modelling. In essence, it requires soil P, water, and time to desorb P. Among batch experiments, those designed to represent the cumulative flow volume and cumulative time of the flow-through experiment provided the best approximations, but they still fell short in simulating flow-through. It was demonstrated here that flow rate had a profound effect on the rate and degree of P desorption, as impacted by cumulative time and volume, discrete contact time, and the nature of the soil-water interaction. The influence of these variables is explained by the underlying processes of first-order kinetics and limitations of the net desorption kinetics via particle diffusion. For a given soil with a constant potential for P release quantity and rate, these variables represent the underlying processes which are ultimately the result of physical processes that impact chemical equilibrium.
Consider the scenario of water infiltrating into the soil and leaching into a subsurface tile drain. The fast flow rate used in this study represented the rapid flow rates through soil observed in the Western Lake Erie Basin, while the slow flow rate represented soil saturated hydraulic conductivity. Two different flow events can deliver the same volume of water, yet occur over different time periods depending on storm characteristics (e.g., rainfall amount and intensity). Ignoring any potential P sorption by subsurface soils and comparing flow events of equal volume, the slow flow rate in the current study would release higher concentrations of P in solution and a greater mass of P compared to the fast flow rate. In contrast, the fast flow rate would release P much faster, but with a smaller mass and solution concentration. Thus, water transport processes through a soil are likely to have a profound impact on P transport. This also has implications for surface runoff, which interacts with the soil at a varying degree depending on storm characteristics; the kinetics of P release plays an important role in P release in runoff. For example, Sharpley et al. [23] found that the relationship between the natural log of dissolved P and time was linear for 30 min runoff events, therefore obeying first-order kinetics. Research conducted regarding runoff–soil interactions and P transport by Sharpley [76,82,83,84,85] provided insight into these processes. Briefly, the “effective depth of interaction” between runoff and soil is a function of rainfall characteristics, soil cover, soil properties, and slope [83], which control the resulting P concentrations in the runoff [84,85]. For example, Sharpley et al. [23] showed that increasing rainfall intensity decreased dissolved P concentrations in runoff. This body of research produced a model for predicting soil P release to runoff based on the kinetics of P release. While proven effective, their approach was never incorporated into any nutrient transport models except for the Field Hydrologic and Nutrient Transport Model [86] due to its perceived complexity (A.N. Sharpley, personal communication).
Considering the M3-P level and the correlations established between M3-P and runoff, leachate, or tile drainage dissolved P concentrations, several predictions can be compared to the observations made in the current study. Using the universal coefficient developed by Vadas et al. [19], dissolved P in runoff from the study soil would be expected to be 0.75 mg L−1. Similarly, leachate P concentrations of 2.1 mg L−1 would be predicted from relationships developed using soil columns by Sims et al. [86]. Using field data from the same region as the soil used in this study, correlations developed for 0–5 cm samples by Osterholz et al. [27] predict 2.4 and 1.0 mg L−1 for runoff and tile drainage, respectively. Higher predicted runoff values vs. tile drainage by Osterholz et al. [27] are likely due to the fact that tile drainage will often interact with low P subsoil before discharge [87]. Several years of tile-drainage monitoring from the site of soil collection was reported in a study by Shedakar et al. [46] who showed an overall flow-weighted mean concentration of 0.7 mg L−1. That value included all flow events which occurred at a variety of flow rates and therefore variable soil–water interactions. Interestingly, the value reported by Shedakar et al. [46] falls between the initial flow-through P concentrations for the slow (1.5 mg L−1) and fast (0.5 mg L−1) flow rates. King et al. [88] and Penn et al. [89] showed how dissolved P concentrations from tile drains are extremely dynamic within a given site with dissolved P concentrations increasing and decreasing with flow rate on a hydrograph. The results from the current study suggest that the dynamic nature of dissolved P concentrations may be partly due to variability in soil–water interactions, such as contact time. Indeed, Williams et al. [87] showed that tile drainage discharge can result from a range of soil–water interactions within and between the topsoil and subsoil.
Although the mass or “load” of P delivered to a water body is considered important with regard to the ecological impact on the receiving water body [90], the final concentration in that water body is what ultimately defines the chemical environment for the organisms in that ecosystem. From that perspective, flow-weighted concentrations partly dictate the potential for a water body to experience an algal bloom. Therefore, for a given volume of discharge and assuming similar subsoil–water interactions, the lower solution concentrations occurring with fast flow rates could potentially decrease bloom severity.
While the implications of these results are more obvious in the context of dissolved P transport, they are nonetheless applicable to plant uptake. An aspect of flow-through that makes it unique from batch tests, but also applicable to plant uptake, is the notion of P removal (i.e., reaction products) from the system. A flowing system removes the desorbed P, just as a plant root removes desorbed P from a solution which upsets equilibrium. In either case, dissolved P removal enables further desorption to continue and partly controls the rate based on first-order kinetics and thermodynamic equilibrium. Similarly, the solution:soil ratio (i.e., volume of water) will influence desorption. The uptake of P by plant roots reduces solution concentrations providing the chemical potential for desorption and diffusion toward the plant root, which is generally limited to around 2 mm [91]. Based on this study, the removal of P will increase the P desorption rate, but this rate will decrease as the soil P pool is depleted immediately around the root, thereby creating a P gradient and promoting continued P desorption further away from the root [91]. The results of this study also support the notion that P desorption rate will decrease with time if the “rapid” labile phase is depleted more quickly than the secondary “gradual” less-labile phase is able to replenish it. The Barber–Cushman nutrient uptake model, which serves as the basis for several plant growth models, does not consider the rate of soil P desorption; instead, it assumes that plant root nutrient uptake rate is more limiting. It is unknown, however, if this is a valid assumption; the flow-through approach presented in the current study may be useful for studying this assumption in future work. Although little has been conducted on that aspect, Koopmans et al. [32] measured P uptake rates and P desorption kinetics in a system using ryegrass (Lolium perenne L.). They showed that while initial desorption kinetics were faster than plant uptake rates of P, the P release kinetics slowed as soil P became depleted and coincided with a deficiency in P uptake indicating that kinetics became limiting.

4. Conclusions

Soil P desorption quantity and rate are a function of cumulative solution volume, cumulative time, and discrete contact time. Each of these variables is intertwined, and for a dynamic system such as moving water, is captured by the single variable of flow rate. Soil P desorption followed first-order kinetics in two phases observed in both batch and flow-through experiments: an initial rapid desorption rate followed by a gradual P release. The P desorption and buffering process in flow-through experiments was found to be limited based on diffusion, as demonstrated by interruption tests. Batch experiments desorbed P at a higher rate than flow-through when batch tests were conducted to simulate the changing cumulative time and solution volume of flow-through cells. Net desorption kinetics were the result of both chemical reactions and physical processes.
The interaction between chemical and physical processes controlled how P desorption would be manifested; although P desorption is a chemical process, it occurs through a physical environment. Depending on the dynamic between physical and chemical processes, P desorption may be enhanced or depressed. For example, as a consequence of first-order kinetics, the connection between thermodynamics and kinetics was readily observed in several experiments in that the disruption of equilibrium through dilution promoted P desorption as well as increased desorption rate. For this reason, the fast flow rate, a physical characteristic, desorbed P at lower solution concentrations yet at a higher rate than the slow flow rate. Similarly, flow-through systems were more limited by the physical process of diffusion than batch tests, and fast flow rates more affected than slow flow rates. A faster flow rate appeared to impose a physical limitation on the degree of the reaction with regard to the reactants, resulting in a lesser mass of P desorbed at any given volume and in the initial rapid desorption phase. Considering both physical processes of dilution (thermodynamics) and diffusion, the result was that for the slow flow rate, the net desorption rate was limiting due to lack of dilution, and for the fast flow rate, what little P was able to desorb, desorbed fast, yet the degree of the reaction was limited.
A flow-through system is more realistic of field processes than traditional batch tests, in that P is constantly being removed as would occur through leaching or plant uptake, and the degree of interaction is limited to a single pore volume at any given moment. Quantification of the physio-chemical processes controlling P desorption would improve the modelling of non-point transport of dissolved P and plant uptake. An immediate application would be through improving our understanding of how hydrology partly dictates P desorption.

Author Contributions

Conceptualization, C.J.P.; methodology, C.J.P. and M.R.W.; formal analysis, C.J.P.; investigation, N.W. and H.W.; data curation, C.J.P. and N.W.; writing—original draft preparation, C.J.P.; writing—review and editing, M.R.W. and J.C.; supervision, C.J.P.; project administration, C.J.P.; funding acquisition, M.R.W. and C.J.P. All authors have read and agreed to the published version of the manuscript.

Funding

This research was a contribution from the Long-Term Agroecosystem Research (LTAR) network. LTAR is supported by the United States Department of Agriculture.

Institutional Review Board Statement

Not applicable.

Informed Consent Statement

Not applicable.

Data Availability Statement

Data is contained within the article.

Conflicts of Interest

The authors declare no conflict of interest.

References

  1. Haygarth, P.M.; Jarvie, H.P.; Powers, S.M.; Sharpley, A.N.; Elser, J.J.; Shen, J.; Peterson, H.M.; Chan, N.-I.; Howden, N.J.K.; Burt, T.; et al. Sustainable phosphorus management and the need for a long-term perspective: The legacy hypothesis. Environ. Sci. Technol. 2014, 48, 8417–8419. [Google Scholar] [CrossRef] [PubMed]
  2. Wurtsbaugh, W.A.; Paerl, H.W.; Dodds, W.K. Nutrients, eutrophication and harmful algal blooms along the freshwater to marine continuum. WIREs Water 2019, 6, e1373. [Google Scholar] [CrossRef]
  3. Van Der Zee, S.; Van Riemsdijk, W. Sorption kinetics and transport of phosphate in sandy soil. Geoderma 1986, 38, 293–309. [Google Scholar] [CrossRef]
  4. Freese, D.; Van Riemsdijk, W.; Van Der Zee, S. Modelling phosphate-sorption kinetics in acid soils. Eur. J. Soil Sci. 1995, 46, 239–245. [Google Scholar] [CrossRef]
  5. Wilson, G.V.; Rhoton, F.E.; Selim, H.M. Modeling the impact of ferrihydrite on adsorption-desorption of soil phosphorus. Soil Sci. 2004, 169, 271–281. [Google Scholar] [CrossRef]
  6. Sims, J.T.; Maguire, R.O.; Leytem, A.B.; Gartley, K.L.; Pautler, M.C. Evaluation of Mehlich 3 as an agri-environmental soil phosphorus test for the Mid-Atlantic United States of America. Soil Sci. Soc. Am. J. 2002, 66, 2016–2032. [Google Scholar] [CrossRef]
  7. Penn, C.J.; Mullins, G.L.; Zelazny, L.W.; Sharpley, A.N. Estimating dissolved phosphorus concentrations in runoff from three physiographic regions of Virginia. Soil Sci. Soc. Am. J. 2006, 70, 1967–1974. [Google Scholar] [CrossRef]
  8. McDowell, R.; Sharpley, A. Approximating phosphorus release from soils to surface runoff and subsurface drainage. J. Environ. Qual. 2001, 30, 508–520. [Google Scholar] [CrossRef] [Green Version]
  9. Thomas, G.W.; Peaslee, D.E. Testing soils for phosphorus. In Soil Testing and Plant Analysis; Walsh, L.M., Beaton, J.D., Eds.; Soil Science Society of America, Inc.: Madison, WI, USA, 1973; pp. 115–132. [Google Scholar]
  10. Cox, F.R.; Lins, I.D.G. A phosphorus soil test interpretation for corn grown on acid soils varying in crystalline clay content 1. Commun. Soil Sci. Plant. Anal. 1984, 15, 1481–1491. [Google Scholar] [CrossRef]
  11. Davis, R.L.; Zhang, H.; Schroder, J.L.; Wang, J.J.; Payton, M.E.; Zazulak, A. Soil Characteristics and Phosphorus Level Effect on Phosphorus Loss in Runoff. J. Environ. Qual. 2005, 34, 1640–1650. [Google Scholar] [CrossRef]
  12. Amer, F.; Bouldin, D.R.; Black, C.A.; Duke, F.R. Characterization of soil phosphorus by anion exchange resin adsorption and P32-equilibration. Plant. Soil 1955, 6, 391–408. [Google Scholar] [CrossRef]
  13. Bissani, C.A.; Tedesco, M.J.; Camargo, F.; Miola, G.L.; Gianello, C. Anion-exchange resins and iron oxide-impregnated filter paper as plant available phosphorus indicators in soils. Commun. Soil Sci. Plant. Anal. 2002, 33, 1119–1130. [Google Scholar] [CrossRef]
  14. Qian, P.; Schoenau, J.J. Practical applications of ion exchange resins in agricultural and environmental soil research. Can. J. Soil Sci. 2002, 82, 9–21. [Google Scholar] [CrossRef]
  15. Yang, J.E.; Skogley, E.O.; Georgitis, S.J.; Schaff, B.E.; Ferguson, A.H. Phytoavailability Soil Test: Development and Verification of Theory. Soil Sci. Soc. Am. J. 1991, 55, 1358–1365. [Google Scholar] [CrossRef]
  16. Daverede, I.C.; Kravchenko, A.N.; Hoeft, R.G.; Nafziger, E.D.; Bullock, D.G.; Warren, J.J.; Gonzini, L.C. Phosphorus runoff: Effect of tillage and soil phosphorus levels. J. Environ. Qual. 2003, 32, 1436–1444. [Google Scholar] [CrossRef] [PubMed]
  17. Sharpley, A.N. An innovative approach to estimate bioavailable phosphorus in agricultural runoff using iron oxide-impregnated paper. J. Environ. Qual. 1993, 22, 597–601. [Google Scholar] [CrossRef] [Green Version]
  18. Gaston, L.A.; Drapcho, C.M.; Tapadar, S.; Kovar, J.L. Phosphorus Runoff Relationships for Louisiana Coastal Plain Soils Amended with Poultry Litter. J. Environ. Qual. 2003, 32, 1422–1429. [Google Scholar] [CrossRef] [PubMed]
  19. Vadas, P.A.; Kleinman, P.J.A.; Sharpley, A.N.; Turner, B.L. Relating Soil Phosphorus to Dissolved Phosphorus in Runoff: A Single Extraction Coefficient for Water Quality Modeling. J. Environ. Qual. 2005, 34, 572–580. [Google Scholar] [CrossRef] [PubMed] [Green Version]
  20. Fuhrman, J.K.; Zhang, H.; Schroder, J.L.; Davis, R.L.; Payton, M.E. Water-soluble phosphorus as affected by soil to extractant ratios, extraction times, and electrolyte. Commun. Soil Sci. Plant Anal. 2005, 36, 925–935. [Google Scholar] [CrossRef]
  21. Roswall, T.; Lucas, E.; Yang, Y.-Y.; Burgis, C.; Scott, I.S.P.C.; Toor, G.S. Hotspots of legacy phosphorus in agricultural landscapes: Revisiting water-extractable phosphorus pools in soils. Water 2021, 13, 1006. [Google Scholar] [CrossRef]
  22. Adams, F.; Burmester, C.; Hue, N.V.; Long, F.L. A Comparison of Column-Displacement and Centrifuge Methods for Obtaining Soil Solutions. Soil Sci. Soc. Am. J. 1980, 44, 733–735. [Google Scholar] [CrossRef]
  23. Sharpley, A.N.; Ahuja, L.R.; Menzel, R.G. The Release of Soil Phosphorus to Runoff in Relation to the Kinetics of Desorption. J. Environ. Qual. 1981, 10, 386–391. [Google Scholar] [CrossRef]
  24. van der Paauw, F. An effective water extraction method for the determination of plant-available soil phosphorus. Plant. Soil 1971, 34, 467–481. [Google Scholar] [CrossRef]
  25. Wuenscher, R.; Unterfrauner, H.; Peticzka, R.; Zehetner, F. A comparison of 14 soil phosphorus extraction methods applied to 50 agricultural soils from Central Europe. Plant. Soil Environ. 2015, 61, 86–96. [Google Scholar] [CrossRef]
  26. Self-Davis, M.L.; Moore, P.A., Jr.; Joern, B.C. Determination of water-and/or dilute salt-extractable phosphorus. In Methods of Phosphorus Analysis for Soils, Sediments, Residuals, and Waters; Southern Cooperative Series Bulletin: Fayetteville, AR, USA, 2000; Volume 396, pp. 24–26. [Google Scholar]
  27. Osterholz, W.R.; Hanrahan, B.R.; King, K.W. Legacy phosphorus concentration–discharge relationships in surface runoff and tile drainage from Ohio crop fields. J. Environ. Qual. 2020, 49, 675–687. [Google Scholar] [CrossRef]
  28. Daniel, T.C.; Edwards, D.R.; Sharpley, A.N. Effect of Extractable Soil Surface Phosphorus on Runoff Water Quality. Trans. ASAE 1993, 36, 1079–1085. [Google Scholar] [CrossRef] [Green Version]
  29. Raven, K.P.; Hossner, L.R. Soil phosphorus desorption kinetics and its relationship with plant growth. Soil Sci. Soc. Am. J. 1994, 58, 416–423. [Google Scholar] [CrossRef]
  30. Raven, K.P.; Hossner, L.R. Phosphorus Desorption Quantity-Intensity Relationships in Soils. Soil Sci. Soc. Am. J. 1993, 57, 1501–1508. [Google Scholar] [CrossRef]
  31. Probert, M.; Moody, P.W. Relating phosphorus quantity, intensity, and buffer capacity to phosphorus uptake. Soil Res. 1998, 36, 389–394. [Google Scholar] [CrossRef]
  32. Koopmans, G.F.; Chardon, W.; Ehlert, P.A.I.; Dolfing, J.; Suurs, R.A.A.; Oenema, O.; Van Riemsdijk, W.H. Phosphorus availability for plant uptake in a phosphorus-enriched noncalcareous sandy soil. J. Environ. Qual. 2004, 33, 965–975. [Google Scholar] [CrossRef]
  33. Beauchemin, S.; Simard, R.R.; Cluis, D. Phosphorus sorption-desorption kinetics of soil under contrasting land uses. J. Environ. Qual. 1996, 25, 1317–1325. [Google Scholar] [CrossRef]
  34. Sparks, D.L.; Zelazny, L.W.; Martens, D.C. Kinetics of Potassium Desorption in Soil using Miscible Displacement. Soil Sci. Soc. Am. J. 1980, 44, 1205–1208. [Google Scholar] [CrossRef] [Green Version]
  35. Mansell, R.S.; Selim, H.M.; Kanchanasut, P.; Davidson, J.M.; Fiskell, J.G.A. Experimental and simulated transport of phosphorus through sandy soils. Water Resour. Res. 1977, 13, 189–194. [Google Scholar] [CrossRef]
  36. Amacher, M.C. Methods of Obtaining and Analyzing Kinetic Data. Rates Soil Chem. Process. 1991, 19–59. [Google Scholar] [CrossRef]
  37. Sparks, D.L. Kinetics of Soil Chemical Processes; Academic Press: San Diego, CA, USA, 1989. [Google Scholar]
  38. Sparks, D.L.; Rechcigl, J.E. Comparison of Batch and Miscible Displacement Techniques to Describe Potassium Adsorption Kinetics in Delaware Soils. Soil Sci. Soc. Am. J. 1982, 46, 875–877. [Google Scholar] [CrossRef] [Green Version]
  39. Penn, C.; Camberato, J. A Critical Review on Soil Chemical Processes that Control How Soil pH Affects Phosphorus Availability to Plants. Agriculture 2019, 9, 120. [Google Scholar] [CrossRef] [Green Version]
  40. Olsen, S.R.; Watanabe, F.S. A method to determine a phosphorus adsorption maximum of soils as measured by the langmuir isotherm1. Soil Sci. Soc. Am. J. 1957, 21, 144–149. [Google Scholar] [CrossRef]
  41. Frossard, E.; Demaria, P.; Sinaj, S.; Schärer, M. A flow-through reactor to assess potential phosphate release from agricultural soils. Geoderma 2014, 219–220, 125–135. [Google Scholar] [CrossRef]
  42. Guedes, R.S.; Melo, L.; Vergutz, L.; Rodríguez-Vila, A.; Covelo, E.F.; Fernandes, A.R. Adsorption and desorption kinetics and phosphorus hysteresis in highly weathered soil by stirred flow chamber experiments. Soil Tillage Res. 2016, 162, 46–54. [Google Scholar] [CrossRef]
  43. Lookman, R.; Freese, D.; Merckx, R.; Vlassak, K.; Van Riemsdijk, W.H. Long-Term Kinetics of Phosphate Release from Soil. Environ. Sci. Technol. 1995, 29, 1569–1575. [Google Scholar] [CrossRef]
  44. Lasaga, A.C.; Kirkpatrick, R.J. Kinetics of Geochemical Processes; BookCrafters, Inc.: Chelsea, MI, USA, 1981. [Google Scholar]
  45. Williams, M.R.; King, K.W.; Ford, W.; Buda, A.R.; Kennedy, C.D. Effect of tillage on macropore flow and phosphorus transport to tile drains. Water Resour. Res. 2016, 52, 2868–2882. [Google Scholar] [CrossRef] [Green Version]
  46. Shedekar, V.S.; Penn, C.J.; Pease, L.; King, K.W.; Kalcic, M.M.; Livingston, S.J. Performance of a ditch-style phosphorus re-moval structure for treating agricultural drainage water with aluminum-treated steel slag. Water 2020, 12, 2149. [Google Scholar] [CrossRef]
  47. Nelson, D.W.; Sommers, L.E. Total carbon, organic carbon and organic matter. In Methods of Soil Analysis; Part 3. Chemical Methods; Sparks, D.L., Ed.; Soil Science Society of America, Inc.: Madison, WI, USA, 1996; pp. 961–1010. [Google Scholar]
  48. Mehlich, A. Mehlich 3 soil test extractant: A modification of Mehlich 2 extractant. Commun. Soil Sci. Plant. Anal. 1984, 15, 1409–1416. [Google Scholar] [CrossRef]
  49. McKeague, J.A.; Day, J.H. Dithionite-and oxalate-extractable Fe and Al as aids in differentiating various classes of soils. Can. J. Soil Sci. 1966, 46, 13–22. [Google Scholar] [CrossRef]
  50. Murphy, J.; Riley, J.P. A modified single solution method for the determination of phosphate in natural waters. Anal. Chim. Acta 1962, 27, 31–36. [Google Scholar] [CrossRef]
  51. Martin, H.W.; Sparks, D.L. Kinetics of Nonexchangeable Potassium Release from Two Coastal Plain Soils1. Soil Sci. Soc. Am. J. 1983, 47, 883–887. [Google Scholar] [CrossRef] [Green Version]
  52. Jardine, P.M.; Sparks, D.L. Potassium-Calcium Exchange in a Multireactive Soil System: I. Kinetics. Soil Sci. Soc. Am. J. 1984, 48, 39–45. [Google Scholar] [CrossRef] [Green Version]
  53. Bolan, N.S.; Syers, J.K.; Sumner, M.E. Dissolution of various sources of gypsum in aqueous solutions and in soil. J. Sci. Food Agric. 1991, 57, 527–541. [Google Scholar] [CrossRef]
  54. Williams, M.R.; Livingston, S.J.; Penn, C.J.; Smith, D.R.; King, K.W.; Huang, C.-H. Controls of event-based nutrient transport within nested headwater agricultural watersheds of the western Lake Erie basin. J. Hydrol. 2018, 559, 749–761. [Google Scholar] [CrossRef]
  55. King, K.W.; Williams, M.R.; Macrae, M.L.; Fausey, N.R.; Frankenberger, J.; Smith, D.R.; Kleinman, P.J.A.; Brown, L.C. Phos-phorus transport in agricultural subsurface drainage: A review. J. Environ. Qual. 2015, 44, 467–485. [Google Scholar] [CrossRef] [Green Version]
  56. Guo, T.; Johnson, L.T.; LaBarge, G.A.; Penn, C.J.; Stumpf, R.P.; Baker, D.B.; Shao, G. Less agricultural phosphorus applied in 2019 led to less dissolved phosphorus transported to Lake Erie. Environ. Sci. Technol. 2020, 55, 283–291. [Google Scholar] [CrossRef]
  57. Scott, I.S.; Penn, C.J. Estimating the variability of steel slag properties and their influence in phosphorus removal ability. Chemosphere 2021, 276, 130205. [Google Scholar] [CrossRef]
  58. Penn, C.J.; Bowen, J.M. Design and Construction of Phosphorus Removal Structures for Improving Water Quality; Springer: Cham, Switzerland, 2017. [Google Scholar]
  59. Williams, M.R.; Coronel, O.; McAfee, S.J.; Sanders, L.L. Preferential flow of surface-applied solutes: Effect of lysimeter design and initial soil water content. Vadose Zone J. 2020, 19. [Google Scholar] [CrossRef]
  60. Rawls, W.J.; Gimenez, D.; Grossman, R. Use of soil texture, bulk density, and slope of the water retention curve to predict sat-urated hydraulic conductivity. Am. Soc. Agric. Biol. Eng. 1998, 41, 983–988. [Google Scholar] [CrossRef]
  61. SAS Institute Inc. SAS/STAT 9.1. User’s Guide; SAS Institute Inc.: Cary, NC, USA, 2003. [Google Scholar]
  62. Culman, S.; Fulford, A.; Camberato, J.; Steinke, K.; Lindsey, L.; LaBarge, G.; Warncke, D. Tri-State Fertilizer Recommendations for Corn, Soybeans, Wheat and Alfalfa. Available online: https://agcrops.osu.edu/FertilityResources/tri-state_info (accessed on 21 November 2021).
  63. Maguire, R.O.; Sims, J.T. Soil Testing to Predict Phosphorus Leaching. J. Environ. Qual. 2002, 31, 1601–1609. [Google Scholar] [CrossRef] [PubMed]
  64. Barrow, N.J.; Shaw, T.C. Effects of solution: Soil ratio and vigour of shaking on the rate of phosphate adsorption by soil. Eur. J. Soil Sci. 1979, 30, 67–76. [Google Scholar] [CrossRef]
  65. do Carmo Horta, M.; Torrent, J. Phosphorus desorption kinetics in relation to phosphorus forms and sorption properties of portuguese acid soils. Soil Sci. 2007, 172, 631–638. [Google Scholar] [CrossRef] [Green Version]
  66. Aslyng, H.C. The Lime and Phosphate Potentials of Soils; the Solubility and Availability of Phosphates; LWW: Philadelphia, PA, USA, 1954; Volume 78. [Google Scholar]
  67. Kressman, T.R.E.; Kitchener, J.A. Cation exchange with a synthetic phenolsulphonate resin. Part, V. Kinetics. Discuss. Faraday Soc. 1949, 7, 90–104. [Google Scholar] [CrossRef]
  68. Ogwada, R.A.; Sparks, D.L. Kinetics of ion exchange on clay minerals and soil: I. evaluation of methods. Soil Sci. Soc. Am. J. 1986, 50, 1158–1162. [Google Scholar] [CrossRef]
  69. Miller, D.M.; Sumner, M.E.; Miller, W.P. A Comparison of batch- and flow-generated anion adsorption isotherms. Soil Sci. Soc. Am. J. 1989, 53, 373–380. [Google Scholar] [CrossRef]
  70. Ogwada, R.A.; Sparks, D.L. Kinetics of Ion Exchange on Clay Minerals and Soil: II. Elucidation of Rate-limiting Steps. Soil Sci. Soc. Am. J. 1986, 50, 1162–1166. [Google Scholar] [CrossRef]
  71. Ogwada, R.A.; Sparks, D.L. A Critical Evaluation on the Use of Kinetics for Determining Thermodynamics of Ion Exchange in Soils. Soil Sci. Soc. Am. J. 1986, 50, 300–305. [Google Scholar] [CrossRef] [Green Version]
  72. Sparks, D.L. Kinetics of ionic reactions in clay minerals and soils. Adv. Agron. 1986, 38, 231–266. [Google Scholar] [CrossRef]
  73. McDowell, R.; Sharpley, A. Phosphorus solubility and release kinetics as a function of soil test P concentration. Geoderma 2003, 112, 143–154. [Google Scholar] [CrossRef]
  74. Vadas, P.A.; Krogstad, T.; Sharpley, A.N. Modeling phosphorus transfer between labile and nonlabile soil pools: Updating the EPIC model. Soil Sci. Soc. Am. J. 2006, 70, 736–743. [Google Scholar] [CrossRef]
  75. Akhtar, M.S.; Richards, B.K.; Medrano, P.A.; DeGroot, M.; Steenhuis, T.S. Dissolved phosphorus from undisturbed soil cores: Related to adsorption strength, flow rate, or soil structure? Soil Sci. Soc. Am. J. 2003, 67, 458–470. [Google Scholar] [CrossRef]
  76. Sharpley, A.N. The effect of storm interval on the transport of soluble phosphorus in runoff. J. Environ. Qual. 1980, 9, 575–578. [Google Scholar] [CrossRef]
  77. Essington, M.E. Soil and Water Chemistry: An Integrative Approach, 2nd ed.; CRC Press: Boca Raton, FL, USA, 2015. [Google Scholar]
  78. Curtin, D.; Beare, M.H.; Hernandez-Ramirez, G. Temperature and moisture effects on microbial biomass and soil organic matter mineralization. Soil Sci. Soc. Am. J. 2012, 76, 2055–2067. [Google Scholar] [CrossRef]
  79. Schott, J.; Pokrovsky, O.; Oelkers, E. The link between mineral dissolution/precipitation kinetics and solution chemistry. Rev. Miner. Geochem. 2009, 70, 207–258. [Google Scholar] [CrossRef]
  80. Barrow, N.J. On the reversibility of phosphate sorption by soils. Eur. J. Soil Sci. 1983, 34, 751–758. [Google Scholar] [CrossRef]
  81. Penn, C.J.; Rutter, E.B.; Arnall, D.B.; Camberato, J.; Williams, M.; Watkins, P. A Discussion on Mehlich-3 Phosphorus Extraction from the Perspective of Governing Chemical Reactions and Phases: Impact of Soil pH. Agriculture 2018, 8, 106. [Google Scholar] [CrossRef] [Green Version]
  82. Sharpley, A.N. Effect of Soil Properties on the Kinetics of Phosphorus Desorption. Soil Sci. Soc. Am. J. 1983, 47, 462–467. [Google Scholar] [CrossRef]
  83. Sharpley, A.N. Depth of Surface Soil-runoff Interaction as Affected by Rainfall, Soil Slope, and Management. Soil Sci. Soc. Am. J. 1985, 49, 1010–1015. [Google Scholar] [CrossRef] [Green Version]
  84. Ahuja, L.R.; Sharpley, A.N.; Yamamoto, M.; Menzel, R.G. The depth of rainfall-runoff-soil interaction as determined by 32 P. Water Resour. Res. 1981, 17, 969–974. [Google Scholar] [CrossRef]
  85. Ahuja, L.R.; Sharpley, A.N.; Lehman, O.R. Effect of Soil Slope and Rainfall Characteristics on Phosphorus in Runoff. J. Environ. Qual. 1982, 11, 9–13. [Google Scholar] [CrossRef]
  86. Vadas, P.A.; Sims, J.T.; Leytem, A.B.; Penn, C.J. Modifying FHANTM 2.0 to Estimate phosphorus concentrations in runoff from mid-atlantic coastal plain soils. Soil Sci. Soc. Am. J. 2002, 66, 1974–1980. [Google Scholar] [CrossRef]
  87. Williams, M.R.; McAfee, S.J. Water storage, mixing, and fluxes in tile-drained agricultural fields inferred from stable water isotopes. J. Hydrol. 2021, 599, 126347. [Google Scholar] [CrossRef]
  88. King, K.W.; Williams, M.R.; Johnson, L.T.; Smith, D.R.; LaBarge, G.A.; Fausey, N.R. Phosphorus availability in western lake erie basin drainage waters: Legacy evidence across spatial scales. J. Environ. Qual. 2017, 46, 466–469. [Google Scholar] [CrossRef]
  89. Penn, C.; Livingston, S.; Shedekar, V.; King, K.; Williams, M. Performance of field-scale phosphorus removal structures uti-lizing steel slag for treatment of surface and subsurface drainage. Water 2020, 12, 443. [Google Scholar] [CrossRef] [Green Version]
  90. Kane, D.D.; Conroy, J.D.; Richards, R.P.; Baker, D.B.; Culver, D.A. Re-eutrophication of Lake Erie: Correlations between trib-utary nutrient loads and phytoplankton biomass. J. Great Lakes Res. 2014, 40, 496–501. [Google Scholar] [CrossRef]
  91. Barber, S.A. Soil Nutrient Bioavailability: A Mechanistic Approach; John Wiley & Sons: New York, NY, USA, 1995. [Google Scholar]
Figure 1. Schematic of flow-through soil phosphorus desorption apparatus.
Soilsystems 06 00006 g001
Figure 2. Phosphorus (P) desorbed with time as cumulative mg kg−1 soil and solution concentration using a standard batch test method with constant solution:soil ratio (1:1). Error bars = standard deviation. Since extraction ratio = 1:1 solution:soil, mg kg−1 = mg L−1.
Soilsystems 06 00006 g002
Figure 3. Phosphorus (P) desorption results from the batch hybrid test (variable volume and constant time). Phosphorus desorbed at several volumes and constant time corresponding to the flow-through contact time for fast (0.5 min) and slow (23 min) rates. Phosphorus desorption is expressed as solution concentration (a) and cumulative P desorbed (b). Error bars = standard deviation.
Soilsystems 06 00006 g003
Figure 4. Batch simulated flow-through phosphorus (P) desorption test (variable volume and variable time). Solution P concentrations shown as a function of time (a) and volume (b) corresponding to the flow-through cumulative time and volume for fast and slow flow rates. Phosphorus desorption additionally expressed per unit soil mass as a function of time (c) and volume (d). Error bars = standard deviation.
Soilsystems 06 00006 g004
Figure 5. Phosphorus (P) batch desorption reaction order test: constant volume and variable time. Desorbed P expressed as a function of time for five different solution:soil ratios. Value in parenthesis corresponding to each ratio is the initial slope (i.e., desorption rate, mg kg−1 min−1) prior to the “breakpoint” in which the slope decreased (p < 0.01). Error bars = standard deviation.
Soilsystems 06 00006 g005
Figure 6. Phosphorus (P) flow-through desorption as a function of cumulative volume (a,b) and time (c,d), expressed as discrete solution concentrations (a,c) and cumulative P release per kg soil (b,d) at fast and slow flow rates (25 and 0.5 cm h−1, respectively). Time on x-axis is time of flow. Inset in (c) is for the fast flow rate; arrows in that figure indicate the points in which a 48 h interruption of no-flow was initiated.
Soilsystems 06 00006 g006
Figure 7. Mean flow-through phosphorus (P) desorption compared to the batch simulated flow-through (variable cumulative time and volume) and batch hybrid test (variable volume and constant discrete time), as a function of cumulative volume for the slow (a) and fast (b) flow rates. Flow-through solution P concentrations are flow-weighted to allow for comparison to batch methods. Error bars = standard deviation. Grey lines indicate upper and lower end of standard deviation for flow-through desorption.
Soilsystems 06 00006 g007
Figure 8. Mean cumulative phosphorus (P) desorption for flow-through compared to the batch simulated flow-through (variable cumulative time and volume), as a function of cumulative flow time for the slow (a) and fast (b) flow rates. Enlarged circles indicate “breakpoint” where slope significantly (p < 0.001) decreases for flow-through P desorption. Error bars on batch flow-through simulation indicate standard deviation. Grey lines indicate upper and lower end of standard deviation for flow-through desorption.
Soilsystems 06 00006 g008
Figure 9. Changes in phosphorus (P) desorption rate over three interruption tests where flow was ceased through the cell for 48 h, followed by re-start. Accompanying diagrams illustrate the change in less-labile (P in biomass, inner-sphere, and poorly-soluble minerals) and labile P (outer-sphere and highly-soluble minerals) with regard to their ability to replenish the solution P pool at the beginning (A, A1, A2, A3) and end (B, B1, B2, B3) of flow interruption. Arrow size indicates relative ability or rate of replenishment of labile pool by low-labile pool (kLL-L), low-labile pool to solution (kLL-S), and labile pool to solution (kL-S).
Soilsystems 06 00006 g009
Table 1. Characterization of the Blount soil used in flow-through and batch experiments. DPSM3 and DPSOx: degree of phosphorus (P) saturation based on molar ratio of Mehlich-3 and ammonium oxalate extractable P: Al + Fe.
ParameterUnitsValue
Bulk densityg cm−30.95
Total carbong kg−119.6
Total nitrogeng kg−12.1
Sand%24.9
Silt%64.6
Clay%9.5
Electrical conductivityµS cm−1358
pH 6.13
Water extractable Pmg kg−1, mg L−110.2, 1.02
Mehlich-3 Pmg kg−1342
Mehlich-3 Camg kg−13140
Mehlich-3 Almg kg−1693
Mehlich-3 Femg kg−1319
DPSM3%35.1
POxmg kg−11803
AlOxmg kg−11347
FeOxmg kg−15860
DPSOx%37.6
Publisher’s Note: MDPI stays neutral with regard to jurisdictional claims in published maps and institutional affiliations.

